
Modelling Extended Lactations in Polish Holstein–Friesian Cows


Abstract
:Simple Summary
Abstract
1. Introduction
2. Materials and Methods
- 1.
- The Wilmink [11] model (WIL) fitted to the records from the whole lactationwhere:
- t —day in milk (DIM);
- —parameters to be fitted;
- —milk, fat, protein or lactose yield, or urea content in milk at DIM t.
- 2.
- Wilmink model (WIL305) fitted to TD records from 5 to 305 DIM in lactation and:
- (a)
- Linear function (LIN) fitted to TD records from 306 to 400 DIM in lactation, assuming that at least one TD record beyond 305 DIM occurred. To fit LIN, the last TD record before 305 DIM and all TD records beyond 305 DIM were used;
- (b)
- Squared function (SQRT) fitted to TD records from 306 to 400 DIM in lactation. In this case, at least two TD records beyond 305 DIM were required. To fit SQRT, the last TD record before 305 DIM and all TD records beyond 305 DIM were used.
- 1.
- Mean Error (ME );
- 2.
- Mean Squared Error (MSE );
- 3.
- Mean Absolute Error (MAE );
- 4.
- Pearson’s correlation (R) between the measured () and estimated () milk yields;
- 5.
- Quotient between the error sum of squares and the observed sum of squares (Q ), with lower values indicating closer similarity between the true () and estimated () values.
3. Results
4. Discussion
5. Conclusions
Author Contributions
Funding
Institutional Review Board Statement
Informed Consent Statement
Data Availability Statement
Conflicts of Interest
References
- Macciotta, N.P.P.; Dimauro, C.; Rassu, S.P.G.; Steri, R.; Pulina, G. The mathematical description of lactation curves in dairy cattle. Ital. J. Anim. Sci. 2011, 10, e51. [Google Scholar] [CrossRef] [Green Version]
- Macciotta, N.P.P.; Vicario, D.; Cappio-Borlino, A. Detection of different shapes of lactation curve for milk yield in dairy cattle by empirical mathematical models. J. Dairy Sci. 2005, 88, 1178–1191. [Google Scholar] [CrossRef] [Green Version]
- Olori, V.E.; Brotherstone, S.; Hill, W.G.; McGuirk, B.J. Fit of standard models of the lactation curve to weekly records of milk production of cows in a single herd. Livest. Prod. Sci. 1999, 58, 55–63. [Google Scholar] [CrossRef]
- Vargas, B.; Koops, W.J.; Herrero, M.; Van Arendonk, J.A. Modeling extended lactations of dairy cows. J. Dairy Sci. 2000, 83, 1371–1380. [Google Scholar] [CrossRef] [Green Version]
- Druet, T.; Jaffrezic, F.; Boichard, D.; Ducrocq, V. Modeling lactation curves and estimation of genetic parameters for first lactation test-day records of French Holstein cows. J. Dairy Sci. 2003, 86, 2480–2490. [Google Scholar] [CrossRef] [Green Version]
- Silvestre, A.M.; Petim-Batista, F.; Colaco, J. The accuracy of seven mathematical functions in modeling dairy cattle lactation curves based on test-day records from varying sample schemes. J. Dairy Sci. 2006, 89, 1813–1821. [Google Scholar] [CrossRef] [Green Version]
- Dematawewa, C.M.B.; Pearson, R.E.; VanRaden, P.M. Modeling extended lactations of Holsteins. J. Dairy Sci. 2007, 90, 3924–3936. [Google Scholar] [CrossRef] [PubMed]
- Otwinowska-Mindur, A.; Ptak, E.; Jagusiak, W.; Satoła, A. Modeling lactation curves of Polish Holstein-Friesian cows. Part I: The accuracy of five lactation curve models. J. Anim. Feed Sci. 2013, 22, 19–25. [Google Scholar] [CrossRef]
- Lopez, S.; France, J.; Odongo, N.E.; McBride, R.A.; Kebreab, E.; AlZahl, O.; McBride, B.W.; Dijkstra, J. On the analysis of Canadian Holstein dairy cow lactation curves using standard growth functions. J. Dairy Sci. 2015, 98, 2701–2712. [Google Scholar] [CrossRef] [PubMed] [Green Version]
- Wood, P.D.P. Algebraic model of the lactation curve in cattle. Nature 1967, 216, 164–165. [Google Scholar] [CrossRef]
- Wilmink, J.B.M. Adjustment of test-day milk, fat and protein yield for age, season and stage of lactation. Livest. Prod. Sci. 1987, 16, 335–348. [Google Scholar] [CrossRef]
- Ali, T.E.; Schaeffer, L.R. Accounting for covariances among test day milk yields in dairy cows. Can. J. Anim. Sci. 1987, 67, 637–644. [Google Scholar] [CrossRef]
- Steri, R.; Dimauro, C.; Canavesi, F.; Nicolazzi, E.L.; Macciotta, N.P.P. Analysis of lactation shapes in extended lactations. Animal 2012, 67, 1572–1582. [Google Scholar] [CrossRef]
- Quinn, N.; Killen, L.; Buckley, F. Modelling fat and protein concentration curves for Irish dairy cows. Irish J. Agric. Food Res. 2006, 45, 13–23. [Google Scholar]
- Otwinowska-Mindur, A.; Ptak, E.; Jagusiak, W.; Satoła, A. Modeling lactation curves of Polish Holstein-Friesian cows. Part II: Prediction of 305-d lactation milk, fat and protein yields. J. Anim. Feed Sci. 2014, 23, 29–36. [Google Scholar] [CrossRef]
- Otwinowska-Mindur, A.; Ptak, E. Factors affecting the shape of lactation curves in Polish Holstein-Friesian cows. Anim. Sci. Pap. Rep. 2016, 34, 373–386. [Google Scholar]
- Guo, Z.; Swalve, H.H. Modeling of lactation curve as a sub-model in the evaluation of test day records. Interbull Bull. 1995, 11, 4–7. [Google Scholar]
- Kirkpatrick, M.; Lofsvold, D.; Bulmer, M. Analysis of inheritance, selection and evolution of growth trajectories. Genetics 1990, 124, 979–993. [Google Scholar] [CrossRef]
- VanRaden, P.M.; Dematawewa, C.M.B.; Pearson, R.E.; Tooker, M.E. Productive life including all lactations and longer lactations with diminishing credits. J. Dairy Sci. 2006, 89, 3213–3220. [Google Scholar] [CrossRef]
- Grossman, M.; Koops, W.J. Modeling extended lactation curves of dairy cattle: A biological basis for the multiphasic approach. J. Dairy Sci. 2003, 86, 988–998. [Google Scholar] [CrossRef]
- Rook, A.J.; France, J.; Dhanoa, M.S. On the mathematical description of lactation curves. J. Agric. Sci. 1993, 121, 97–102. [Google Scholar] [CrossRef]
- Dijkstra, J.; France, J.; Dhanoa, M.S.; Maas, J.A.; Hanigan, M.D.; Rook, A.S.; Beever, D.E. A model to describe growth patterns of the mammary gland during pregnancy and lactation. J. Dairy Sci. 1997, 80, 2340–2354. [Google Scholar] [CrossRef]
- Python Software Foundation. Python Language Reference, Version 3.8. Available online: http://www.python.org (accessed on 11 January 2021).
- Harris, C.R.; Millman, K.J.; van der Walt, S.J.; Gommers, R.; Virtanen, P.; Cournapeau, D.; Wieser, E.; Taylor, J.; Berg, S.; Oliphant, T.E.; et al. Array programming with NumPy. Nature 2020, 585, 357–362. [Google Scholar] [CrossRef]
- Virtanen, P.; Gommers, R.; Oliphant, T.E.; Haberland, M.; Reddy, T.; Cournapeau, D.; Burovski, E.; Peterson, P.; Weckesser, W.; Bright, J.; et al. SciPy 1.0. Fundamental Algorithms for Scientific Computing in Python. Nat. Methods 2020, 17, 261–272. [Google Scholar] [CrossRef] [Green Version]
- Silvestre, A.; Martins, A.; Santos, V.; Ginja, M.; Colaço, J. Lactation curves for milk, fat and protein in dairy cows: A full approach. Livest. Sci. 2009, 122, 308–313. [Google Scholar] [CrossRef]
- Miglior, F.; Sewalem, A.; Jamrozik, J.; Bohmanova, J.; Lefebvre, D.M.; Moore, R.K. Genetic analysis of milk urea nitrogen and lactose and their relationships with other production traits in Canadian Holstein cattle. J. Dairy Sci. 2007, 90, 2468–2479. [Google Scholar] [CrossRef] [PubMed]
- Cole, J.B.; Null, D.J.; VanRaden, P.M. Best prediction of yields for long lactations. J. Dairy Sci. 2009, 92, 1796–1810. [Google Scholar] [CrossRef] [PubMed] [Green Version]
- Yamazaki, T.; Takeda, H.; Nishiura, A.; Togashi, K. Relationship between the lactation curve and udder disease incidence in different lactation stages in first-lactation Holstein cows. Anim. Sci. J. 2009, 80, 636–643. [Google Scholar] [CrossRef] [PubMed]
- Green, M.J.; Green, L.E.; Schukken, Y.H.; Bradley, A.J.; Peeler, E.J.; Barkema, H.W.; de Haas, Y.; Collis, V.J.; Medley, G.F. Somatic cell count distributions during lactation predict clinical mastitis. J. Dairy Sci. 2004, 87, 1256–1264. [Google Scholar] [CrossRef]
- Kopec, T.; Chlàdek, G.; Falta, D.; Kučera, J.; Večeřa, M.; Hanuš, O. The effect of extended lactation on parameters of Wood’s model of lactation curve in dairy Simmental cows. Anim. Biosci. 2021, 34, 949–956. [Google Scholar] [CrossRef]
- Sehested, J.; Gaillard, C.; Lehman, J.O.; Maciel, G.M.; Vestergaard, M.; Weisbjerg, M.R.; Mogensen, L.; Larsen, L.B.; Poulsen, N.A.; Kristensen, T. Review: Extended lactation in dairy cattle. Animal 2019, 13 (Suppl. 1), 65–75. [Google Scholar] [CrossRef] [Green Version]
- Knight, C.H. Extended lactation: Turning theory into reality. Adv. Dairy Technol. 2005, 17, 113–123. [Google Scholar]
- Sorensen, A.; Muir, D.D.; Knight, C.H. Extended lactation in dairy cows: Effects of milking frequency, calving season and nutrition on lactation persistency and milk quality. J. Dairy Res. 2008, 75, 90–97. [Google Scholar] [CrossRef] [PubMed] [Green Version]
- Roemer, A. Investigations on longevity in German Holstein cows. Zuchtungskunde 2011, 83, 8–20. [Google Scholar]
- Bates, A.J.; Dohoo, I. Risk factors for peri-parturient farmer diagnosed mastitis in New Zealand dairy herds: Findings from a retrospective cohort study. Prev. Vet. Med. 2016, 127, 70–76. [Google Scholar] [CrossRef]
- Rajala-Schultz, P.J.; Hogan, J.S.; Smith, K.L. Short communication: Association between milk yield at dry-off and probability of intramammary infections at calving. J. Dairy Sci. 2005, 88, 577–579. [Google Scholar] [CrossRef]
- Cole, J.B.; Null, D.J. Genetic evaluation of lactation persistency for five breeds of dairy cattle. J. Dairy Sci. 2009, 92, 2248–2258. [Google Scholar] [CrossRef] [Green Version]
- Niozas, G.; Tsousis, G.; Steinhöfel, I.; Brozos, C.; Römer, A.; Wiedemann, S.; Bollwein, H.; Kaske, M. Extended lactation in high-yielding dairy cows. I. Effects on reproductive measurements. J. Dairy Sci. 2019, 102, 799–810. [Google Scholar] [CrossRef] [Green Version]
- Niozas, G.; Tsousis, G.; Malesios, C.; Steinhofel, I.; Boscos, C.; Bollwein, H.; Kaske, M. Extended lactation in high-yielding dairy cows. II. Effect on milk production, udder health, and body measurements. J. Dairy Sci. 2019, 102, 811–823. [Google Scholar] [CrossRef] [PubMed] [Green Version]
- Auldist, M.J.; O’Brien, G.; Cole, D.; Macmillan, K.L.; Grainger, C. Effects of varying lactation length on milk production capacity of cows in pasture-based dairying systems. J. Dairy Sci. 2007, 90, 3234–3241. [Google Scholar] [CrossRef] [PubMed]
- Kolver, E.S.; Roche, J.R.; Burke, C.R.; Kay, J.K.; Aspin, P.W. Extending lactation in pasture-based dairy cows: I. Genotype and diet effect on milk and reproduction. J. Dairy Sci. 2007, 90, 5518–5530. [Google Scholar] [CrossRef]
- Otwinowska-Mindur, A.; Ptak, E. Genetic analysis of lactation persistency in the Polish Holstein-Friesian cows. Anim. Sci. Pap. Rep. 2015, 33, 109–117. [Google Scholar]
- Bouallegue, M.; M’hamdi, N.; Ben Hamouda, M.; Haddad, B. Study of non-genetic factors on the shape of lactation curves for milk yield, fat and protein percents of Holstein-Friesian cows under hot Mediterranean climate. Arch. Zootech. 2014, 17, 55–75. [Google Scholar]
- Lee, M.; Lee, S.; Park, J.; Seo, S. Clustering and characterization of the lactation curves of dairy cows using K-Medoids clustering algorithm. Animals 2020, 10, 1348. [Google Scholar] [CrossRef] [PubMed]
- Græsbøll, K.; Kirkeby, C.; Nielsen, S.S.; Halasa, T.; Toft, N.; Christiansen, L.E. Models to estimate lactation curves of milk yield and somatic cell count in dairy cows at the herd level for the use in simulations and predictive models. Front. Vet. Sci. 2016, 19, 1–10. [Google Scholar] [CrossRef] [Green Version]
- Tekerli, M.; Akinci, Z.; Dogan, I.; Akcan, A. Factors affecting the shape of lactation curves of Holstein cows from the Balikesir Province of Turkey. J. Dairy Sci. 2000, 83, 1381–1386. [Google Scholar] [CrossRef]
- Atashi, H.; Moradi Sharbabak, M.; Moradi Shahrbabak, H. Environmental factors affecting the shape components of the lactation curves in Holstein dairy cattle of Iran. Livest. Res. Rural. Dev. 2009, 2, 4–66. [Google Scholar]


| Number of | Milk (kg) | Fat (kg) | Protein (kg) | Lactose (kg) | Urea (mg/L) | |||||||
|---|---|---|---|---|---|---|---|---|---|---|---|---|
| Lactation | TD Records | Lactations | Mean | SD | Mean | SD | Mean | SD | Mean | SD | Mean | SD |
| 1 | 1,918,079 | 247,729 | 24.24 | 7.77 | 0.97 | 0.30 | 0.81 | 0.25 | 1.19 | 0.39 | 219.66 | 86.08 |
| 2 | 1,253,570 | 193,902 | 26.70 | 10.00 | 1.08 | 0.39 | 0.90 | 0.31 | 1.28 | 0.50 | 218.87 | 86.68 |
| 3 | 1,298,760 | 127,590 | 27.57 | 10.45 | 1.12 | 0.42 | 0.92 | 0.32 | 1.31 | 0.52 | 216.09 | 86.35 |
| 4–6 | 1,918,079 | 133,609 | 26.77 | 10.26 | 1.10 | 0.42 | 0.89 | 0.31 | 1.26 | 0.51 | 212.32 | 85.89 |
| Total | 6,955,768 | 702,830 | 25.99 | 9.50 | 1.05 | 0.38 | 0.87 | 0.29 | 1.25 | 0.47 | 217.43 | 86.30 |
| Parameter | ||
|---|---|---|
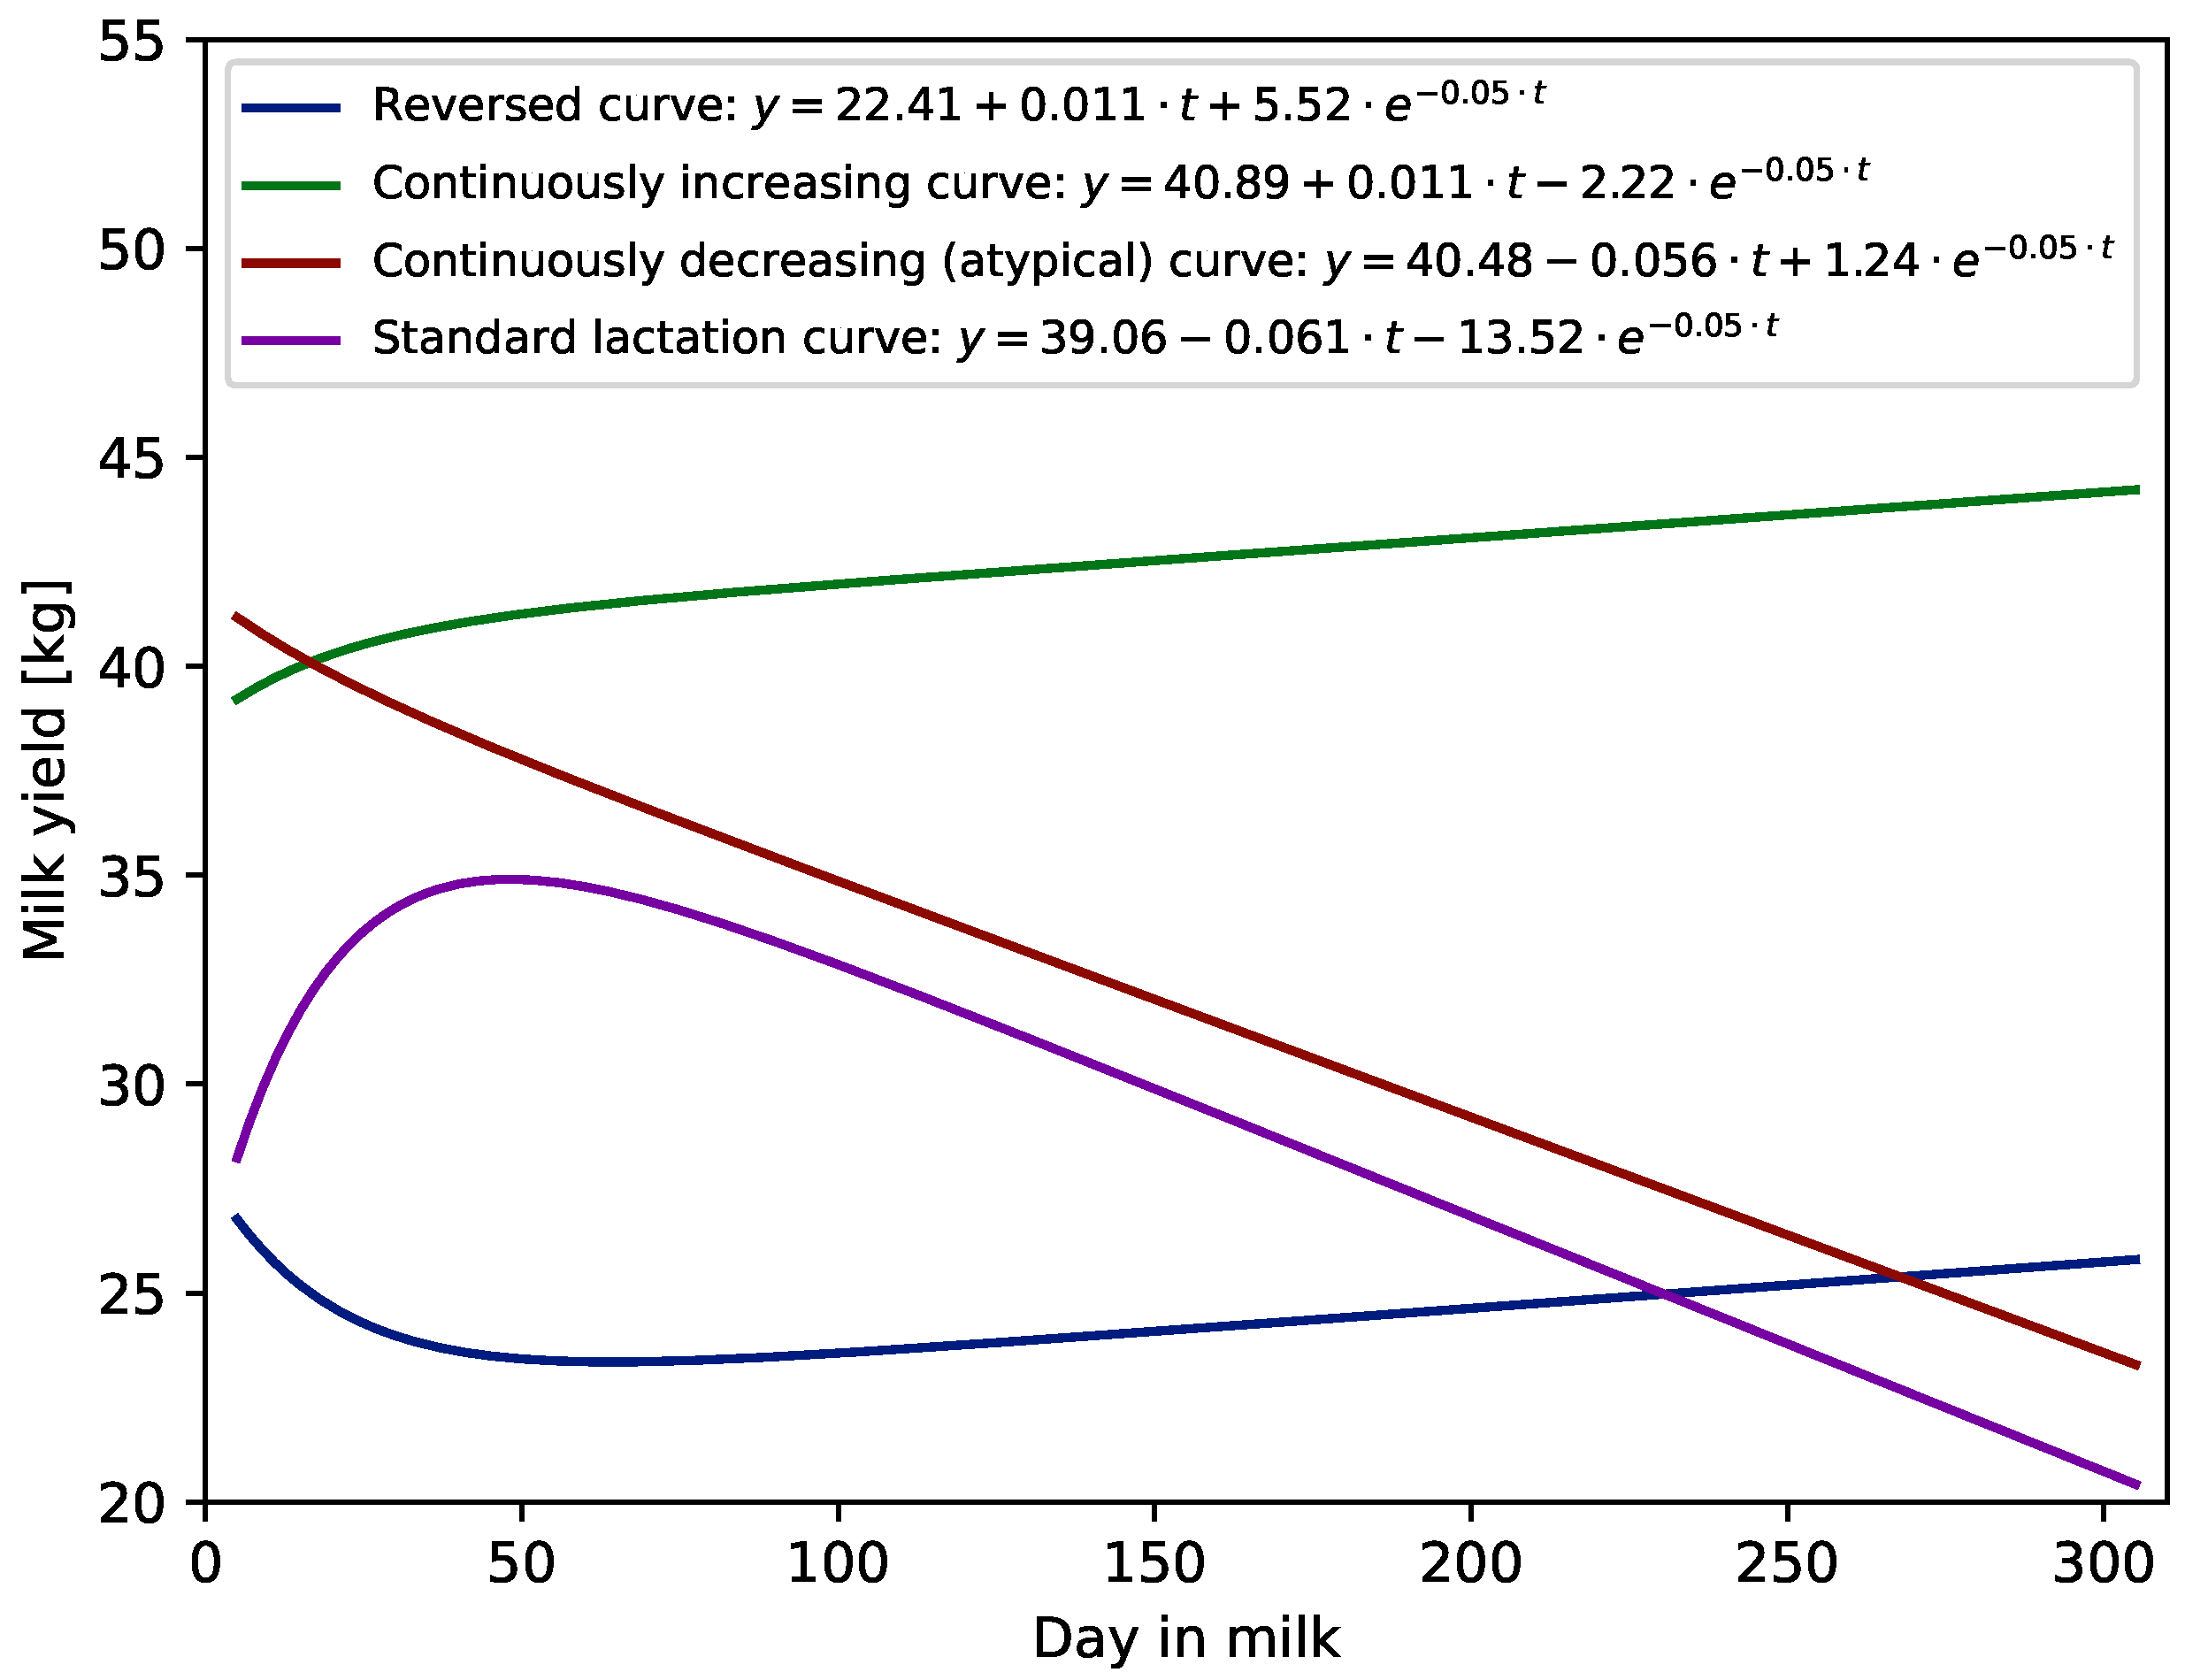
| Curve Shape | b | c |
| Standard lactation curve | <0 | <0 |
| Reversed curve | >0 | >0 |
| Continuously increasing curve | >0 | <0 |
| Continuously decreasing (atypical) curve | <0 | >0 |
| No. of TD | |||||||
|---|---|---|---|---|---|---|---|
| Trait | Function | Records | ME | MSE | MAE | R | Q e |
| Milk (kg) | WIL | 6,133,988 | 5.3 × 10 | 8.41 | 2.06 | 0.950 | 1.03 |
| WIL305 | 6,133,988 | −2.18 × 10 | 7.63 | 1.95 | 0.955 | 0.93 | |
| Fat (kg) | WIL | 6,104,472 | 2.90 × 10 | 0.024 | 0.106 | 0.913 | 1.796 |
| WIL305 | 6,104,472 | −1.92 × 10 | 0.022 | 0.101 | 0.919 | 1.669 | |
| Protein (kg) | WIL | 6,104,679 | 3.44 × 10 | 0.010 | 0.072 | 0.938 | 1.140 |
| WIL305 | 6,104,679 | 9.78 × 10 | 0.009 | 0.068 | 0.945 | 1.020 | |
| Lactose (kg) | WIL | 6,104,668 | 1.87 × 10 | 0.020 | 0.102 | 0.951 | 1.068 |
| WIL305 | 6,104,668 | −4.32 × 10 | 0.019 | 0.096 | 0.956 | 0.969 | |
| Urea (mg/L) | WIL | 6,091,233 | 0.308 | 2544.67 | 36.93 | 0.813 | 4.64 |
| WIL305 | 6,091,233 | −1.84 × 10 | 2339.26 | 35.40 | 0.829 | 4.27 |
| No. of | ||||||||
|---|---|---|---|---|---|---|---|---|
| Function | Curve Shape | Lactations | TD Records | ME | MSE | MAE | R | Q e |
| WIL | Standard lactation curve | 459,499 | 4,039,702 | 0.0730 | 8.68 | 2.10 | 0.95 | 0.97 |
| Continuously decreasing (atypical) curve | 221,172 | 1,908,990 | 0.0108 | 7.78 | 1.98 | 0.95 | 1.15 | |
| Reversed curve | 17,399 | 144,244 | 0.0366 | 9.12 | 2.09 | 0.91 | 1.61 | |
| Continuously increasing curve | 4760 | 41,052 | 0.0940 | 9.45 | 2.12 | 0.93 | 1.27 | |
| WIL305 | Standard lactation curve | 441,583 | 3,878,838 | −1.86 × 10 | 7.85 | 1.99 | 0.96 | 0.88 |
| Continuously decreasing (atypical) curve | 222,451 | 1,922,683 | −4.12 × 10 | 7.02 | 1.87 | 0.95 | 1.01 | |
| Reversed curve | 29,743 | 252,491 | 8.67 × 10 | 8.72 | 2.04 | 0.92 | 1.42 | |
| Continuously increasing curve | 9053 | 79,976 | −5.38 × 10 | 8.56 | 2.04 | 0.93 | 1.04 | |
| No. of TD | |||||||
|---|---|---|---|---|---|---|---|
| Trait | Function | Records | ME | MSE | MAE | R | Q e |
| Milk (kg) | WIL | 821,780 | −0.40 | 9.57 | 2.28 | 0.89 | 2.62 |
| LIN | 821,780 | 0.10 | 3.67 | 1.23 | 0.96 | 1.00 | |
| SQRT | 673,332 | −0.01 | 1.83 | 0.75 | 0.98 | 0.49 | |
| Fat (kg) | WIL | 818,006 | −0.0217 | 0.022 | 0.109 | 0.86 | 2.99 |
| LIN | 818,006 | 0.0046 | 0.009 | 0.062 | 0.94 | 1.29 | |
| SQRT | 669,376 | −0.0005 | 0.005 | 0.039 | 0.97 | 0.66 | |
| Protein (kg) | WIL | 818,061 | −0.0257 | 0.013 | 0.086 | 0.88 | 2.61 |
| LIN | 818,061 | 0.0037 | 0.005 | 0.047 | 0.95 | 1.01 | |
| SQRT | 669,427 | −0.0005 | 0.003 | 0.028 | 0.98 | 0.49 | |
| Lactose (kg) | WIL | 818,061 | −0.0140 | 0.023 | 0.111 | 0.89 | 2.75 |
| LIN | 818,061 | 0.0050 | 0.009 | 0.060 | 0.96 | 1.05 | |
| SQRT | 669,427 | −0.0006 | 0.004 | 0.036 | 0.98 | 0.50 | |
| Urea (mg/L) | WIL | 816,018 | −2.30 | 2769.30 | 40.19 | 0.78 | 5.10 |
| LIN | 816,018 | −0.24 | 1417.32 | 25.33 | 0.90 | 2.61 | |
| SQRT | 667,270 | 0.03 | 792.30 | 16.49 | 0.94 | 1.46 |
| Function | No. of TD Records Per Cow beyond 305 DIM | No. of TD Records | ME | MSE | MAE | R | Q e |
|---|---|---|---|---|---|---|---|
| WIL e | 1 | 148,448 | −1.279 | 10.991 | 2.462 | 0.887 | 3.374 |
| 2 | 226,912 | −0.540 | 9.402 | 2.254 | 0.889 | 2.636 | |
| 3 | 240,288 | −0.138 | 9.122 | 2.231 | 0.891 | 2.426 | |
| 4 | 172,264 | 0.087 | 9.099 | 2.221 | 0.891 | 2.361 | |
| 5 | 33,670 | 0.171 | 9.945 | 2.322 | 0.891 | 2.451 | |
| 6 | 198 | −0.056 | 7.730 | 2.096 | 0.914 | 2.226 | |
| LIN | 1 | 148,448 | 0.000 | 0.000 | 0.000 | 1.000 | 0.000 |
| 2 | 226,912 | 0.100 | 3.426 | 1.281 | 0.960 | 0.961 | |
| 3 | 240,288 | 0.133 | 4.573 | 1.548 | 0.947 | 1.216 | |
| 4 | 172,264 | 0.126 | 5.343 | 1.681 | 0.938 | 1.387 | |
| 5 | 33,670 | 0.133 | 6.367 | 1.838 | 0.932 | 1.569 | |
| 6 | 198 | 0.069 | 4.291 | 1.612 | 0.953 | 1.236 | |
| SQRT | 2 | 226,912 | 0.000 | 0.000 | 0.000 | 1.000 | 0.000 |
| 3 | 240,288 | −0.009 | 2.224 | 1.010 | 0.974 | 0.591 | |
| 4 | 172,264 | −0.023 | 3.250 | 1.257 | 0.963 | 0.843 | |
| 5 | 33,670 | −0.033 | 4.155 | 1.451 | 0.956 | 1.024 | |
| 6 | 198 | 0.018 | 3.141 | 1.368 | 0.966 | 0.905 |
Publisher’s Note: MDPI stays neutral with regard to jurisdictional claims in published maps and institutional affiliations. |
© 2021 by the authors. Licensee MDPI, Basel, Switzerland. This article is an open access article distributed under the terms and conditions of the Creative Commons Attribution (CC BY) license (https://creativecommons.org/licenses/by/4.0/).
Share and Cite
Otwinowska-Mindur, A.; Ptak, E.; Makulska, J.; Jarnecka, O. Modelling Extended Lactations in Polish Holstein–Friesian Cows. Animals 2021, 11, 2176. https://doi.org/10.3390/ani11082176
Otwinowska-Mindur A, Ptak E, Makulska J, Jarnecka O. Modelling Extended Lactations in Polish Holstein–Friesian Cows. Animals. 2021; 11(8):2176. https://doi.org/10.3390/ani11082176
Chicago/Turabian StyleOtwinowska-Mindur, Agnieszka, Ewa Ptak, Joanna Makulska, and Olga Jarnecka. 2021. "Modelling Extended Lactations in Polish Holstein–Friesian Cows" Animals 11, no. 8: 2176. https://doi.org/10.3390/ani11082176
APA StyleOtwinowska-Mindur, A., Ptak, E., Makulska, J., & Jarnecka, O. (2021). Modelling Extended Lactations in Polish Holstein–Friesian Cows. Animals, 11(8), 2176. https://doi.org/10.3390/ani11082176