
Dose–Response Effects of 3-Nitrooxypropanol Combined with Low- and High-Concentrate Feed Proportions in the Dairy Cow Ration on Fermentation Parameters in a Rumen Simulation Technique

 , , , and
Abstract
Simple Summary
Abstract
1. Introduction
2. Materials and Methods
2.1. Experimental Design and Diets
2.2. Experimental Procedure
2.3. Sampling and Analyses
2.4. Calculations and Statistical Analyses
3. Results
3.1. Diet Composition and Substrate Degradability
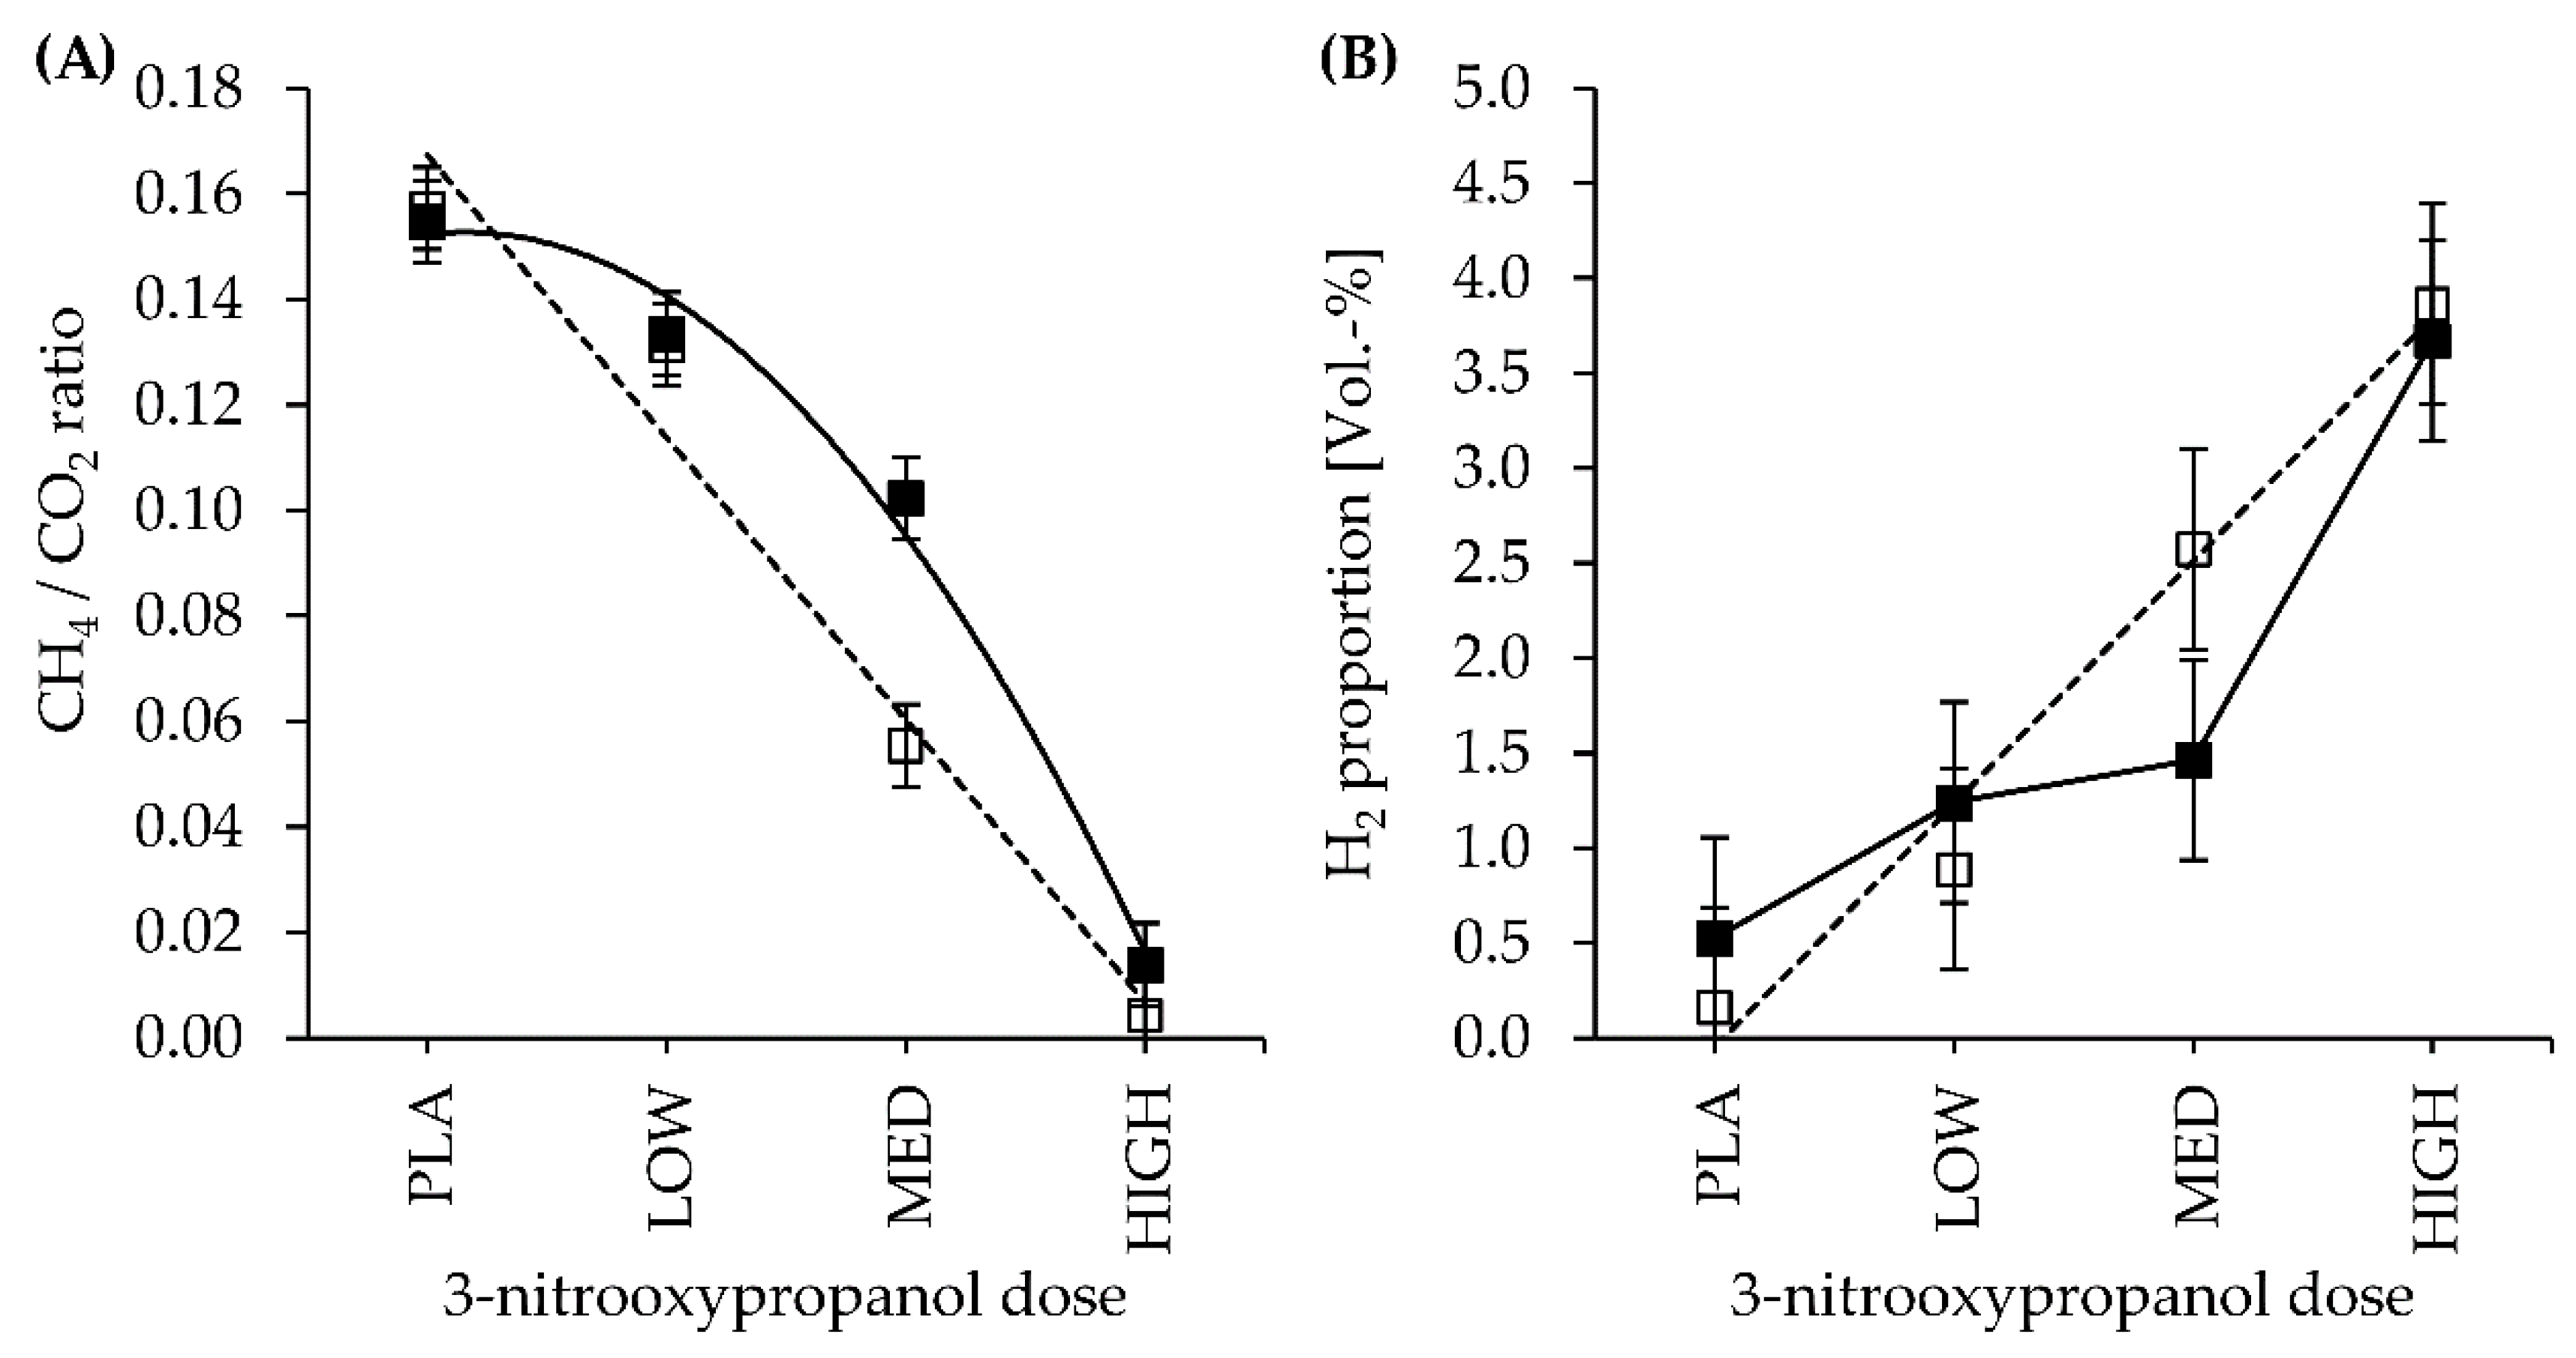
3.2. Gas Production and Gas Composition
3.3. Fermentation Parameters and End-Products
4. Discussion
4.1. 3-NOP Dosage Level
4.2. Effects of the Diet Substrate and 3-NOP on Fermentation Parameters
5. Conclusions
Author Contributions
Funding
Institutional Review Board Statement
Data Availability Statement
Acknowledgments
Conflicts of Interest
References
- IPCC, Intergovernmental Panel on Climate Change. Climate Change 2013: The Physical Science Basis. Contribution of Working Group I to the Fifth Assessment Report of the Intergovernmental Panel on Climate Change; Cambridge University Press: Cambridge, UK; New York, NY, USA, 2014; p. 1535. [Google Scholar]
- Gerber, P.J.; Steinfeld, H.; Henderson, B.; Mottet, A.; Opio, C.; Dijkman, J.; Falcucci, A.; Tempio, G. Tackling Climate Change through Livestock: A Global Assessment of Emissions and Mitigation Opportunities; Food and Agriculture Organization of the United Nations (FAO): Rome, Italy, 2013; ISBN 9789251079201. [Google Scholar]
- Hristov, A.N.; Oh, J.; Lee, C.; Meinen, R.; Montes, F.; Ott, T.; Firkins, J.; Rotz, A.; Dell, C.; Adesogan, A.; et al. Mitigation of greenhouse gas emissions in livestock production: A review of technical options for non-CO2 emissions. In FAO Animal Production and Health; Gerber, P.J., Henderson, B., Makkar, H.P.S., Eds.; FAO: Rome, Italy, 2013; Volume 177. [Google Scholar]
- Czerkawski, J.W.; Breckenridge, G. Design and development of a long-term rumen simulation technique (Rusitec). Br. J. Nutr. 1977, 38, 371–384. [Google Scholar] [CrossRef] [PubMed]
- Duin, E.C.; Wagner, T.; Shima, S.; Prakash, D.; Cronin, B.; Yanez-Ruiz, D.R.; Duval, S.; Rumbeli, R.; Stemmler, R.T.; Thauer, R.K.; et al. Mode of action uncovered for the specific reduction of methane emissions from ruminants by the small molecule 3-nitrooxypropanol. Proc. Natl. Acad. Sci. USA 2016, 113, 6172–6177. [Google Scholar] [CrossRef] [PubMed]
- Beauchemin, K.A.; Kreuzer, M.; O’Mara, F.; McAllister, T.A. Nutritional management for enteric methane abatement: A review. Aust. J. Exp. Agric. 2008, 48, 21–27. [Google Scholar] [CrossRef]
- Hook, S.E.; Steele, M.A.; Northwood, K.S.; Wright, A.D.; McBride, B.W. Impact of high-concentrate feeding and low ruminal pH on methanogens and protozoa in the rumen of dairy cows. Microb. Ecol. 2011, 62, 94–105. [Google Scholar] [CrossRef]
- Lana, R.P.; Russell, J.B.; Van Amburgh, M.E. The role of pH in regulating ruminal methane and ammonia production. J. Anim. Sci. 1998, 76, 2190–2196. [Google Scholar] [CrossRef]
- McAllister, T.; Newbold, C.J. Redirecting rumen fermentation to reduce methanogenesis. Aust. J. Exp. Agric. 2008, 48, 7–13. [Google Scholar] [CrossRef]
- Romero-Pérez, A.; Okine, E.K.; Guan, L.L.; Duval, S.M.; Kindermann, M.; Beauchemin, K.A. Effects of 3-nitrooxypropanol on methane production using the rumen simulation technique (Rusitec). Anim. Feed Sci. Technol. 2015, 209, 98–109. [Google Scholar] [CrossRef]
- Dijkstra, J.; Bannink, A.; France, J.; Kebreab, E.; van Gastelen, S. Short communication: Antimethanogenic effects of 3-nitrooxypropanol depend on supplementation dose, dietary fiber content, and cattle type. J. Dairy Sci. 2018, 101, 9041–9047. [Google Scholar] [CrossRef]
- Melgar, A.; Welter, K.C.; Nedelkov, K.; Martins, C.M.M.R.; Harper, M.T.; Oh, J.; Räisänen, S.E.; Chen, X.; Cueva, S.F.; Duval, S.; et al. Dose-response effect of 3-nitrooxypropanol on enteric methane emissions in dairy cows. J. Dairy Sci. 2020, 103, 6145–6156. [Google Scholar] [CrossRef]
- Vyas, D.; McGinn, S.M.; Duval, S.M.; Kindermann, M.K.; Beauchemin, K.A. Optimal dose of 3-nitrooxypropanol for decreasing enteric methane emissions from beef cattle fed high-forage and high-grain diets. Anim. Prod. Sci. 2016, 58, 1049–1055. [Google Scholar] [CrossRef]
- Romero-Pérez, A.; Okine, E.K.; Guan, L.L.; Duval, S.M.; Kindermann, M.; Beauchemin, K.A. Effects of 3-nitrooxypropanol and monensin on methane production using a forage-based diet in Rusitec fermenters. Anim. Feed Sci. Technol. 2016, 220, 67–72. [Google Scholar] [CrossRef]
- Romero-Pérez, A.; Okine, E.K.; Guan, L.L.; Duval, S.M.; Kindermann, M.; Beauchemin, K.A. Rapid Communication: Evaluation of methane inhibitor 3-nitrooxypropanol and monensin in a high-grain diet using the rumen simulation technique (Rusitec). J. Anim. Sci. 2017, 95, 4072–4077. [Google Scholar] [CrossRef]
- Schilde, M.; von Soosten, D.; Hüther, L.; Meyer, U.; Zeyner, A.; Dänicke, S. Effects of 3-nitrooxypropanol and varying concentrate feed proportions in the ration on methane emission, rumen fermentation and performance of periparturient dairy cows. Arch. Anim. Nutr. 2021, 75, 79–104. [Google Scholar] [CrossRef] [PubMed]
- Geishauser, T. An instrument for collection and transfer of ruminal fluid and for administration of water soluble drugs in adult cattle. Bov. Pract. 1993, 27, 38–42. [Google Scholar] [CrossRef]
- McDougall, E.I. Studies on ruminant saliva. 1. The composition and output of sheep’s saliva. Biochem. J. 1948, 43, 99–109. [Google Scholar] [CrossRef]
- VDLUFA. Bd. III Die chemische Untersuchung von Futtermitteln. In Handbuch der Landwirtschaftlichen Versuchs-Und Untersuchungsmethodik (VDLUFA-Methodenbuch); VDLUFA-Verlag: Darmstadt, Germany, 2006. [Google Scholar]
- Geissler, C.; Hoffmann, M.; Hiokel, B. Ein Beitrag zur gaschromatographischen Bestimmung flüchtiger Fettsäuren. Arch. Anim. Nutr. 1976, 26, 123–129. [Google Scholar] [CrossRef]
- Anonymous. DIN 38406-E5-2. Deutsche Einheitsverfahren zur Wasser-, Abwasser- und Schlammuntersuchung; 40. Lieferung; Wiley-VCH GmbH und Beuth GmbH: Weinheim und Berlin, Germany, 1998; p. 8834. [Google Scholar]
- Littell, R.C.; Henry, P.R.; Ammerman, C.B. Statistical analysis of repeated measures data using SAS procedures. J. Anim. Sci. 1998, 76, 1216–1231. [Google Scholar] [CrossRef]
- Guyader, J.; Ungerfeld, E.M.; Beauchemin, K.A. Redirection of Metabolic Hydrogen by Inhibiting Methanogenesis in the Rumen Simulation Technique (RUSITEC). Front. Microbiol. 2017, 8, 393. [Google Scholar] [CrossRef]
- Haisan, J.; Sun, Y.; Guan, L.; Beauchemin, K.A.; Iwaasa, A.; Duval, S.; Kindermann, M.; Barreda, D.R.; Oba, M. The effects of feeding 3-nitrooxypropanol at two doses on milk production, rumen fermentation, plasma metabolites, nutrient digestibility, and methane emissions in lactating Holstein cows. Anim. Prod. Sci. 2017, 57, 282–289. [Google Scholar] [CrossRef]
- Reynolds, C.K.; Humphries, D.J.; Kirton, P.; Kindermann, M.; Duval, S.; Steinberg, W. Effects of 3-nitrooxypropanol on methane emission, digestion, and energy and nitrogen balance of lactating dairy cows. J. Dairy Sci. 2014, 97, 3777–3789. [Google Scholar] [CrossRef]
- Vyas, D.; McGinn, S.M.; Duval, S.M.; Kindermann, M.; Beauchemin, K.A. Effects of sustained reduction of enteric methane emissions with dietary supplementation of 3-nitrooxypropanol on growth performance of growing and finishing beef cattle. J. Anim. Sci. 2016, 94, 2024–2034. [Google Scholar] [CrossRef]
- Keim, J.P.; Alvarado-Gilis, C.; Arias, R.A.; Gandarillas, M.; Cabanilla, J. Evaluation of sources of variation on in vitro fermentation kinetics of feedstuffs in a gas production system. Anim. Sci. J. 2017, 88, 1547–1555. [Google Scholar] [CrossRef]
- Menke, K.H.; Raab, L.; Salewski, A.; Steingass, H.; Fritz, D.; Schneider, W. The estimation of the digestibility and metabolizable energy content of ruminant feedingstuffs from the gas production when they are incubated with rumen liquor in vitro. J. Agric. Sci. 1979, 93, 217–222. [Google Scholar] [CrossRef]
- Whitford, M.F.; Teather, R.M.; Forster, R.J. Phylogenetic analysis of methanogens from the bovine rumen. BMC Microbiol. 2001, 1, 1–5. [Google Scholar] [CrossRef]
- Pitta, D.W.; Melgar, A.; Hristov, A.N.; Indugu, N.; Narayan, K.S.; Pappalardo, C.; Hennessy, M.L.; Vecchiarelli, B.; Kaplan-Shabtai, V.; Kindermann, M.; et al. Temporal changes in total and metabolically active ruminal methanogens in dairy cows supplemented with 3-nitrooxypropanol. J. Dairy Sci. 2021. [Google Scholar] [CrossRef]
- Zhang, X.M.; Gruninger, R.J.; Alemu, A.W.; Wang, M.; Tan, Z.L.; Kindermann, M.; Beauchemin, K.A. 3-Nitrooxypropanol supplementation had little effect on fiber degradation and microbial colonization of forage particles when evaluated using the in situ ruminal incubation technique. J. Dairy Sci. 2020, 103, 8986–8997. [Google Scholar] [CrossRef]
- Van Kessel, J.A.S.; Russell, J.B. The effect of pH on ruminal methanogenesis. FEMS Microbiol. Ecol. 1996, 20, 205–210. [Google Scholar] [CrossRef]
- Aguerre, M.J.; Wattiaux, M.A.; Powell, J.M.; Broderick, G.A.; Arndt, C. Effect of forage-to-concentrate ratio in dairy cow diets on emission of methane, carbon dioxide, and ammonia, lactation performance, and manure excretion. J. Dairy Sci. 2011, 94, 3081–3093. [Google Scholar] [CrossRef] [PubMed]
- Dijkstra, J.; van Gastelen, S.; Dieho, K.; Nichols, K.; Bannink, A. Review: Rumen sensors: Data and interpretation for key rumen metabolic processes. Animal 2020, 14, 176–186. [Google Scholar] [CrossRef] [PubMed]
- Barry, T.N.; Thompson, A.; Armstrong, D.G. Rumen fermentation studies on two contrasting diets: 1. Some characteristics of the in vivo fermentation, with special reference to the composition of the gas phase, oxidation/reduction state and volatile fatty acid proportions. J. Agric. Sci. 1977, 89, 183–195. [Google Scholar] [CrossRef]
- Huang, Y.; Marden, J.P.; Julien, C.; Bayourthe, C. Redox potential: An intrinsic parameter of the rumen environment. J. Anim. Physiol. Anim. Nutr. 2018, 102, 393–402. [Google Scholar] [CrossRef]
- Jayanegara, A.; Sarwono, K.A.; Kondo, M.; Matsui, H.; Ridla, M.; Laconi, E.B.; Nahrowi. Use of 3-nitrooxypropanol as feed additive for mitigating enteric methane emissions from ruminants: A meta-analysis. Ital. J. Anim. Sci. 2018, 17, 650–656. [Google Scholar] [CrossRef]
- Prigge, E.C.; Stuthers, B.A.; Jacquemet, N.A. Influence of forage diets on ruminal particle size, passage of digesta, feed intake and digestibility by steers. J. Anim. Sci. 1990, 68, 4352–4360. [Google Scholar] [CrossRef][Green Version]
- Martinez, M.E.; Ranilla, M.J.; Ramos, S.; Tejido, M.L.; Carro, M.D. Effects of dilution rate and retention time of concentrate on efficiency of microbial growth, methane production, and ruminal fermentation in Rusitec fermenters. J. Dairy Sci. 2009, 92, 3930–3938. [Google Scholar] [CrossRef] [PubMed]
- Clauss, M.; Lechner, I.; Barboza, P.; Collins, W.; Tervoort, T.A.; Südekum, K.-H.; Codron, D.; Hummel, J. The effect of size and density on the mean retention time of particles in the reticulorumen of cattle (Bos primigenius f. taurus), muskoxen (Ovibos moschatus) and moose (Alces alces). Br. J. Nutr. 2011, 105, 634–644. [Google Scholar] [CrossRef]
- Ungerfeld, E.M. Shifts in metabolic hydrogen sinks in the methanogenesis-inhibited ruminal fermentation: A meta-analysis. Front. Microbiol. 2015, 6, 1–17. [Google Scholar] [CrossRef] [PubMed]
- Carro, M.D.; Lebzien, P.; Rohr, K. Influence of yeast culture on the in vitro fermentation (Rusitec) of diets containing variable portions of concentrates. Anim. Feed Sci. Technol. 1992, 37, 209–220. [Google Scholar] [CrossRef]
- Mansfield, H.R.; Endres, M.I.; Stern, M.D. Comparison of microbial fermentation in the rumen of dairy cows and dual flow continuous culture. Anim. Feed Sci. Technol. 1995, 55, 47–66. [Google Scholar] [CrossRef]
- Asanuma, N.; Iwamoto, M.; Hino, T. Effect of the Addition of Fumarate on Methane Production by Ruminal Microorganisms In Vitro. J. Dairy Sci. 1999, 82, 780–787. [Google Scholar] [CrossRef]


| Experimental Diet † | ||
|---|---|---|
| Item | LC | HC |
| Ingredients (g/kg of diet DM §) | ||
| Maize silage | 495 | 286 |
| Grass silage | 212 | 122 |
| Rapeseed meal | 44.4 | 90.1 |
| Soybean meal | 37.2 | 74.7 |
| Wheat | 97 | 195.5 |
| Dried sugar beet pulp | 85 | 172 |
| Soybean oil | 4.5 | 9.2 |
| Calcium carbonate | 7 | 14.2 |
| Urea | 2.9 | 6.1 |
| Vitamin/Mineral premix + | 15 | 30.2 |
| Chemical analysis of the ration | ||
| DM (g/kg) | 908 | 897 |
| Nutrient (g/kg of DM) | ||
| Organic matter | 923 | 938 |
| Crude protein | 131 | 171 |
| Ether extract | 33 | 33 |
| aNDFom ¶ | 382 | 308 |
| ADFom # | 217 | 178 |
| Starch | 257 | 284 |
| Item | Treatments † | SEM § | p-Values + | ||||||||||
|---|---|---|---|---|---|---|---|---|---|---|---|---|---|
| CFP | PLA | LOW | MED | HIGH | CFP | Dose | CFP × Dose | L | Q | ßL > F | ßQ > F | ||
| DMD | LC | 640 | 718 | 638 | 596 | 26 | 0.640 | 0.041 | 0.335 | 0.464 | 0.229 | 0.364 | 0.216 |
| HC | 655 | 687 | 627 | 658 | 0.703 | 0.743 | |||||||
| OMAD | LC | 643 | 723 | 642 | 601 | 26 | 0.654 | 0.052 | 0.254 | 0.395 | 0.170 | 0.275 | 0.136 |
| HC | 658 | 687 | 628 | 669 | 0.621 | 0.620 | |||||||
| NDFD | LC | 358 | 505 | 362 | 293 | 49 | 0.091 | 0.246 | 0.145 | 0.346 | 0.149 | 0.349 | 0.162 |
| HC | 310 | 319 | 288 | 350 | 0.699 | 0.585 | |||||||
| Item | Treatments † | SEM § | p-Values + | ||||||||||
|---|---|---|---|---|---|---|---|---|---|---|---|---|---|
| CFP | PLA | LOW | MED | HIGH | CFP | Dose | CFP × Dose | L | Q | ßL > F | ßQ > F | ||
| Total GP ¶ (mL/d) | LC | 1902 | 1904 | 1664 | 1818 | 18 | 0.506 | 0.600 | 0.978 | 0.411 | 0.479 | 0.823 | 0.732 |
| HC | 1844 | 1797 | 1648 | 1654 | 0.543 | 0.705 | |||||||
| Gas production (mL/g of DMD#) | |||||||||||||
| Total GP | LC | 1091 | 977 | 938 | 1152 | 110 | 0.494 | 0.711 | 0.698 | 0.181 | 0.121 | 0.423 | 0.272 |
| HC | 1042 | 970 | 982 | 944 | 0.703 | 0.825 | |||||||
| CH4 | LC | 15.8 | 12.2 | 5.2 | 0.5 | 1.2 | 0.419 | <0.001 | 0.241 | 0.001 | 0.145 | 0.028 | 0.045 |
| HC | 14.5 | 12.1 | 8.7 | 1.1 | 0.133 | 0.407 | |||||||
| CO2 | LC | 100.2 | 94.2 | 92.7 | 98.4 | 13.8 | 0.538 | 0.962 | 0.981 | 0.642 | 0.637 | 0.835 | 0.745 |
| HC | 93.4 | 94.1 | 86.6 | 86.8 | 0.812 | 0.907 | |||||||
| H2 | LC | 0.44 | 2.11 | 6.03 | 11.89 | 1.92 | 0.579 | 0.001 | 0.623 | 0.290 | 0.766 | 0.595 | 0.859 |
| HC | 1.42 | 3.21 | 3.80 | 8.96 | 0.749 | 0.584 | |||||||
| Gas composition (Vol.-%) | |||||||||||||
| CH4 | LC | 5.8 | 5.1 | 2.2 | 0.2 | 0.3 | 0.138 | <0.001 | 0.094 | 0.002 | 0.566 | 0.082 | 0.124 |
| HC | 5.5 | 5.0 | 3.6 | 0.5 | 0.241 | 0.119 | |||||||
| CO2 | LC | 36.6 | 38.5 | 39.6 | 33.5 | 1.9 | 0.567 | 0.430 | 0.302 | 0.146 | 0.066 | 0.173 | 0.086 |
| HC | 35.6 | 37.8 | 35.0 | 36.6 | 0.979 | 0.959 | |||||||
| H2 | LC | 0.2 | 0.9 | 2.6 | 3.9 | 0.5 | 0.755 | <0.001 | 0.458 | 0.046 | 0.579 | 0.233 | 0.307 |
| HC | 0.5 | 1.2 | 1.5 | 3.7 | 0.699 | 0.368 | |||||||
| CH4/CO2 | LC | 0.157 | 0.131 | 0.055 | 0.004 | 0.008 | 0.024 | <0.001 | 0.026 | <0.001 | 0.220 | 0.035 | 0.048 |
| HC | 0.155 | 0.133 | 0.102 | 0.014 | 0.177 | 0.082 | |||||||
| CO2/CH4 | LC | 6.4 | 7.8 | 18.9 | 915.6 | 193.2 | 0.185 | 0.036 | 0.179 | 0.398 | 0.066 | 0.592 | 0.238 |
| HC | 6.5 | 7.6 | 10.0 | 163.6 | 0.887 | 0.741 | |||||||
| CH4/H2 | LC | 39.45 | 5.84 | 0.86 | 0.04 | 2.65 | 0.002 | <0.001 | 0.001 | <0.001 | 0.001 | 0.001 | 0.002 |
| HC | 10.53 | 4.32 | 3.00 | 0.22 | 0.183 | 0.422 | |||||||
| Item | Treatments † | SEM § | p-Values + | ||||||||||
|---|---|---|---|---|---|---|---|---|---|---|---|---|---|
| CFP | PLA | LOW | MED | HIGH | CFP | Dose | CFP × Dose | L | Q | ßL > F | ßQ > F | ||
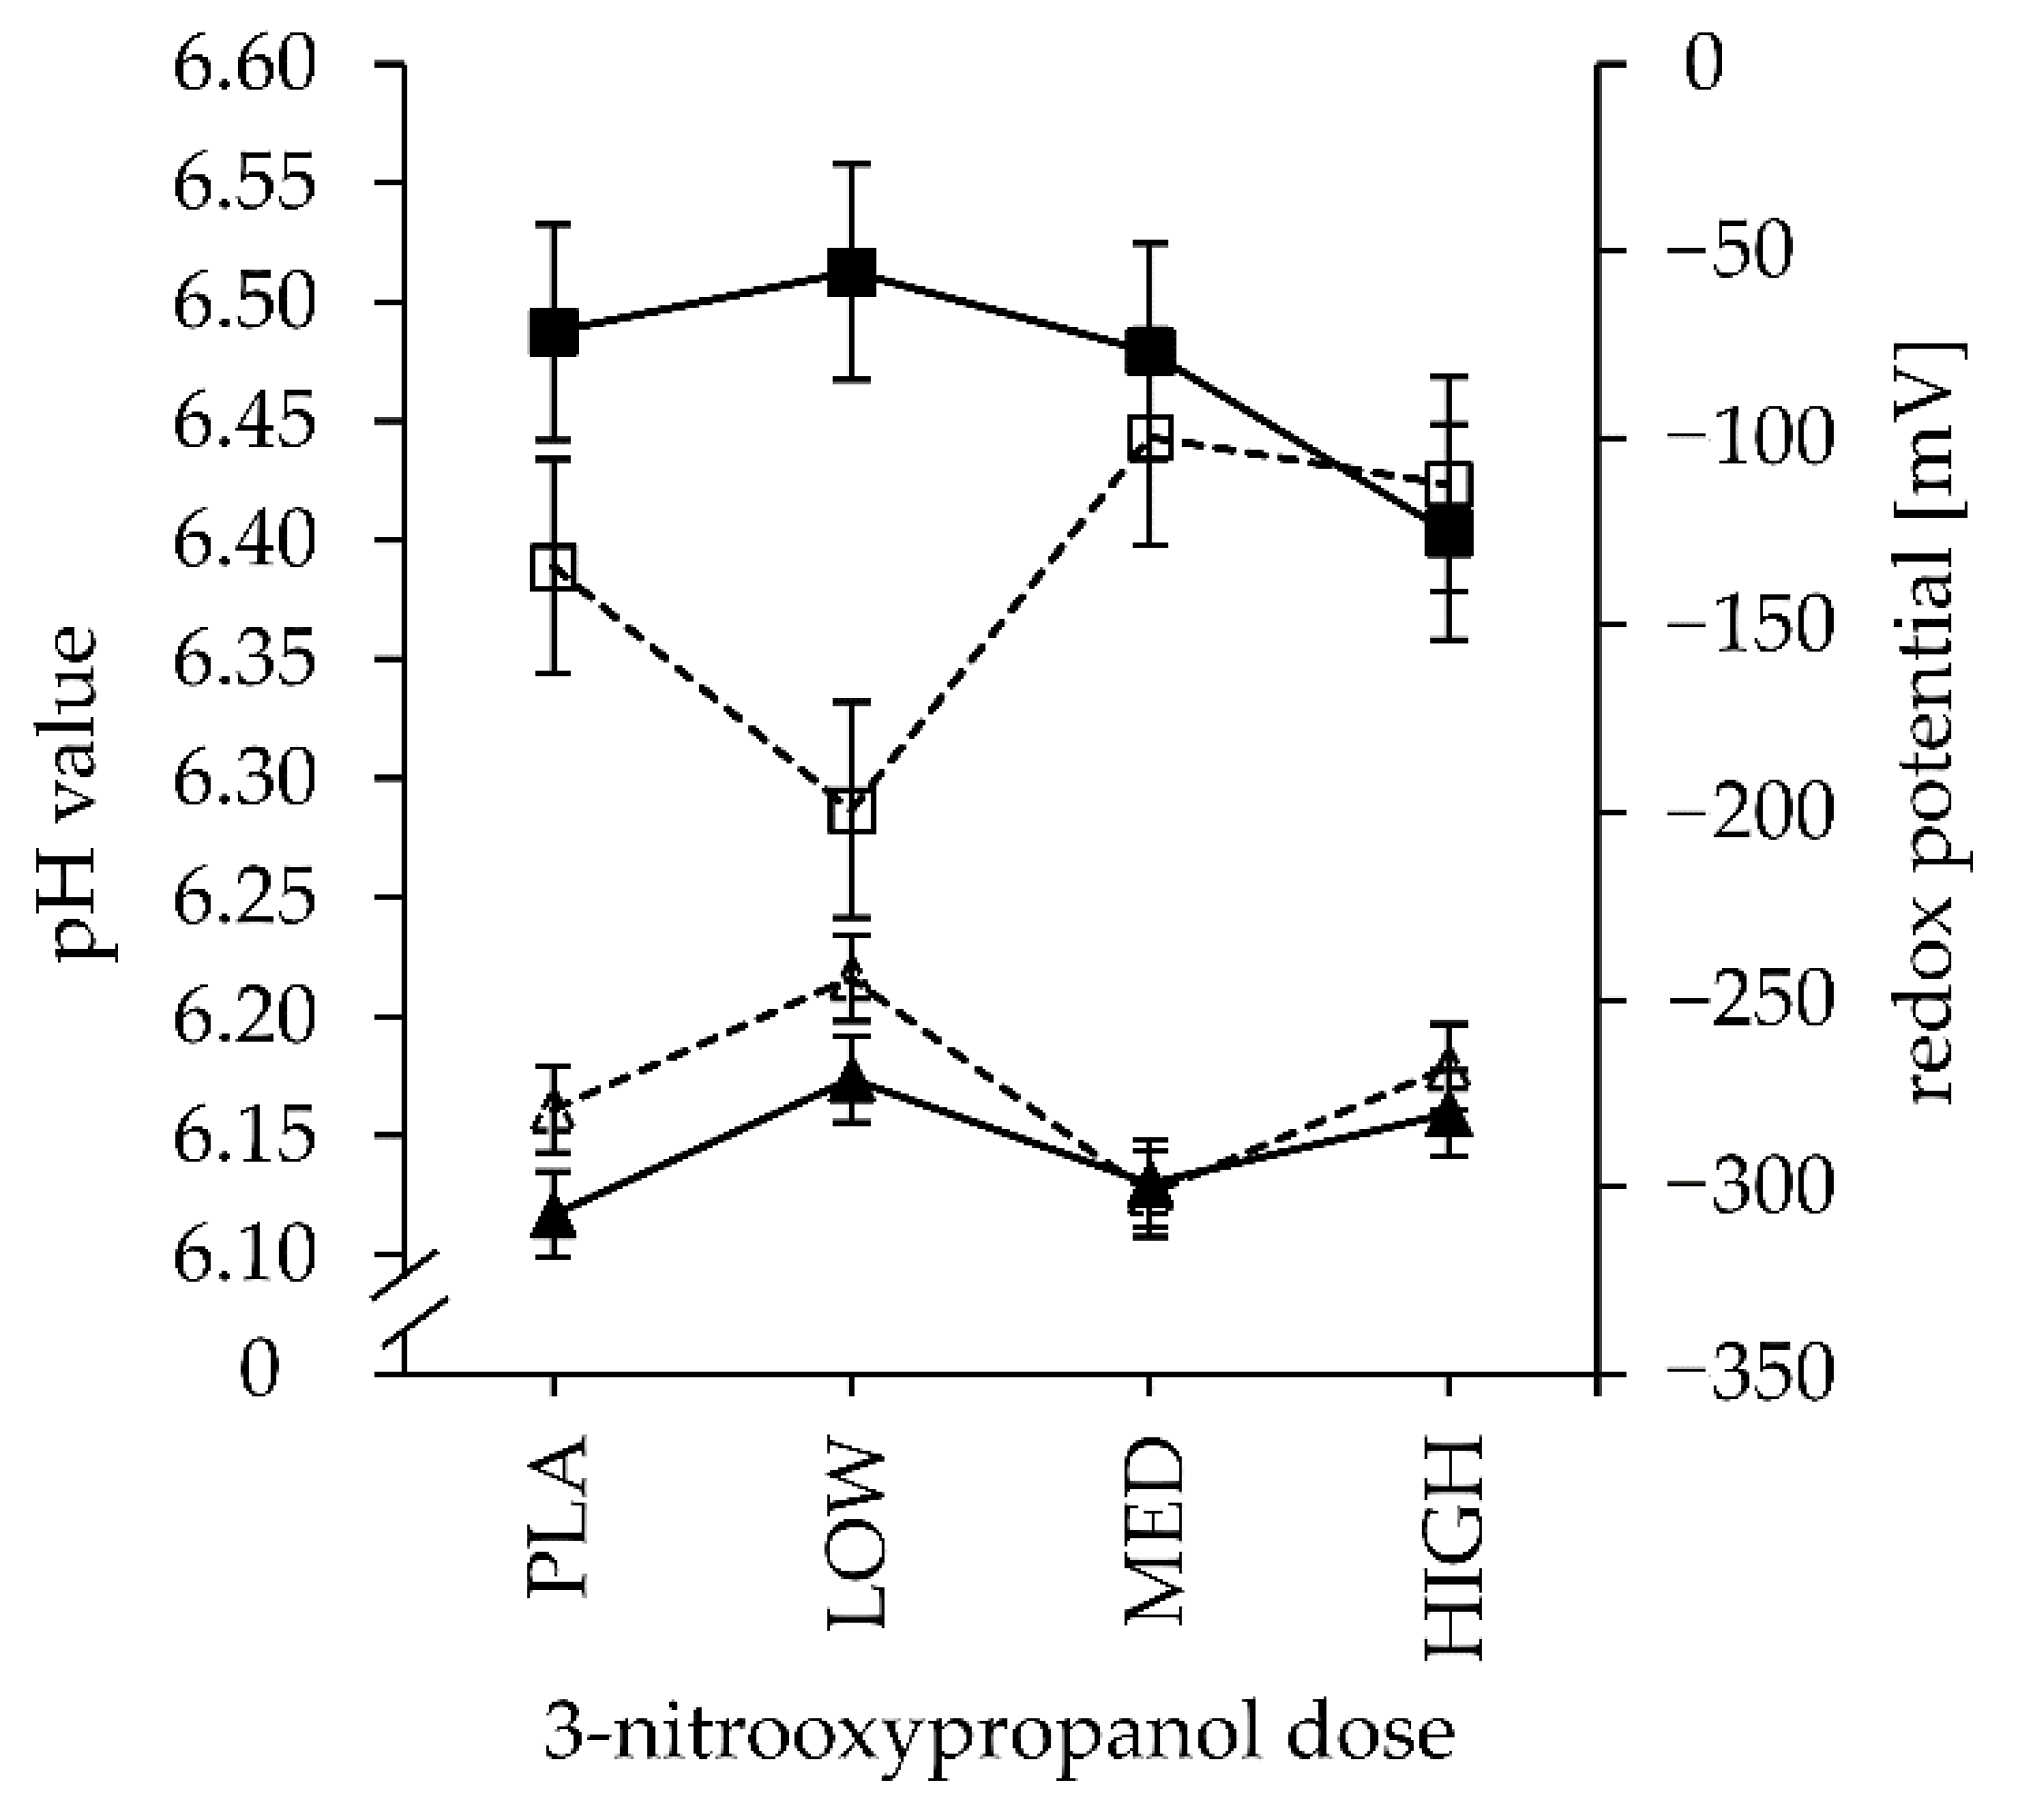
| pH | LC | 6.39 | 6.29 | 6.44 | 6.42 | 0.05 | 0.019 | 0.552 | 0.083 | 0.912 | 0.830 | 0.880 | 0.495 |
| HC | 6.49 | 6.51 | 6.48 | 6.40 | 0.753 | 0.470 | |||||||
| Eh (mV) ¶ | LC | −279 | −244 | −302 | −268 | 12 | 0.066 | 0.010 | 0.517 | 0.623 | 0.645 | 0.100 | 0.178 |
| HC | −308 | −271 | −299 | −281 | 0.621 | 0.745 | |||||||
| Effluent (mL/d) | LC | 656 | 588 | 650 | 655 | 25 | 0.950 | 0.789 | 0.065 | 0.442 | 0.328 | 0.433 | 0.361 |
| HC | 622 | 666 | 625 | 642 | 0.731 | 0.752 | |||||||
| NH3-N (mg/L) | LC | 157 | 165 | 136 | 142 | 8 | 0.009 | 0.006 | 0.499 | 0.344 | 0.611 | 0.187 | 0.125 |
| HC | 214 | 235 | 207 | 191 | 0.608 | 0.228 | |||||||
| NH3-N(mg/g DMD #) | LC | 14.9 | 12.4 | 12.5 | 14.7 | 1.1 | <0.001 | 0.861 | 0.081 | 0.065 | 0.049 | 0.040 | 0.020 |
| HC | 18.3 | 20.9 | 19.1 | 17.7 | 0.260 | 0.151 | |||||||
| Total VFA (mmol/L) | LC | 76.3 | 83.4 | 78.0 | 71.1 | 5.1 | 0.250 | 0.849 | 0.203 | 0.466 | 0.287 | 0.547 | 0.229 |
| HC | 69.0 | 70.6 | 71.3 | 80.5 | 0.955 | 0.587 | |||||||
| Fermentation pattern (mol % of VFA) | |||||||||||||
| Acetate | LC | 53.4 | 53.1 | 49.4 | 51.0 | 1.14 | 0.548 | 0.044 | 0.705 | 0.097 | 0.193 | 0.180 | 0.267 |
| HC | 51.4 | 52.3 | 49.8 | 50.7 | 0.594 | 0.730 | |||||||
| Propionate | LC | 17.9 | 18.4 | 18.1 | 13.8 | 0.73 | 0.326 | 0.012 | 0.029 | 0.197 | 0.017 | 0.683 | 0.135 |
| HC | 16.2 | 15.9 | 17.2 | 16.0 | 0.387 | 0.385 | |||||||
| Butyrate | LC | 13.6 | 13.5 | 15.5 | 15.3 | 1.13 | 0.190 | 0.864 | 0.281 | 0.414 | 0.629 | 0.495 | 0.988 |
| HC | 16.7 | 16.7 | 16.1 | 14.6 | 0.964 | 0.641 | |||||||
| Iso-butyrate | LC | 0.91 | 0.82 | 0.83 | 0.79 | 0.03 | 0.003 | <0.001 | 0.014 | 0.134 | 0.371 | 0.170 | 0.034 |
| HC | 0.98 | 1.00 | 0.92 | 0.74 | 0.821 | 0.052 | |||||||
| Valerate | LC | 4.9 | 4.3 | 5.8 | 4.5 | 0.39 | 0.122 | 0.005 | 0.255 | 0.238 | 0.209 | 0.772 | 0.872 |
| HC | 6.2 | 5.9 | 6.5 | 4.8 | 0.396 | 0.152 | |||||||
| Iso-valerate | LC | 9.3 | 9.8 | 10.4 | 14.7 | 0.83 | 0.044 | <0.001 | 0.893 | 0.828 | 0.102 | 0.797 | 0.867 |
| HC | 8.6 | 7.9 | 9.4 | 13.1 | 0.569 | 0.066 | |||||||
| C2/C3 ratio $ | LC | 3.03 | 2.92 | 2.77 | 3.80 | 0.18 | 0.832 | 0.011 | 0.032 | 0.068 | 0.008 | 0.414 | 0.090 |
| HC | 3.23 | 3.36 | 2.91 | 3.19 | 0.335 | 0.392 | |||||||
| VFA production (mmol/g of DMD) | |||||||||||||
| Total VFA | LC | 7.18 | 6.86 | 7.11 | 7.36 | 0.264 | 0.012 | 0.050 | 0.409 | 0.569 | 0.416 | 0.468 | 0.997 |
| HC | 6.22 | 6.26 | 6.56 | 7.32 | 0.927 | 0.418 | |||||||
| Acetate | LC | 3.85 | 3.64 | 3.52 | 3.73 | 0.131 | 0.004 | 0.105 | 0.143 | 0.079 | 0.090 | 0.194 | 0.583 |
| HC | 3.20 | 3.27 | 3.27 | 3.73 | 0.799 | 0.266 | |||||||
| Propionate | LC | 1.30 | 1.27 | 1.29 | 1.02 | 0.073 | 0.022 | 0.531 | 0.031 | 0.566 | 0.191 | 0.950 | 0.155 |
| HC | 1.02 | 1.00 | 1.14 | 1.19 | 0.604 | 0.997 | |||||||
| Butyrate | LC | 0.96 | 0.93 | 1.09 | 1.13 | 0.087 | 0.777 | 0.551 | 0.640 | 0.554 | 0.931 | 0.645 | 0.994 |
| HC | 1.04 | 1.05 | 1.05 | 1.05 | 0.898 | 0.925 | |||||||
| Iso-butyrate | LC | 0.065 | 0.060 | 0.059 | 0.058 | 0.003 | 0.421 | 0.134 | 0.605 | 0.198 | 0.384 | 0.149 | 0.126 |
| HC | 0.060 | 0.062 | 0.060 | 0.055 | 0.725 | 0.366 | |||||||
| Valerate | LC | 0.34 | 0.30 | 0.41 | 0.33 | 0.029 | 0.256 | 0.035 | 0.469 | 0.245 | 0.265 | 0.848 | 0.944 |
| HC | 0.39 | 0.38 | 0.42 | 0.35 | 0.346 | 0.232 | |||||||
| Iso-valerate | LC | 0.68 | 0.66 | 0.74 | 1.09 | 0.071 | 0.012 | <0.001 | 0.991 | 0.539 | 0.048 | 0.858 | 0.894 |
| HC | 0.52 | 0.49 | 0.62 | 0.95 | 0.716 | 0.069 | |||||||
Publisher’s Note: MDPI stays neutral with regard to jurisdictional claims in published maps and institutional affiliations. |
© 2021 by the authors. Licensee MDPI, Basel, Switzerland. This article is an open access article distributed under the terms and conditions of the Creative Commons Attribution (CC BY) license (https://creativecommons.org/licenses/by/4.0/).
Share and Cite
Schilde, M.; von Soosten, D.; Hüther, L.; Kersten, S.; Meyer, U.; Zeyner, A.; Dänicke, S. Dose–Response Effects of 3-Nitrooxypropanol Combined with Low- and High-Concentrate Feed Proportions in the Dairy Cow Ration on Fermentation Parameters in a Rumen Simulation Technique. Animals 2021, 11, 1784. https://doi.org/10.3390/ani11061784
Schilde M, von Soosten D, Hüther L, Kersten S, Meyer U, Zeyner A, Dänicke S. Dose–Response Effects of 3-Nitrooxypropanol Combined with Low- and High-Concentrate Feed Proportions in the Dairy Cow Ration on Fermentation Parameters in a Rumen Simulation Technique. Animals. 2021; 11(6):1784. https://doi.org/10.3390/ani11061784
Chicago/Turabian StyleSchilde, Matthias, Dirk von Soosten, Liane Hüther, Susanne Kersten, Ulrich Meyer, Annette Zeyner, and Sven Dänicke. 2021. "Dose–Response Effects of 3-Nitrooxypropanol Combined with Low- and High-Concentrate Feed Proportions in the Dairy Cow Ration on Fermentation Parameters in a Rumen Simulation Technique" Animals 11, no. 6: 1784. https://doi.org/10.3390/ani11061784
APA StyleSchilde, M., von Soosten, D., Hüther, L., Kersten, S., Meyer, U., Zeyner, A., & Dänicke, S. (2021). Dose–Response Effects of 3-Nitrooxypropanol Combined with Low- and High-Concentrate Feed Proportions in the Dairy Cow Ration on Fermentation Parameters in a Rumen Simulation Technique. Animals, 11(6), 1784. https://doi.org/10.3390/ani11061784