
Prepartum and Postpartum Feed Restrictions Affect Blood Metabolites and Hormones Reducing Colostrum and Milk Yields in Fat-Tailed Dairy Sheep

 ,
,  and
and 
Simple Summary
Abstract
1. Introduction
2. Materials and Methods
2.1. Animals and Management
2.2. DMI, BW, Colostrum Yield, and Milk Yield
2.3. Colostrum, Milk, and Blood Collection
2.4. Variables Measured in Colostrum and Milk
2.5. Variables Measured in Plasma
2.6. Statistical Analysis
3. Results
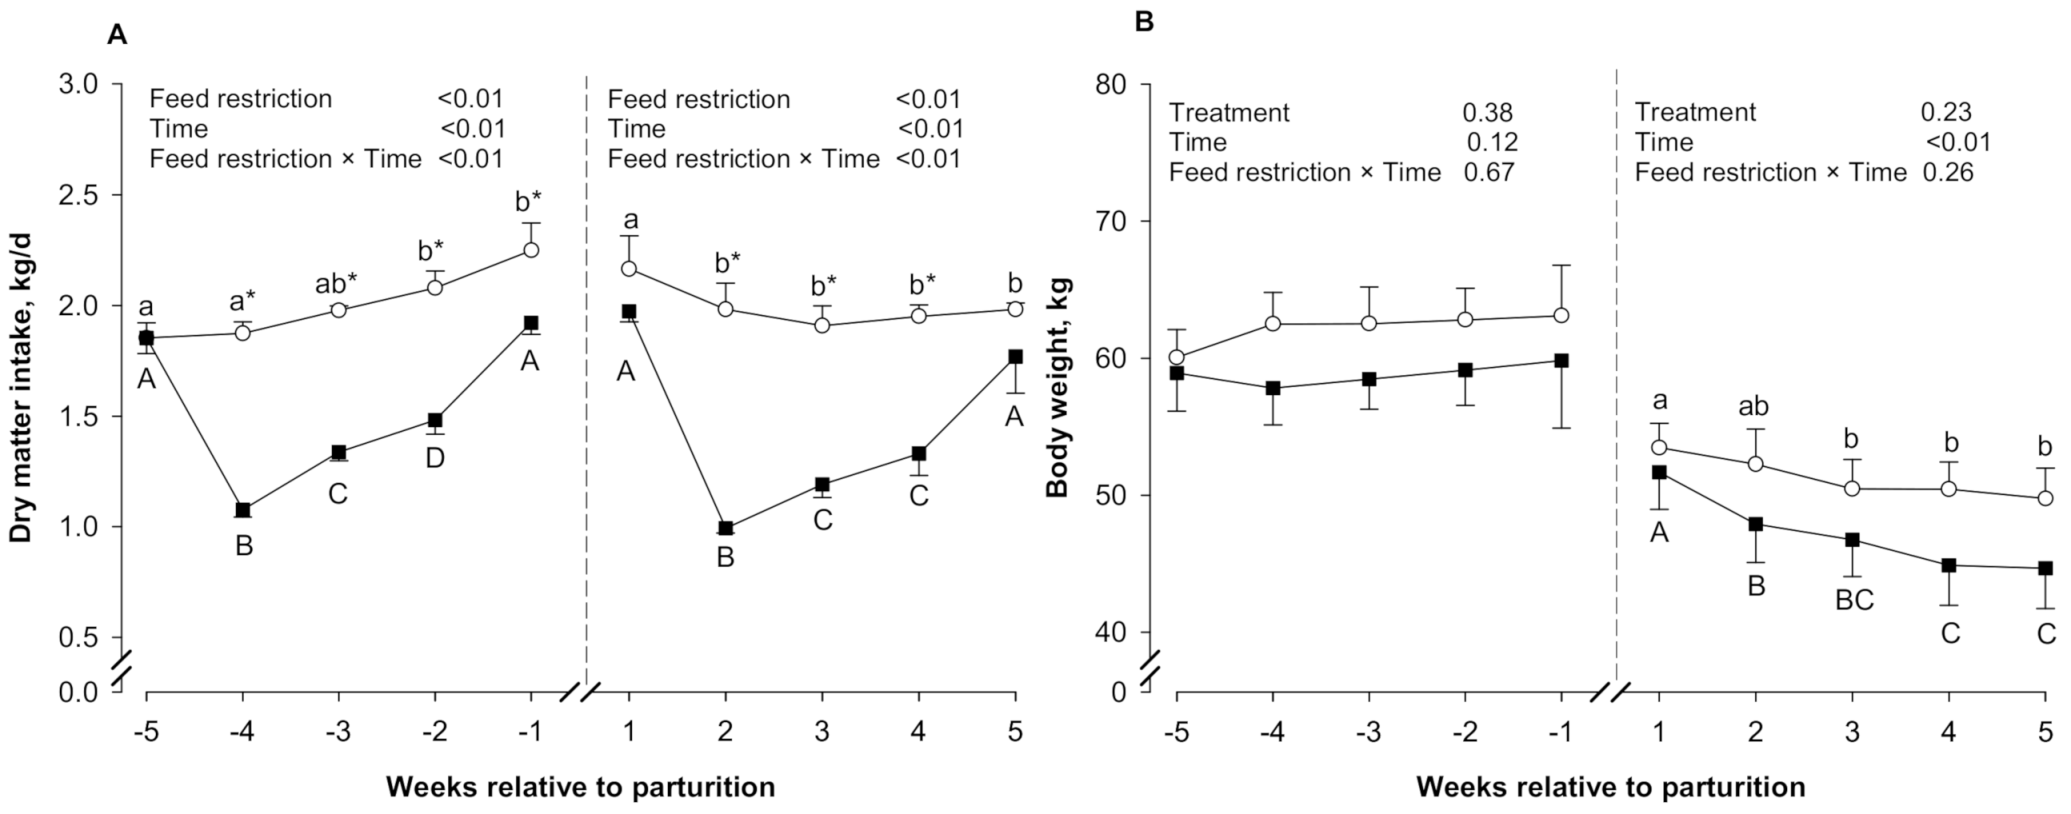
3.1. DMI and BW
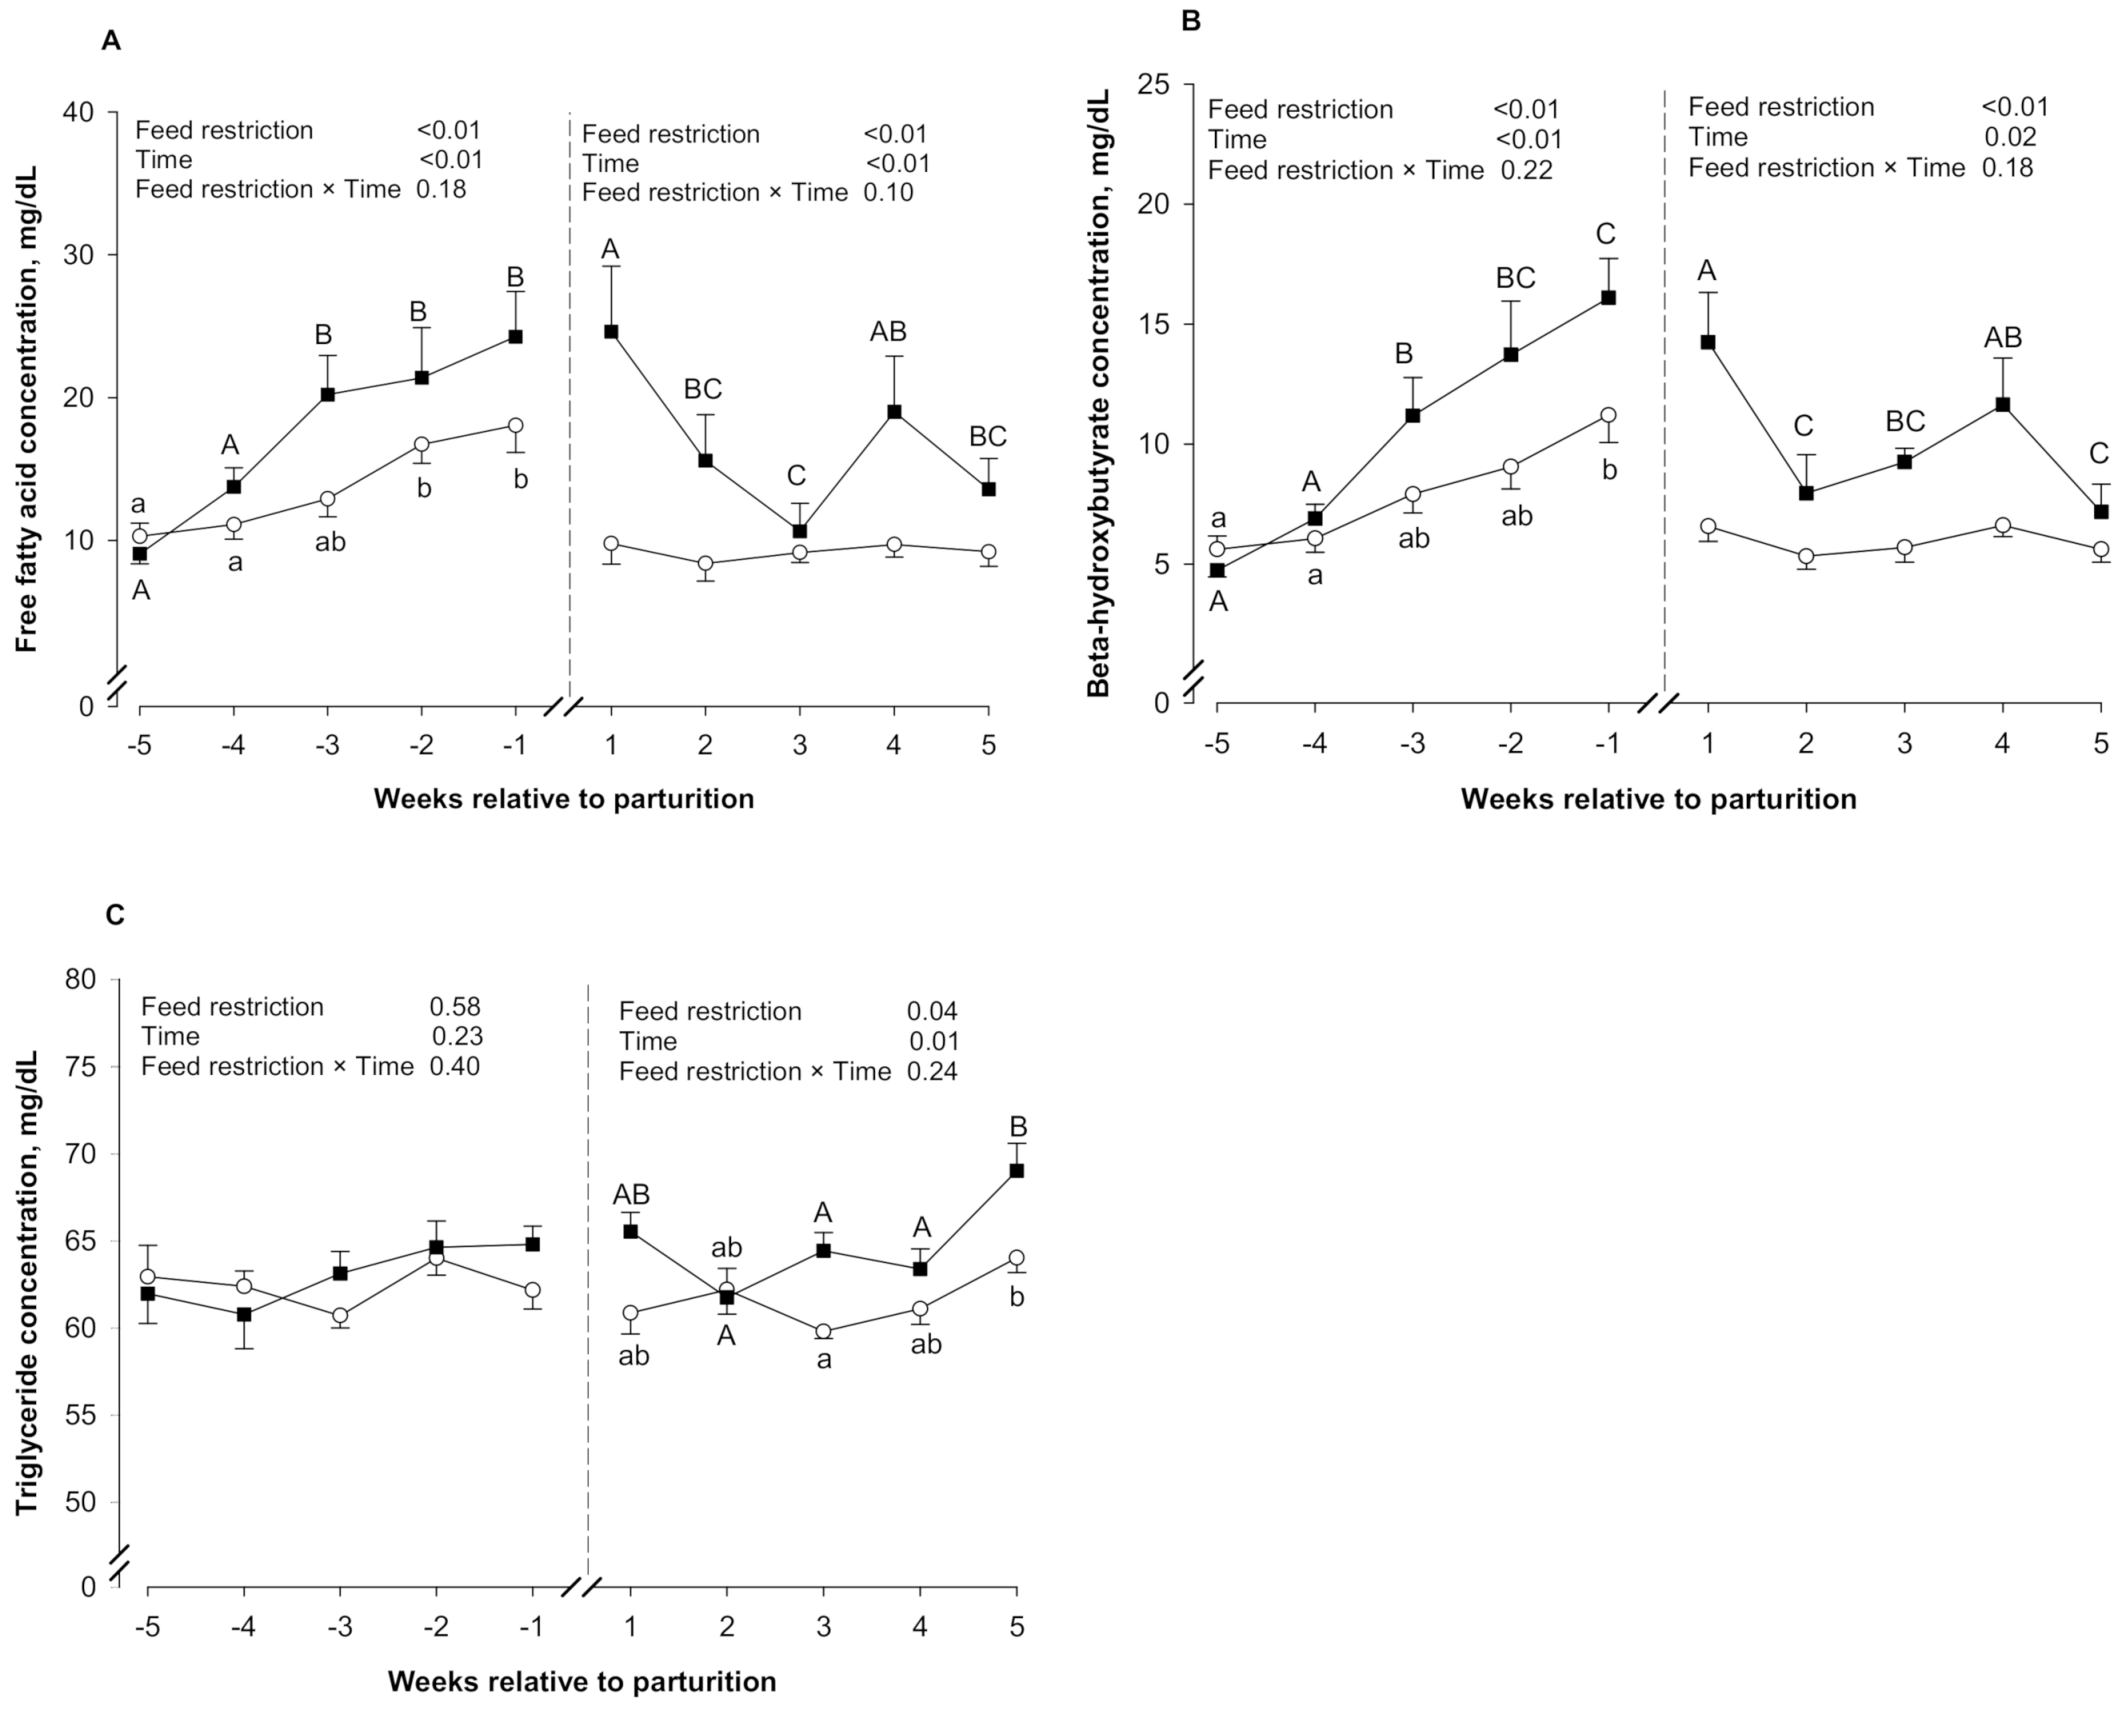
3.2. Blood Metabolites
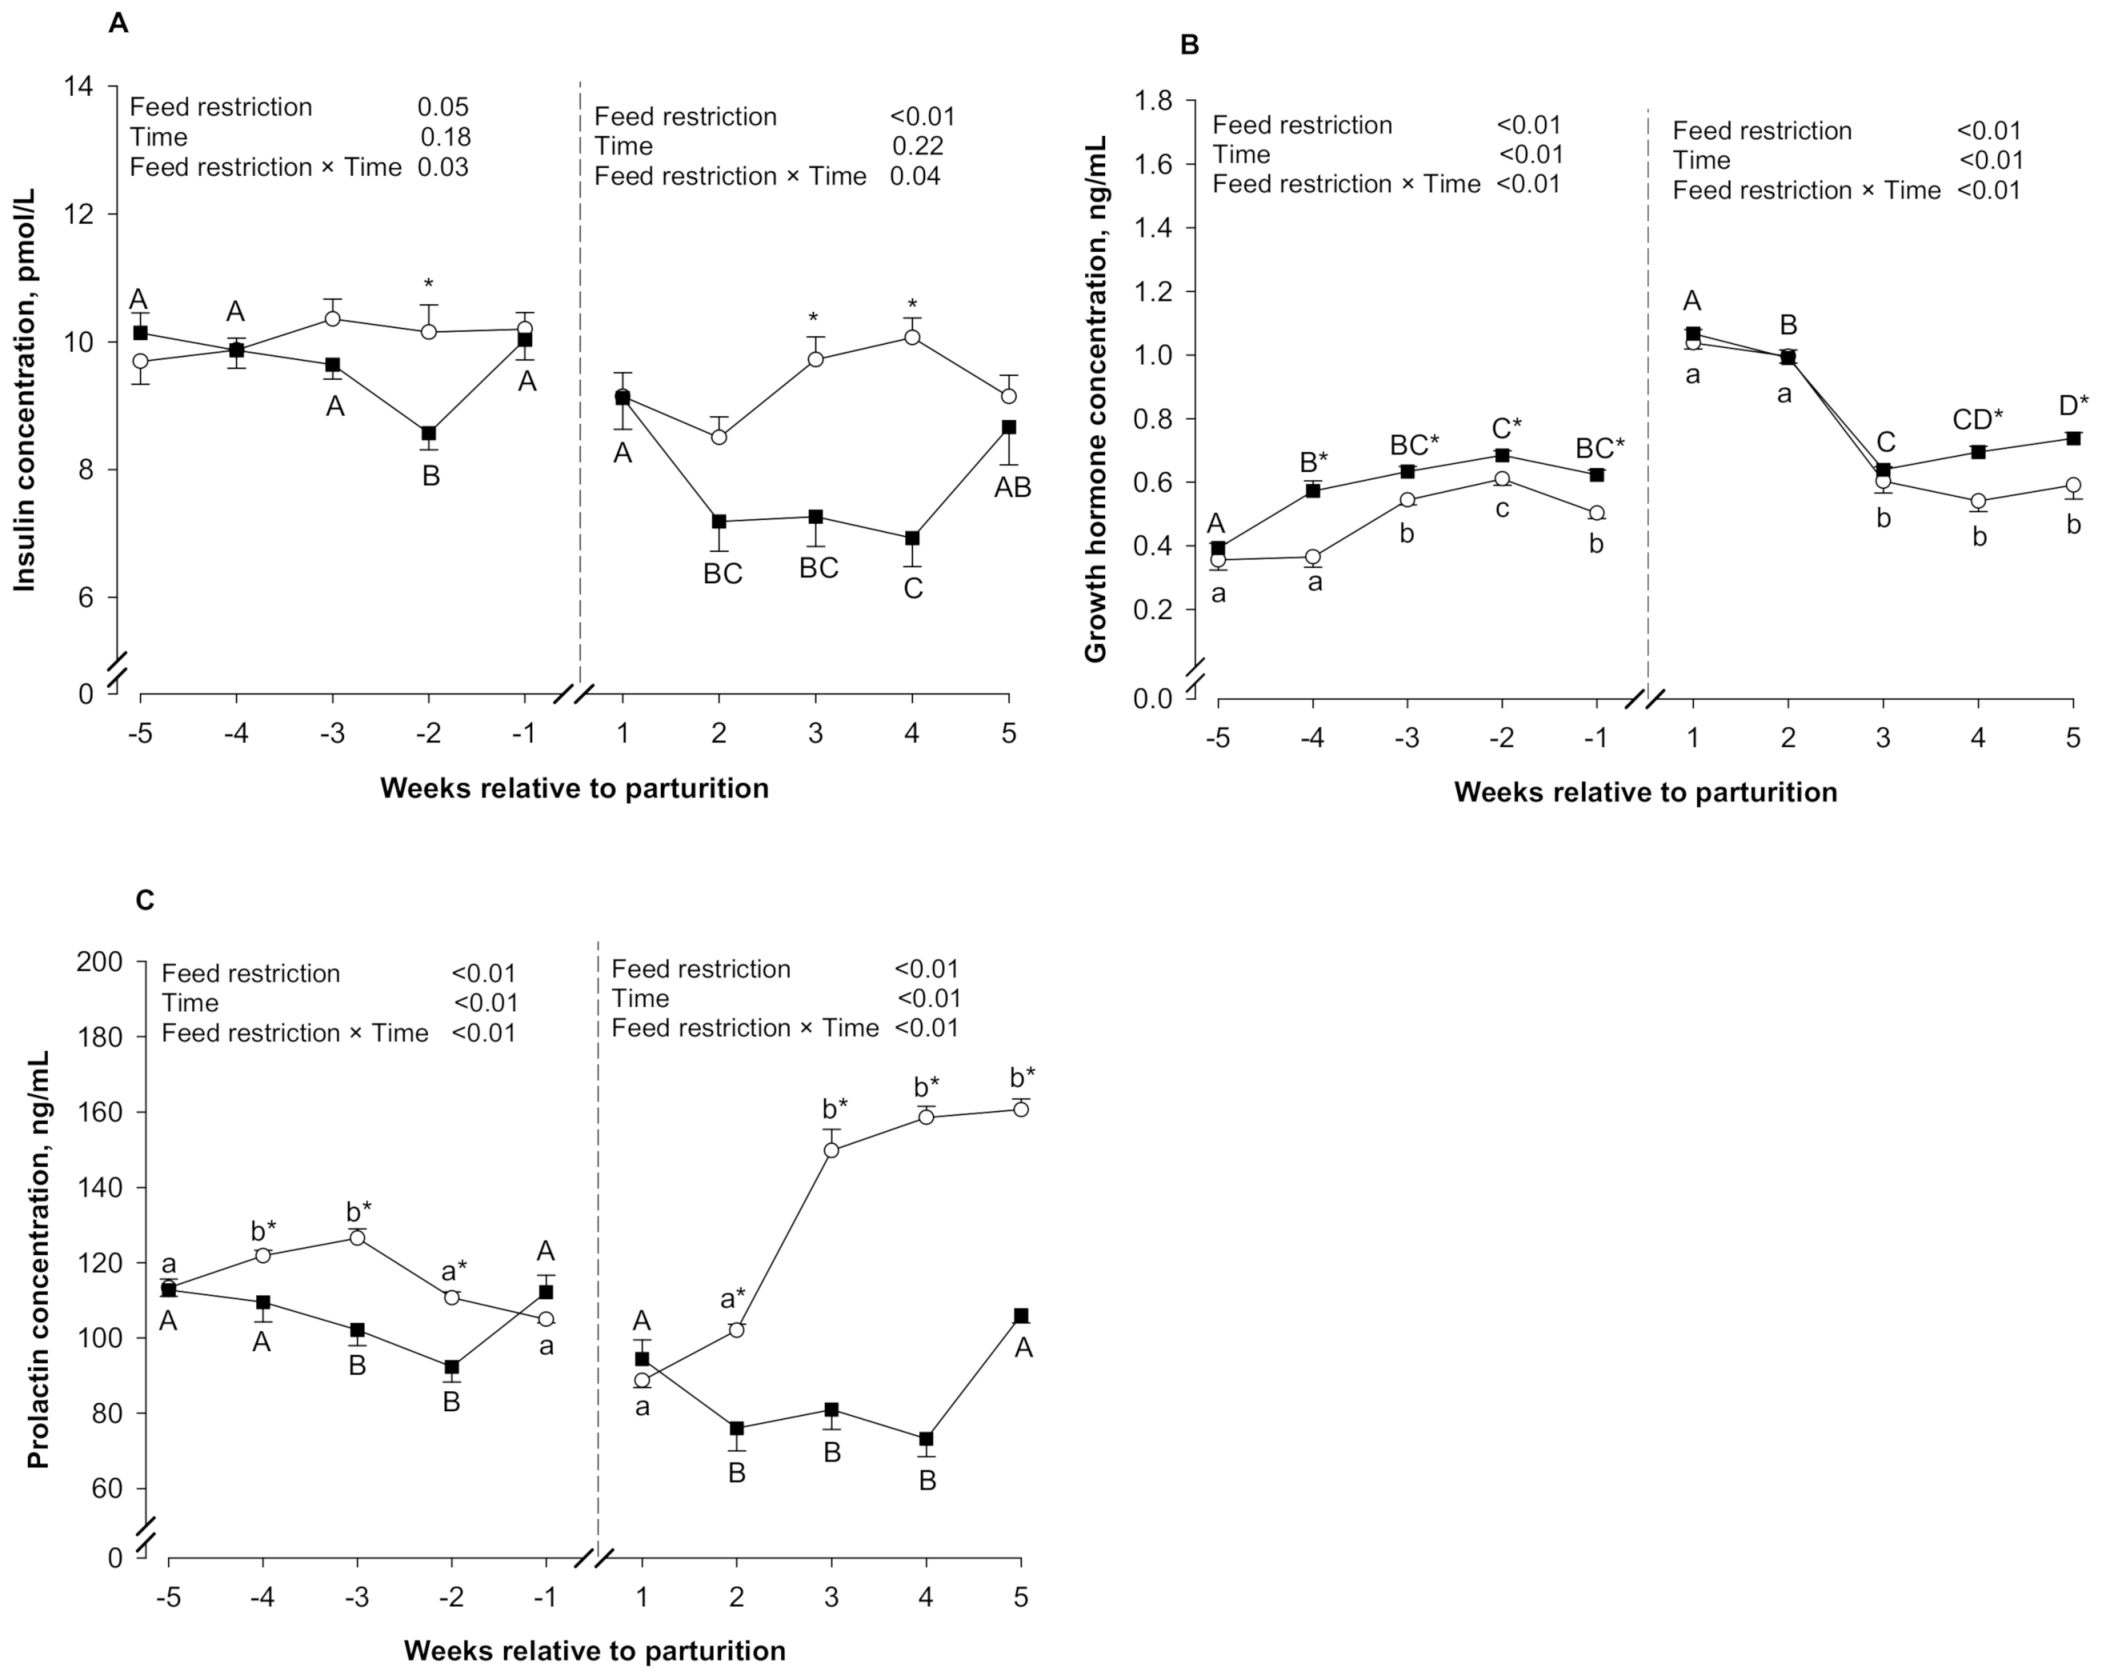
3.3. Blood Hormones
3.4. Colostrum Yield and Composition
3.5. Milk Yield and Composition
4. Discussion
5. Conclusions
Author Contributions
Funding
Institutional Review Board Statement
Data Availability Statement
Acknowledgments
Conflicts of Interest
References
- Hernández-Castellano, L.E.; Nally, J.E.; Lindahl, J.; Wanapat, M.; Alhidary, I.A.; Fangueiro, D.; Grace, D.; Ratto, M.; Bambou, J.C.; de Almeida, A.M. Dairy science and health in the tropics: Challenges and opportunities for the next decades. Trop. Anim. Health Prod. 2019, 51, 1009–1017. [Google Scholar] [CrossRef] [PubMed]
- Zachut, M.; Speranda, M.; de Almeida, A.M.; Gabai, G.; Mobasheri, A.; Hernández-Castellano, L.E. Biomarkers of fitness and welfare in dairy cattle: Healthy productivity. J. Dairy Res. 2020, 87, 4–13. [Google Scholar] [CrossRef]
- Drackley, J.K. ADSA Foundation Scholar Award. Biology of dairy cows during the transition period: The final frontier? J. Dairy Sci. 1999, 82, 2259–2273. [Google Scholar] [CrossRef]
- Bell, A.W.; Bauman, D.E. Adaptations of glucose metabolism during pregnancy and lactation. J. Mammary Gland Biol. Neoplasia 1997, 2, 265–278. [Google Scholar] [CrossRef] [PubMed]
- Hernández-Castellano, L.E.; Hernandez, L.L.; Bruckmaier, R.M. Review: Endocrine pathways to regulate calcium homeostasis around parturition and the prevention of hypocalcemia in periparturient dairy cows. Animal 2020, 14, 330–338. [Google Scholar] [CrossRef]
- Huang, W.; Tian, Y.; Wang, Y.; Simayi, A.; Yasheng, A.; Wu, Z.; Li, S.; Cao, Z. Effect of reduced energy density of close-up diets on dry matter intake, lactation performance and energy balance in multiparous Holstein cows. J. Anim. Sci. Biotechnol. 2014, 5, 30. [Google Scholar] [CrossRef] [PubMed]
- Alves, S.P.; Bessa, R.J.; Quaresma, M.A.; Kilminster, T.; Scanlon, T.; Oldham, C.; Milton, J.; Greeff, J.; Almeida, A.M. Does the fat tailed Damara ovine breed have a distinct lipid metabolism leading to a high concentration of branched chain fatty acids in tissues? PLoS ONE 2013, 8, e77313. [Google Scholar] [CrossRef]
- Almeida, A.M.; Palhinhas, R.G.; Kilminster, T.; Scanlon, T.; van Harten, S.; Milton, J.; Blache, D.; Greeff, J.; Oldham, C.; Coelho, A.V.; et al. The effect of weight loss on the muscle proteome in the Damara, Dorper and Australian Merino ovine breeds. PLoS ONE 2016, 11, e0146367. [Google Scholar] [CrossRef]
- van Harten, S.; Kilminster, T.; Scanlon, T.; Milton, J.; Oldham, C.; Greeff, J.; Almeida, A.M. Fatty acid composition of the ovine longissimus dorsi muscle: Effect of feed restriction in three breeds of different origin. J. Sci. Food Agric. 2015. [Google Scholar] [CrossRef]
- Council, N.R. Nutrient Requirements of Small Ruminants: Sheep, Goats, Cervids, and New World Camelids; The National Academies Press: Washington, DC, USA, 2007; p. 384. [Google Scholar]
- Association of Official Analytical Chemists. Official Methods of Analysis; Association of Official Analytical Chemists: Washington, DC, USA, 1990. [Google Scholar]
- Benson, M.E.; Henry, M.J.; Cardellino, R.A. Comparison of weigh-suckle-weigh and machine milking for measuring ewe milk production. J. Anim. Sci. 1999, 77, 2330–2335. [Google Scholar] [CrossRef]
- Milis, C. Prediction of the energy value of ewe milk at early lactation. Acta Agric. Scand. A Anim. Sci. 2008, 58, 191–195. [Google Scholar] [CrossRef]
- Fischer, A.; Edouard, N.; Faverdin, P. Precision feed restriction improves feed and milk efficiencies and reduces methane emissions of less efficient lactating Holstein cows without impairing their performance. J. Dairy Sci. 2020, 103, 4408–4422. [Google Scholar] [CrossRef]
- Herve, L.; Quesnel, H.; Veron, M.; Portanguen, J.; Gross, J.J.; Bruckmaier, R.M.; Boutinaud, M. Milk yield loss in response to feed restriction is associated with mammary epithelial cell exfoliation in dairy cows. J. Dairy Sci. 2019, 102, 2670–2685. [Google Scholar] [CrossRef] [PubMed]
- Scanlon, T.T.; Almeida, A.M.; van Burgel, A.; Kilminster, T.; Milton, J.; Greeff, J.C.; Oldham, C. Live weight parameters and feed intake in Dorper, Damara and Australian Merino lambs exposed to restricted feeding. Small Rumin. Res. 2013, 109, 101–106. [Google Scholar] [CrossRef]
- Ding, L.M.; Chen, J.Q.; Degen, A.A.; Qiu, Q.; Liu, P.P.; Dong, Q.M.; Shang, Z.H.; Zhang, J.J.; Liu, S.J. Growth performance and hormonal status during feed restriction and compensatory growth of Small-Tail Han sheep in China. Small Rumin. Res. 2016, 144, 191–196. [Google Scholar] [CrossRef]
- Ahmadzadeh, L.; Hosseinkhani, A.; Taghizadeh, A.; Ghasemi-Panahi, B.; Hamidian, G. Effect of late gestational feed restriction and glucogenic precursor on behaviour and performance of Ghezel ewes and their offspring. Appl. Anim. Behav. Sci. 2020, 231, 105030. [Google Scholar] [CrossRef]
- Lérias, J.; Hernández-Castellano, L.; Morales-delaNuez, A.; Araújo, S.; Castro, N.; Argüello, A.; Capote, J.; Almeida, A. Body live weight and milk production parameters in the Majorera and Palmera goat breeds from the Canary Islands: Influence of weight loss. Trop Anim. Health Prod. 2013, 45, 1731–1736. [Google Scholar] [CrossRef]
- Cugno, G.; Parreira, J.R.; Ferlizza, E.; Hernández-Castellano, L.E.; Carneiro, M.; Renaut, J.; Castro, N.; Arguello, A.; Capote, J.; Campos, A.M.; et al. The Goat (Capra hircus) Mammary gland mitochondrial proteome: A study on the effect of weight loss using blue-native page and two-dimensional gel electrophoresis. PLoS ONE 2016, 11, e0151599. [Google Scholar] [CrossRef]
- Hernández-Castellano, L.E.; Ferreira, A.M.; Nanni, P.; Grossmann, J.; Arguello, A.; Capote, J.; Cai, G.; Lippolis, J.; Castro, N.; Almeida, A.M. The goat (Capra hircus) mammary gland secretory tissue proteome as influenced by weight loss: A study using label free proteomics. J. Proteom. 2016. [Google Scholar] [CrossRef] [PubMed]
- Wilkes, M.J.; Hynd, P.I.; Pitchford, W.S. Damara sheep have higher digestible energy intake than Merino sheep when fed low-quality or high-quality feed. Anim. Prod. Sci. 2012, 52, 30–34. [Google Scholar] [CrossRef]
- Lunesu, M.F.; Bomboi, G.C.; Marzano, A.; Comin, A.; Prandi, A.; Sechi, P.; Nicolussi, P.S.; Decandia, M.; Manca, C.; Atzori, A.S.; et al. Metabolic and hormonal control of energy utilization and partitioning from early to mid lactation in Sarda ewes and Saanen goats. J. Dairy Sci. 2021, 104, 3617–3631. [Google Scholar] [CrossRef] [PubMed]
- van Dorland, H.A.; Richter, S.; Morel, I.; Doherr, M.G.; Castro, N.; Bruckmaier, R.M. Variation in hepatic regulation of metabolism during the dry period and in early lactation in dairy cows. J. Dairy Sci. 2009, 92, 1924–1940. [Google Scholar] [CrossRef] [PubMed]
- Zarrin, M.; Grossen-Rösti, L.; Bruckmaier, R.M.; Gross, J.J. Elevation of blood β-hydroxybutyrate concentration affects glucose metabolism in dairy cows before and after parturition. J. Dairy Sci. 2017, 100, 2323–2333. [Google Scholar] [CrossRef] [PubMed]
- Drackley, J.K.; Overton, T.R.; Douglas, G.N. Adaptations of glucose and long-chain fatty acid metabolism in liver of dairy cows during the periparturient period. J. Dairy Sci. 2001, 84, E100–E112. [Google Scholar] [CrossRef]
- Bouvier-Muller, J.; Allain, C.; Enjalbert, F.; Tabouret, G.; Portes, D.; Caubet, C.; Tasca, C.; Foucras, G.; Rupp, R. Response to dietary-induced energy restriction in dairy sheep divergently selected for resistance or susceptibility to mastitis. J. Dairy Sci. 2016, 99, 480–492. [Google Scholar] [CrossRef]
- Pulina, G.; Nudda, A.; Battacone, G.; Dimauro, C.; Mazzette, A.; Bomboi, G.; Floris, B. Effects of short-term feed restriction on milk yield and composition, and hormone and metabolite profiles in mid-lactation Sarda dairy sheep with different body condition score. Ital. J. Anim. Sci. 2012, 11, e28. [Google Scholar] [CrossRef]
- Kalyesubula, M.; Mopuri, R.; Rosov, A.; Alon, T.; Edery, N.; Moallem, U.; Dvir, H. Hyperglycemia-stimulating diet induces liver steatosis in sheep. Sci. Rep. 2020, 10, 1–12. [Google Scholar] [CrossRef]
- Contreras-Zentella, M.L.; Hernández-Muñoz, R. Is liver enzyme release really associated with cell necrosis induced by oxidant stress? Oxid. Med. Cell. Longev. 2016, 2016, 3529149. [Google Scholar] [CrossRef]
- Fazeli, P.K.; Klibanski, A. Determinants of GH resistance in malnutrition. J. Endocrinol. 2014, 220, R57–R65. [Google Scholar] [CrossRef]
- Sakharova, A.A.; Horowitz, J.F.; Surya, S.; Goldenberg, N.; Harber, M.P.; Symons, K.; Barkan, A. Role of growth hormone in regulating lipolysis, proteolysis, and hepatic glucose production during fasting. J. Clin. Endocrinol. Metab. 2008, 93, 2755–2759. [Google Scholar] [CrossRef]
- Moller, L.; Norrelund, H.; Jessen, N.; Flyvbjerg, A.; Pedersen, S.B.; Gaylinn, B.D.; Liu, J.; Thorner, M.O.; Moller, N.; Lunde Jorgensen, J.O. Impact of growth hormone receptor blockade on substrate metabolism during fasting in healthy subjects. J. Clin. Endocrinol. Metab. 2009, 94, 4524–4532. [Google Scholar] [CrossRef][Green Version]
- Ollier, S.; Zhao, X.; Lacasse, P. Effects of feed restriction and prolactin-release inhibition at drying off on metabolism and mammary gland involution in cows. J. Dairy Sci. 2014, 97, 4942–4954. [Google Scholar] [CrossRef]
- Kuhla, B.; Albrecht, D.; Bruckmaier, R.; Viergutz, T.; Nurnberg, G.; Metges, C.C. Proteome and radioimmunoassay analyses of pituitary hormones and proteins in response to feed restriction of dairy cows. Proteomics 2010, 10, 4491–4500. [Google Scholar] [CrossRef]
- Vicini, J.L.; Cohick, W.S.; Clark, J.H.; McCutcheon, S.N.; Bauman, D.E. Effects of feed intake and sodium bicarbonate on milk production and concentrations of hormones and metabolites in plasma of cows. J. Dairy Sci. 1988, 71, 1232–1238. [Google Scholar] [CrossRef]
- Bernier-Dodier, P.; Girard, C.L.; Talbot, B.G.; Lacasse, P. Effect of dry period management on mammary gland function and its endocrine regulation in dairy cows. J. Dairy Sci. 2011, 94, 4922–4936. [Google Scholar] [CrossRef]
- Petridis, I.G.; Fthenakis, G.C. Mammary involution and relevant udder health management in sheep. Small Rumin. Res. 2019, 181, 66–75. [Google Scholar] [CrossRef]
- Brandon, M.; Watson, D.; Lascelles, A. The mechanism of transfer of immunoglobulin into mammary secretion of cows. Aust. J. Exp. Biol. Med. Sci. 1971, 49, 613–623. [Google Scholar] [CrossRef]
- Barrington, G.M.; Parish, S.M. Bovine neonatal immunology. Vet. Clin. N. Am. Food Anim. Pract. 2001, 17, 463–476. [Google Scholar] [CrossRef]
- Castro, N.; Capote, J.; Bruckmaier, R.M.; Arguello, A. Management effects on colostrogenesis in small ruminants: A review. J. Appl. Anim. Res. 2011, 39, 85–93. [Google Scholar] [CrossRef]
- Tygesen, M.P.; Nielsen, M.O.; Nørgaard, P.; Ranvig, H.; Harrison, A.P.; Tauson, A.H. Late gestational nutrient restriction: Effects on ewes’ metabolic and homeorhetic adaptation, consequences for lamb birth weight and lactation performance. Arch. Anim. Nutr. 2008, 62, 44–59. [Google Scholar] [CrossRef]
- Castro, F.A.B.; Ribeiro, E.L.A.; Mizubuti, I.Y.; Silva, L.D.F.; Barbosa, M.A.A.F.; Sousa, C.L.; Paiva, F.H.P.; Koritiaki, N.A. Influence of pre and postnatal energy restriction on the productive performance of ewes and lambs. Rev. Bras. Zootec. 2012, 41, 951–958. [Google Scholar] [CrossRef][Green Version]


| Diets | ||
|---|---|---|
| Dry Diet | Early Lactation Diet | |
| Ingredients, DM % | ||
| Alfalfa hay | 26.7 | 39.0 |
| Barley | 34.9 | 39.0 |
| Wheat straw | 35.5 | 22.0 |
| Chemical Composition 1 | ||
| DM 2, % | 89.0 | 89.0 |
| Calculated ME 2, Mcal/kg | 2.13 | 2.23 |
| CP 2, DM % | 11.0 | 13.1 |
| NDF 2, DM % | 49.0 | 42.3 |
| ADF 2, DM % | 32.9 | 29.0 |
| EE 2, DM % | 2.10 | 2.31 |
| Calcium, DM % | 0.51 | 0.65 |
| Phosphorous, DM % | 0.24 | 0.27 |
| Variables 1 | Prepartum | Postpartum | ||||||||||
|---|---|---|---|---|---|---|---|---|---|---|---|---|
| Groups | Fixed Effects 2 | Groups | Fixed Effects 2 | |||||||||
| Ctrl | FR | SEM | Feed Restriction | Time | F × T | Ctrl | FR | SEM | Feed Restriction | Time | F × T | |
| Glucose, mg/dL | 49.4 | 54.7 | 1.68 | 0.21 | 0.80 | 0.77 | 56.5 | 57.9 | 1.76 | 0.66 | 0.71 | 0.60 |
| TP, g/dL | 4.50 | 5.08 | 0.20 | 0.12 | 0.98 | 0.20 | 4.68 | 4.80 | 0.21 | 0.70 | 0.17 | 0.78 |
| Urea, mg/dL | 9.70 | 9.49 | 0.90 | 0.73 | 0.44 | 0.88 | 10.6 | 9.45 | 0.85 | 0.49 | 0.27 | 0.38 |
| Albumin, g/dL | 2.97 | 2.93 | 0.11 | 0.95 | 0.26 | 0.97 | 2.92 | 2.93 | 0.11 | 0.93 | 0.61 | 0.25 |
| Creatinine, mg/dL | 1.07 | 0.91 | 0.08 | 0.28 | 0.50 | 0.10 | 1.28 | 1.04 | 0.08 | 0.10 | 0.53 | 0.22 |
| FFA, mg/dL | 13.8 | 17.8 | 2.26 | ≤0.01 | ≤0.01 | 0.18 | 9.32 | 16.7 | 3.11 | 0.05 | ≤0.01 | 0.10 |
| BHB, mg/dL | 8.02 | 11.5 | 1.20 | ≤0.01 | ≤0.01 | 0.22 | 5.93 | 10.1 | 1.46 | ≤0.01 | 0.02 | 0.18 |
| TG, mg/dL | 62.5 | 63.0 | 0.64 | 0.58 | 0.23 | 0.40 | 61.5 | 64.4 | 0.99 | 0.04 | 0.01 | 0.24 |
| Cholesterol, mg/dL | 31.8 | 32.1 | 1.52 | 0.91 | 0.43 | 0.87 | 33.9 | 29.8 | 1.57 | 0.20 | 0.97 | 0.32 |
| GOT, U/L | 63.8 | 76.2 | 5.17 | 0.20 | 0.73 | 0.81 | 83.1 | 69.2 | 5.95 | 0.22 | 0.98 | 0.35 |
| GPT, U/L | 18.8 | 20.5 | 1.90 | 0.53 | 0.19 | 0.64 | 19.9 | 16.6 | 1.70 | 0.40 | 0.61 | 0.45 |
| LDH, U/L | 329 | 415 | 29.7 | 0.25 | 0.39 | 0.98 | 481 | 529 | 42.4 | 0.65 | 0.92 | 0.33 |
| Prepartum | Postpartum | |||||||||||
|---|---|---|---|---|---|---|---|---|---|---|---|---|
| Variables 1 | Groups | Fixed Effects 2 | Groups | Fixed Effects 2 | ||||||||
| Ctrl | FR | SEM | Feed Restriction | Time | F × T | Ctrl | FR | SEM | Feed Restriction | Time | F × T | |
| Insulin, pmol/L | 10.0 | 9.65 | 0.32 | 0.05 | 0.18 | 0.03 | 9.32 | 7.83 | 0.49 | ≤0.01 | 0.22 | 0.04 |
| GH, ng/mL | 0.48 | 0.58 | 0.02 | ≤0.01 | ≤0.01 | ≤0.01 | 0.75 | 0.83 | 0.03 | ≤0.01 | ≤0.01 | ≤0.01 |
| PRL, ng/mL | 115 | 106 | 3.92 | ≤0.01 | ≤0.01 | ≤0.01 | 132 | 86.1 | 4.61 | ≤0.01 | ≤0.01 | ≤0.01 |
| P4, ng/mL | 3.16 | 3.17 | 0.29 | 0.97 | ≤0.01 | 0.18 | 0.28 | 0.29 | 0.16 | 0.32 | 0.68 | 0.14 |
| Variables | Groups | Fixed Effects | ||
|---|---|---|---|---|
| Ctrl | FR | SEM | Feed Restriction | |
| Colostrum yield, kg | 4.45 | 3.16 | 0.45 | 0.05 |
| Fat, % | 9.48 | 13.9 | 1.50 | 0.03 |
| Lactose, % | 13.1 | 14.9 | 0.87 | 0.04 |
| Protein, % | 9.52 | 10.7 | 0.58 | 0.05 |
| SNF 1, % | 26.9 | 30.1 | 1.60 | 0.04 |
| Variables | Groups | Fixed Effects 2 | ||||
|---|---|---|---|---|---|---|
| Ctrl | FR | SEM | Feed Restriction | Time | F × T | |
| Milk yield, kg | ≤0.01 | ≤0.001 | ≤0.001 | |||
| week 1 | 1.28 a,* | 0.89 A | 0.09 | |||
| week 2 | 1.29 a,* | 0.50 B | 0.09 | |||
| week 3 | 1.19 a,b,* | 0.57 B,C | 0.08 | |||
| week 4 | 1.14 b,* | 0.66 C | 0.08 | |||
| week 5 | 1.02 b | 0.76 D | 0.13 | |||
| Fat, % | 0.86 | 0.13 | 0.70 | |||
| week 1 | 3.64 | 4.03 | 0.59 | |||
| week 2 | 3.27 | 3.82 | 0.47 | |||
| week 3 | 4.68 | 3.93 | 0.84 | |||
| week 4 | 4.22 | 4.58 | 0.51 | |||
| week 5 | 5.26 | 4.96 | 0.65 | |||
| Lactose, % | 0.96 | 0.84 | 0.66 | |||
| week 1 | 5.96 | 5.98 | 0.89 | |||
| week 2 | 5.89 | 6.00 | 1.63 | |||
| week 3 | 5.94 | 5.86 | 1.22 | |||
| week 4 | 5.94 | 5.95 | 1.95 | |||
| week 5 | 5.82 | 5.87 | 1.50 | |||
| Protein, % | 0.78 | 0.80 | 0.81 | |||
| week 1 | 4.07 | 3.99 | 1.22 | |||
| week 2 | 3.97 | 4.01 | 1.05 | |||
| week 3 | 3.99 | 3.95 | 0.77 | |||
| week 4 | 4.05 | 3.97 | 1.31 | |||
| week 5 | 3.88 | 3.92 | 0.99 | |||
| 1 SNF, % | 0.96 | 0.76 | 0.27 | |||
| week 1 | 10.8 | 10.9 | 1.70 | |||
| week 2 | 10.7 | 11.1 | 1.14 | |||
| week 3 | 10.8 | 10.7 | 1.91 | |||
| week 4 | 10.9 | 10.8 | 1.77 | |||
| week 5 | 10.6 | 10.7 | 1.77 | |||
| EVL, Mcal/kg | 0.59 | 0.22 | 0.57 | |||
| week 1 | 0.82 | 0.86 | 0.04 | |||
| week 2 | 0.78 | 0.85 | 0.04 | |||
| week 3 | 0.86 | 0.84 | 0.04 | |||
| week 4 | 0.78 | 0.91 | 0.05 | |||
| week 5 | 0.96 | 0.94 | 0.06 | |||
Publisher’s Note: MDPI stays neutral with regard to jurisdictional claims in published maps and institutional affiliations. |
© 2021 by the authors. Licensee MDPI, Basel, Switzerland. This article is an open access article distributed under the terms and conditions of the Creative Commons Attribution (CC BY) license (https://creativecommons.org/licenses/by/4.0/).
Share and Cite
Zarrin, M.; Sanginabadi, M.; Nouri, M.; Ahmadpour, A.; Hernández-Castellano, L.E. Prepartum and Postpartum Feed Restrictions Affect Blood Metabolites and Hormones Reducing Colostrum and Milk Yields in Fat-Tailed Dairy Sheep. Animals 2021, 11, 1258. https://doi.org/10.3390/ani11051258
Zarrin M, Sanginabadi M, Nouri M, Ahmadpour A, Hernández-Castellano LE. Prepartum and Postpartum Feed Restrictions Affect Blood Metabolites and Hormones Reducing Colostrum and Milk Yields in Fat-Tailed Dairy Sheep. Animals. 2021; 11(5):1258. https://doi.org/10.3390/ani11051258
Chicago/Turabian StyleZarrin, Mousa, Meysam Sanginabadi, Mahrokh Nouri, Amir Ahmadpour, and Lorenzo E. Hernández-Castellano. 2021. "Prepartum and Postpartum Feed Restrictions Affect Blood Metabolites and Hormones Reducing Colostrum and Milk Yields in Fat-Tailed Dairy Sheep" Animals 11, no. 5: 1258. https://doi.org/10.3390/ani11051258
APA StyleZarrin, M., Sanginabadi, M., Nouri, M., Ahmadpour, A., & Hernández-Castellano, L. E. (2021). Prepartum and Postpartum Feed Restrictions Affect Blood Metabolites and Hormones Reducing Colostrum and Milk Yields in Fat-Tailed Dairy Sheep. Animals, 11(5), 1258. https://doi.org/10.3390/ani11051258