
Multi-Scale Spatial Prediction of Wild Boar Damage Risk in Hunchun: A Key Tiger Range in China

 ,
,  ,
,  ,
,
Abstract
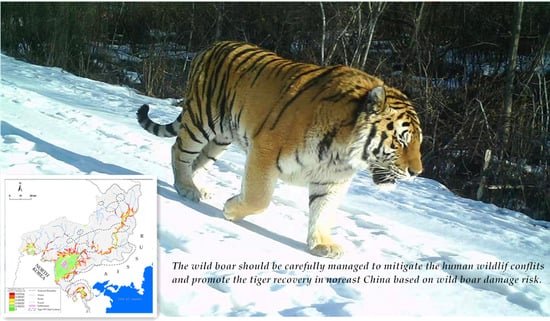
Simple Summary
Abstract
1. Introduction
2. Materials and Methods
2.1. Study Area
2.2. Data Collection
2.3. Data Analysis
3. Results
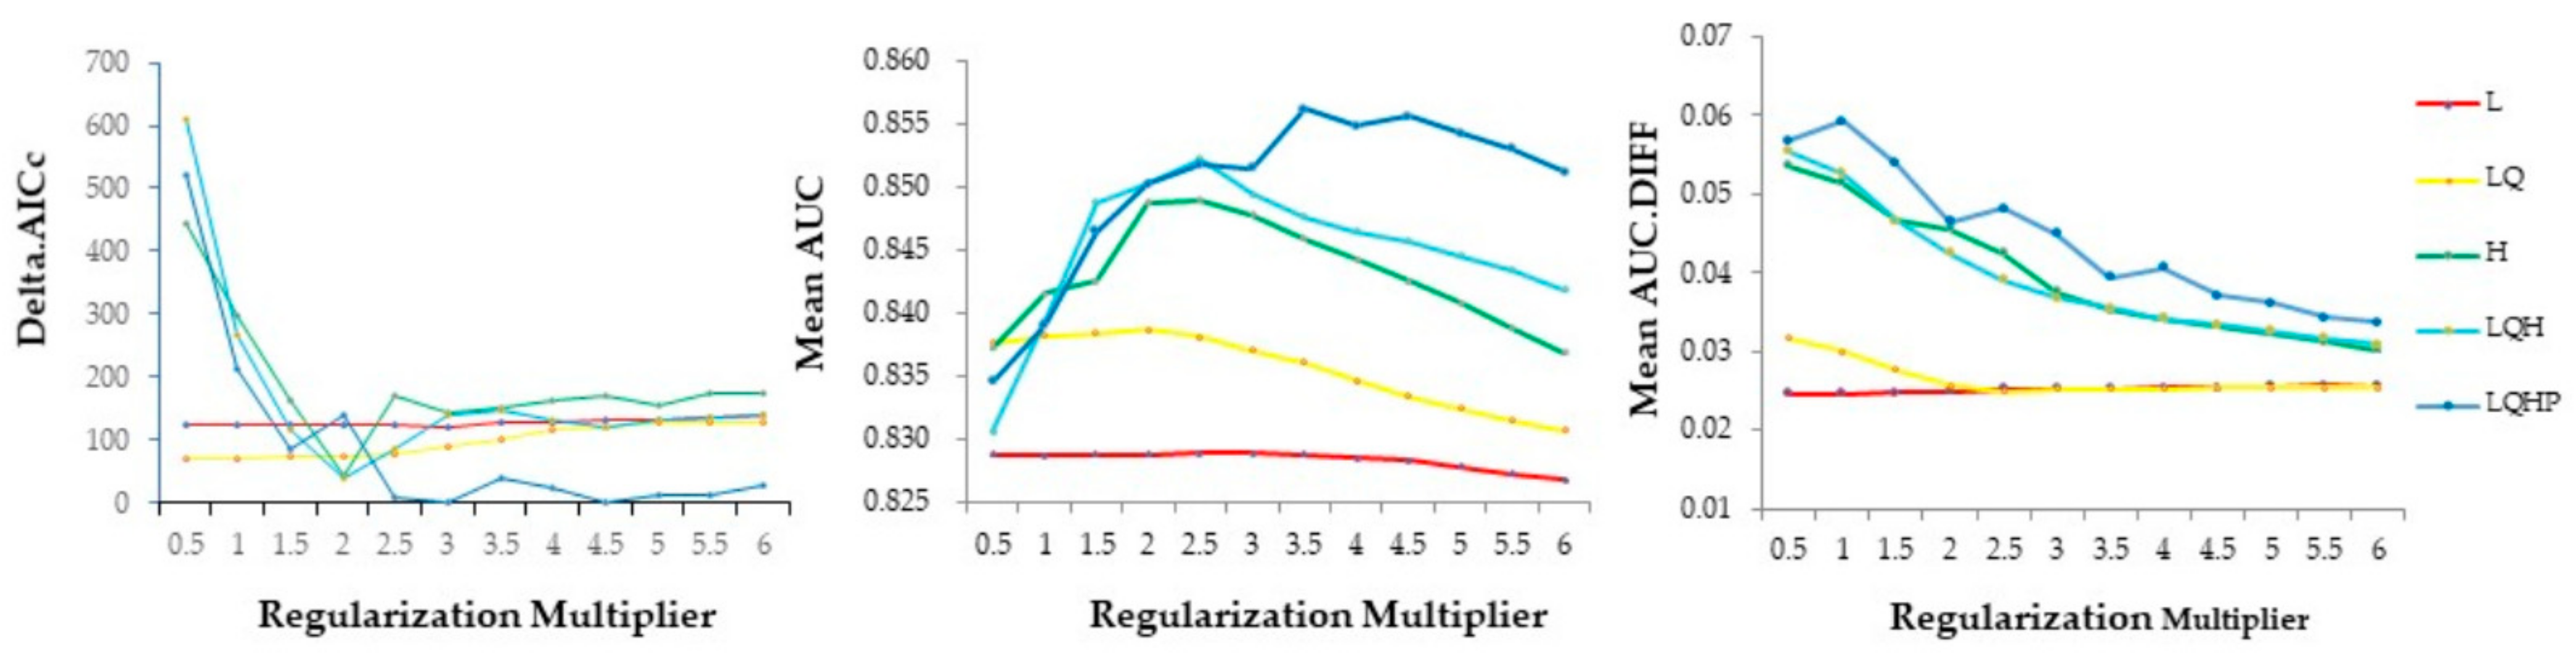
3.1. Model Selection
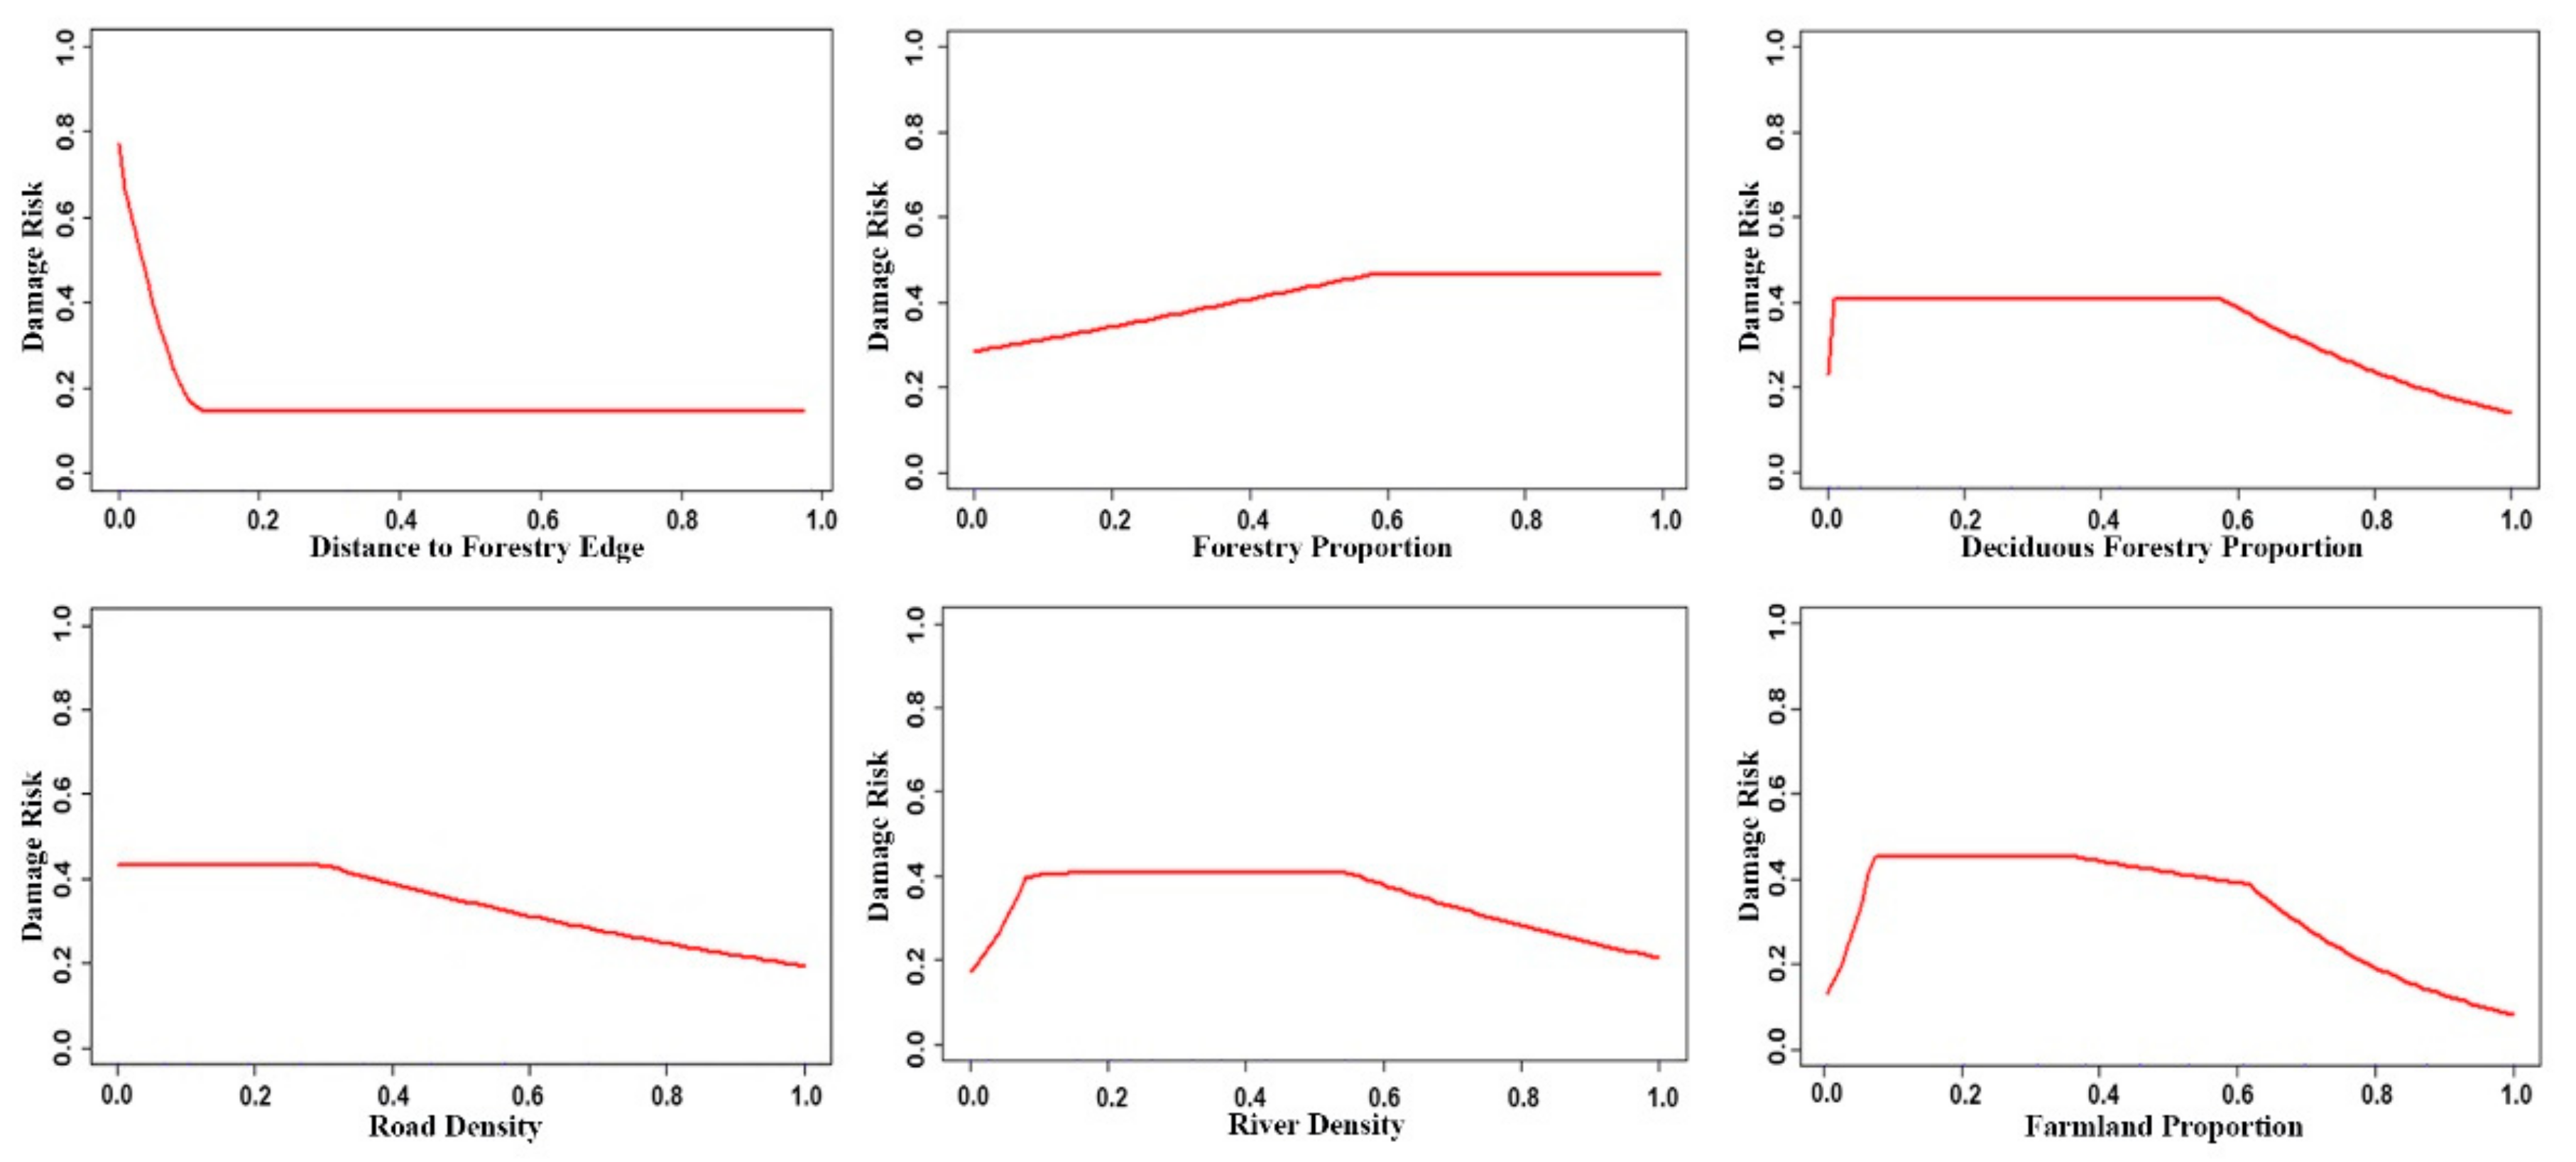
3.2. Factors Influencing Wild Boar Damage Risk
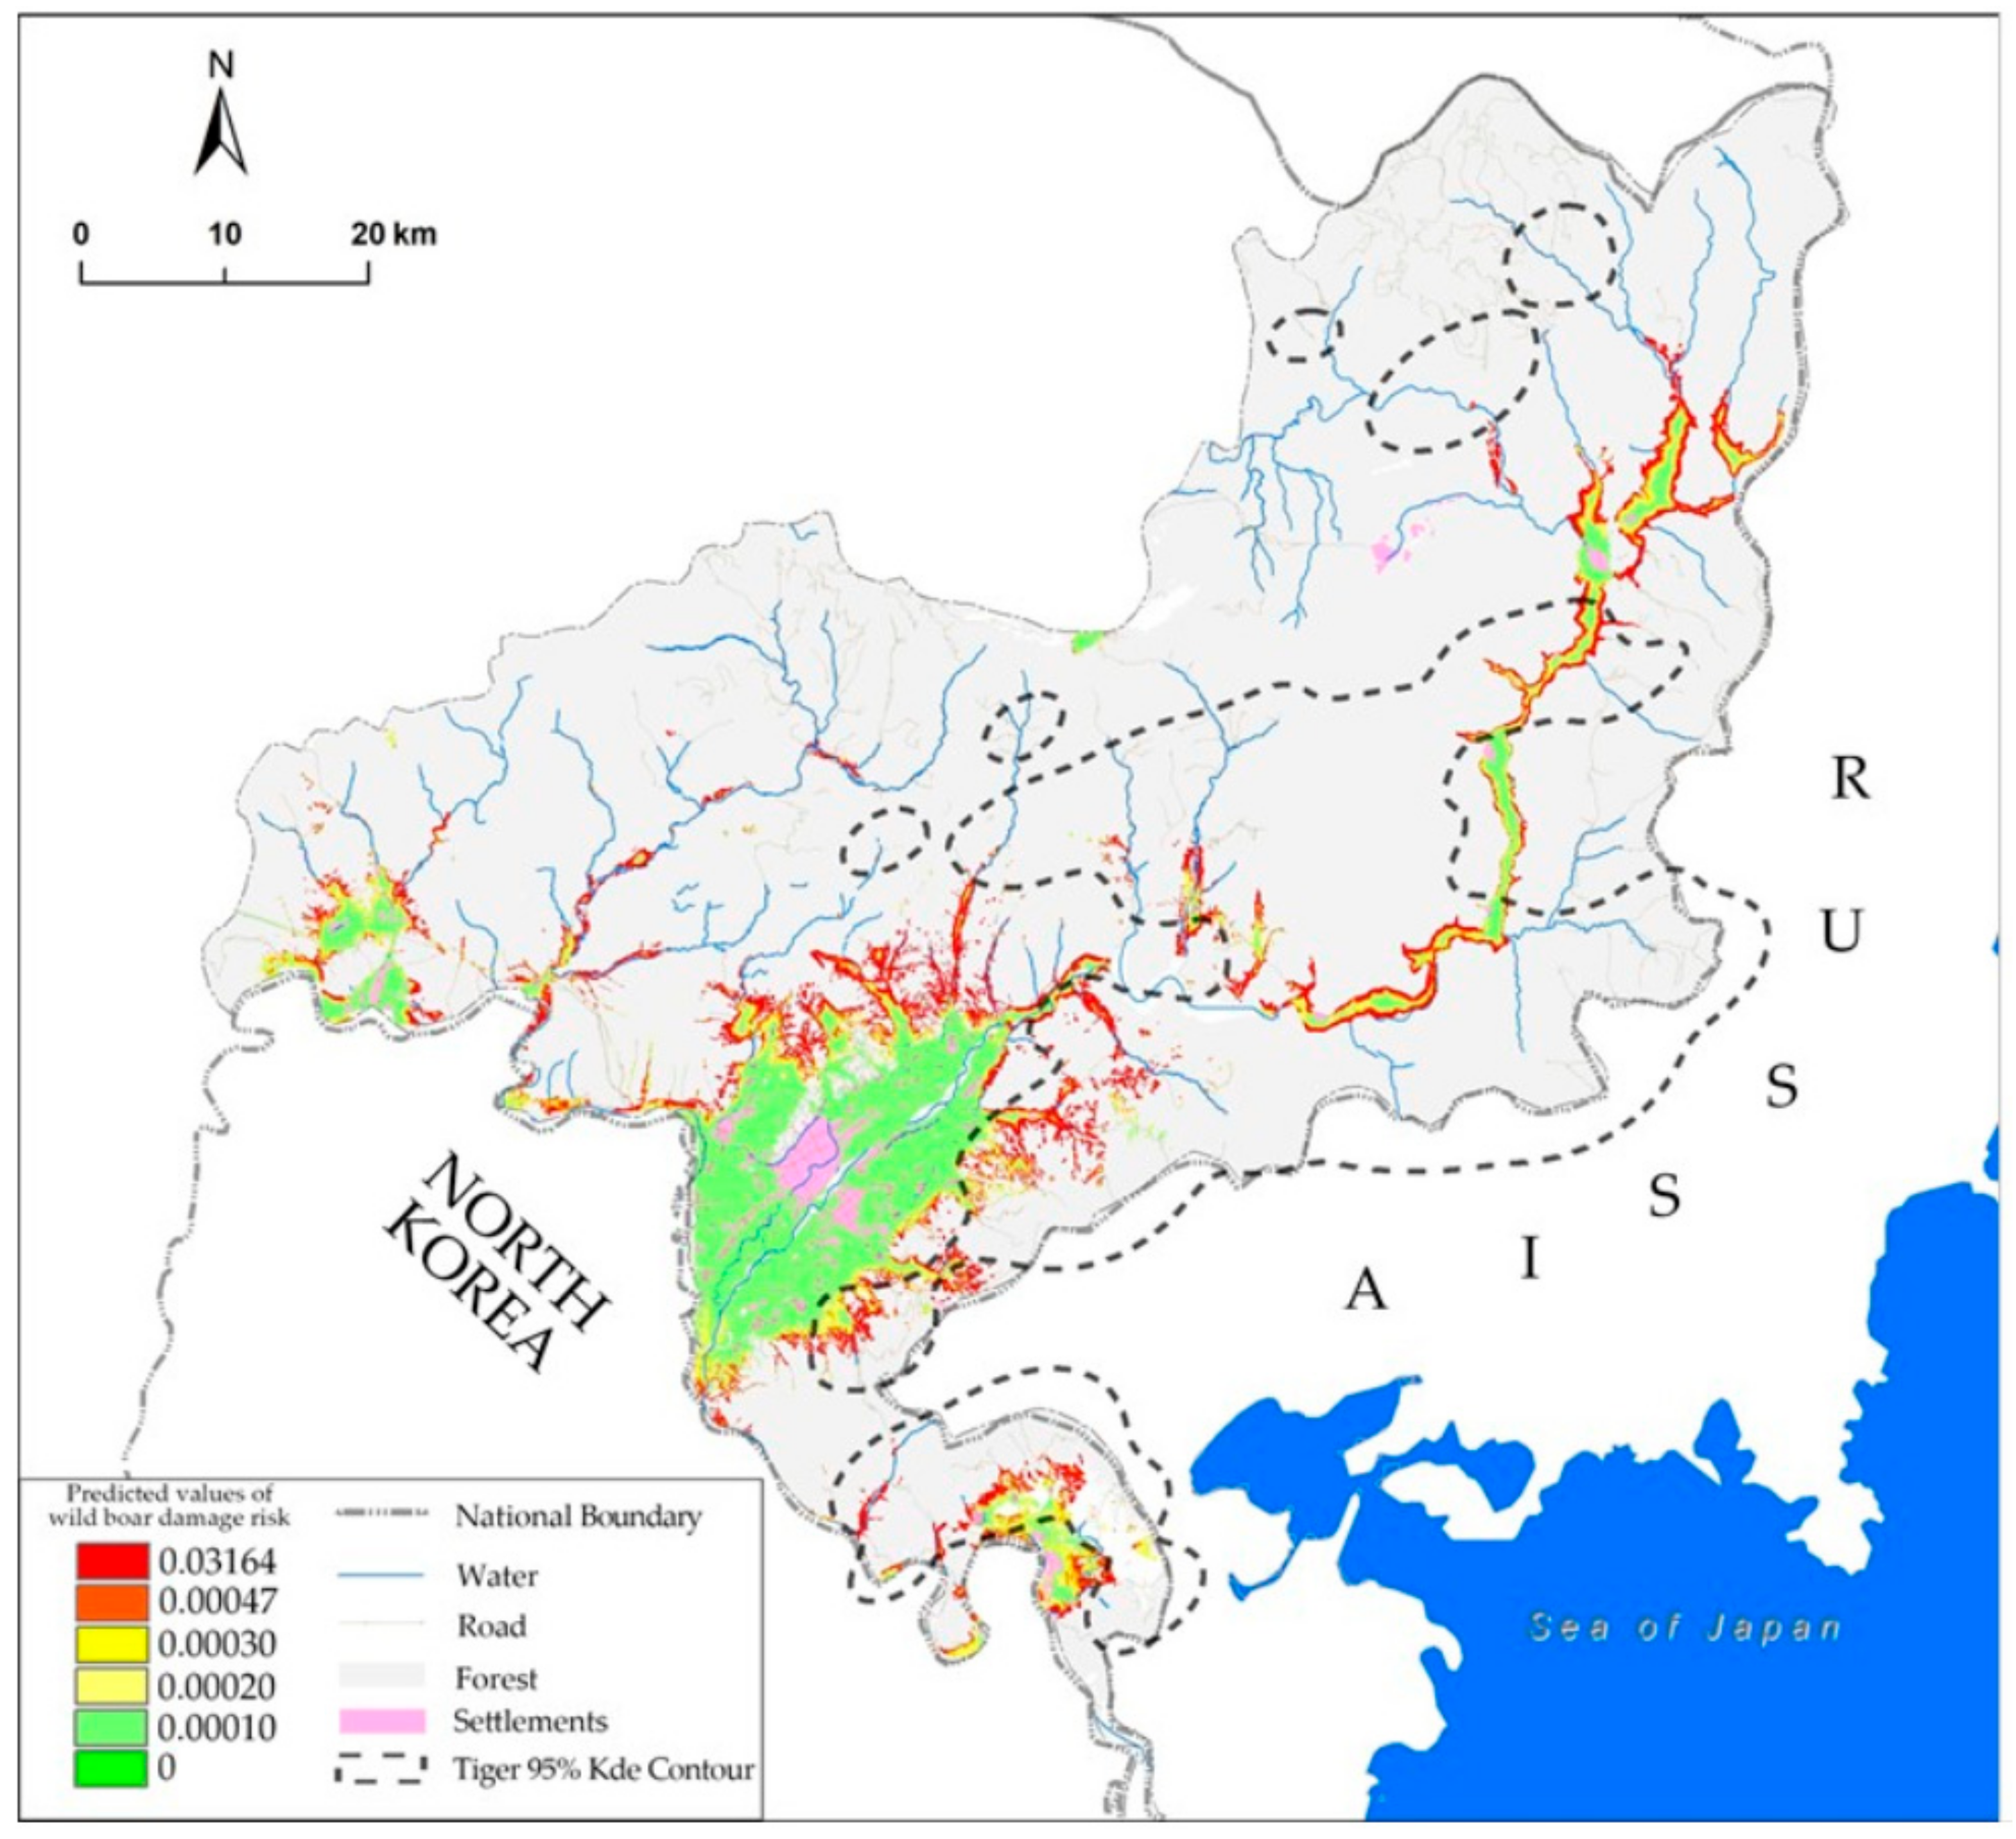
3.3. Spatial Pattern of Wild Boar Damage Risk
4. Discussion
5. Conclusions
Author Contributions
Funding
Institutional Review Board Statement
Data Availability Statement
Acknowledgments
Conflicts of Interest
References
- Herrero, J.; García-Serrano, A.; Couto, S.; Ortuno, V.M.; García-González, R. Diet of wild boar Sus scrofa L. and crop damage in an intensive agroecosystem. Eur. J. Wildl. Res. 2006, 52, 245–250. [Google Scholar] [CrossRef]
- Schley, L.; Dufrêne, M.; Krier, A.; Frantz, A.C. Patterns of crop damage by wild boar (Sus scrofa) in Luxembourg over a 10-year period. Eur. J. Wildl. Res. 2008, 54, 589–599. [Google Scholar] [CrossRef]
- Masayuki, S.; Hiroshi, M.; Tosaku, M.; Seiji, U. Predicting the risk of wild boar damage to rice paddies using presence-only data in Chiba Prefecture, Japan. Int. J. Pest Manag. 2012, 58, 65–71. [Google Scholar]
- Li, L.L.; Shi, J.B.; Wang, J.; Gao, Y.M.; Wang, L.B.; Wang, J.Q.; Ying, X. Factors influencing wild boar damage in Taohongling National Nature Reserve in China: A model approach. Eur. J. Wildl. Res. 2013, 59, 179–184. [Google Scholar] [CrossRef]
- Linkie, M.; Dinata, Y.; Nofrianto, A.; Leader-Williams, N. Patterns and perceptions of wildlife crop raiding in and around Kerinci Seblat National Park, Sumatra. Anim. Conserv. 2007, 10, 127–135. [Google Scholar] [CrossRef]
- Cocca, G.; Sturaro, E.; Dal Compare, L.; Ramanzin, M. Wild boar (Sus scrofa) damages to mountain grassland: A case study in the Belluno province, eastern Italian Alps. Ital. J. Anim. Sci. 2007, 6, 845–847. [Google Scholar] [CrossRef]
- Saito, M.; Momose, H.; Mihira, T. Both environmental factors and countermeasures affect wild boar damage to rice paddies in Boso Peninsula, Japan. Crop Prot. 2011, 30, 1048–1054. [Google Scholar] [CrossRef]
- Ruiz-Fons, F.; Segales, J.; Gortazar, C. A review of viral diseases of the European wild boar: Effects of population dynamics and reservoirs role. Vet. J. 2008, 176, 158–169. [Google Scholar] [CrossRef]
- Meng, X.J.; Lindsay, D.S.; Sriranganathan, N. Wild boars as sources for infectious diseases in livestock and humans. Philos. Trans. R. Soc. B 2009, 364, 2697–2707. [Google Scholar] [CrossRef]
- Blome, S.; Gabriel, C.; Beer, M. Pathogenesis of African swine fever in domestic pigs and European wild boar. Virus Res. 2013, 173, 122–130. [Google Scholar] [CrossRef]
- Sun, L.; Li, W.D.; Ai, P.; Zheng, Z.H.; Ma, Q.F.; Wu, J.C.; Kong, W.Y. The charaters of wildlife damage case and compensation processing assessment in Jilin Province. Chin. J. Wildl. 2015, 36, 48–53. (In Chinese) [Google Scholar]
- Geisser, H.; Reyer, H. Efficiency of hunting, feeding, and fencing to reduce crops damage by wild boars. J. Wildl. Manag. 2004, 68, 939–946. [Google Scholar] [CrossRef]
- Bieber, C.; Ruf, T. Population dynamics in wild boar Sus scrofa: Ecology, elasticity of growth rate and implications for the management of pulsed resource consumers. J. Appl. Ecol. 2005, 42, 1203–1213. [Google Scholar] [CrossRef]
- Calenge, C.; Maillard, D.; Fournier, P.; Fouque, C. Efficiency of spreading maize in the garrigues to reduce wild boar (Sus scrofa) damage to Mediterranean vineyards. Eur. J. Wildl. Res. 2004, 52, 112–120. [Google Scholar] [CrossRef]
- Lavelle, M.J.; Vercauteren, K.C.; Hefley, T.J.; Phillips, G.E.; Hygnstrom, S.E.; Long, D.B.; Ficher, J.W.; Swafford, S.R.; Campbell, T.A. Evaluation of fences for containing feral swine under simulated depopulation conditions. J. Wildl. Manag. 2011, 75, 1200–1208. [Google Scholar] [CrossRef]
- Schlageter, A. Haag-Wackernagel, D. Evaluation of an odor repellent for protecting crops from wild boar damage. J. Pest Sci. 2012, 85, 209–215. [Google Scholar] [CrossRef]
- Schlageter, A.; Haag-Wackernagel, D. Effectiveness of solar blinkers as a means of crop protection from wild boar damage. Crop Prot. 2011, 30, 1216–1222. [Google Scholar] [CrossRef]
- Ficetola, G.F.; Bonard, A.; Mairot, P.; Leronni, V.; Padoa-Schioppa, E. Predicting wild boar damages to croplands in a mosaic of agricultural and natural areas. Curr. Zool. 2014, 60, 170–179. [Google Scholar] [CrossRef]
- Mayor, S.J.; Schneider, D.C.; Schaefer, J.A.; Mahoney, S.P. Habitat selection at multiple scales. Ecoscience 2009, 16, 238–247. [Google Scholar] [CrossRef]
- Thurfjell, H.; John, P.; Ball, J.P.; Kornacher, P.A.; Dettki, H.; Sjöberg, K. Habitat use and spatial patterns of wild boar Sus scrofa (L.): Agricultural fields and edges. Eur. J. Wildl. Res. 2009, 55, 517–523. [Google Scholar] [CrossRef]
- Cai, J.; Jiang, Z.G.; Zeng, Y.; Li, C.W.; Bravery, B.D. Factors affecting crop damage by wild boar and methods of mitigation in a giant panda reserve. Eur. J. Wildl. Res. 2008, 54, 723–728. [Google Scholar] [CrossRef]
- Frackowiak, W.; Gorczyca, S.; Mertaa, D. Wojciuch-Ploskonkaa, M. Factors affecting the level of damage by wild boar in farm land in north-eastern Poland. Pest Manag. Sci. 2013, 69, 362–366. [Google Scholar] [CrossRef]
- Wang, T.M.; Feng, L.M.; Mou, P.; Wu, J.G.; James, L.; Smith, D.; Xiao, W.H.; Yang, H.T.; Dou, H.L.; Zhao, X.D.; et al. Amur tigers and leopards returning to China: Direct evidence and a landscape conservation plan. Landsc. Ecol. 2016, 31, 491–503. [Google Scholar] [CrossRef]
- Hebblewhite, M.; Zimmermann, F.; Li, Z.; Miquelle, D.G.; Zhang, M.; Sun, H.; Mörschel, F.; Wu, Z.; Sheng, L.; Purekhovsky, A.; et al. Is there a future for Amur tigers in a restored tiger conservation landscape in Northeast China? Anim. Conserv. 2012, 15, 579–592. [Google Scholar] [CrossRef]
- Miller, C.S.; Hebblewhite, M.; Petrunenko, Y.K.; Seryodkin, I.V.; Decesare, N.J.; JOHN, M.; Goodrich, J.M.; Miquelle, D.G. Estimating Amur tiger (Panthera tigris altaica) kill rates and potential consumption rates using global positioning system collars. J. Mammal. 2013, 94, 845–855. [Google Scholar] [CrossRef]
- Johnson, D.H. The comparison of usage and availability measurements for evaluating resource preference. Ecology 1980, 61, 65–71. [Google Scholar] [CrossRef]
- Keuling, O.; Stier, N.; Roth, M. Commuting, shifting or remaining? Different spatial utilization patterns of wild boar Sus scrofa L. in forest and field crops during summer. Mamm. Biol. 2009, 74, 145–152. [Google Scholar] [CrossRef]
- Radosavljevic, A.; Anderson, R.P. Making better Maxent models of species distributions: Complexity, overfitting and evaluation. J. Biogeogr. 2014, 41, 629–643. [Google Scholar] [CrossRef]
- Muscarella, R.; Galante, P.J.; Soley-Guardia, M.; Boria, R.A.; Kass, J.M.; Uriarte, M.; Anderson, R.P. ENMeval: An R package for conducting spatially independent evaluations and estimating optimal model complexity for MAXENT ecological niche models. Methods Ecol. Evol. 2014, 5, 1198–1205. [Google Scholar] [CrossRef]
- Wei, J.F.; Li, X.Z.; Lu, Y.Y.; Zhao, L.; Zhang, H.F.; Zhao, Q. Modeling the potential global distribution of phenacoccus madeirensis green under various climate change scenariors. Forests 2019, 10, 773. [Google Scholar] [CrossRef]
- Liu, C.; Berry, M.P.; Dawson, T.P.; Pearson, R.G. Selecting thresholds of occurrence in the prediction of species distributions. Ecography 2005, 28, 385–393. [Google Scholar] [CrossRef]
- Hijmans, R.J.; Phillips, S.; Leathwick, J.; Elith, J. Species Distribution Modeling, R Package Version 1.1-4. 2017. Available online: http://rspatial.org/sdm/ (accessed on 15 March 2017).
- Hawthorne, L.B. Geospatial Modelling Environment, Version 0.7.3. 2012. Available online: http://www.spatialecology.com/gme (accessed on 7 December 2016).
- Warren, D.L.; Seifert, S.N. Ecological niche modeling in Maxent: The importance of model complexity and the performance of model selection criteria. Ecol. Appl. 2011, 21, 335–342. [Google Scholar] [CrossRef] [PubMed]
- Goodrich, J.M.; Seryodkin, I.; Miquelle, D.G.; Bereznuk, S.L. Conflicts between Amur (Siberian) tigers and humans in the Russian Far East. Biol. Conserv. 2011, 144, 584–592. [Google Scholar] [CrossRef]
- Hebblewhit, M.; Miquelle, D.G.; Robinson, H.; Pikunov, D.G.; Dunishenko, Y.M.; Aramilev, V.V.; Nikolaev, I.G.; Salkina, G.P.; Seryodkin, I.V.; Gaponov, V.V.; et al. Including biotic interations with ungulate prey and humans improves habitat conservation modeling for endangered Amur tigers in Russia far east. Biol. Conserv. 2014, 178, 50–64. [Google Scholar] [CrossRef]
- Phillips, S.J.; Anderson, R.P.; Schapire, R.E. Maximum entropy modeling of species geographic distributions. Ecol. Model. 2006, 190, 231–259. [Google Scholar] [CrossRef]
- Phillips, S.J.; Dudík, M. Modeling of species distributions with Maxent: New extensions and a comprehensive evaluation. Ecography 2008, 31, 161–175. [Google Scholar] [CrossRef]
- Jiménez-Valverde, A.; Lobo, J.M.; Hortal, J. Not as good as they seem: The importance of concepts in species distribution modelling. Divers. Distrib. 2008, 14, 885–890. [Google Scholar] [CrossRef]
- Phillips, S.J.; Dudík, M.; Elith, J.; Graham, C.H.; Lehmann, A.; Leathwick, J.; Ferrier, S. Sample selection bias and presence-only distribution models: Implications for background and pseudo-absence data. Ecol. Appl. 2009, 19, 181–197. [Google Scholar] [CrossRef]
- Peterson, A.T.; Soberon, J.; Pearson, R.G.; Anderson, R.P.; Martinez-Meyer, E.; Nakamura, M.; Araujo, M.B. Ecological Niches and Geographic Distributions; Princeton University Press: Princeton, NJ, USA, 2011; pp. 150–152. ISBN 9780691136868. [Google Scholar]
- Phillips, S.J.; Elith, J. POC plots: Calibrating species distribution models with presence-only data. Ecology 2010, 91, 2476–2484. [Google Scholar] [CrossRef]
- Boyce, M.S. Scale for resource selection functions. Divers. Distrib. 2006, 12, 269–276. [Google Scholar] [CrossRef]
- Schneider, D.C.; Norris, M.J.; Gregory, R.S. Predictive analysis of scale-dependent habitat association: Juvenile cod (Gadus spp.) in eastern Newfoundland. Estuar. Coast. Shelf Sci. 2008, 79, 71–78. [Google Scholar] [CrossRef]
- Dayton, P.D.; Tegner, M.J. The importance of scale in community ecology: A kelp forest example with terrestrial analogs. In A New Ecology: Novel Approaches to Interactive Systems; Price, P.W., Slobodchikoff, C.N., Gaud, W.S., Eds.; John Wiley and Sons: New York, NJ, USA, 1984; pp. 457–483. [Google Scholar]
- Emlen, J.M. The role of time and energy in food preference. Am. Nat. 1966, 100, 611–617. [Google Scholar] [CrossRef]
- Orians, G.H.; Wittenberger, J.F. Spatial and temporal scales in habitat selection. Am. Nat. 1991, 137, 29–49. [Google Scholar] [CrossRef]
- Schley, L.; Roper, T.J. Diet of wild boar Sus scrofa in Western Europe, with particular reference to consumption of agricultural crops. Mammal. Rev. 2003, 33, 43–56. [Google Scholar] [CrossRef]
- Dussault, C.; Ouellet, J.P.; Courtois, R.; Huot, J.; Breton, L.; Jolicoeur, H. Linking moose habitat selection to limiting factors. Ecography 2005, 28, 619–628. [Google Scholar] [CrossRef]
- Kong, W.Y.; Zheng, Z.H.; Wu, J.C.; Ning, Y.; Wang, Y.; Han, X.D. Foraging habitat selection of Siberian Crane (Grus leucogeranus) during autumn migration period in the Momoge Nature Reserve. Zool. Res. 2013, 34, 166–173. (In Chinese) [Google Scholar]


| Variable | Percent Contribution (%) |
|---|---|
| Distance to forest edge | 39.13 |
| Forest proportion | 27.80 |
| Deciduous forest proportion | 7.55 |
| Road density | 4.33 |
| River density | 3.67 |
| Farmland proportion | 3.60 |
| Slope | 3.16 |
| Distance to settlement | 2.92 |
| Distance to road | 2.75 |
| Mixed forest proportion | 1.17 |
| Distance to coniferous forest | 1.14 |
| Aspect | 0.95 |
| Settlement proportion | 0.73 |
| Average elevation | 0.59 |
| Distance to mixed forest | 0.15 |
| Distance to deciduous forest | 0.11 |
| Average slope | 0.10 |
| Landscape diversity | 0.09 |
| Coniferous forest proportion | 0.05 |
| Distance to water | 0.01 |
| Elevation | 0.00 |
| Farmland fragmentation | 0.00 |
Publisher’s Note: MDPI stays neutral with regard to jurisdictional claims in published maps and institutional affiliations. |
© 2021 by the authors. Licensee MDPI, Basel, Switzerland. This article is an open access article distributed under the terms and conditions of the Creative Commons Attribution (CC BY) license (https://creativecommons.org/licenses/by/4.0/).
Share and Cite
Jin, Y.; Kong, W.; Yan, H.; Bao, G.; Liu, T.; Ma, Q.; Li, X.; Zou, H.; Zhang, M. Multi-Scale Spatial Prediction of Wild Boar Damage Risk in Hunchun: A Key Tiger Range in China. Animals 2021, 11, 1012. https://doi.org/10.3390/ani11041012
Jin Y, Kong W, Yan H, Bao G, Liu T, Ma Q, Li X, Zou H, Zhang M. Multi-Scale Spatial Prediction of Wild Boar Damage Risk in Hunchun: A Key Tiger Range in China. Animals. 2021; 11(4):1012. https://doi.org/10.3390/ani11041012
Chicago/Turabian StyleJin, Yongchao, Weiyao Kong, Hong Yan, Guangdao Bao, Ting Liu, Qiongfang Ma, Xinhai Li, Hongfei Zou, and Minghai Zhang. 2021. "Multi-Scale Spatial Prediction of Wild Boar Damage Risk in Hunchun: A Key Tiger Range in China" Animals 11, no. 4: 1012. https://doi.org/10.3390/ani11041012
APA StyleJin, Y., Kong, W., Yan, H., Bao, G., Liu, T., Ma, Q., Li, X., Zou, H., & Zhang, M. (2021). Multi-Scale Spatial Prediction of Wild Boar Damage Risk in Hunchun: A Key Tiger Range in China. Animals, 11(4), 1012. https://doi.org/10.3390/ani11041012