
Influence of Strain and Diet on Urinary pH in Laboratory Mice


Abstract
Simple Summary
Abstract
1. Introduction
2. Materials and Methods
2.1. Animals
2.2. Housing
2.3. Feeding Trial
2.4. Sampling
2.5. Statistics
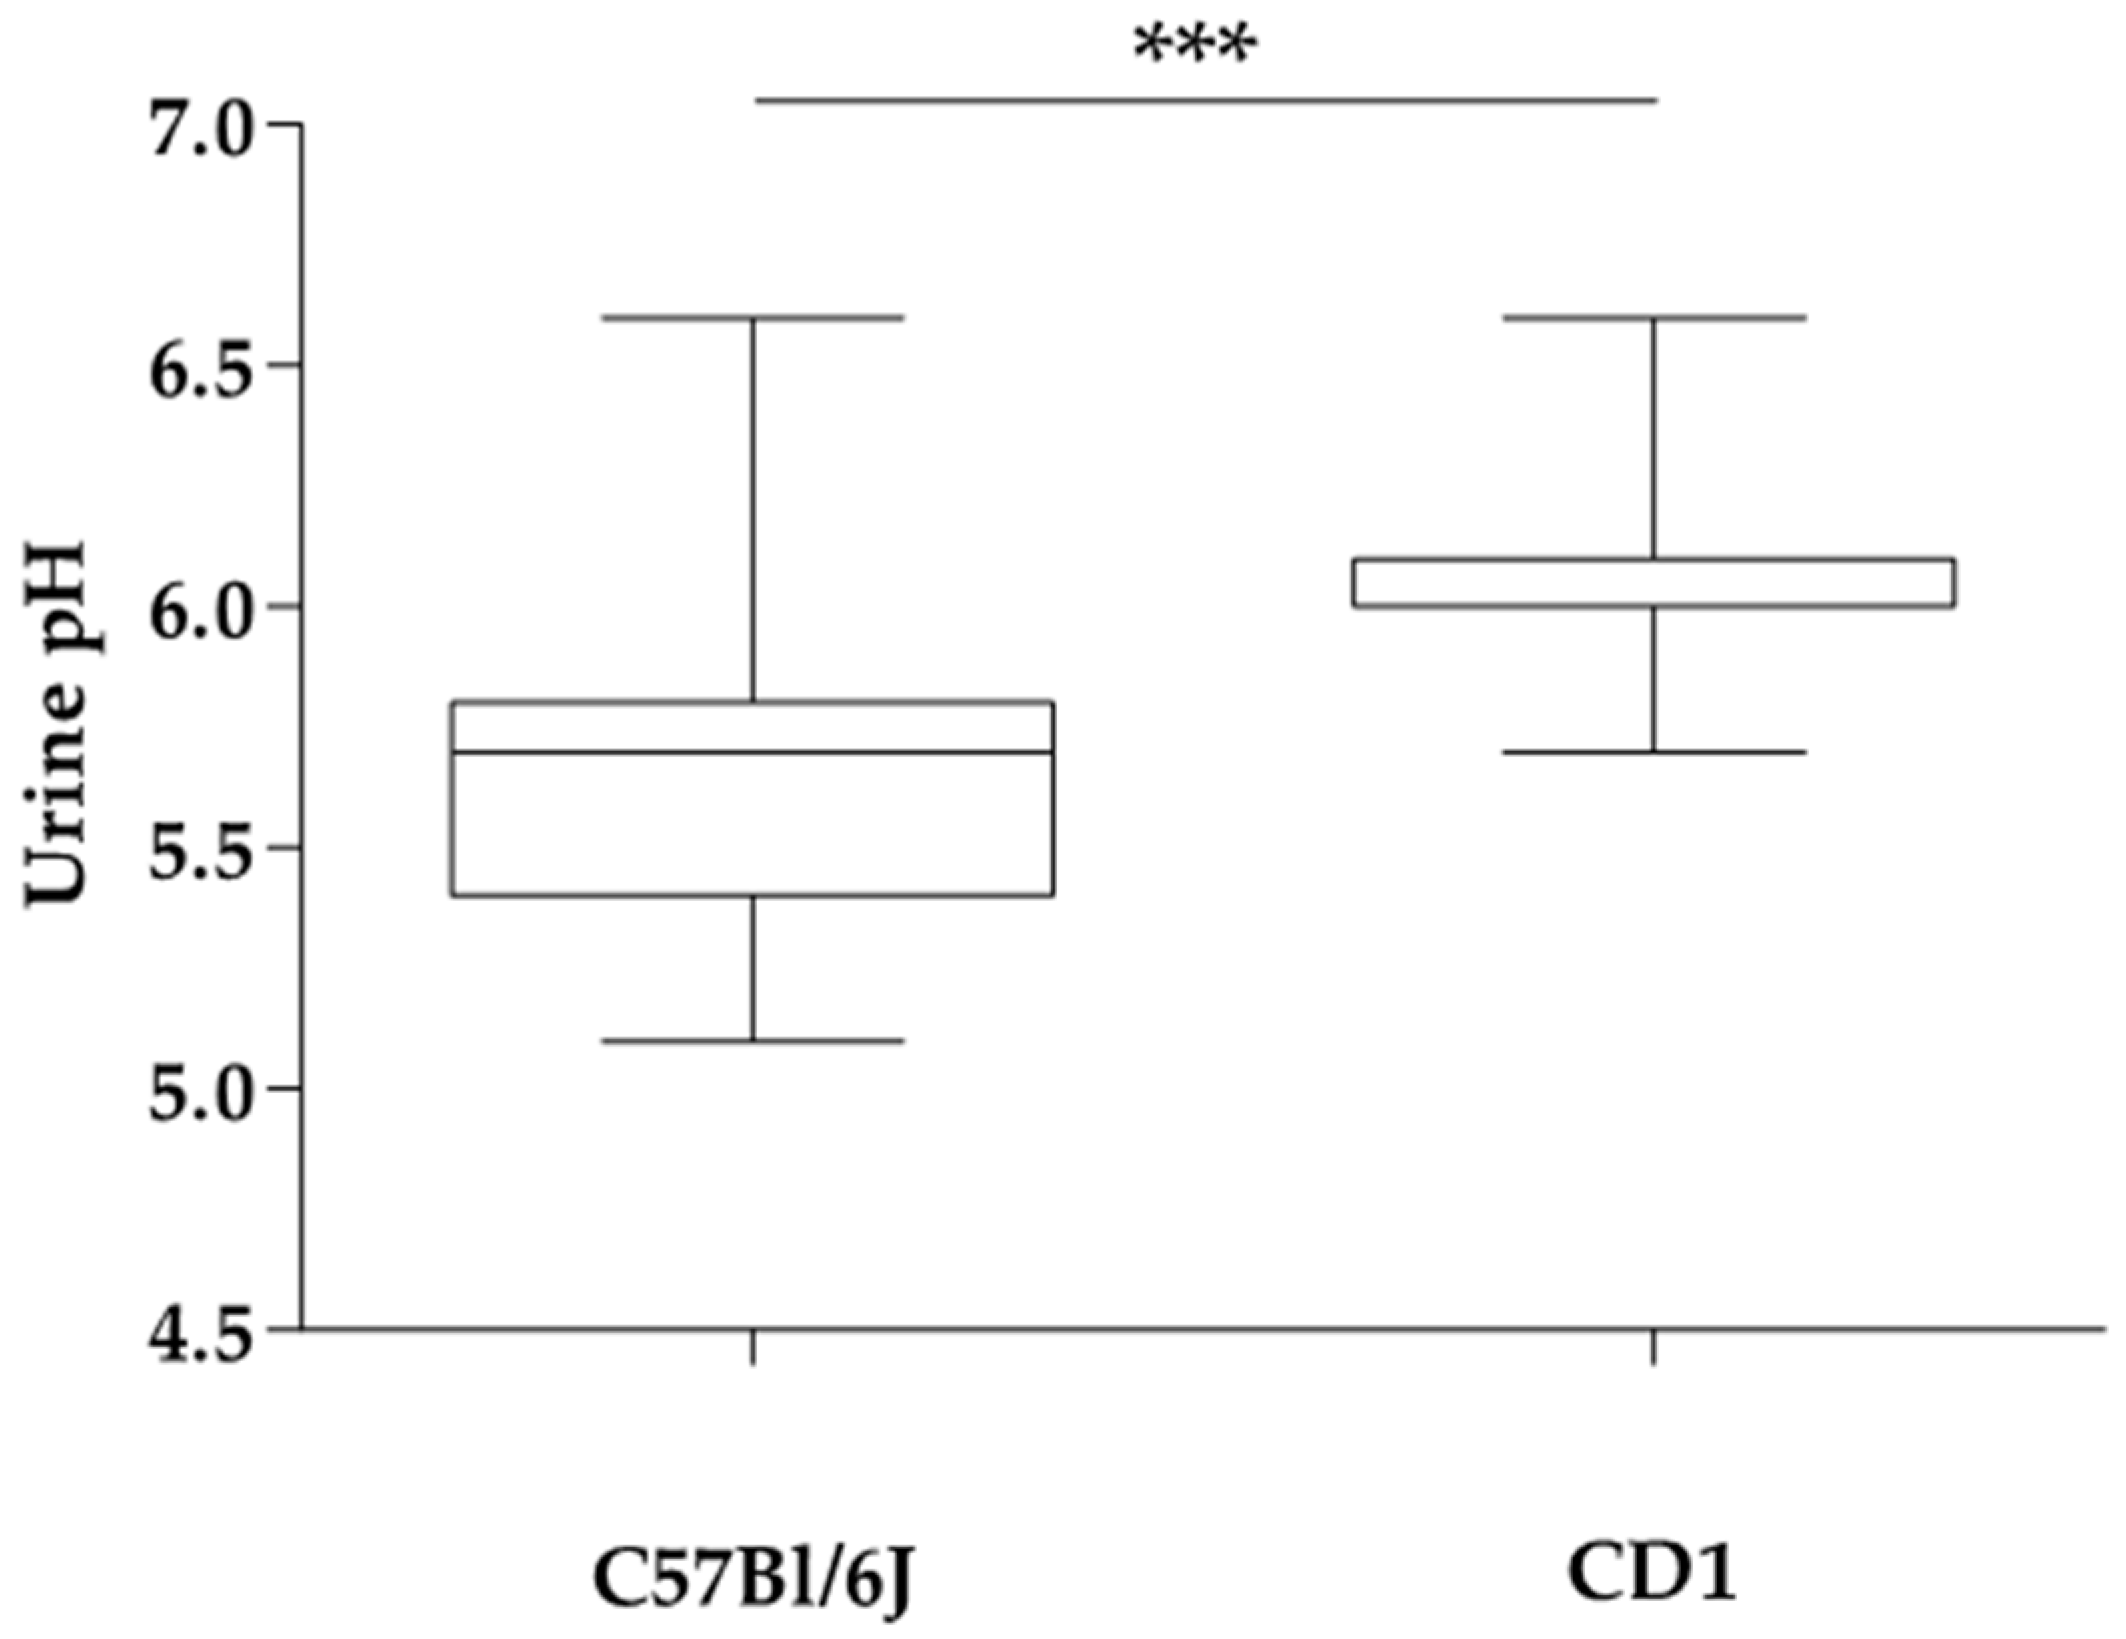
3. Results
4. Discussion
5. Conclusions
Author Contributions
Funding
Institutional Review Board Statement
Data Availability Statement
Acknowledgments
Conflicts of Interest
References
- Beker, S.; Kienzle, E.; Dobenecker, B. Untersuchungen zur Einstellung des Harn-pH-Wertes bei Sauen. Lohmann Int. 1999, 1, 17–19. [Google Scholar]
- Becker, N.; Kienzle, E. Vitamin-a-exzess durch Pferdefleischprodukte mit hohen Leberanteilen. Tierärztliche Prax. Kleintiere 2013, 41, 31–36. [Google Scholar]
- Goren, G.; Fritz, J.; Dillitzer, N.; Hipp, B.; Kienzle, E. Fresh and preserved green fodder modify effects of urinary acidifiers on urine pH of horses. J. Anim. Physiol. Anim. Nutr. 2014, 98, 239–245. [Google Scholar] [CrossRef] [PubMed]
- Heer, F.; Dobenecker, B.; Kienzle, E. Effect of cation–anion balance in feed on urine ph in rabbits in comparison with other species. J. Anim. Physiol. Anim. Nutr. 2017, 101, 1324–1330. [Google Scholar] [CrossRef] [PubMed]
- Kienzle, E.; Schuknecht, A.; Meyer, H. Influence of food composition on the urine pH in cats. J. Nutr. 1991, 121, S87–S88. [Google Scholar] [CrossRef] [PubMed]
- Kienzle, E.; Sturmer, K.; Ranz, D.; Clauss, M. A high roughage/concentrate ratio decreases the effect of ammonium chloride on acid-base balance in horses. J. Nutr. 2006, 136, 2048S–2049S. [Google Scholar] [CrossRef] [PubMed]
- Kienzle, E.; Wilms-Eilers, S. Struvite diet in cats: Effect of ammonium chloride and carbonates on acid base balance of cats. J. Nutr. 1994, 124, 2652S–2659S. [Google Scholar] [CrossRef] [PubMed]
- Kienzle, E.; Wilms-Eilers, S. Struvite calculi dietetics: 2. Effect of ammonium chloride and carbonates on the acid-base and mineral balance of cats. Dtw. Dtsch. Tierarztl. Wochenschr. 1993, 100, 399–405. [Google Scholar]
- Yamka, R.M.; Mickelsen, S.L. The prediction of urine ph using dietary cations and anions in dogs fed dry and wet foods. Int. J. Appl. Res. Vet. Med. 2006, 4, 355. [Google Scholar]
- Sturgess, K. Dietary management of canine urolithiasis. Practice 2009, 31, 306–312. [Google Scholar] [CrossRef]
- Kamphues, J. The dcab concept in prevention of hypocalcemia. Uebersichten Tierernaehrung 1996, 24, 129–135. [Google Scholar]
- Espino, L.; Guerrero, F.; Suarez, M.; Santamarina, G.; Goicoa, A.; Fidalgo, L. Long-term effects of dietary anion–cation balance on acid–base status and bone morphology in reproducing ewes. J. Vet. Med. Ser. A 2003, 50, 488–495. [Google Scholar] [CrossRef]
- MacLeay, J.M.; Olson, J.D.; Turner, A.S. Effect of dietary-induced metabolic acidosis and ovariectomy on bone mineral density and markers of bone turnover. J. Bone Miner. Metab. 2004, 22, 561–568. [Google Scholar] [CrossRef]
- Kraut, J.A.; Mishler, D.R.; Singer, F.R.; Goodman, W.G. The effects of metabolic acidosis on bone formation and bone resorption in the rat. Kidney Int. 1986, 30, 694–700. [Google Scholar] [CrossRef] [PubMed]
- Beck, N.; Webster, S.K. Effects of acute metabolic acidosis on parathyroid hormone action and calcium mobilization. Am. J. Physiol. Leg. Content 1976, 230, 127–131. [Google Scholar] [CrossRef]
- Wiederkehr, M. Metabolic and endocrine effects of metabolic acidosis in humans. Swiss Med Wkly. 2001, 131, 127–132. [Google Scholar]
- Ambühl, P.M.; Zajicek, H.K.; Wang, H.; Puttaparthi, K.; Levi, M. Regulation of renal phosphate transport by acute and chronic metabolic acidosis in the rat. Kidney Int. 1998, 53, 1288–1298. [Google Scholar] [CrossRef] [PubMed]
- Meghji, S.; Morrison, M.S.; Henderson, B.; Arnett, T.R. Ph dependence of bone resorption: Mouse calvarial osteoclasts are activated by acidosis. Am. J. Physiol. Endocrinol. Metab. 2001, 280, E112–E119. [Google Scholar] [CrossRef]
- Frick, K.K.; Bushinsky, D.A. Chronic metabolic acidosis reversibly inhibits extracellular matrix gene expression in mouse osteoblasts. Am. J. Physiol. Ren. Physiol. 1998, 275, F840–F847. [Google Scholar] [CrossRef]
- Wagner, C.A. Metabolic acidosis: New insights from mouse models. Curr. Opin. Nephrol. Hypertens. 2007, 16, 471–476. [Google Scholar] [CrossRef]
- Cantone, A.; Wang, T.; Pica, A.; Simeoni, M.; Capasso, G. Use of transgenic mice in acid-base balance studies. J. Nephrol. 2006, 19, S121. [Google Scholar] [PubMed]
- Taube, V.A.; Rohn, K.; Kreienbrock, L.; Kamphues, J. Individual differences in the phosphorus metabolism of fattening bulls–testing effects of crude fibre and calcium chloride in the diet. Arch. Anim. Nutr. 2010, 64, 111–120. [Google Scholar] [CrossRef]
- Looff, M. Einflüsse der Fütterung auf Die Regulative Phosphorausscheidung bei Ziegenlämmern. Ph.D. Thesis, Tierärztliche Hochschule Hannover, Hannover, Germany, 2005. [Google Scholar]
- Field, A.; Woolliams, J. Genetic control of phosphorus metabolism in sheep. Can. J. Anim. Sci. 1984, 64, 232–233. [Google Scholar] [CrossRef]
- Field, A.; Woolliams, J.; Dingwall, R.; Munro, C. Animal and dietary variation in the absorption and metabolism of phosphorus by sheep. J. Agric. Sci. 1984, 103, 283–291. [Google Scholar] [CrossRef]
- Reisinger, A.J.; Tannehill-Gregg, S.H.; Waites, C.R.; Dominick, M.A.; Schilling, B.E.; Jackson, T.A. Dietary ammonium chloride for the acidification of mouse urine. J. Am. Assoc. Lab. Anim. Sci. 2009, 48, 144–146. [Google Scholar]
- Kurien, B.T.; Everds, N.E.; Scofield, R.H. Experimental animal urine collection: A review. Lab. Anim. 2004, 38, 333–361. [Google Scholar] [CrossRef]
- Kurien, B.T.; Scofield, R.H. Mouse urine collection using clear plastic wrap. Lab. Anim. 1999, 33, 83–86. [Google Scholar] [CrossRef]
- Langendorf, H. Säure-Basen-Gleichgewicht und chronisch acidogene und alkalogene Ernährung. Z. Ernaehrungswiss. Suppl. 1963, 2. [Google Scholar]
- Böswald, L.F.; Wenderlein, J.; Straubinger, R.K.; Ulrich, S.U.; Kienzle, E. Processing matters in nutrient matched laboratory diets for mice—Energy and nutrient digestibility. Animals 2021, 11, 523. [Google Scholar] [CrossRef]


| Diet A | Diet B | Diet C | |
|---|---|---|---|
| Dry matter (% as fed) | 90.0 | 88.9 | 86.9 |
| Calcium (% as fed) | 0.62 | 0.96 | 0.61 |
| Phosphorus (% as fed) | 0.55 | 0.69 | 0.60 |
| Magnesium (% as fed) | 0.14 | 0.24 | 0.01 |
| Potassium (% as fed) | 0.56 | 0.80 | 0.39 |
| Sodium (% as fed) | 0.20 | 0.21 | 0.11 |
| Chloride (% as fed) | 0.53 | 0.50 | 0.46 |
| Sulfur (% as fed) | 030 | 0.33 | 0.32 |
| DCAB (mmol/kg DM) | −7 | 246 | −257 |
| C57Bl/6J | CD1 | |||||
|---|---|---|---|---|---|---|
| Diet A | Diet B | Diet C | Diet A | Diet B | Diet C | |
| Initial BW (g) | 23.2 a ± 1.5 | 23.6 a ± 1.6 | 23.2 a ± 1.6 | 37.0 b ± 3.2 | 38.7 b ± 4.0 | 37.4 b ± 2.5 |
| Final BW (g) | 28.0 a ± 1.3 | 27.2 a ± 1.5 | 28.5 a ± 1.5 | 43.5 b ± 5.0 | 44.6 b ± 6.1 | 45.4 b ± 5.5 |
| BW gain (% initial BW) | 20.9 a,b ± 8.6 | 15.6 b,c ± 5.0 | 23.0 a ± 5.3 | 17.4 b,d ± 5.5 | 14.9 c ± 6.6 | 21.1 a,c,d ± 9.6 |
| C57Bl/6J | CD1 | |||||
|---|---|---|---|---|---|---|
| Diet A | Diet B | Diet C | Diet A | Diet B | Diet C | |
| Urine pH | 5.7 a ± 0.2 | 6.3 b ± 0.4 | 5.6 b ± 0.2 | 6.3 c ± 0.5 | 7.1 a ± 0.3 | 5.6 b ± 0.2 |
Publisher’s Note: MDPI stays neutral with regard to jurisdictional claims in published maps and institutional affiliations. |
© 2021 by the authors. Licensee MDPI, Basel, Switzerland. This article is an open access article distributed under the terms and conditions of the Creative Commons Attribution (CC BY) license (http://creativecommons.org/licenses/by/4.0/).
Share and Cite
Böswald, L.F.; Matzek, D.; Kienzle, E.; Popper, B. Influence of Strain and Diet on Urinary pH in Laboratory Mice. Animals 2021, 11, 702. https://doi.org/10.3390/ani11030702
Böswald LF, Matzek D, Kienzle E, Popper B. Influence of Strain and Diet on Urinary pH in Laboratory Mice. Animals. 2021; 11(3):702. https://doi.org/10.3390/ani11030702
Chicago/Turabian StyleBöswald, Linda F., Dana Matzek, Ellen Kienzle, and Bastian Popper. 2021. "Influence of Strain and Diet on Urinary pH in Laboratory Mice" Animals 11, no. 3: 702. https://doi.org/10.3390/ani11030702
APA StyleBöswald, L. F., Matzek, D., Kienzle, E., & Popper, B. (2021). Influence of Strain and Diet on Urinary pH in Laboratory Mice. Animals, 11(3), 702. https://doi.org/10.3390/ani11030702