
Dissecting the Gene Expression Networks Associated with Variations in the Major Components of the Fatty Acid Semimembranosus Muscle Profile in Large White Heavy Pigs

 , and
, and 
Abstract
Simple Summary
Abstract
1. Introduction
2. Materials and Methods
2.1. Sampling and Phenotypes
2.2. RNA Extraction, Library Preparation, and Sequencing
2.3. Mapping, Assembly of the Reads, and Production of the Gene Count Matrix
2.4. Weighted Gene Correlation Network Analysis (WGCNA)
2.5. Functional Enrichment Analysis of the Genes in the Significant Modules
3. Results
3.1. Descriptive Statistics
3.2. Mapping Results and Weighted Gene Co-Expression Network Analysis
3.3. Functional Enrichment Analyses
4. Discussion
5. Conclusions
Supplementary Materials
Author Contributions
Funding
Institutional Review Board Statement
Data Availability Statement
Acknowledgments
Conflicts of Interest
References
- OECD. Meat. In OECD-FAO Agricultural Outlook 2016-2025; OECD Publishing: Paris, France, 2016. [Google Scholar] [CrossRef]
- Dalle Zotte, A.; Brugiapaglia, A.; Cullere, M. What Is Meat in Italy? Anim. Front. 2017, 7, 63–70. [Google Scholar] [CrossRef]
- Ismea Mercati—Carni—Carne Suina e Salumi. Available online: http://www.ismeamercati.it/carni/carne-suina-salumi (accessed on 11 November 2020).
- Bosi, P.; Russo, V. The Production of the Heavy Pig for High Quality Processed Products. Ital. J. Anim. Sci. 2004, 3, 309–321. [Google Scholar] [CrossRef]
- Fiego, D.P.L.; Macchioni, P.; Minelli, G.; Santoro, P. Lipid Composition of Covering and Intramuscular Fat in Pigs at Different Slaughter Age. Ital. J. Anim. Sci. 2010, 9, e39. [Google Scholar] [CrossRef]
- Wood, J.D.; Enser, M.; Fisher, A.V.; Nute, G.R.; Sheard, P.R.; Richardson, R.I.; Hughes, S.I.; Whittington, F.M. Fat Deposition, Fatty Acid Composition and Meat Quality: A Review. Meat Sci. 2008, 78, 343–358. [Google Scholar] [CrossRef] [PubMed]
- Caggiula, A.W.; Mustad, V.A. Effects of Dietary Fat and Fatty Acids on Coronary Artery Disease Risk and Total and Lipoprotein Cholesterol Concentrations: Epidemiologic Studies. Am. J. Clin. Nutr. 1997, 65, 1597S–1610S. [Google Scholar] [CrossRef] [PubMed]
- Simopoulos, A.P. The Importance of the Omega-6/Omega-3 Fatty Acid Ratio in Cardiovascular Disease and Other Chronic Diseases. Exp. Biol. Med. Maywood NJ 2008, 233, 674–688. [Google Scholar] [CrossRef]
- Lo Fiego, D.P.; Santoro, P.; Macchioni, P.; De Leonibus, E. Influence of Genetic Type, Live Weight at Slaughter and Carcass Fatness on Fatty Acid Composition of Subcutaneous Adipose Tissue of Raw Ham in the Heavy Pig. Meat Sci. 2005, 69, 107–114. [Google Scholar] [CrossRef]
- Kim, Y.M.; Choi, T.J.; Ho Cho, K.; Cho, E.S.; Lee, J.J.; Chung, H.J.; Baek, S.Y.; Jeong, Y.D. Effects of Sex and Breed on Meat Quality and Sensory Properties in Three-Way Crossbred Pigs Sired by Duroc or by a Synthetic Breed Based on a Korean Native Breed. Korean J. Food Sci. Anim. Resour. 2018, 38, 544–553. [Google Scholar] [CrossRef]
- Zappaterra, M.; Catillo, G.; Belmonte, A.M.; Lo Fiego, D.P.; Zambonelli, P.; Steri, R.; Buttazzoni, L.; Davoli, R. Genetic Parameters of Muscle Fatty Acid Profile in a Purebred Large White Heavy Pig Population. Meat Sci. 2020, 163, 108057. [Google Scholar] [CrossRef]
- Catillo, G.; Zappaterra, M.; Zambonelli, P.; Buttazzoni, L.; Steri, R.; Minelli, G.; Davoli, R. Genome-Wide Association Study Identifies Quantitative Trait Loci Regions Involved in Muscle Acidic Profile in Large White Heavy Pigs. Animal 2020, 14, 1342–1350. [Google Scholar] [CrossRef] [PubMed]
- Zappaterra, M.; Gioiosa, S.; Chillemi, G.; Zambonelli, P.; Davoli, R. Muscle Transcriptome Analysis Identifies Genes Involved in Ciliogenesis and the Molecular Cascade Associated with Intramuscular Fat Content in Large White Heavy Pigs. PLoS ONE 2020, 15, e0233372. [Google Scholar] [CrossRef]
- Trapnell, C.; Roberts, A.; Goff, L.; Pertea, G.; Kim, D.; Kelley, D.R.; Pimentel, H.; Salzberg, S.L.; Rinn, J.L.; Pachter, L. Differential Gene and Transcript Expression Analysis of RNA-Seq Experiments with TopHat and Cufflinks. Nat. Protoc. 2012, 7, 562–578. [Google Scholar] [CrossRef] [PubMed]
- Puig-Oliveras, A.; Ramayo-Caldas, Y.; Corominas, J.; Estellé, J.; Pérez-Montarelo, D.; Hudson, N.J.; Casellas, J.; Folch, J.M.; Ballester, M. Differences in Muscle Transcriptome among Pigs Phenotypically Extreme for Fatty Acid Composition. PLoS ONE 2014, 9, e99720. [Google Scholar] [CrossRef] [PubMed]
- Zhang, J.; Cui, L.; Ma, J.; Chen, C.; Yang, B.; Huang, L. Transcriptome Analyses Reveal Genes and Pathways Associated with Fatty Acid Composition Traits in Pigs. Anim. Genet. 2017, 48, 645–652. [Google Scholar] [CrossRef]
- Piórkowska, K.; Żukowski, K.; Ropka-Molik, K.; Tyra, M.; Gurgul, A.; Piórkowska, K.; Żukowski, K.; Ropka-Molik, K.; Tyra, M.; Gurgul, A. A Comprehensive Transcriptome Analysis of Skeletal Muscles in Two Polish Pig Breeds Differing in Fat and Meat Quality Traits. Genet. Mol. Biol. 2018, 41, 125–136. [Google Scholar] [CrossRef]
- Schleinitz, D.; Krause, K.; Wohland, T.; Gebhardt, C.; Linder, N.; Stumvoll, M.; Blüher, M.; Bechmann, I.; Kovacs, P.; Gericke, M.; et al. Identification of Distinct Transcriptome Signatures of Human Adipose Tissue from Fifteen Depots. Eur. J. Hum. Genet. 2020, 28, 1714–1725. [Google Scholar] [CrossRef] [PubMed]
- Zambonelli, P.; Gaffo, E.; Zappaterra, M.; Bortoluzzi, S.; Davoli, R. Transcriptional Profiling of Subcutaneous Adipose Tissue in Italian Large White Pigs Divergent for Backfat Thickness. Anim. Genet. 2016, 47, 306–323. [Google Scholar] [CrossRef] [PubMed]
- Li, M.; Wu, H.; Wang, T.; Xia, Y.; Jin, L.; Jiang, A.; Zhu, L.; Chen, L.; Li, R.; Li, X. Co-Methylated Genes in Different Adipose Depots of Pig Are Associated with Metabolic, Inflammatory and Immune Processes. Int. J. Biol. Sci. 2012, 8, 831–837. [Google Scholar] [CrossRef]
- Borkman, M.; Storlien, L.H.; Pan, D.A.; Jenkins, A.B.; Chisholm, D.J.; Campbell, L.V. The Relation between Insulin Sensitivity and the Fatty-Acid Composition of Skeletal-Muscle Phospholipids. N. Engl. J. Med. 1993, 328, 238–244. [Google Scholar] [CrossRef]
- Garaulet, M.; Pérez-Llamas, F.; Pérez-Ayala, M.; Martínez, P.; de Medina, F.S.; Tebar, F.J.; Zamora, S. Site-Specific Differences in the Fatty Acid Composition of Abdominal Adipose Tissue in an Obese Population from a Mediterranean Area: Relation with Dietary Fatty Acids, Plasma Lipid Profile, Serum Insulin, and Central Obesity. Am. J. Clin. Nutr. 2001, 74, 585–591. [Google Scholar] [CrossRef]
- Garaulet, M.; Hernandez-Morante, J.J.; Lujan, J.; Tebar, F.J.; Zamora, S. Relationship between Fat Cell Size and Number and Fatty Acid Composition in Adipose Tissue from Different Fat Depots in Overweight/Obese Humans. Int. J. Obes. 2006, 30, 899–905. [Google Scholar] [CrossRef] [PubMed]
- Kriketos, A.D.; Pan, D.A.; Lillioja, S.; Cooney, G.J.; Baur, L.A.; Milner, M.R.; Sutton, J.R.; Jenkins, A.B.; Bogardus, C.; Storlien, L.H. Interrelationships between Muscle Morphology, Insulin Action, and Adiposity. Am. J. Physiol. 1996, 270, R1332–R1339. [Google Scholar] [CrossRef]
- Davoli, R.; Luise, D.; Mingazzini, V.; Zambonelli, P.; Braglia, S.; Serra, A.; Russo, V. Genome-Wide Study on Intramuscular Fat in Italian Large White Pig Breed Using the PorcineSNP60 BeadChip. J. Anim. Breed. Genet. 2016, 133, 277–282. [Google Scholar] [CrossRef] [PubMed]
- Association of Official Analytical Chemists (AOAC). Official Methods of Analysis, Method 920.39, Fat (Crude) or Ether Extract in Animal Feed, 18th ed.; AOAC: Gaithersburg, MD, USA, 2005. [Google Scholar]
- Bolger, A.M.; Lohse, M.; Usadel, B. Trimmomatic: A Flexible Trimmer for Illumina Sequence Data. Bioinforma. Oxf. Engl. 2014, 30, 2114–2120. [Google Scholar] [CrossRef]
- Kim, D.; Langmead, B.; Salzberg, S.L. HISAT: A Fast Spliced Aligner with Low Memory Requirements. Nat. Methods 2015, 12, 357–360. [Google Scholar] [CrossRef] [PubMed]
- Pertea, M.; Pertea, G.M.; Antonescu, C.M.; Chang, T.-C.; Mendell, J.T.; Salzberg, S.L. StringTie Enables Improved Reconstruction of a Transcriptome from RNA-Seq Reads. Nat. Biotechnol. 2015, 33, 290–295. [Google Scholar] [CrossRef] [PubMed]
- Anders, S.; Pyl, P.T.; Huber, W. HTSeq--A Python Framework to Work with High-Throughput Sequencing Data. Bioinforma. Oxf. Engl. 2015, 31, 166–169. [Google Scholar] [CrossRef]
- Love, M.I.; Huber, W.; Anders, S. Moderated estimation of fold change and dispersion for RNA-seq data with DESeq2. Genome Biol. 2014, 15, 550. [Google Scholar] [CrossRef]
- R Core Team. R: A Language and Environment for Statistical Computing; R Foundation for Statistical Computing: Vienna, Austria, 2020. [Google Scholar]
- Langfelder, P.; Horvath, S. WGCNA: An R Package for Weighted Correlation Network Analysis. BMC Bioinform. 2008, 9, 559. [Google Scholar] [CrossRef]
- Pampouille, E.; Hennequet-Antier, C.; Praud, C.; Juanchich, A.; Brionne, A.; Godet, E.; Bordeau, T.; Fagnoul, F.; Le Bihan-Duval, E.; Berri, C. Differential Expression and Co-Expression Gene Network Analyses Reveal Molecular Mechanisms and Candidate Biomarkers Involved in Breast Muscle Myopathies in Chicken. Sci. Rep. 2019, 9, 14905. [Google Scholar] [CrossRef]
- Huang, D.W.; Sherman, B.T.; Lempicki, R.A. Systematic and Integrative Analysis of Large Gene Lists Using DAVID Bioinformatics Resources. Nat. Protoc. 2009, 4, 44–57. [Google Scholar] [CrossRef]
- Shannon, P.; Markiel, A.; Ozier, O.; Baliga, N.S.; Wang, J.T.; Ramage, D.; Amin, N.; Schwikowski, B.; Ideker, T. Cytoscape: A Software Environment for Integrated Models of Biomolecular Interaction Networks. Genome Res. 2003, 13, 2498–2504. [Google Scholar] [CrossRef]
- Bindea, G.; Mlecnik, B.; Hackl, H.; Charoentong, P.; Tosolini, M.; Kirilovsky, A.; Fridman, W.-H.; Pagès, F.; Trajanoski, Z.; Galon, J. ClueGO: A Cytoscape Plug-in to Decipher Functionally Grouped Gene Ontology and Pathway Annotation Networks. Bioinformatics 2009, 25, 1091–1093. [Google Scholar] [CrossRef] [PubMed]
- Bindea, G.; Galon, J.; Mlecnik, B. CluePedia Cytoscape Plugin: Pathway Insights Using Integrated Experimental and in Silico Data. Bioinforma. Oxf. Engl. 2013, 29, 661–663. [Google Scholar] [CrossRef] [PubMed]
- Ros-Freixedes, R.; Reixach, J.; Bosch, L.; Tor, M.; Estany, J. Genetic Correlations of Intramuscular Fat Content and Fatty Acid Composition among Muscles and with Subcutaneous Fat in Duroc Pigs1. J. Anim. Sci. 2014, 92, 5417–5425. [Google Scholar] [CrossRef] [PubMed]
- Ros-Freixedes, R.; Reixach, J.; Tor, M.; Estany, J. Expected Genetic Response for Oleic Acid Content in Pork1. J. Anim. Sci. 2012, 90, 4230–4238. [Google Scholar] [CrossRef] [PubMed]
- Fernandez, M.L.; West, K.L. Mechanisms by Which Dietary Fatty Acids Modulate Plasma Lipids. J. Nutr. 2005, 135, 2075–2078. [Google Scholar] [CrossRef]
- De Smet, S.; Raes, K.; Demeyer, D. Meat Fatty Acid Composition as Affected by Fatness and Genetic Factors: A Review. Anim. Res. 2004, 53, 81–98. [Google Scholar] [CrossRef]
- Sampath, H.; Ntambi, J.M. The Fate and Intermediary Metabolism of Stearic Acid. Lipids 2005, 40, 1187–1191. [Google Scholar] [CrossRef]
- Wood, J.D. 20—Fat deposition and the quality of fat tissue in meat animals. In Fats in Animal Nutrition; Wiseman, J., Ed.; Butterworth-Heinemann: London, UK, 1984; pp. 407–435. ISBN 978-0-408-10864-5. [Google Scholar]
- Hausman, G.J.; Dodson, M.V.; Ajuwon, K.; Azain, M.; Barnes, K.M.; Guan, L.L.; Jiang, Z.; Poulos, S.P.; Sainz, R.D.; Smith, S.; et al. BOARD-INVITED REVIEW: The Biology and Regulation of Preadipocytes and Adipocytes in Meat Animals1,2. J. Anim. Sci. 2009, 87, 1218–1246. [Google Scholar] [CrossRef]
- Hamill, R.M.; Aslan, O.; Mullen, A.M.; O’Doherty, J.V.; McBryan, J.; Morris, D.G.; Sweeney, T. Transcriptome Analysis of Porcine M. Semimembranosus Divergent in Intramuscular Fat as a Consequence of Dietary Protein Restriction. BMC Genom. 2013, 14, 453. [Google Scholar] [CrossRef]
- Wood, J.D.; Richardson, R.I.; Nute, G.R.; Fisher, A.V.; Campo, M.M.; Kasapidou, E.; Sheard, P.R.; Enser, M. Effects of Fatty Acids on Meat Quality: A Review. Meat Sci. 2004, 66, 21–32. [Google Scholar] [CrossRef]
- Jun, D.W.; Cho, W.K.; Jun, J.H.; Kwon, H.J.; Jang, K.-S.; Kim, H.-J.; Jeon, H.J.; Lee, K.N.; Lee, H.L.; Lee, O.Y.; et al. Prevention of Free Fatty Acid-Induced Hepatic Lipotoxicity by Carnitine via Reversal of Mitochondrial Dysfunction. Liver Int. Off. J. Int. Assoc. Study Liver 2011, 31, 1315–1324. [Google Scholar] [CrossRef]
- Hirata, T.; Kawai, T.; Hirose, H.; Tanaka, K.; Kurosawa, H.; Fujii, C.; Fujita, H.; Seto, Y.; Matsumoto, H.; Itoh, H. Palmitic Acid-Rich Diet Suppresses Glucose-Stimulated Insulin Secretion (GSIS) and Induces Endoplasmic Reticulum (ER) Stress in Pancreatic Islets in Mice. Endocr. Res. 2016, 41, 8–15. [Google Scholar] [CrossRef]
- Sparagna, G.C.; Hickson-Bick, D.L.; Buja, L.M.; McMillin, J.B. Fatty Acid-Induced Apoptosis in Neonatal Cardiomyocytes: Redox Signaling. Antioxid. Redox Signal. 2001, 3, 71–79. [Google Scholar] [CrossRef]
- Penzo, D.; Tagliapietra, C.; Colonna, R.; Petronilli, V.; Bernardi, P. Effects of Fatty Acids on Mitochondria: Implications for Cell Death. Biochim. Biophys. Acta BBA-Bioenerg. 2002, 1555, 160–165. [Google Scholar] [CrossRef]
- Liu, K.; Yu, W.; Wei, W.; Zhang, X.; Tian, Y.; Sherif, M.; Liu, X.; Dong, C.; Wu, W.; Zhang, L.; et al. Melatonin Reduces Intramuscular Fat Deposition by Promoting Lipolysis and Increasing Mitochondrial Function. J. Lipid Res. 2019, 60, 767–782. [Google Scholar] [CrossRef] [PubMed]
- Martorell-Riera, A.; Segarra-Mondejar, M.; Muñoz, J.P.; Ginet, V.; Olloquequi, J.; Pérez-Clausell, J.; Palacín, M.; Reina, M.; Puyal, J.; Zorzano, A.; et al. Mfn2 Downregulation in Excitotoxicity Causes Mitochondrial Dysfunction and Delayed Neuronal Death. EMBO J. 2014, 33, 2388–2407. [Google Scholar] [CrossRef] [PubMed]
- Rambold, A.S.; Cohen, S.; Lippincott-Schwartz, J. Fatty Acid Trafficking in Starved Cells: Regulation by Lipid Droplet Lipolysis, Autophagy, and Mitochondrial Fusion Dynamics. Dev. Cell 2015, 32, 678–692. [Google Scholar] [CrossRef] [PubMed]
- Singh, R.; Kaushik, S.; Wang, Y.; Xiang, Y.; Novak, I.; Komatsu, M.; Tanaka, K.; Cuervo, A.M.; Czaja, M.J. Autophagy Regulates Lipid Metabolism. Nature 2009, 458, 1131–1135. [Google Scholar] [CrossRef] [PubMed]
- Muniraj, N.; Siddharth, S.; Shriver, M.; Nagalingam, A.; Parida, S.; Woo, J.; Elsey, J.; Gabrielson, K.; Gabrielson, E.; Arbiser, J.L.; et al. Induction of STK11-Dependent Cytoprotective Autophagy in Breast Cancer Cells upon Honokiol Treatment. Cell Death Discov. 2020, 6, 1–15. [Google Scholar] [CrossRef] [PubMed]
- Fonseca, B.D.; Zakaria, C.; Jia, J.-J.; Graber, T.E.; Svitkin, Y.; Tahmasebi, S.; Healy, D.; Hoang, H.-D.; Jensen, J.M.; Diao, I.T.; et al. La-Related Protein 1 (LARP1) Represses Terminal Oligopyrimidine (TOP) MRNA Translation Downstream of MTOR Complex 1 (MTORC1). J. Biol. Chem. 2015, 290, 15996–16020. [Google Scholar] [CrossRef] [PubMed]
- Jung, C.H.; Jun, C.B.; Ro, S.-H.; Kim, Y.-M.; Otto, N.M.; Cao, J.; Kundu, M.; Kim, D.-H. ULK-Atg13-FIP200 Complexes Mediate MTOR Signaling to the Autophagy Machinery. Mol. Biol. Cell 2009, 20, 1992–2003. [Google Scholar] [CrossRef] [PubMed]
- Gómez-Suaga, P.; Hilfiker, S. LRRK2 as a Modulator of Lysosomal Calcium Homeostasis with Downstream Effects on Autophagy. Autophagy 2012, 8, 692–693. [Google Scholar] [CrossRef] [PubMed]
- Glick, D.; Barth, S.; Macleod, K.F. Autophagy: Cellular and Molecular Mechanisms. J. Pathol. 2010, 221, 3–12. [Google Scholar] [CrossRef]
- Saito, T.; Kuma, A.; Sugiura, Y.; Ichimura, Y.; Obata, M.; Kitamura, H.; Okuda, S.; Lee, H.-C.; Ikeda, K.; Kanegae, Y.; et al. Autophagy Regulates Lipid Metabolism through Selective Turnover of NCoR1. Nat. Commun. 2019, 10, 1567. [Google Scholar] [CrossRef]
- Benhaddou, A.; Keime, C.; Ye, T.; Morlon, A.; Michel, I.; Jost, B.; Mengus, G.; Davidson, I. Transcription Factor TEAD4 Regulates Expression of Myogenin and the Unfolded Protein Response Genes during C2C12 Cell Differentiation. Cell Death Differ. 2012, 19, 220–231. [Google Scholar] [CrossRef]
- De Lima, A.O.; Koltes, J.E.; Diniz, W.J.S.; de Oliveira, P.S.N.; Cesar, A.S.M.; Tizioto, P.C.; Afonso, J.; de Souza, M.M.; Petrini, J.; Rocha, M.I.P.; et al. Potential Biomarkers for Feed Efficiency-Related Traits in Nelore Cattle Identified by Co-Expression Network and Integrative Genomics Analyses. Front. Genet. 2020, 11. [Google Scholar] [CrossRef]
- Kumar, R.P.; Ray, S.; Home, P.; Saha, B.; Bhattacharya, B.; Wilkins, H.M.; Chavan, H.; Ganguly, A.; Milano-Foster, J.; Paul, A.; et al. Regulation of Energy Metabolism during Early Mammalian Development: TEAD4 Controls Mitochondrial Transcription. Development 2018, 145. [Google Scholar] [CrossRef] [PubMed]
- Yang, Y.-A.; Han, W.F.; Morin, P.J.; Chrest, F.J.; Pizer, E.S. Activation of Fatty Acid Synthesis during Neoplastic Transformation: Role of Mitogen-Activated Protein Kinase and Phosphatidylinositol 3-Kinase. Exp. Cell Res. 2002, 279, 80–90. [Google Scholar] [CrossRef]
- Hasygar, K.; Deniz, O.; Liu, Y.; Gullmets, J.; Hynynen, R.; Ruhanen, H.; Kokki, K.; Käkelä, R.; Hietakangas, V. Coordinated Control of Adiposity and Growth by Anti-Anabolic Kinase ERK7. EMBO Rep. 2021, 22, e49602. [Google Scholar] [CrossRef] [PubMed]
- Kazatskaya, A.; Kuhns, S.; Lambacher, N.J.; Kennedy, J.E.; Brear, A.G.; McManus, G.J.; Sengupta, P.; Blacque, O.E. Primary Cilium Formation and Ciliary Protein Trafficking Is Regulated by the Atypical MAP Kinase MAPK15 in Caenorhabditis Elegans and Human Cells. Genetics 2017, 207, 1423–1440. [Google Scholar] [CrossRef] [PubMed]
- Ahn, Y.-H.; Yang, Y.; Gibbons, D.L.; Creighton, C.J.; Yang, F.; Wistuba, I.I.; Lin, W.; Thilaganathan, N.; Alvarez, C.A.; Roybal, J.; et al. Map2k4 Functions as a Tumor Suppressor in Lung Adenocarcinoma and Inhibits Tumor Cell Invasion by Decreasing Peroxisome Proliferator-Activated Receptor γ2 Expression. Mol. Cell. Biol. 2011, 31, 4270–4285. [Google Scholar] [CrossRef] [PubMed]
- Ma, X.; Wang, D.; Zhao, W.; Xu, L. Deciphering the Roles of PPARγ in Adipocytes via Dynamic Change of Transcription Complex. Front. Endocrinol. 2018, 9. [Google Scholar] [CrossRef] [PubMed]
- Cui, J.; Chen, W.; Liu, J.; Xu, T.; Zeng, Y. Study on Quantitative Expression of PPARγ and ADRP in Muscle and Its Association with Intramuscular Fat Deposition of Pig. SpringerPlus 2016, 5, 1501. [Google Scholar] [CrossRef]
- Pennacchio, L.A.; Olivier, M.; Hubacek, J.A.; Cohen, J.C.; Cox, D.R.; Fruchart, J.-C.; Krauss, R.M.; Rubin, E.M. An Apolipoprotein Influencing Triglycerides in Humans and Mice Revealed by Comparative Sequencing. Science 2001, 294, 169–173. [Google Scholar] [CrossRef]
- Su, X.; Kong, Y.; Peng, D. New Insights into Apolipoprotein A5 in Controlling Lipoprotein Metabolism in Obesity and the Metabolic Syndrome Patients. Lipids Health Dis. 2018, 17, 174. [Google Scholar] [CrossRef]
- Luo, J.; Xu, L.; Li, J.; Zhao, S. Effects and Mechanisms of Apolipoprotein A-V on the Regulation of Lipid Accumulation in Cardiomyocytes. Lipids Health Dis. 2018, 17, 46. [Google Scholar] [CrossRef]
- Hui, Y.T.; Yang, Y.Q.; Liu, R.Y.; Zhang, Y.Y.; Xiang, C.J.; Liu, Z.Z.; Ding, Y.H.; Zhang, Y.L.; Wang, B.R. Significant Association of APOA5 and APOC3 Gene Polymorphisms with Meat Quality Traits in Kele Pigs. Genet. Mol. Res. 2013, 12, 3643–3650. [Google Scholar] [CrossRef]
- Mariman, E.C.M.; Vink, R.G.; Roumans, N.J.T.; Bouwman, F.G.; Stumpel, C.T.R.M.; Aller, E.E.J.G.; van Baak, M.A.; Wang, P. The Cilium: A Cellular Antenna with an Influence on Obesity Risk. Br. J. Nutr. 2016, 116, 576–592. [Google Scholar] [CrossRef]
- Leibiger, B.; Moede, T.; Uhles, S.; Barker, C.J.; Creveaux, M.; Domin, J.; Berggren, P.-O.; Leibiger, I.B. Insulin-Feedback via PI3K-C2α Activated PKBα/Akt1 Is Required for Glucose-Stimulated Insulin Secretion. FASEB J. 2010, 24, 1824–1837. [Google Scholar] [CrossRef]
- Franco, I.; Gulluni, F.; Campa, C.C.; Costa, C.; Margaria, J.P.; Ciraolo, E.; Martini, M.; Monteyne, D.; De Luca, E.; Germena, G.; et al. PI3K Class II α Controls Spatially Restricted Endosomal PtdIns3P and Rab11 Activation to Promote Primary Cilium Function. Dev. Cell 2014, 28, 647–658. [Google Scholar] [CrossRef]
- Nozhat, Z.; Hedayati, M. PI3K/AKT Pathway and Its Mediators in Thyroid Carcinomas. Mol. Diagn. Ther. 2016, 20, 13–26. [Google Scholar] [CrossRef] [PubMed]
- Huang, S.; Czech, M.P. The GLUT4 Glucose Transporter. Cell Metab. 2007, 5, 237–252. [Google Scholar] [CrossRef] [PubMed]
- Komolka, K.; Albrecht, E.; Wimmers, K.; Michal, J.J.; Maak, S. Molecular Heterogeneities of Adipose Depots - Potential Effects on Adipose-Muscle Cross-Talk in Humans, Mice and Farm Animals. J. Genom. 2014, 2, 31–44. [Google Scholar] [CrossRef] [PubMed]


| Sample | Sex | Carcass Weight (kg) | IMF (%) | Palmitic Acid (%) | Palmitoleic Acid (%) | Stearic Acid (%) | Oleic Acid (%) | n-6 PUFAs (%) | n-3 PUFAs (%) |
|---|---|---|---|---|---|---|---|---|---|
| 1 | Gilt | 132 | 8.64 | 22.94 | 2.88 | 10.81 | 37.63 | 18.68 | 0.88 |
| 2 | Gilt | 120 | 7.82 | 22.13 | 2.15 | 10.26 | 27.76 | 31.07 | 1.30 |
| 3 | Gilt | 105 | 6.65 | 23.63 | 3.10 | 11.56 | 40.06 | 13.78 | 0.72 |
| 4 | Barrow | 126 | 5.99 | 23.93 | 3.07 | 12.66 | 38.90 | 13.76 | 0.58 |
| 5 | Barrow | 120 | 5.89 | 24.33 | 2.34 | 13.30 | 42.80 | 10.15 | 0.49 |
| 6 | Barrow | 120 | 5.87 | 25.19 | 3.51 | 11.74 | 44.16 | 7.83 | 0.47 |
| 7 | Barrow | 120 | 0.74 | 24.25 | 3.13 | 12.95 | 44.94 | 7.72 | 0.45 |
| 8 | Barrow | 124 | 0.73 | 24.76 | 2.73 | 13.25 | 41.58 | 10.74 | 0.59 |
| 9 | Gilt | 119 | 0.71 | 24.04 | 3.03 | 11.69 | 40.81 | 13.28 | 0.72 |
| 10 | Gilt | 110 | 0.67 | 22.13 | 2.27 | 11.60 | 45.22 | 11.52 | 0.55 |
| 11 | Barrow | 127 | 0.64 | 22.89 | 2.59 | 13.72 | 36.50 | 16.94 | 0.77 |
| 12 | Gilt | 116 | 0.51 | 24.22 | 2.42 | 14.68 | 32.10 | 19.38 | 0.71 |
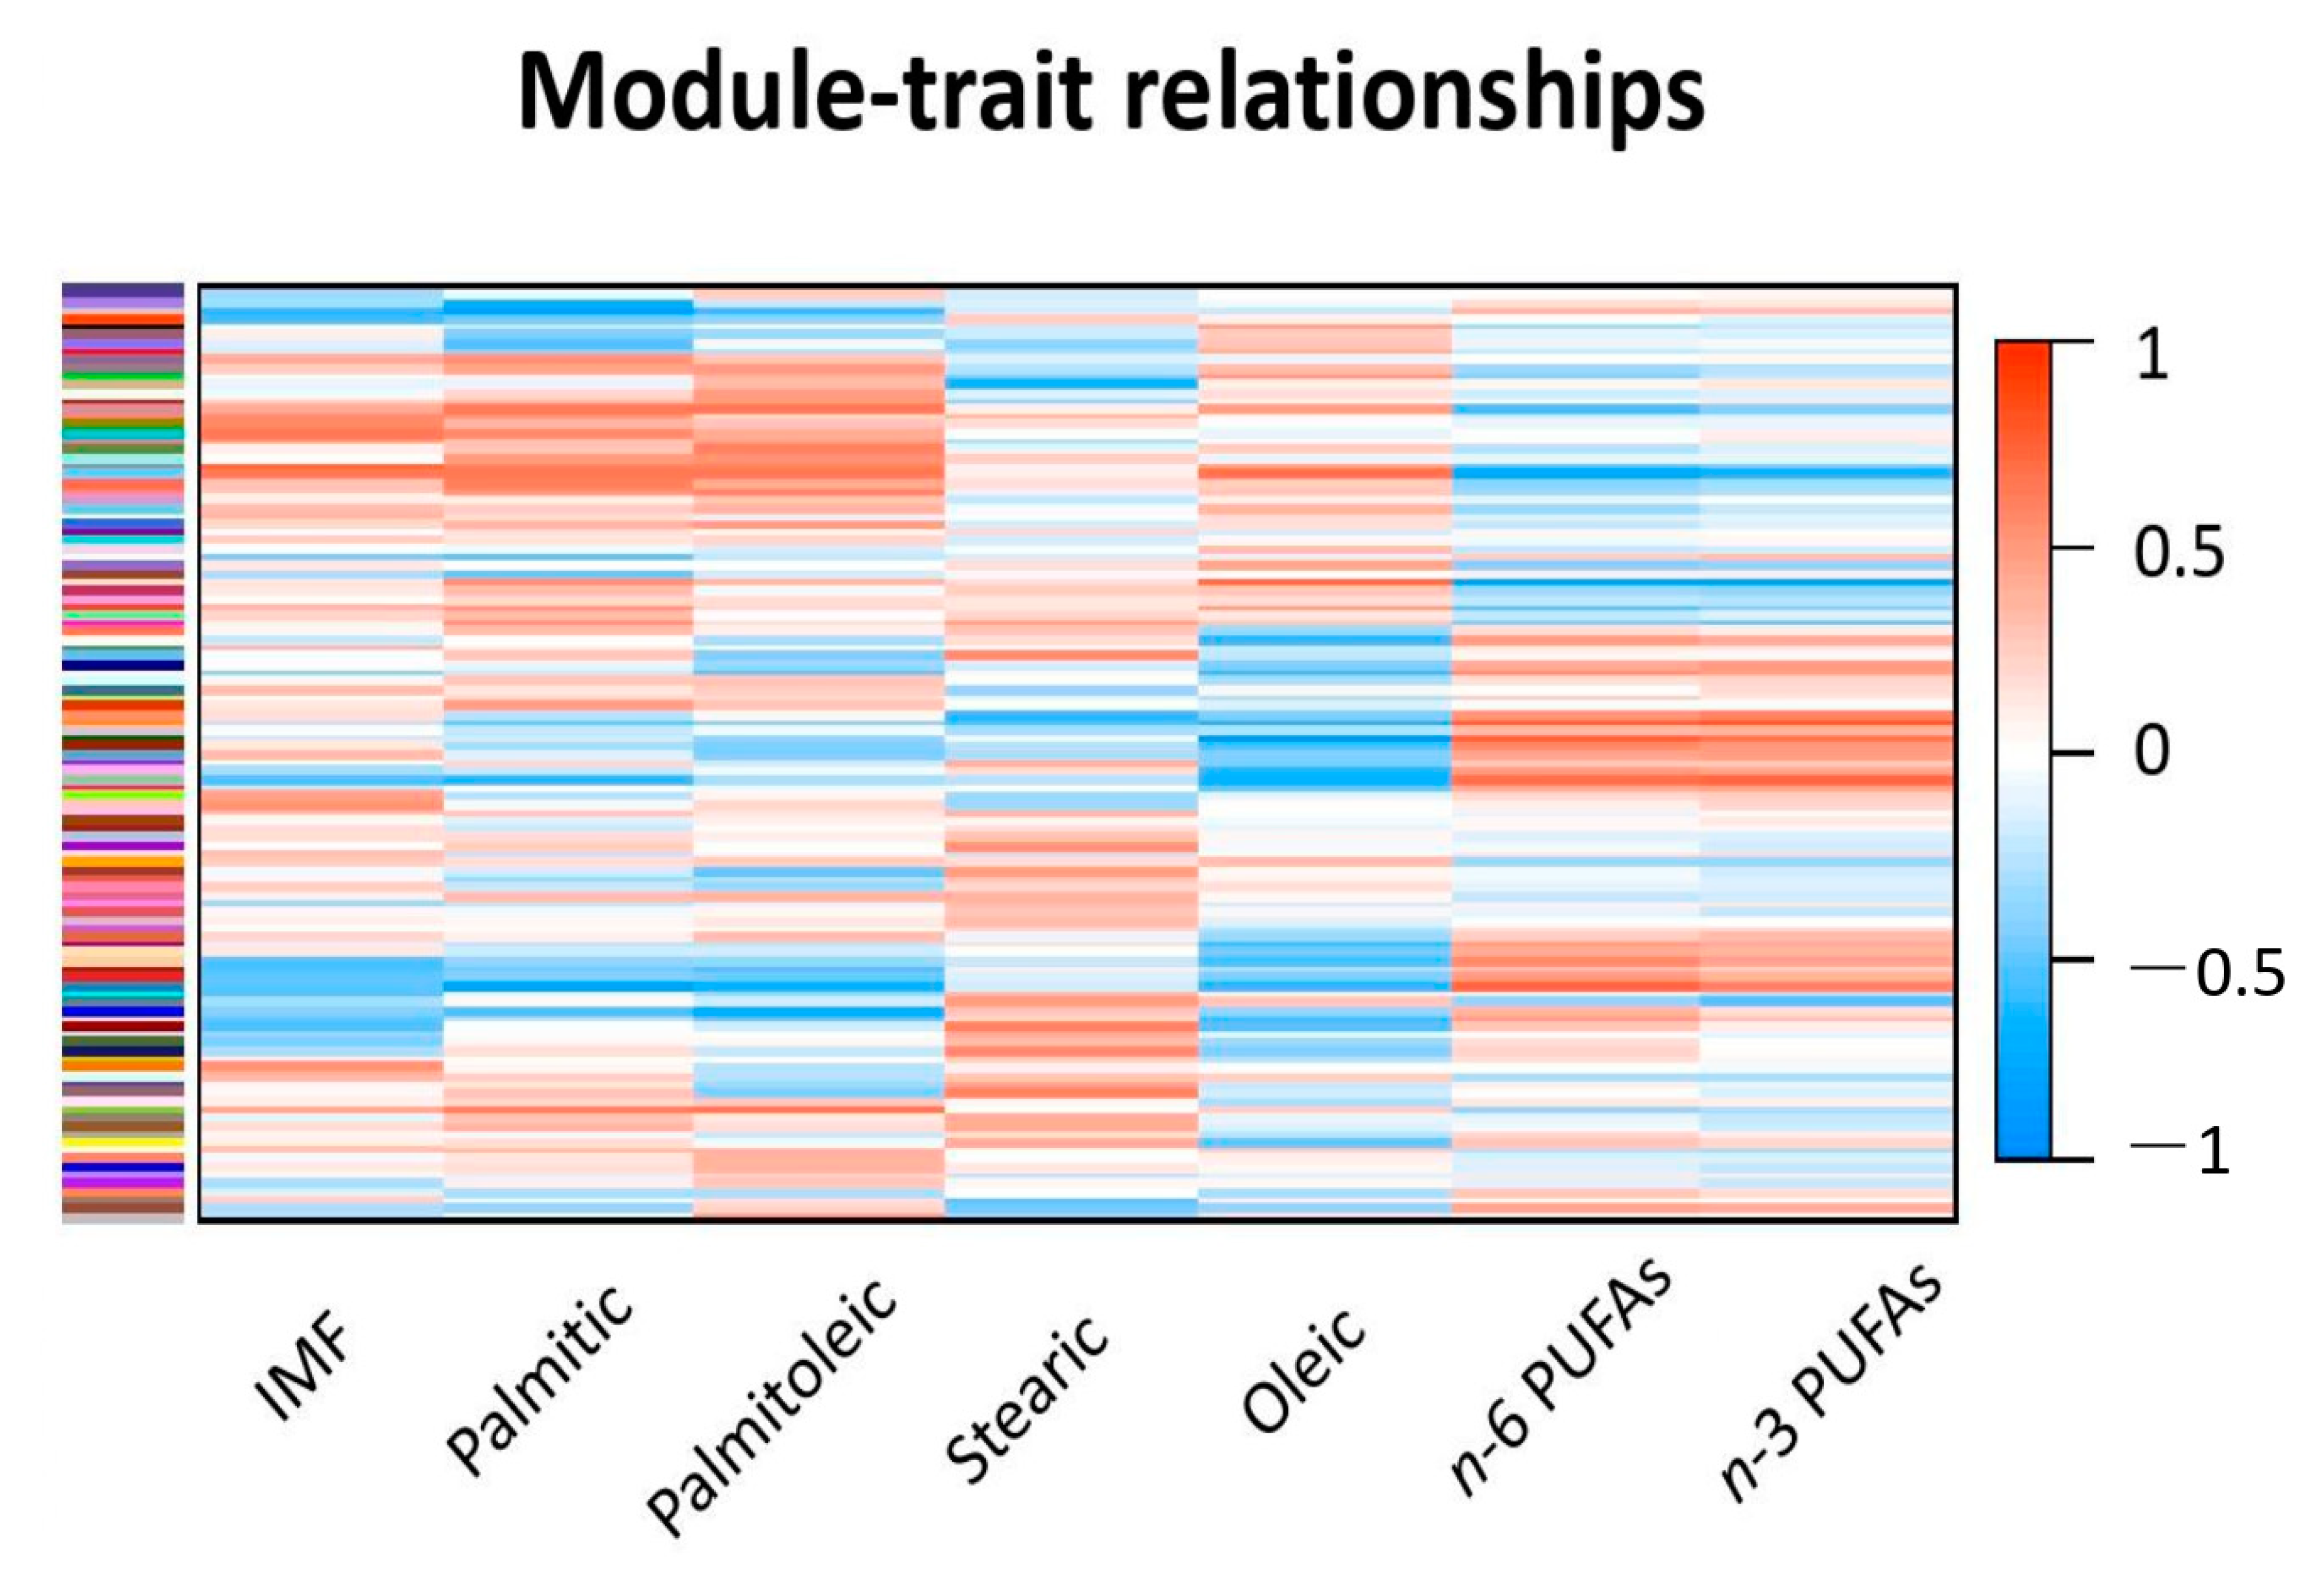
| Gene Modules | IMF (%) | Palmitic Acid (%) | Palmitoleic Acid (%) | Stearic Acid (%) | Oleic Acid (%) | n-6 PUFAs (%) | n-3 PUFAs (%) |
|---|---|---|---|---|---|---|---|
| MEskyblue1 | 0.65 | 0.66 | 0.67 | 0.08 | 0.71 | −0.76 | −0.66 |
| MEgrey60 | 0.77 | 0.61 | 0.61 | −0.09 | 0.51 | −0.53 | −0.45 |
| MEantiquewhite2 | 0.15 | 0.58 | 0.36 | 0.19 | 0.73 | −0.77 | −0.77 |
| MEyellowgreen | 0.44 | 0.68 | 0.71 | 0.03 | 0.24 | −0.37 | −0.32 |
| MEdarkorange | −0.25 | −0.49 | −0.43 | −0.52 | −0.70 | 0.81 | 0.84 |
| MElavenderblush3 | −0.63 | −0.80 | −0.60 | −0.17 | −0.22 | 0.39 | 0.35 |
| MEdarkseagreen3 | −0.55 | −0.61 | −0.30 | −0.26 | −0.65 | 0.71 | 0.72 |
| MEdarkgreen | −0.21 | −0.17 | −0.37 | −0.07 | −0.85 | 0.79 | 0.70 |
| MEsteelblue | −0.51 | −0.80 | −0.65 | −0.16 | −0.63 | 0.73 | 0.61 |
Publisher’s Note: MDPI stays neutral with regard to jurisdictional claims in published maps and institutional affiliations. |
© 2021 by the authors. Licensee MDPI, Basel, Switzerland. This article is an open access article distributed under the terms and conditions of the Creative Commons Attribution (CC BY) license (http://creativecommons.org/licenses/by/4.0/).
Share and Cite
Zappaterra, M.; Gioiosa, S.; Chillemi, G.; Zambonelli, P.; Davoli, R. Dissecting the Gene Expression Networks Associated with Variations in the Major Components of the Fatty Acid Semimembranosus Muscle Profile in Large White Heavy Pigs. Animals 2021, 11, 628. https://doi.org/10.3390/ani11030628
Zappaterra M, Gioiosa S, Chillemi G, Zambonelli P, Davoli R. Dissecting the Gene Expression Networks Associated with Variations in the Major Components of the Fatty Acid Semimembranosus Muscle Profile in Large White Heavy Pigs. Animals. 2021; 11(3):628. https://doi.org/10.3390/ani11030628
Chicago/Turabian StyleZappaterra, Martina, Silvia Gioiosa, Giovanni Chillemi, Paolo Zambonelli, and Roberta Davoli. 2021. "Dissecting the Gene Expression Networks Associated with Variations in the Major Components of the Fatty Acid Semimembranosus Muscle Profile in Large White Heavy Pigs" Animals 11, no. 3: 628. https://doi.org/10.3390/ani11030628
APA StyleZappaterra, M., Gioiosa, S., Chillemi, G., Zambonelli, P., & Davoli, R. (2021). Dissecting the Gene Expression Networks Associated with Variations in the Major Components of the Fatty Acid Semimembranosus Muscle Profile in Large White Heavy Pigs. Animals, 11(3), 628. https://doi.org/10.3390/ani11030628