
Myoglobin Concentration and Oxygen Stores in Different Functional Muscle Groups from Three Small Cetacean Species


 , , , ,
Abstract
Simple Summary
Abstract
1. Introduction
2. Materials and Methods
2.1. Specimens and Collection of Muscle Tissue
2.2. Mb Concentration Determination
2.3. Muscle O2 Storage Determination
- (1)
- Homogeneous myoglobin distribution was assumed across the locomotor muscles. Mb concentration measured at the middle epaxial (Longissimus dorsi) muscle position was multiplied by the animal’s total locomotor muscle mass (LMM; see Table 2) (Equation (1)). This method will be referred to as the “locomotor muscle method.”
- (2)
- Homogeneous myoglobin distribution was assumed across all the skeletal muscles. Mb concentration at the middle epaxial muscle was multiplied by the animal’s total muscle mass (TMM) (Equation (2)). This method will be referred to as the “total muscle method.”
- (3)
- Heterogeneous myoglobin distribution was assumed across the skeletal muscles. The Mb for each functional group was calculated by multiplying the Mb concentration of the representative muscle by the mass of all muscles in each functional muscle group (FMG) following Equation (3). In those muscles where Mb concentration was determined in different locations, the mean Mb concentration among or between locations was calculated. This method will be referred to as the “functional muscle group method.”
2.4. Statistical Analysis
2.4.1. Study of Muscle Contribution to Total Mb
2.4.2. Mb Concentration in Locomotor and Non-Locomotor Muscles
2.4.3. Mb Concentration and Muscle Mass Relationship
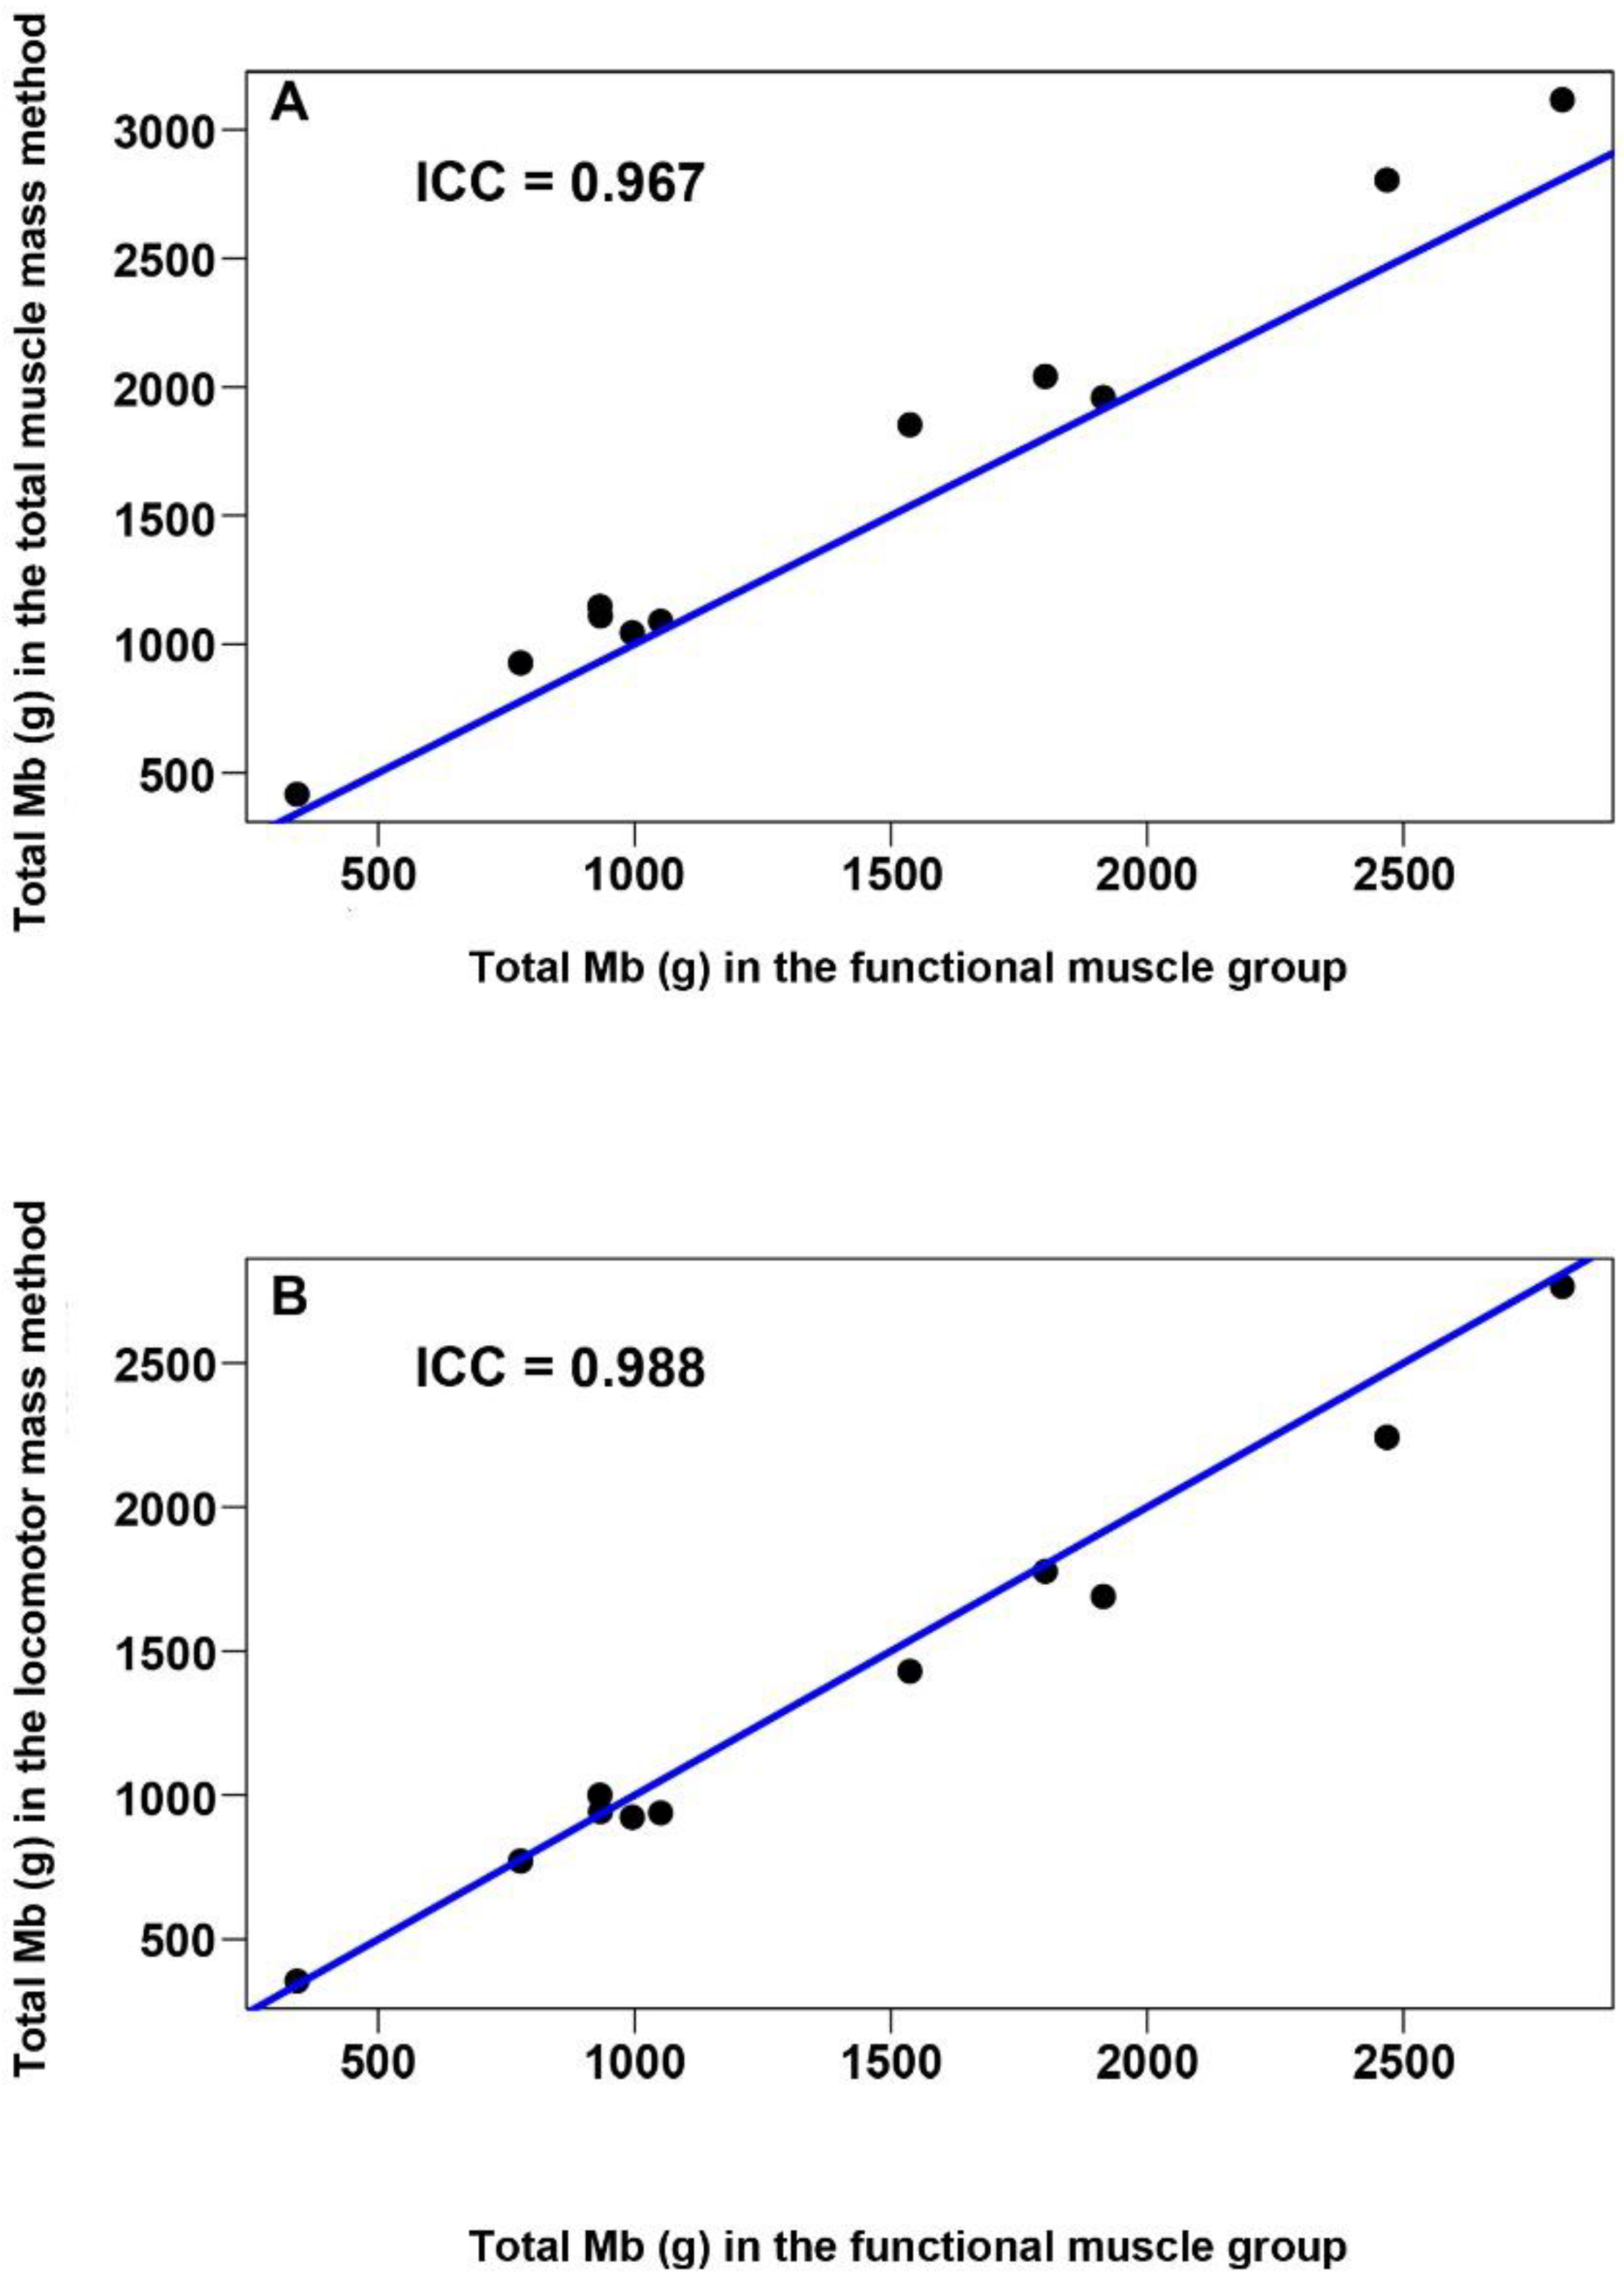
2.4.4. Comparison of the Functional Muscle Group Method with the Locomotor and Total Muscle Mass Methods
3. Results
3.1. Mb Concentration between and within Body Muscles
3.2. Mb Concentration among Species
3.3. Comparison between Reynafarje Equation and the Calibration Curve for Mb Concentration Determination
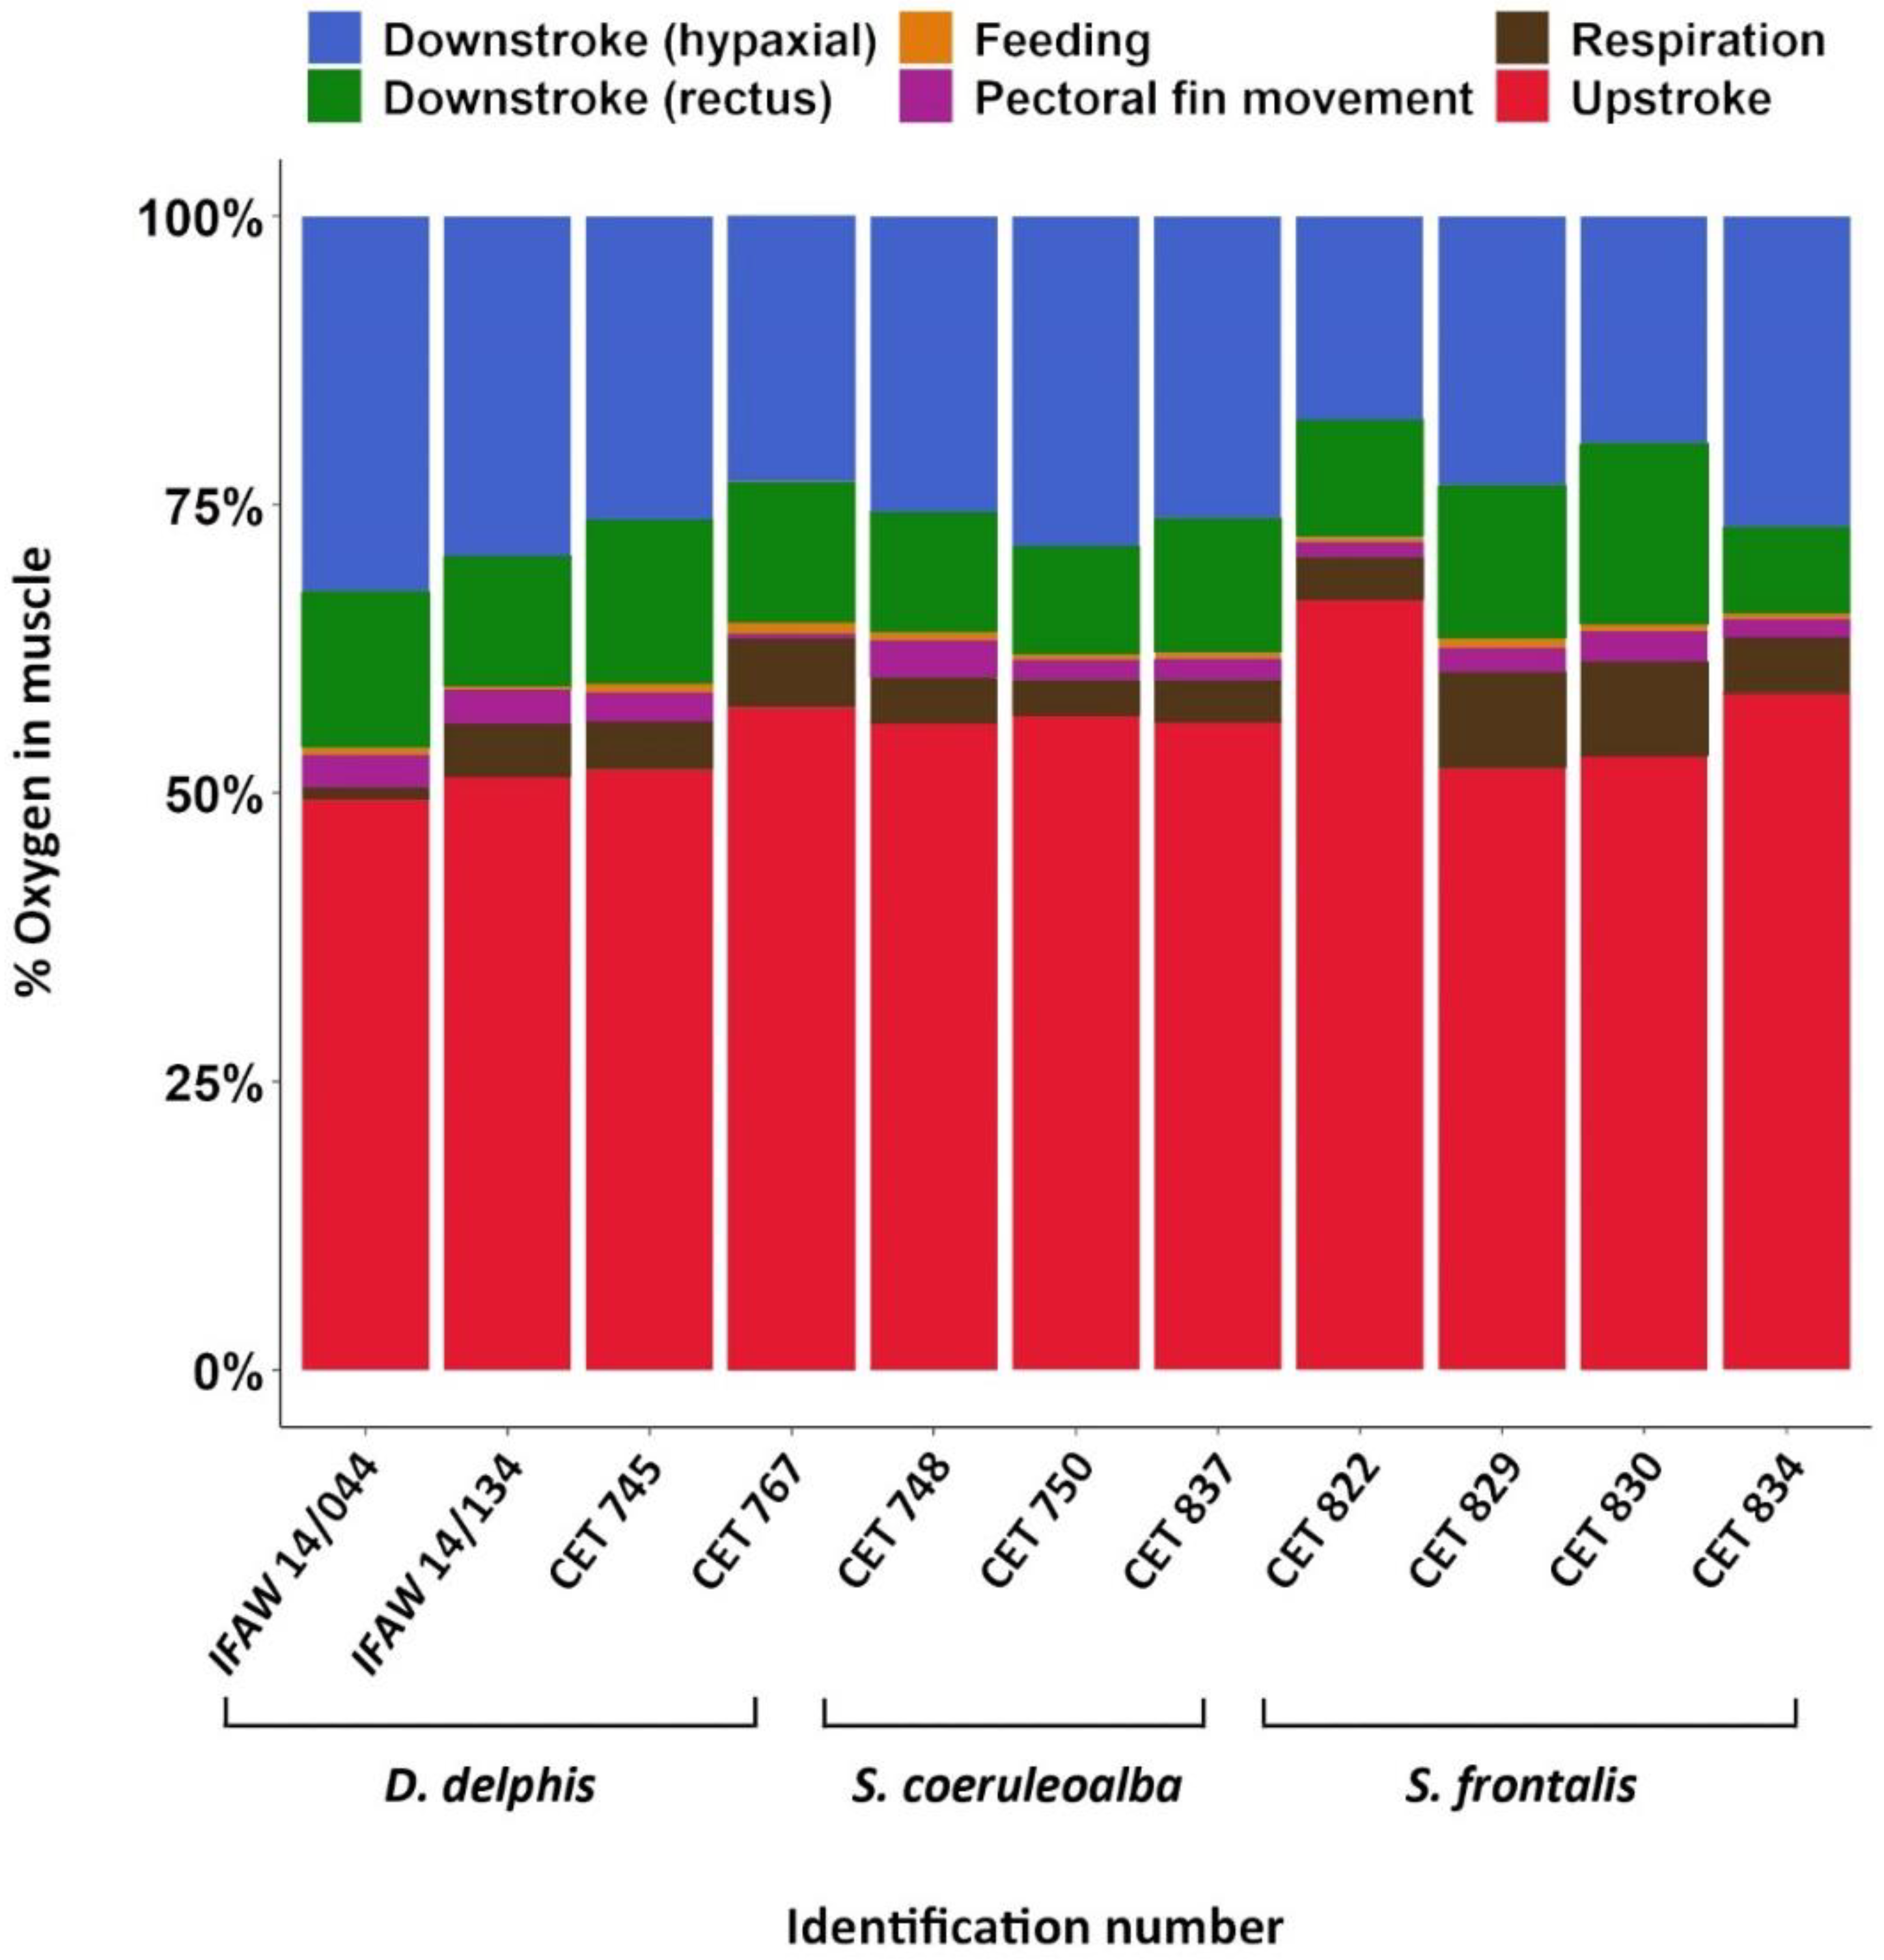
3.4. Muscle O2 Storage Determination
3.5. Comparison of the Functional Muscle Group Method with the Locomotor and Total Muscle Mass Methods
4. Discussion
4.1. Differences in Mb Concentration between and within Body Muscles
4.2. Mb Concentration among Species
4.3. Comparison between Reynafarje Equation and the Calibration Curve for Mb Concentration Determination
4.4. Muscle O2 Storage Determination
4.5. Comparative Study between the Present and Previous Methods for Muscle O2 Stored Calculations
5. Conclusions
Supplementary Materials
Author Contributions
Funding
Institutional Review Board Statement
Data Availability Statement
Acknowledgments
Conflicts of Interest
References
- Ponganis, P.J.; Meir, J.U.; Williams, C.L. In pursuit of Irving and Scholander: A review of oxygen store management in seals and penguins. J. Exp. Biol. 2011, 214, 3325–3339. [Google Scholar] [CrossRef]
- Scholander, P.F. Experimental investigations in diving animals and birds. Hvalrad. Skr. 1940, 22, 1–131. [Google Scholar]
- Kooyman, G.L.; Castellini, M.; Davis, R.W.; Sinnett, E.E. Aerobic and anaerobic metabolism during voluntary diving in Weddell seals: Evidence of preferred pathways from blood chemistry and behavior. Artic. J. Comp. Physiol. B 1980, 138, 335–346. [Google Scholar] [CrossRef]
- Kooyman, G.L.; Castellini, M.A.; Davis, R.W.; Maue, R.A. Aerobic diving limits of immature Weddell seals. J. Comp. Physiol. B 1983, 151, 171–174. [Google Scholar] [CrossRef]
- Kooyman, G.L.; Castellini, M.A.; Davis, R.W. Physiology of diving in marine mammals. Annu. Rev. Physiol. 1981, 43, 343–356. [Google Scholar] [CrossRef] [PubMed]
- Kooyman, G.L.; McDonald, B.I.; Williams, C.L.; Meir, J.U.; Ponganis, P.J. The aerobic dive limit: After 40 years, still rarely measured but commonly used. Comp. Biochem. Physiol. Part A 2021, 252, 110841. [Google Scholar] [CrossRef] [PubMed]
- Snyder, G.K. Respiratory adaptations in diving mammals. Respir. Physiol. 1983, 54, 269–294. [Google Scholar] [CrossRef]
- Kooyman, G.L.; Ponganis, P.J. The physiological basis of diving to depth: Birds and Mammals. Annu. Rev. Physiol. 1998, 60, 19–32. [Google Scholar] [CrossRef]
- Kooyman, G.L. Oxygen stores. In Diverse Divers: Physiology and Behavior; Burggren, W., Ishii, S., Langer, H., Neuweiler, G., Randall, D.J., Eds.; Springer: Berlin/Heidelberg, Germany, 1989; pp. 53–65. ISBN 9783642797514. [Google Scholar]
- Davis, R.W. Physiological adaptations for breath-hold diving. In Marine Mammals: Adaptations for an Aquatic Life; Springer International Publishing: New York, NY, USA, 2019; pp. 133–175. ISBN 978-3-319-98280-9. [Google Scholar]
- Wittenberg, J.B. Myoglobin-facilitated oxygen diffusion: Role of myoglobin in oxygen entry into muscle. Physiol. Rev. 1970, 50, 559–636. [Google Scholar] [CrossRef] [PubMed]
- Castellini, M.A.; Somero, G.N. Buffering capacity of vertebrate muscle: Correlations with potentials for anaerobic function. J. Comp. Physiol. B 1981, 143, 191–198. [Google Scholar] [CrossRef]
- Burns, J.M.; Lestyk, K.C.; Folkow, L.P.; Hammill, M.O.; Blix, A.S. Size and distribution of oxygen stores in harp and hooded seals from birth to maturity. J. Comp. Physiol. B 2007, 177, 687–700. [Google Scholar] [CrossRef] [PubMed]
- Choy, E.S.; Campbell, K.L.; Berenbrink, M.; Roth, J.D.; Loseto, L.L. Body condition impacts blood and muscle oxygen storage capacity of free-living beluga whales (Delphinapterus leucas). J. Exp. Biol. 2019, 222, jeb191916. [Google Scholar] [CrossRef] [PubMed]
- Velten, B.P.; Dillaman, R.M.; Kinsey, S.T.; McLellan, W.A.; Pabst, D.A. Novel locomotor muscle design in extreme deep-diving whales. J. Exp. Biol. 2013, 216, 1862–1871. [Google Scholar] [CrossRef]
- Williams, T.M.; Kendall, T.L.; Richter, B.P.; Ribeiro-French, C.R.; John, J.S.; Odell, K.L.; Losch, B.A.; Feuerbach, D.A.; Stamper, M.A. Swimming and diving energetics in dolphins: A stroke-by-stroke analysis for predicting the cost of flight responses in wild odontocetes. J. Exp. Biol. 2017, 220, 1135–1145. [Google Scholar] [CrossRef] [PubMed]
- Ponganis, P.J.; Kooyman, G.L.; Winter, L.M.; Starke, L.N. Heart rate and plasma lactate responses during submerged swimming and trained diving in California sea lions, Zalophus californianus. J. Comp. Physiol. B 1997, 167, 9–16. [Google Scholar] [CrossRef] [PubMed]
- Cartwright, R.; Newton, C.; West, K.M.; Rice, J.; Niemeyer, M.; Burek, K.; Wilson, A.; Wall, A.N.; Remonida-Bennett, J.; Tejeda, A.; et al. Tracking the development of muscular myoglobin stores in mysticete calves. PLoS ONE 2016, 11, e0145893. [Google Scholar] [CrossRef]
- Dolar, M.L.L.; Suarez, P.; Ponganis, P.J.; Kooyman, G.L. Myoglobin in pelagic small cetaceans. J. Exp. Biol. 1999, 202, 227–236. [Google Scholar] [PubMed]
- Etnier, S.A.; Dearolf, J.L.; McLellan, W.A.; Pabst, D.A. Postural role of lateral axial muscles in developing bottlenose dolphins (Tursiops truncatus). Proc. R. Soc. B Biol. Sci. 2004, 271, 909–918. [Google Scholar] [CrossRef]
- Lestyk, K.C.; Folkow, L.P.; Blix, A.S.; Hammill, M.O.; Burns, J.M. Development of myoglobin concentration and acid buffering capacity in harp (Pagophilus groenlandicus) and hooded (Cystophora cristata) seals from birth to maturity. J. Comp. Physiol. B 2009, 179, 985–996. [Google Scholar] [CrossRef]
- Polasek, L.K.; Davis, R.W. Heterogeneity of myoglobin distribution in the locomotory muscles of five cetacean species. J. Exp. Biol. 2001, 204, 209–215. [Google Scholar]
- Polasek, L.K.; Dickson, K.A.; Davis, R.W. Metabolic indicators in the skeletal muscles of harbor seals (Phoca vitulina). Am. J. Physiol. Regul. Integr. Comp. Physiol. 2006, 290, 1720–1727. [Google Scholar] [CrossRef] [PubMed][Green Version]
- Polasek, L.K.; Frost, C.; David, J.H.M.; Meyer, M.A.; Davis, R.W. Myoglobin distribution in the locomotory muscles of Cape fur seals (Arctocephalus pusillus pusillus). Aquat. Mamm. 2016, 42, 421–427. [Google Scholar] [CrossRef]
- LeDuc, R.G.; Perrin, W.F.; Dizon, A.E. Phylogenetic relationships among the delphinid cetaceans based on full cytochrome B sequences. Mar. Mammal Sci. 1999, 15, 619–648. [Google Scholar] [CrossRef]
- Würsig, B.; Thewisen, J.G.M.; Kovacs, K.M. Encyclopedia of Marine Mammals, 3rd ed.; Academic Press: Cambridge, MA, USA, 2017; ISBN 9780128043271. [Google Scholar]
- Kroeger, J.P.; McLellan, W.A.; Arthur, L.H.; Velten, B.P.; Singleton, E.M.; Kinsey, S.T.; Pabst, D.A. Locomotor muscle morphology of three species of pelagic delphinids. J. Morphol. 2020, 281, 170–182. [Google Scholar] [CrossRef]
- Ijsseldijk, L.L.; Brownlow, A.C.; Mazzariol, S. Best practice on cetacean post mortem investigation and tissue sampling. In Proceedings of the Joint ACCOBAMS and ASCOBANS Document, Istanbul, Turkey, 7–11 September 2019. [Google Scholar]
- McLellan, W.A.; Koopman, H.N.; Rommel, S.A.; Read, A.J.; Potter, C.W.; Nicolas, J.R.; Westgate, A.J.; Pabst, D.A. Ontogenetic allometry and body composition of harbour porpoises (Phocoena phocoena, L.) from the western North Atlantic. J. Zool. 2002, 257, 457–471. [Google Scholar] [CrossRef]
- Pabst, D.A. Axial muscles and connective tissues of the bottlenose dolphin. In The Bottlenose Dolphin; Leatherwood, S., Reeves, R.R., Eds.; Academic Press: San Diego, CA, USA, 1990; pp. 51–67. [Google Scholar]
- Cotten, P.B.; Piscitelli, M.A.; McLellan, W.A.; Rommel, S.A.; Dearolf, J.L.; Pabst, D.A. The gross morphology and histochemistry of respiratory muscles in bottlenose dolphins, Tursiops truncatus. J. Morphol. 2008, 269, 1520–1538. [Google Scholar] [CrossRef] [PubMed]
- Rommel, S.A.; Lowenstine, L.J. Gross and microscopic Anatomy. In CRC Handbook of Marine Mammal Medicine; CRC Press: Boca Raton, FL, USA, 2001; pp. 129–158. [Google Scholar]
- Strickler, T.I. The axial musculature of Pontoporia blainvillei with comments on the organization of this system and its effect on fluke-stroke dynamics in the Cetacea. Am. J. Anat. 1980, 157, 49–59. [Google Scholar] [CrossRef] [PubMed]
- Noren, S.R.; Williams, T.M. Body size and skeletal muscle myoglobin of cetaceans: Adaptations for maximizing dive duration. Comp. Biochem. Physiol. 2000, 126, 181–191. [Google Scholar] [CrossRef]
- Reynafarje, B. Simplified method for the determination of myoglobin. J. Lab. Clin. Med. 1963, 61, 138–145. [Google Scholar]
- Gayeski, T.E.; Connett, R.J.; Honig, C.R. Minimum intracellular PO2 for maximum cytochrome turnover in red muscle in situ. Am. J. Physiol. 1987, 252, H906–H915. [Google Scholar] [CrossRef]
- Schenkman, K.A.; Marble, D.R.; Burns, D.H.; Feigl, E.O. Myoglobin oxygen dissociation by multiwavelength spectroscopy. J. Appl. Physiol. 1997, 82, 86–92. [Google Scholar] [CrossRef] [PubMed]
- Laird, N.M.; Ware, J.H. Random-effects models for longitudinal data. Biometrics 1982, 38, 963–974. [Google Scholar] [CrossRef]
- Noren, S.R.; Williams, T.M.; Pabst, D.A.; McLellan, W.A.; Dearolf, J.L. The development of diving in marine endotherms: Preparing the skeletal muscles of dolphins, penguins, and seals for activity during submergence. J. Comp. Physiol. B Biochem. Syst. Environ. Physiol. 2001, 171, 127–134. [Google Scholar] [CrossRef]
- R Development Core Team. R: A Language and Environment for Statistical Computing; R Development Core Team: Vienna, Austria, 2016. [Google Scholar]
- Pabst, A. Intramuscular morphology and tendon geometry of the epaxial swimming muscles of dolphins. J. Zool. 1993, 230, 159–176. [Google Scholar] [CrossRef]
- Harrison, L.K.; Davis, R.W. Heterogeneity of myoglobin in cetacean swimming muscles. In Proceedings of the World Marine Mammal Science Conference, Monte Carlo, Monaco, 20–25 January 1998; p. 60. [Google Scholar]
- Wittenberg, B.A. Both hypoxia and work are required to enhance expression of myoglobin in skeletal muscle. Focus on “Hypoxia reprograms calcium signaling and regulates myoglobin expression”. Am. J. Physiol. Physiol. 2009, 296, C390–C392. [Google Scholar] [CrossRef] [PubMed]
- Davis, R.W.; Worthy, G.A.J.; Würsig, B.; Lynn, S.K. Diving behaviour and at-sea movements of an Atlantic spotted dolphin in the Gulf of Mexico. Mar. Mammal Sci. 1996, 12, 569–581. [Google Scholar] [CrossRef]
- Evans, W.E. Common dolphin, white-bellied porpoise Delphinus delphis Linnaeus, 1758. In Handbook of Marine Mammals vol 5: The First Book of Dolphins; Ridgway, S.H., Harrison, R., Eds.; Academic Press: London, UK, 1994; pp. 191–224. [Google Scholar]
- Archer, F.I. Striped dolphin. In Encyclopedia of Marine Mammals; Perrin, W.F., Würsig, B., Thewissen, J.G.M., Eds.; Academic Press: New York, NY, USA, 2009; pp. 1127–1129. [Google Scholar]
- Blessing, M.H. Studies on the concentration of myoglobin in the sea-cow and porpoise. Comp. Biochem. Physiol. A 1972, 41, 475–480. [Google Scholar] [CrossRef]
- Helbo, S.; Fago, A. Functional properties of myoglobins from five whale species with different diving capacities. J. Exp. Biol. 2012, 215, 3403–3410. [Google Scholar] [CrossRef]
- Arregui, M. Concentration of Myoglobin in Different Functional Muscle Groups of Stranded Marine Mammals. MSc Thesis, Texas A&M University Corpus Christi & University of Las Palmas de Gran Canaria, Las Palmas, Spain, 2015. [Google Scholar]
- Pabst, D.A.; McLellan, W.A.; Rommel, S.A. How to build a deep diver: The extreme morphology of Mesoplodonts. Integr. Comp. Biol. 2016, 56, 1337–1348. [Google Scholar] [CrossRef][Green Version]
- Richmond, J.P.; Burns, J.M.; Rea, L.D. Ontogeny of total body oxygen stores and aerobic dive potential in Steller sea lions (Eumetopias jubatus). J. Comp. Physiol. B 2006, 176, 535–545. [Google Scholar] [CrossRef]
- Ponganis, P.J.; Costello, M.L.; Starke, L.N.; Mathieu-costello, O. Structural and biochemical characteristics of locomotory muscles of emperor penguins, Aptenodytes forsteri. Respir. Physiol. 1997, 109, 73–80. [Google Scholar] [CrossRef]
- Mallette, S.D.; Mclellan, W.A.; Scharf, F.S.; Koopman, H.N.; Barco, S.G.; Wells, R.S.; Ann Pabst, D. Ontogenetic allometry and body composition of the common bottlenose dolphin (Tursiops truncatus) from the U.S. mid-Atlantic. Mar. Mammal Sci. 2016, 32, 86–121. [Google Scholar] [CrossRef]


| ID Number | Species | Age Class | Body Condition | Decomposition Code | Mass (kg) | Length (cm) | Sex | Stranding Location |
|---|---|---|---|---|---|---|---|---|
| IFAW 14/044 | D. delphis | Subadult | Good | 2 | 68.8 | 176 | M | Cape Cod |
| IFAW 14/134 | D. delphis | Subadult | Good | 2 | 134 | 180 | M | Cape Cod |
| CET 745 | D. delphis | Adult | Poor | 2 | 58.0 | 188 | F | Canary Islands |
| CET 767 | D. delphis | Adult | Poor | 2 | 78.9 | 220 | F | Canary Islands |
| CET 748 | S. coeruleoalba | Subadult | Good | 2 | 74.3 | 195 | M | Canary Islands |
| CET 750 | S. coeruleoalba | Adult | Poor | 3 | 87.8 | 214 | F | Canary Islands |
| CET 837 | S. coeruleoalba | Subadult | Poor | 3 | 70.0 | 188 | M | Canary Islands |
| CET 822 | S. frontalis | Adult | Moderate | 2 | 61.4 | 170 | M | Canary Islands |
| CET 829 | S. frontalis | Juvenile | Moderate | 2 | 30.3 | 137 | F | Canary Islands |
| CET 830 | S. frontalis | Adult | Moderate | 3 | 59.8 | 172 | F | Canary Islands |
| CET 834 | S. frontalis | Adult | Moderate | 3 | 65.4 | 175 | F | Canary Islands |
| Locomotor Muscles | Non-Locomotor Muscles | ||||
|---|---|---|---|---|---|
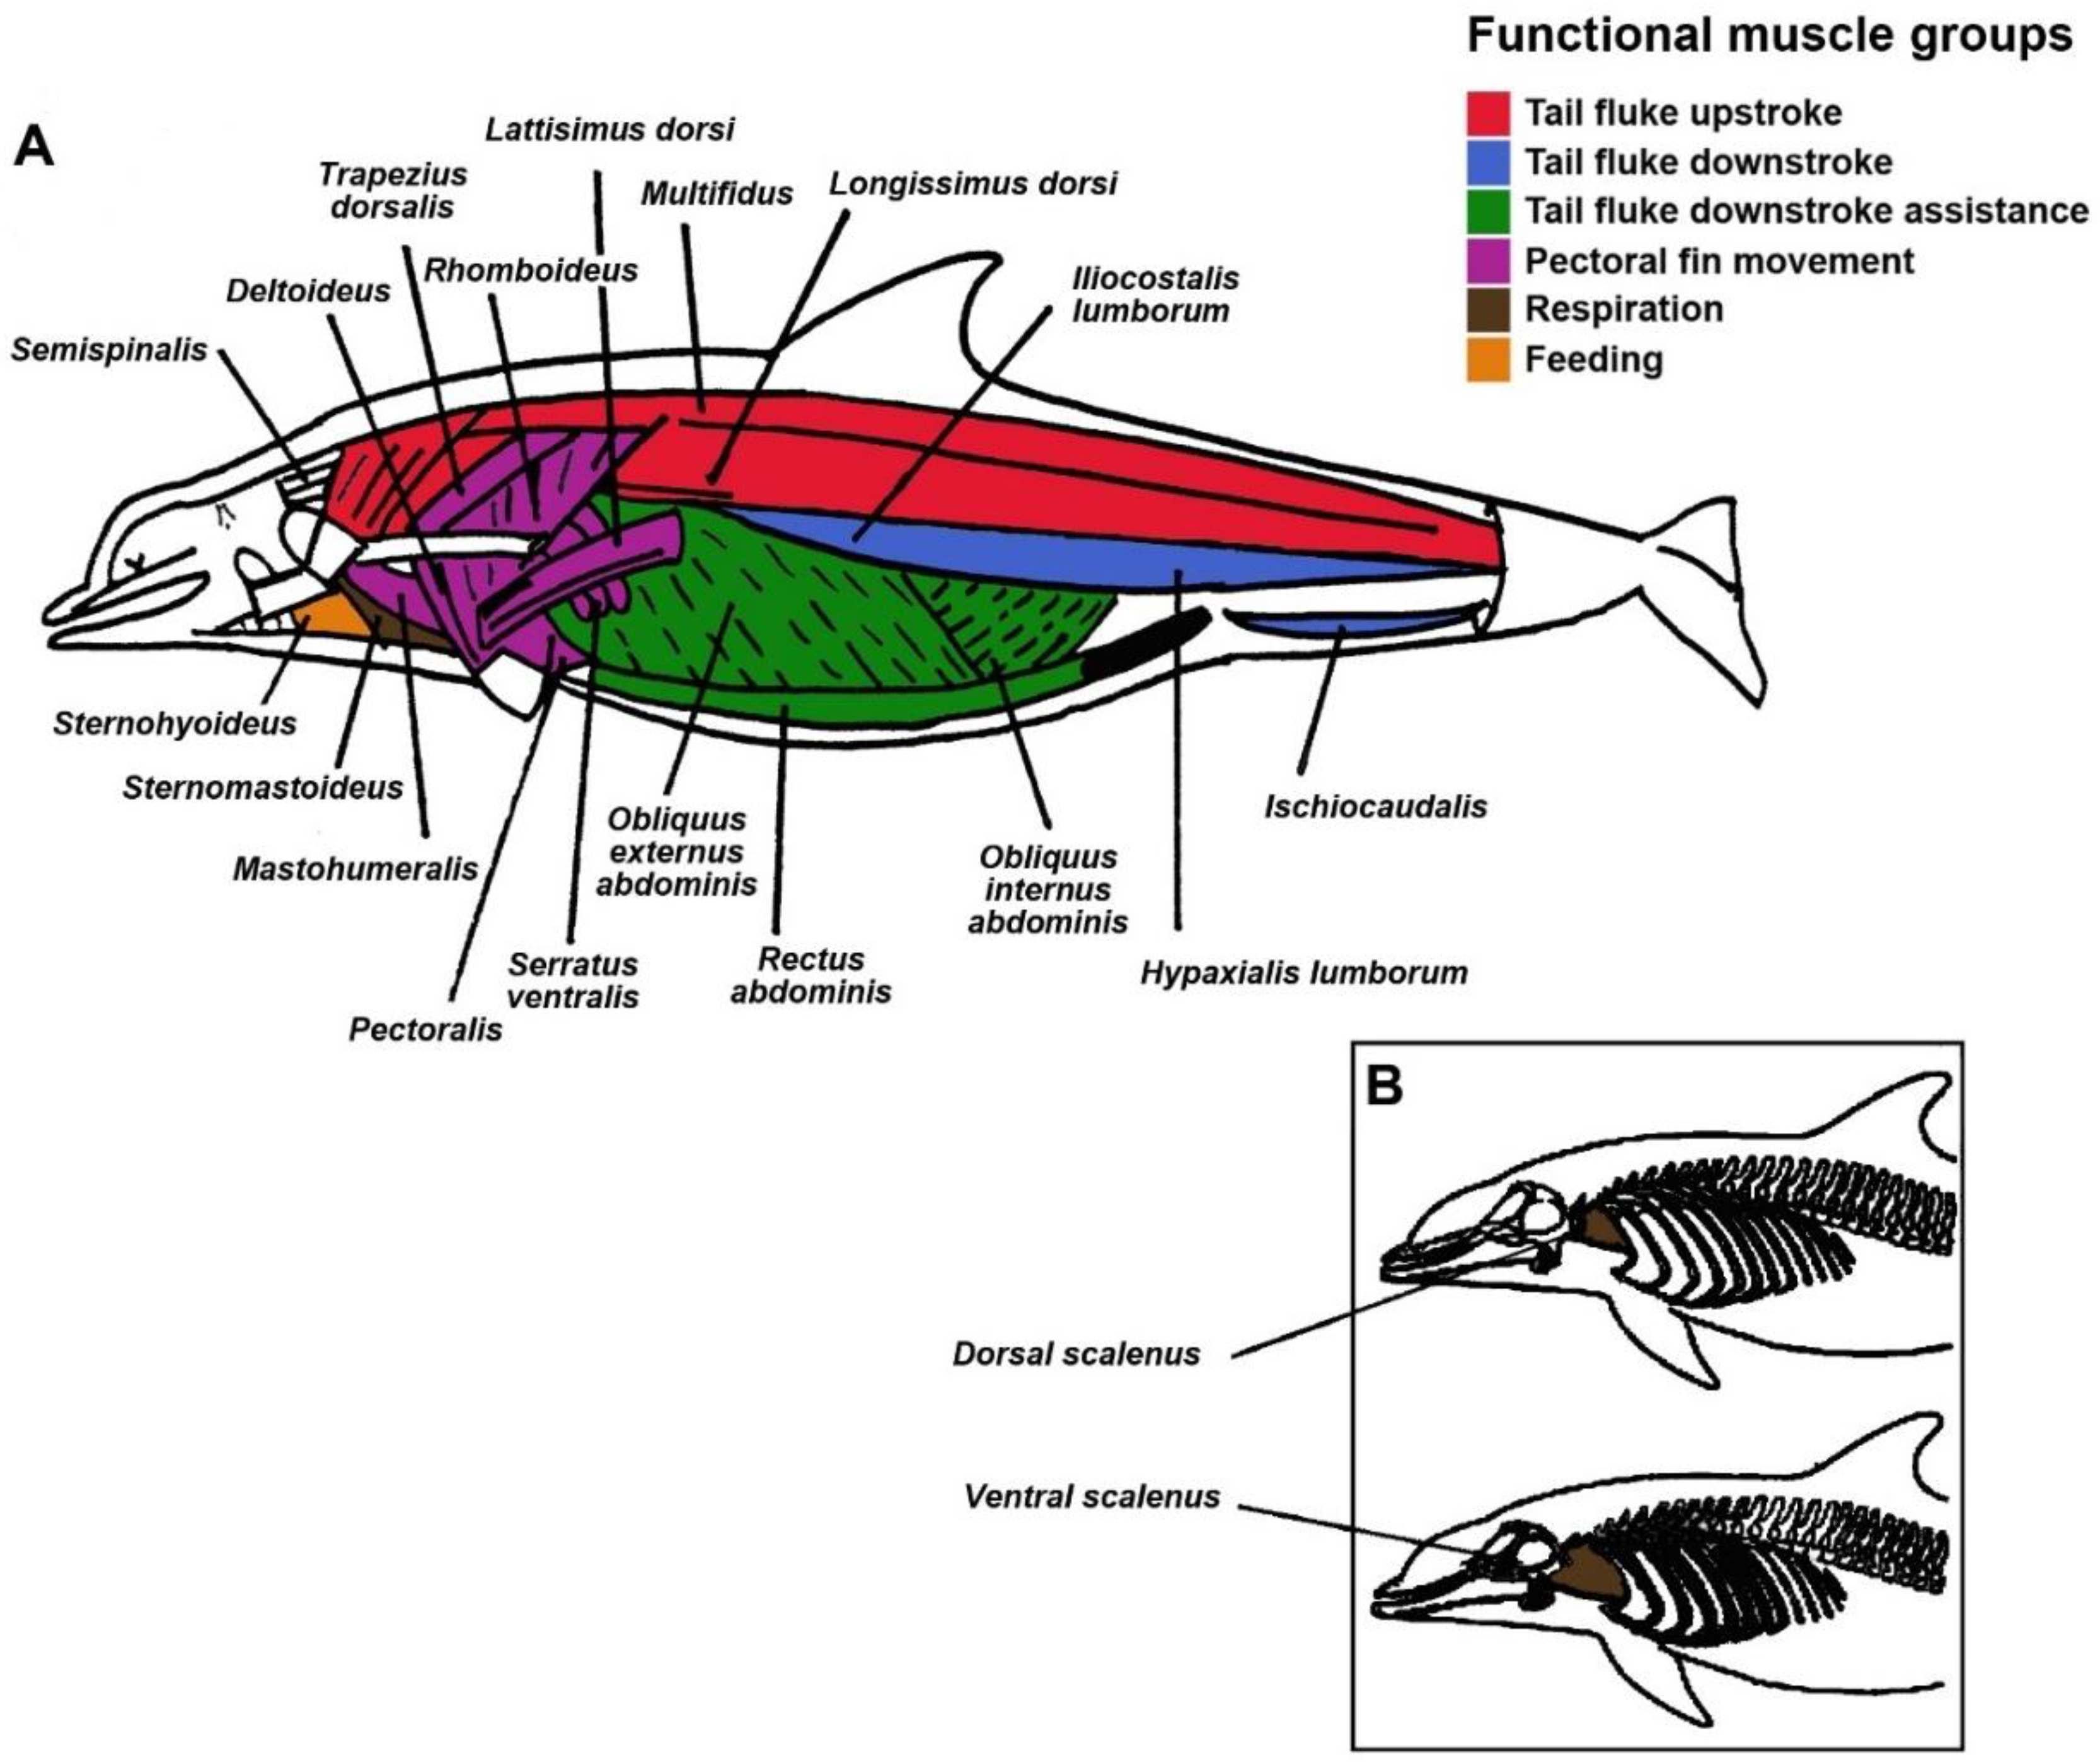
| Head Movement | Tail Fluke Movement (Main Locomotor Muscles) | Pectoral Fin Movement | Feeding | Respiration | |
| Upstroke Movement | Downstroke Movement | ||||
| Spinalis-semispinalis | Multifidus Longissimus dorsi Iliocostalis lumborum | Hypaxialis lumborum Ischiocaudalis Rectus abdominis Obliquus (internus and externus) abdominis | Mastohumeralis Deltoideus Levator scapulae Rhomboideus Lattissimus dorsi Serratus ventralis Pectoralis Trapezius | Sternohyoideus Sternothyroideus | Scalenus Intercostals Sternomastoideus |
| Fixed Effects | Coefficient (SE) | P (Wald) | P (LRT) * | AIC ** | BIC *** |
|---|---|---|---|---|---|
| Intercept | 1.696 (0.179) | <0.001 | |||
| Muscle | <0.001 | 3119.3 | 3143.2 | ||
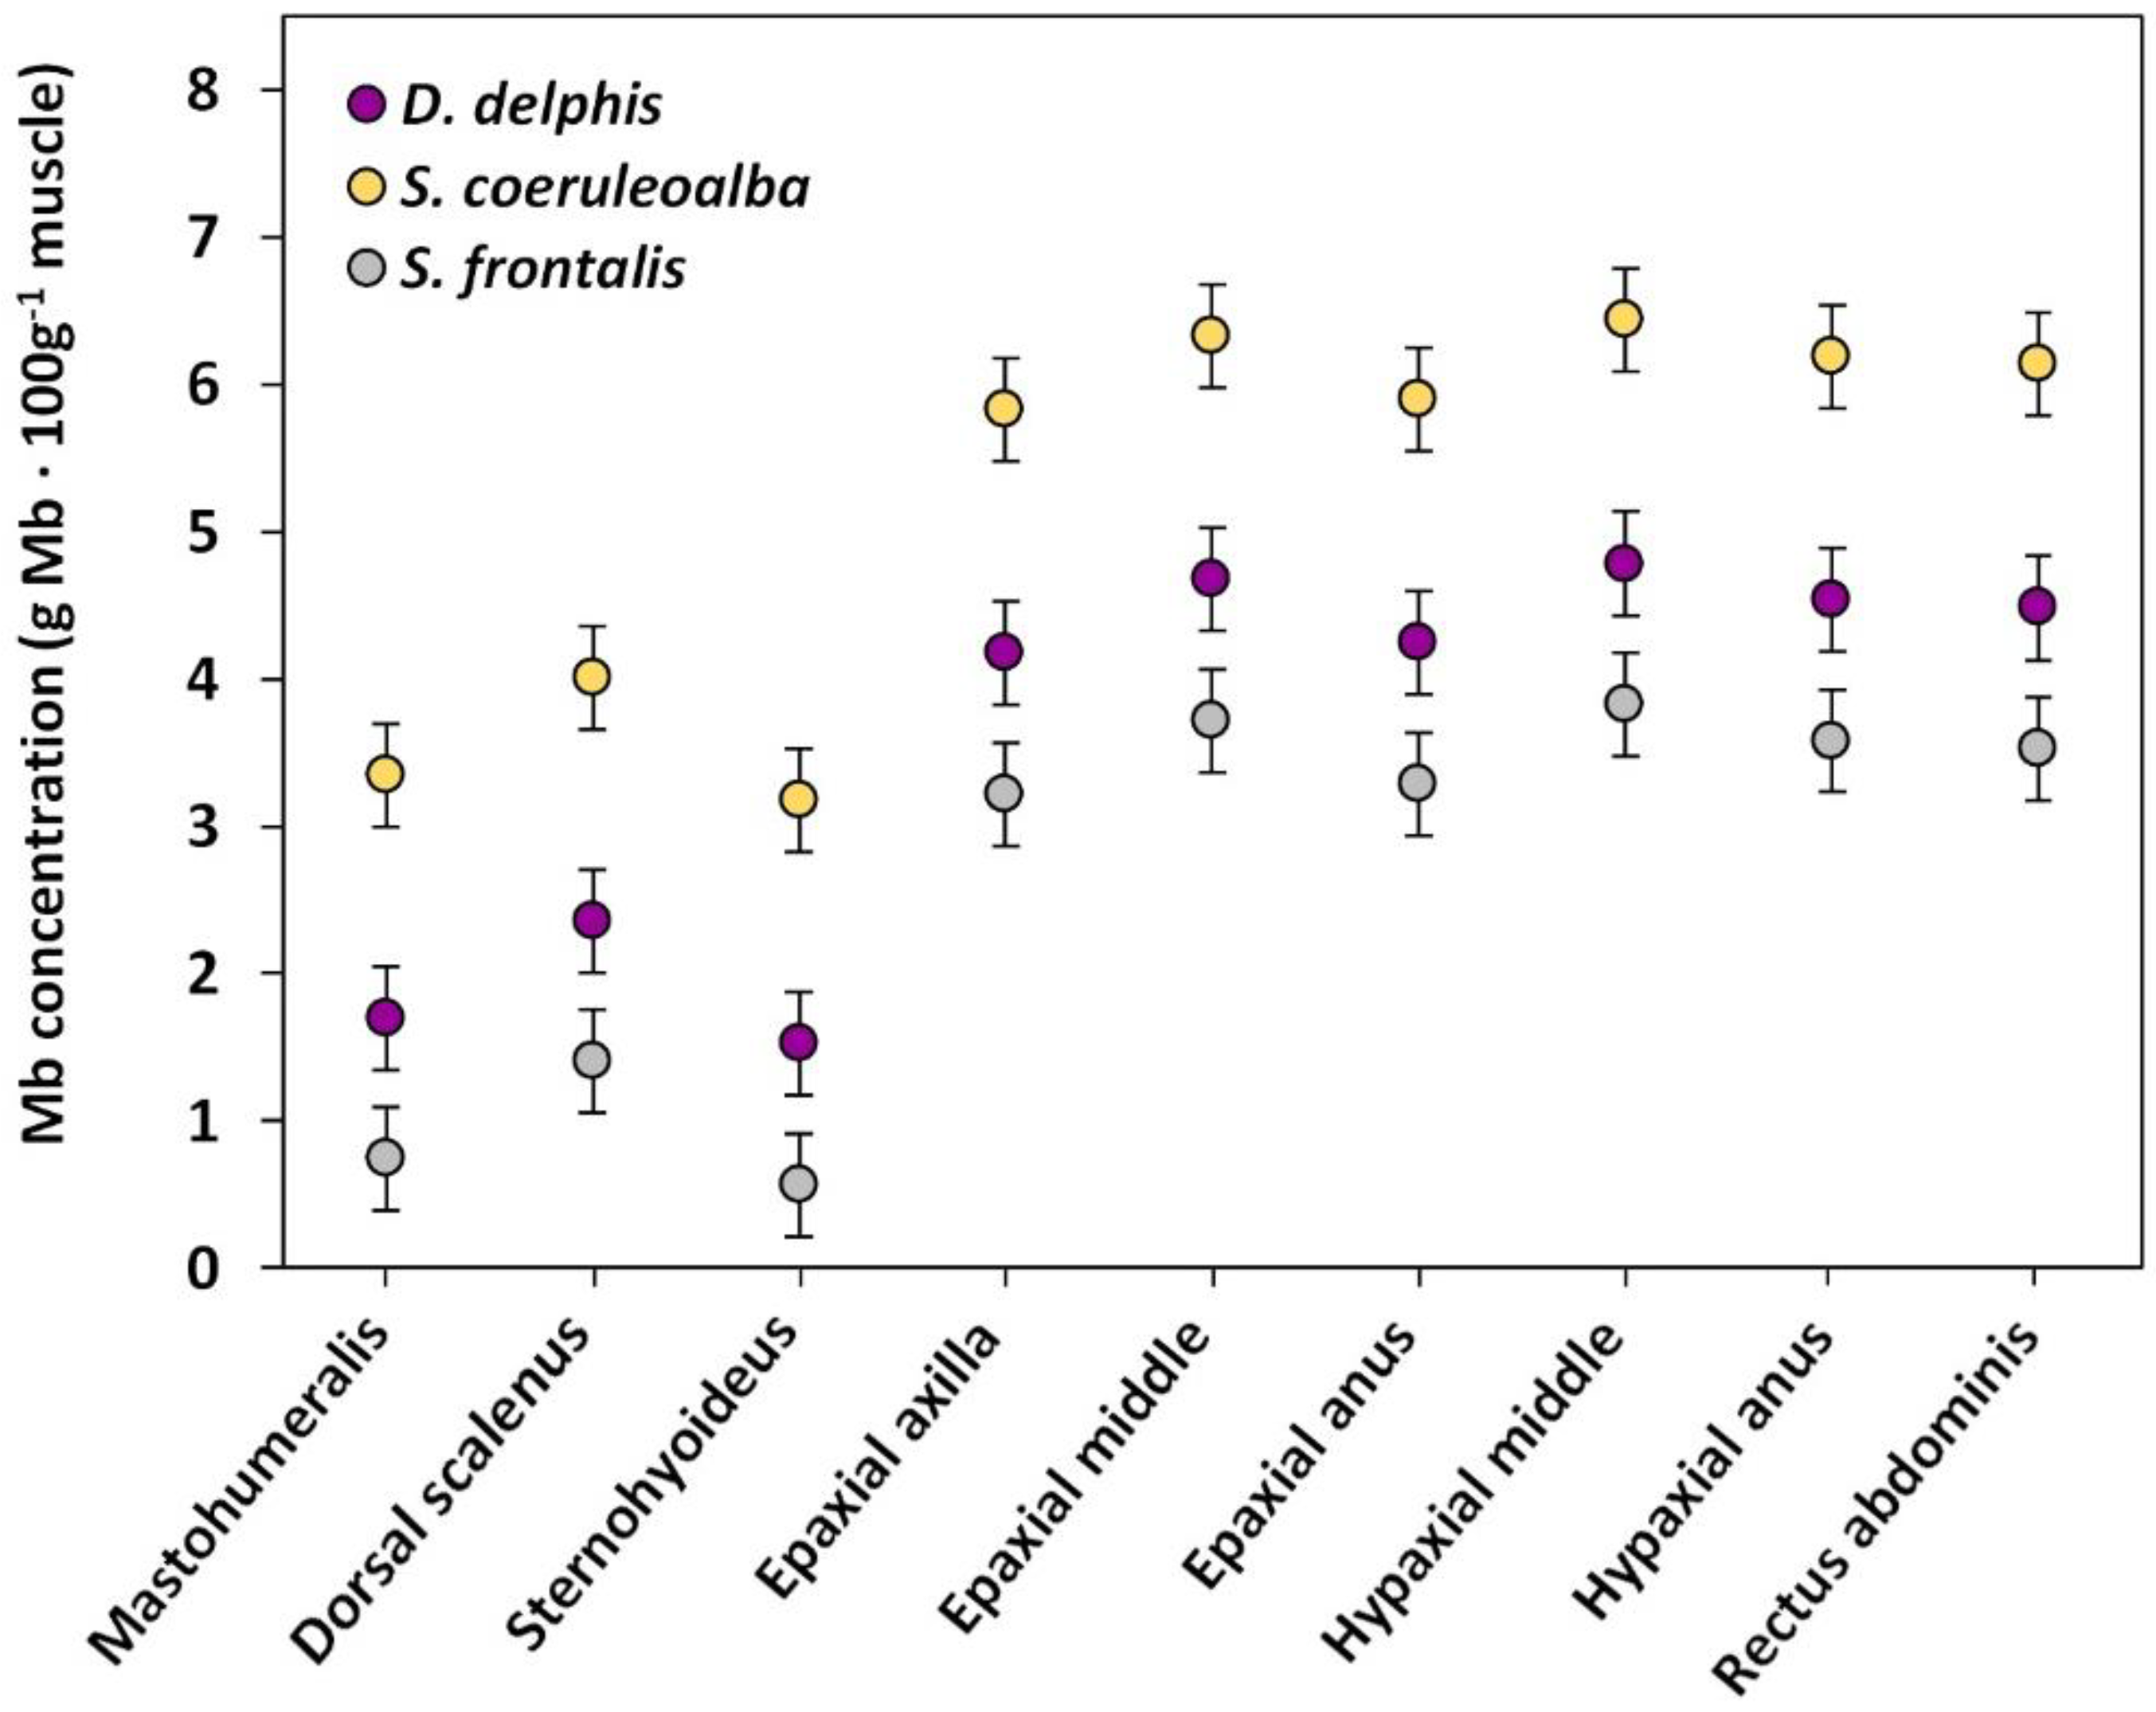
| Mastohumeralis (Ref.) | 0 | - | |||
| Dorsal Scalenus | 0.661 (0.087) | <0.001 | |||
| Sternohyoideus | −0.171 (0.089) | 0.053 | |||
| Epaxial axilla | 2.478 (0.088) | <0.001 | |||
| Epaxial middle | 2.979 (0.087) | <0.001 | |||
| Epaxial anus | 2.551 (0.087) | <0.001 | |||
| Hypaxial middle | 3.086 (0.088) | <0.001 | |||
| Hypaxial anus | 2.842 (0.087) | <0.001 | |||
| Rectus abdominis | 2.786 (0.087) | <0.001 | |||
| Species | <0.001 | 1708.2 | 1760.8 | ||
| D. delphis (Ref.) | 0 | - | |||
| S. coeruleoalba | 1.653 (0.258) | <0.001 | |||
| S. frontalis | −0.957 (0.239) | 0.004 | |||
| S. coeruleoalba–S. frontalis | <0.001 |
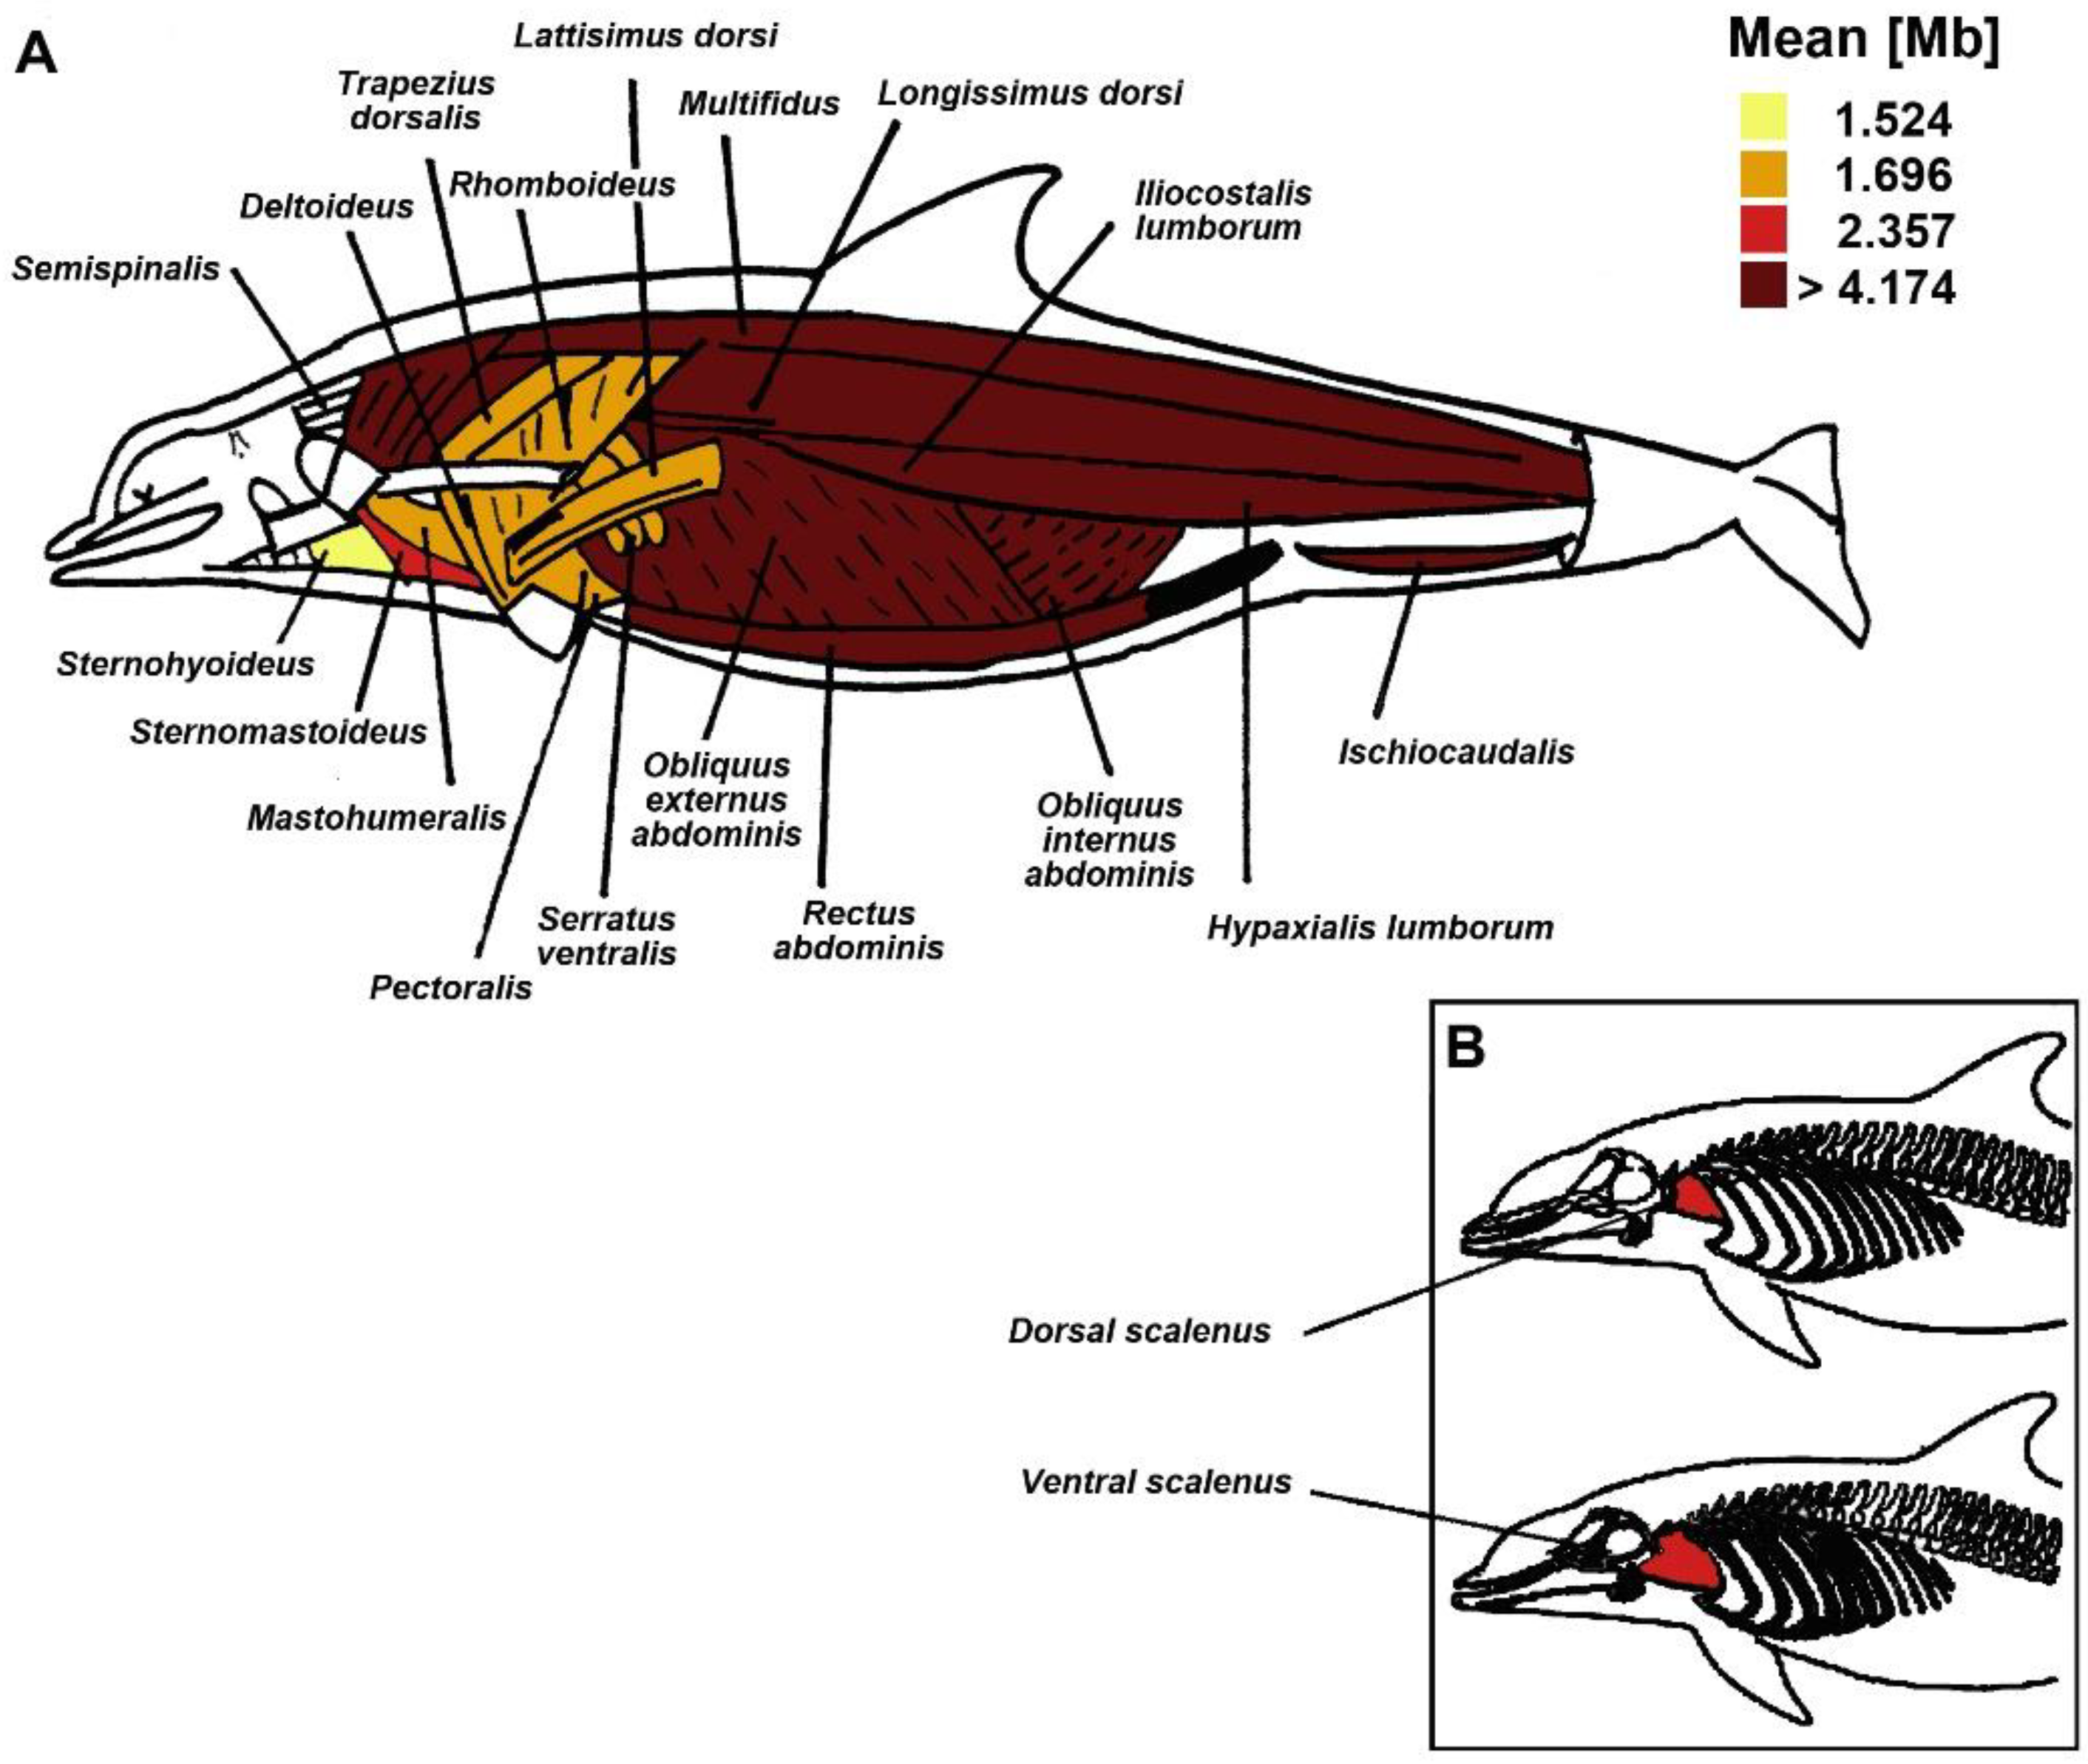
| Functional Muscle Group | Muscle | Adjusted Means (95%CI) |
|---|---|---|
| Pectoral fin movement | Mastohumeralis | 1.696 (1.346; 2.046) |
| Respiration | Dorsal scalenus | 2.357 (2.006; 2.707) |
| Feeding | Sternohyoideus | 1.524 (1.173; 1.875) |
| Tail fluke upstroke | Epaxial axilla | 4.174 (3.823; 4.525) |
| Epaxial middle | 4.674 (4.324; 5.025) | |
| Epaxial anus | 4.247 (3.897; 4.597) | |
| Tail fluke downstroke | Hypaxial middle | 4.782 (4.431; 5.133) |
| Hypaxial anus | 4.538 (4.188; 4.888) | |
| Tail fluke downstroke assistance | Rectus abdominis | 4.482 (4.131; 4.832) |
Publisher’s Note: MDPI stays neutral with regard to jurisdictional claims in published maps and institutional affiliations. |
© 2021 by the authors. Licensee MDPI, Basel, Switzerland. This article is an open access article distributed under the terms and conditions of the Creative Commons Attribution (CC BY) license (http://creativecommons.org/licenses/by/4.0/).
Share and Cite
Arregui, M.; Singleton, E.M.; Saavedra, P.; Pabst, D.A.; Moore, M.J.; Sierra, E.; Rivero, M.A.; Câmara, N.; Niemeyer, M.; Fahlman, A.; et al. Myoglobin Concentration and Oxygen Stores in Different Functional Muscle Groups from Three Small Cetacean Species. Animals 2021, 11, 451. https://doi.org/10.3390/ani11020451
Arregui M, Singleton EM, Saavedra P, Pabst DA, Moore MJ, Sierra E, Rivero MA, Câmara N, Niemeyer M, Fahlman A, et al. Myoglobin Concentration and Oxygen Stores in Different Functional Muscle Groups from Three Small Cetacean Species. Animals. 2021; 11(2):451. https://doi.org/10.3390/ani11020451
Chicago/Turabian StyleArregui, Marina, Emily M. Singleton, Pedro Saavedra, D. Ann Pabst, Michael J. Moore, Eva Sierra, Miguel A. Rivero, Nakita Câmara, Misty Niemeyer, Andreas Fahlman, and et al. 2021. "Myoglobin Concentration and Oxygen Stores in Different Functional Muscle Groups from Three Small Cetacean Species" Animals 11, no. 2: 451. https://doi.org/10.3390/ani11020451
APA StyleArregui, M., Singleton, E. M., Saavedra, P., Pabst, D. A., Moore, M. J., Sierra, E., Rivero, M. A., Câmara, N., Niemeyer, M., Fahlman, A., McLellan, W. A., & Bernaldo de Quirós, Y. (2021). Myoglobin Concentration and Oxygen Stores in Different Functional Muscle Groups from Three Small Cetacean Species. Animals, 11(2), 451. https://doi.org/10.3390/ani11020451