Genetic Diversity and Population Dynamics of Leptobrachium leishanense (Anura: Megophryidae) as Determined by Tetranucleotide Microsatellite Markers Developed from Its Genome


Abstract
:Simple Summary
Abstract
1. Introduction
2. Materials and Methods
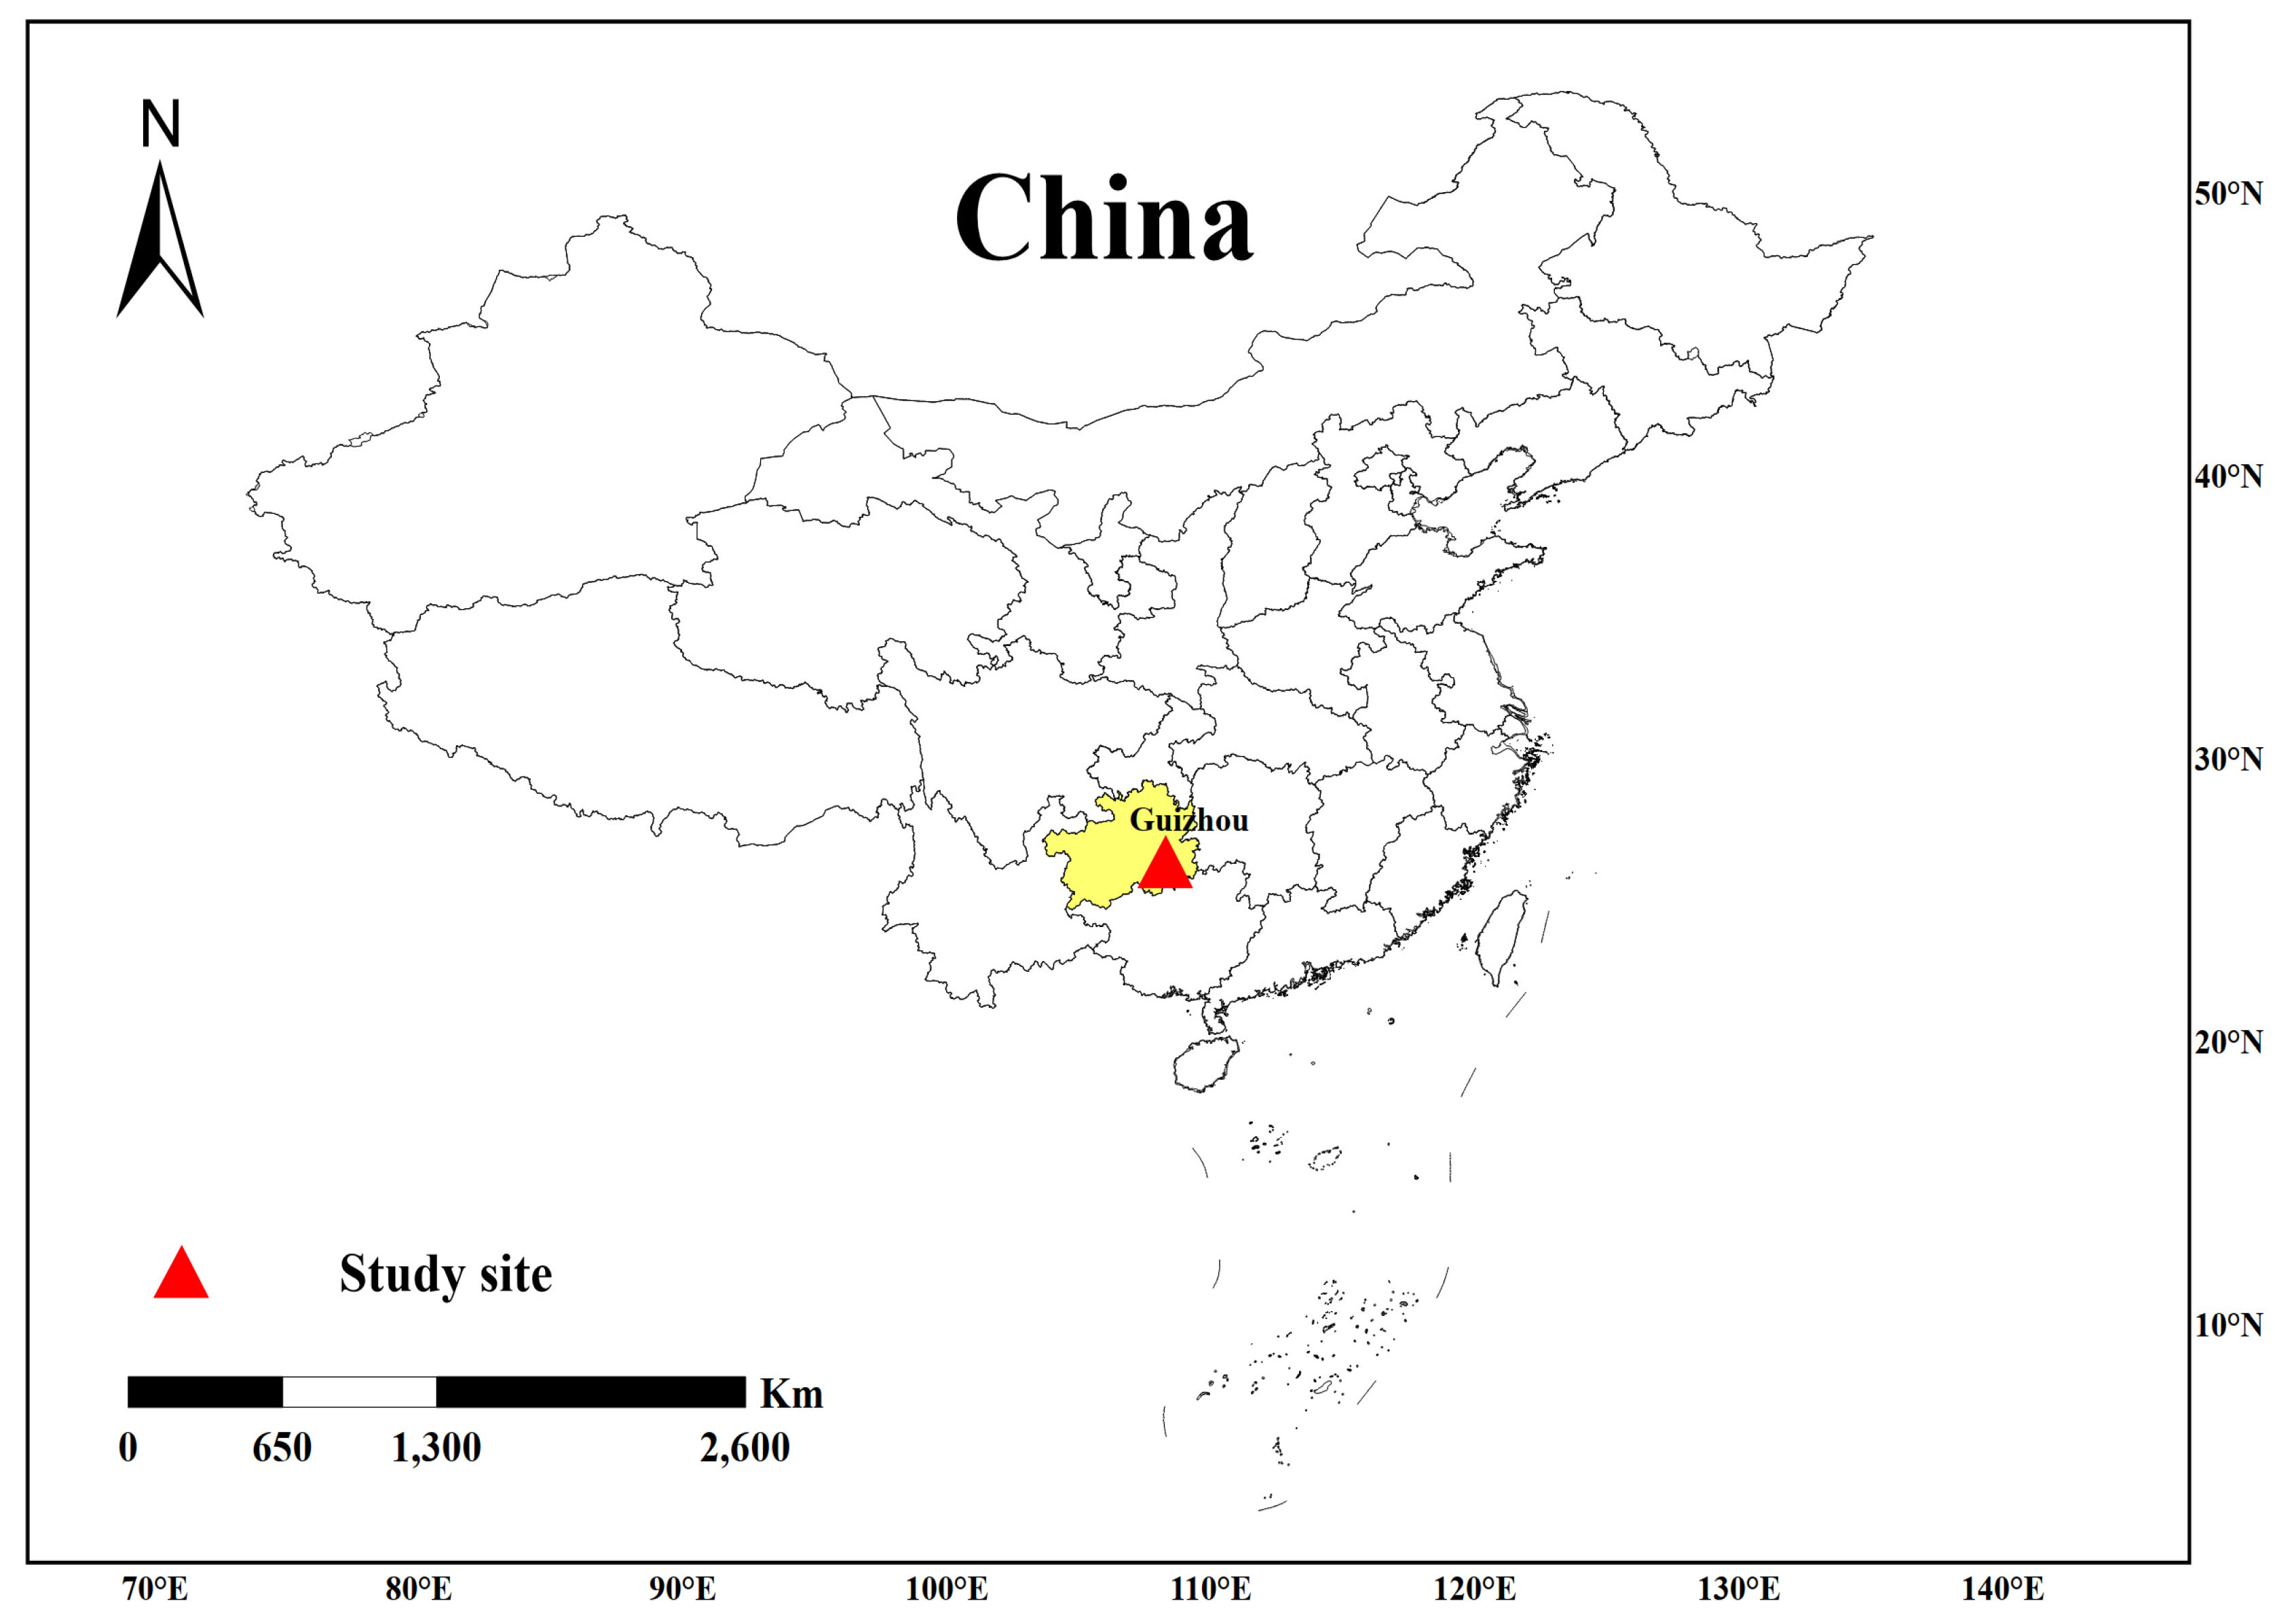
2.1. Sampling
2.2. DNA Extraction and Primer Selection
2.3. Polymorphic Microsatellite Verification
2.4. Genetic Diversity Analysis
2.5. Population Bottleneck Identification
2.6. Effective Population Size Calculation
3. Results
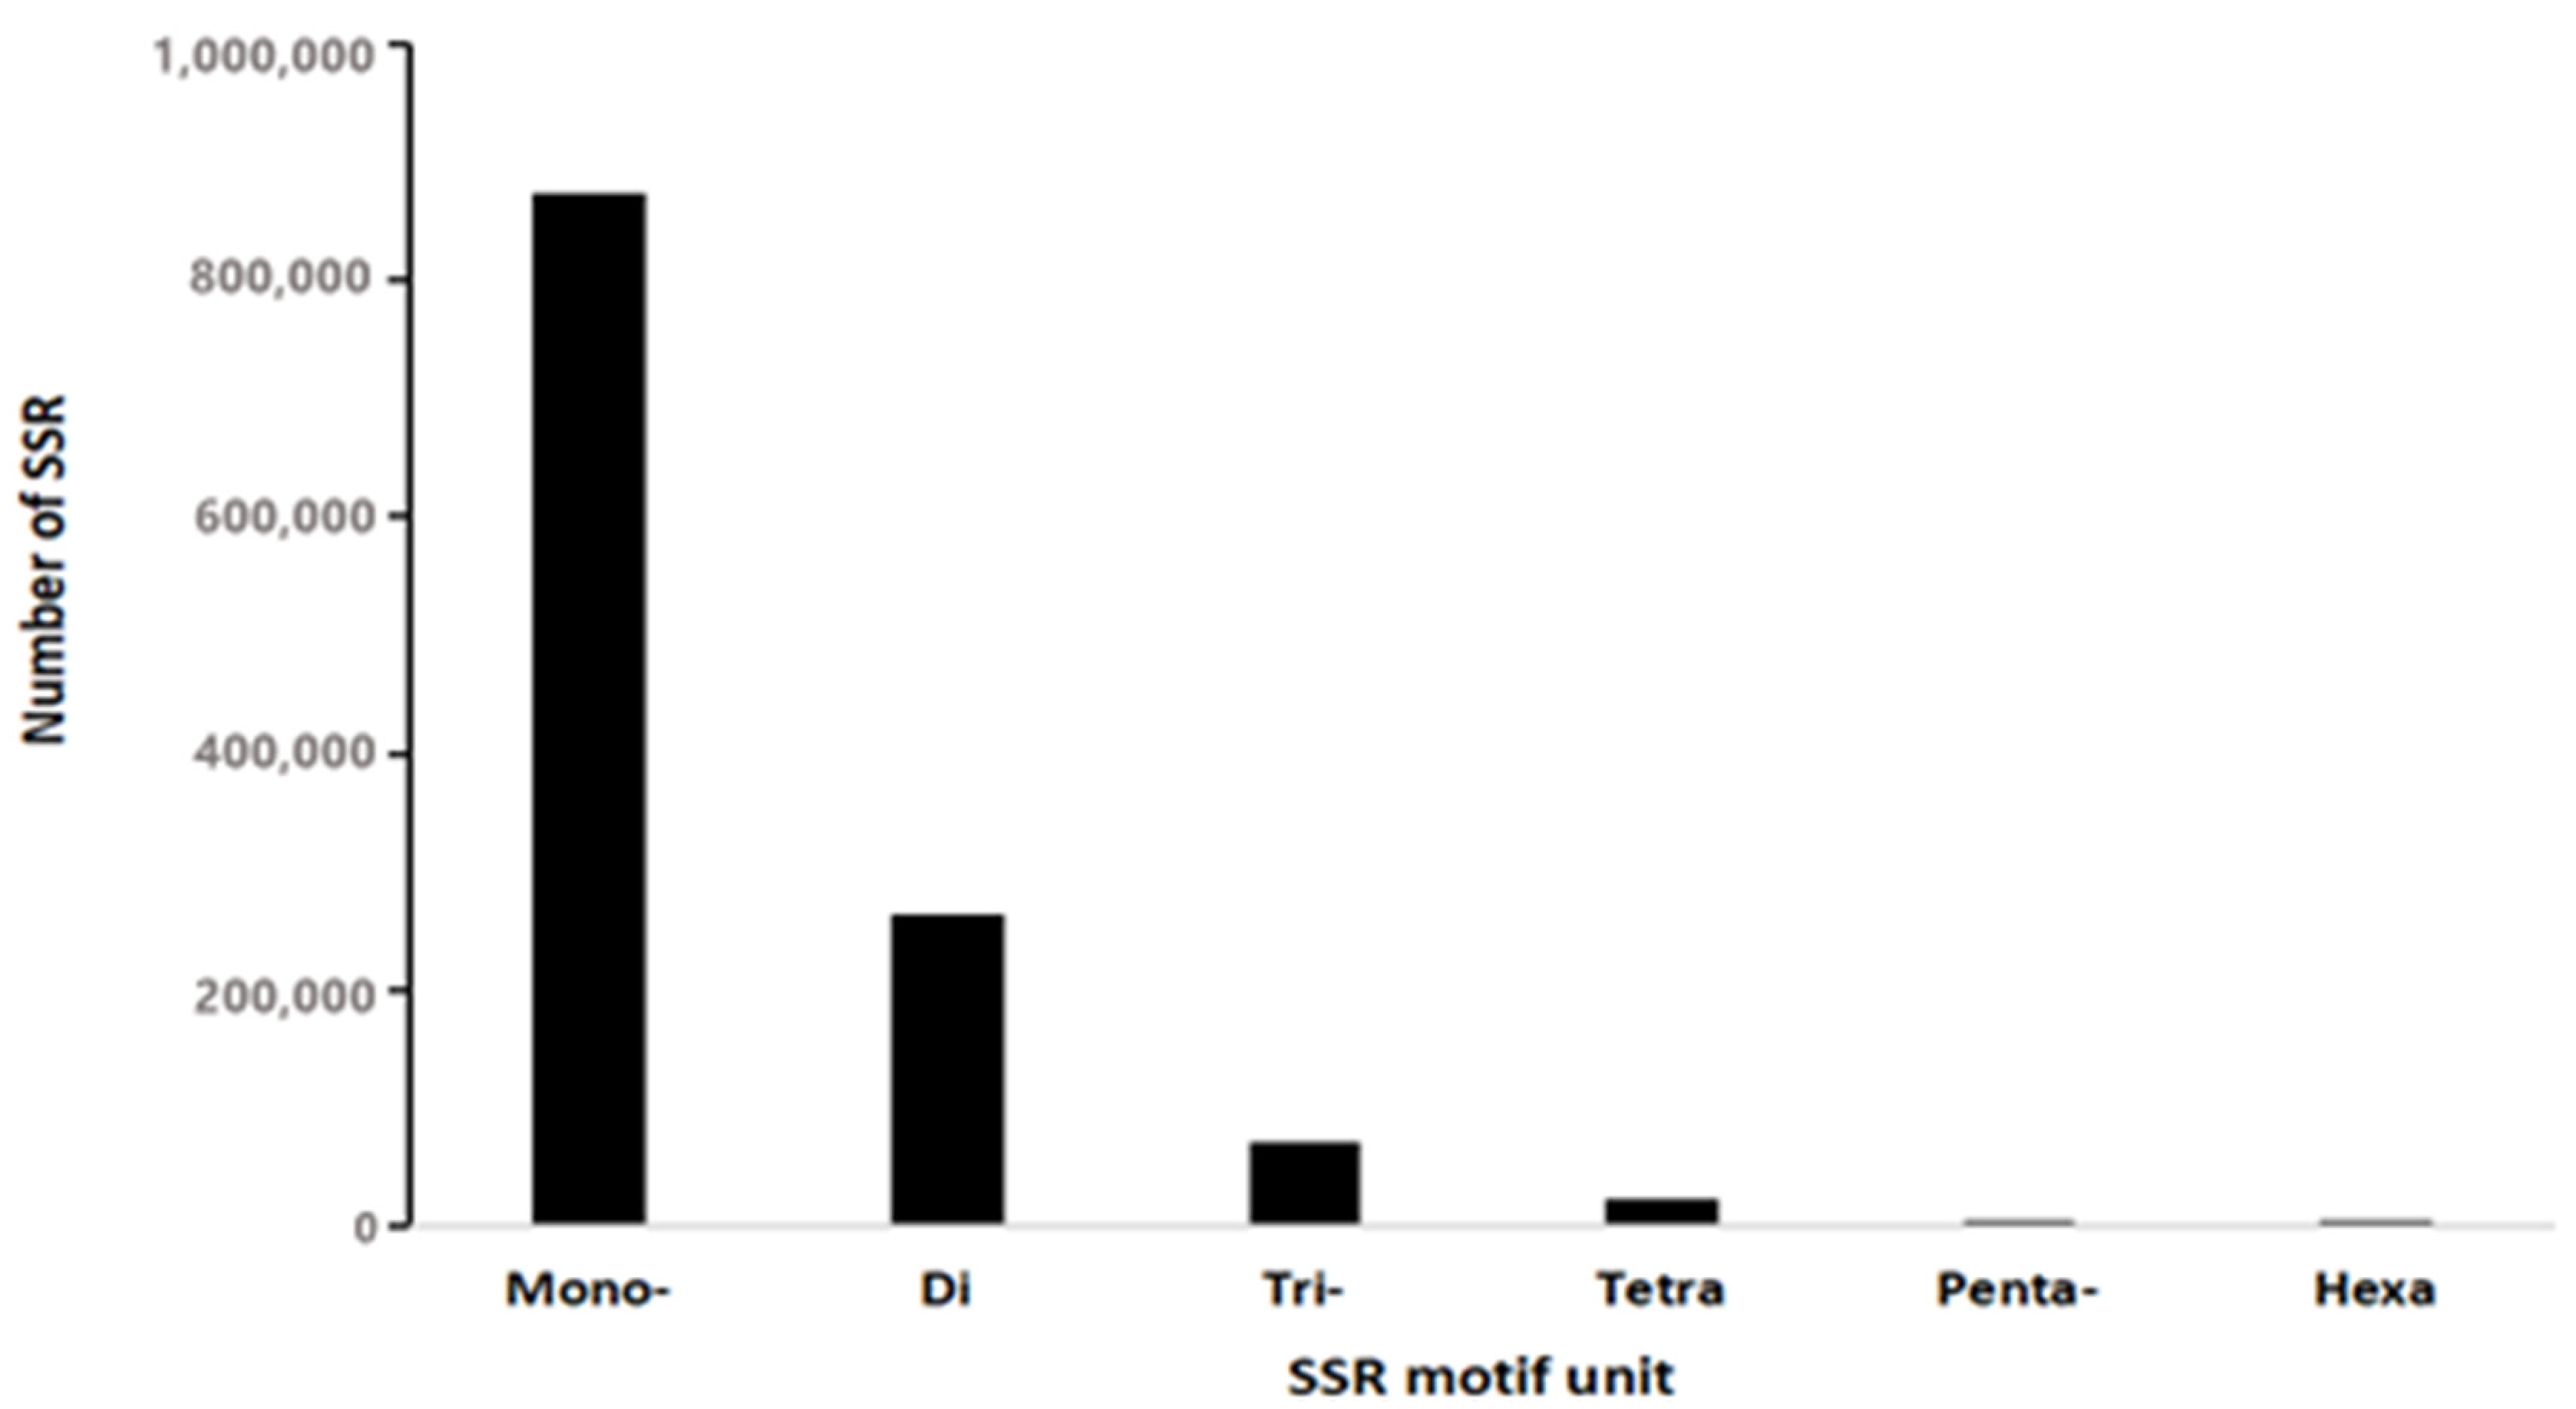
3.1. Distribution of SSR in Genome of L. leishanense
3.2. Polymorphism Microsatellite Loci
3.3. Population Genetic Diversity
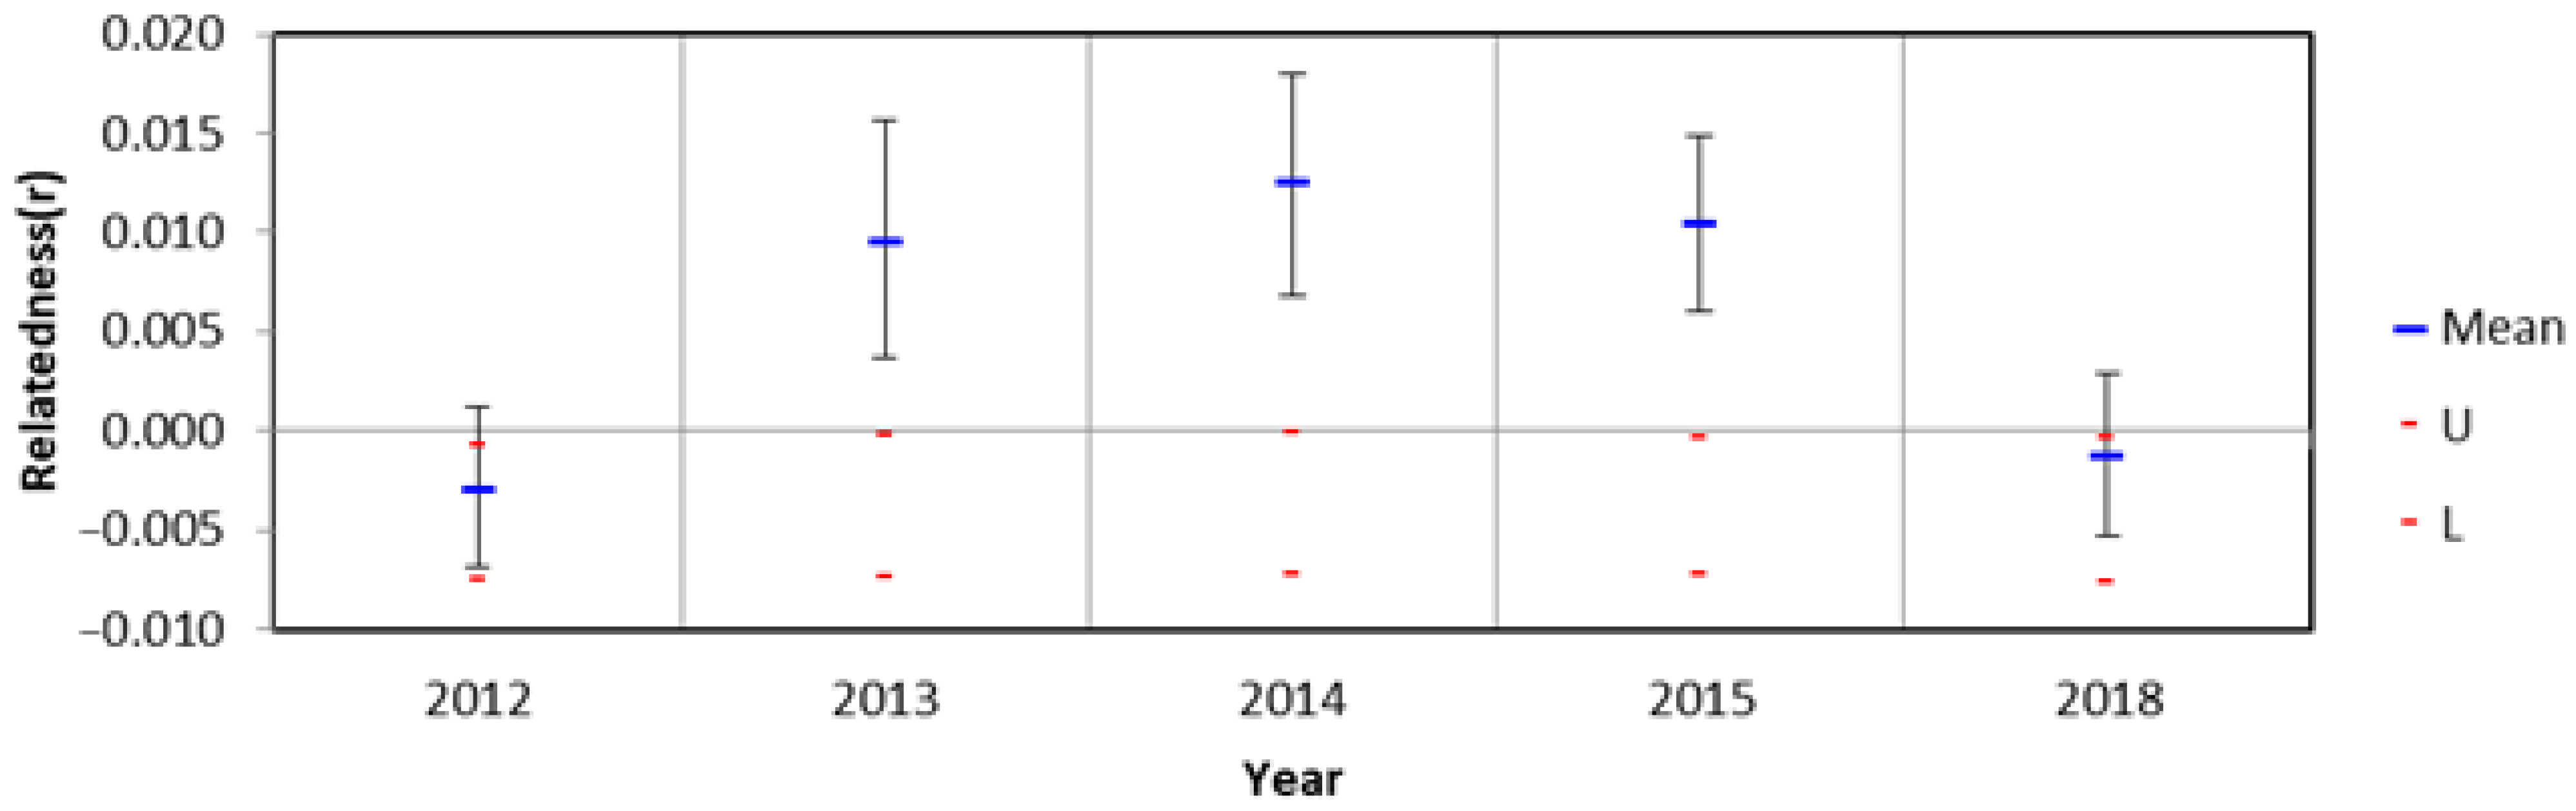
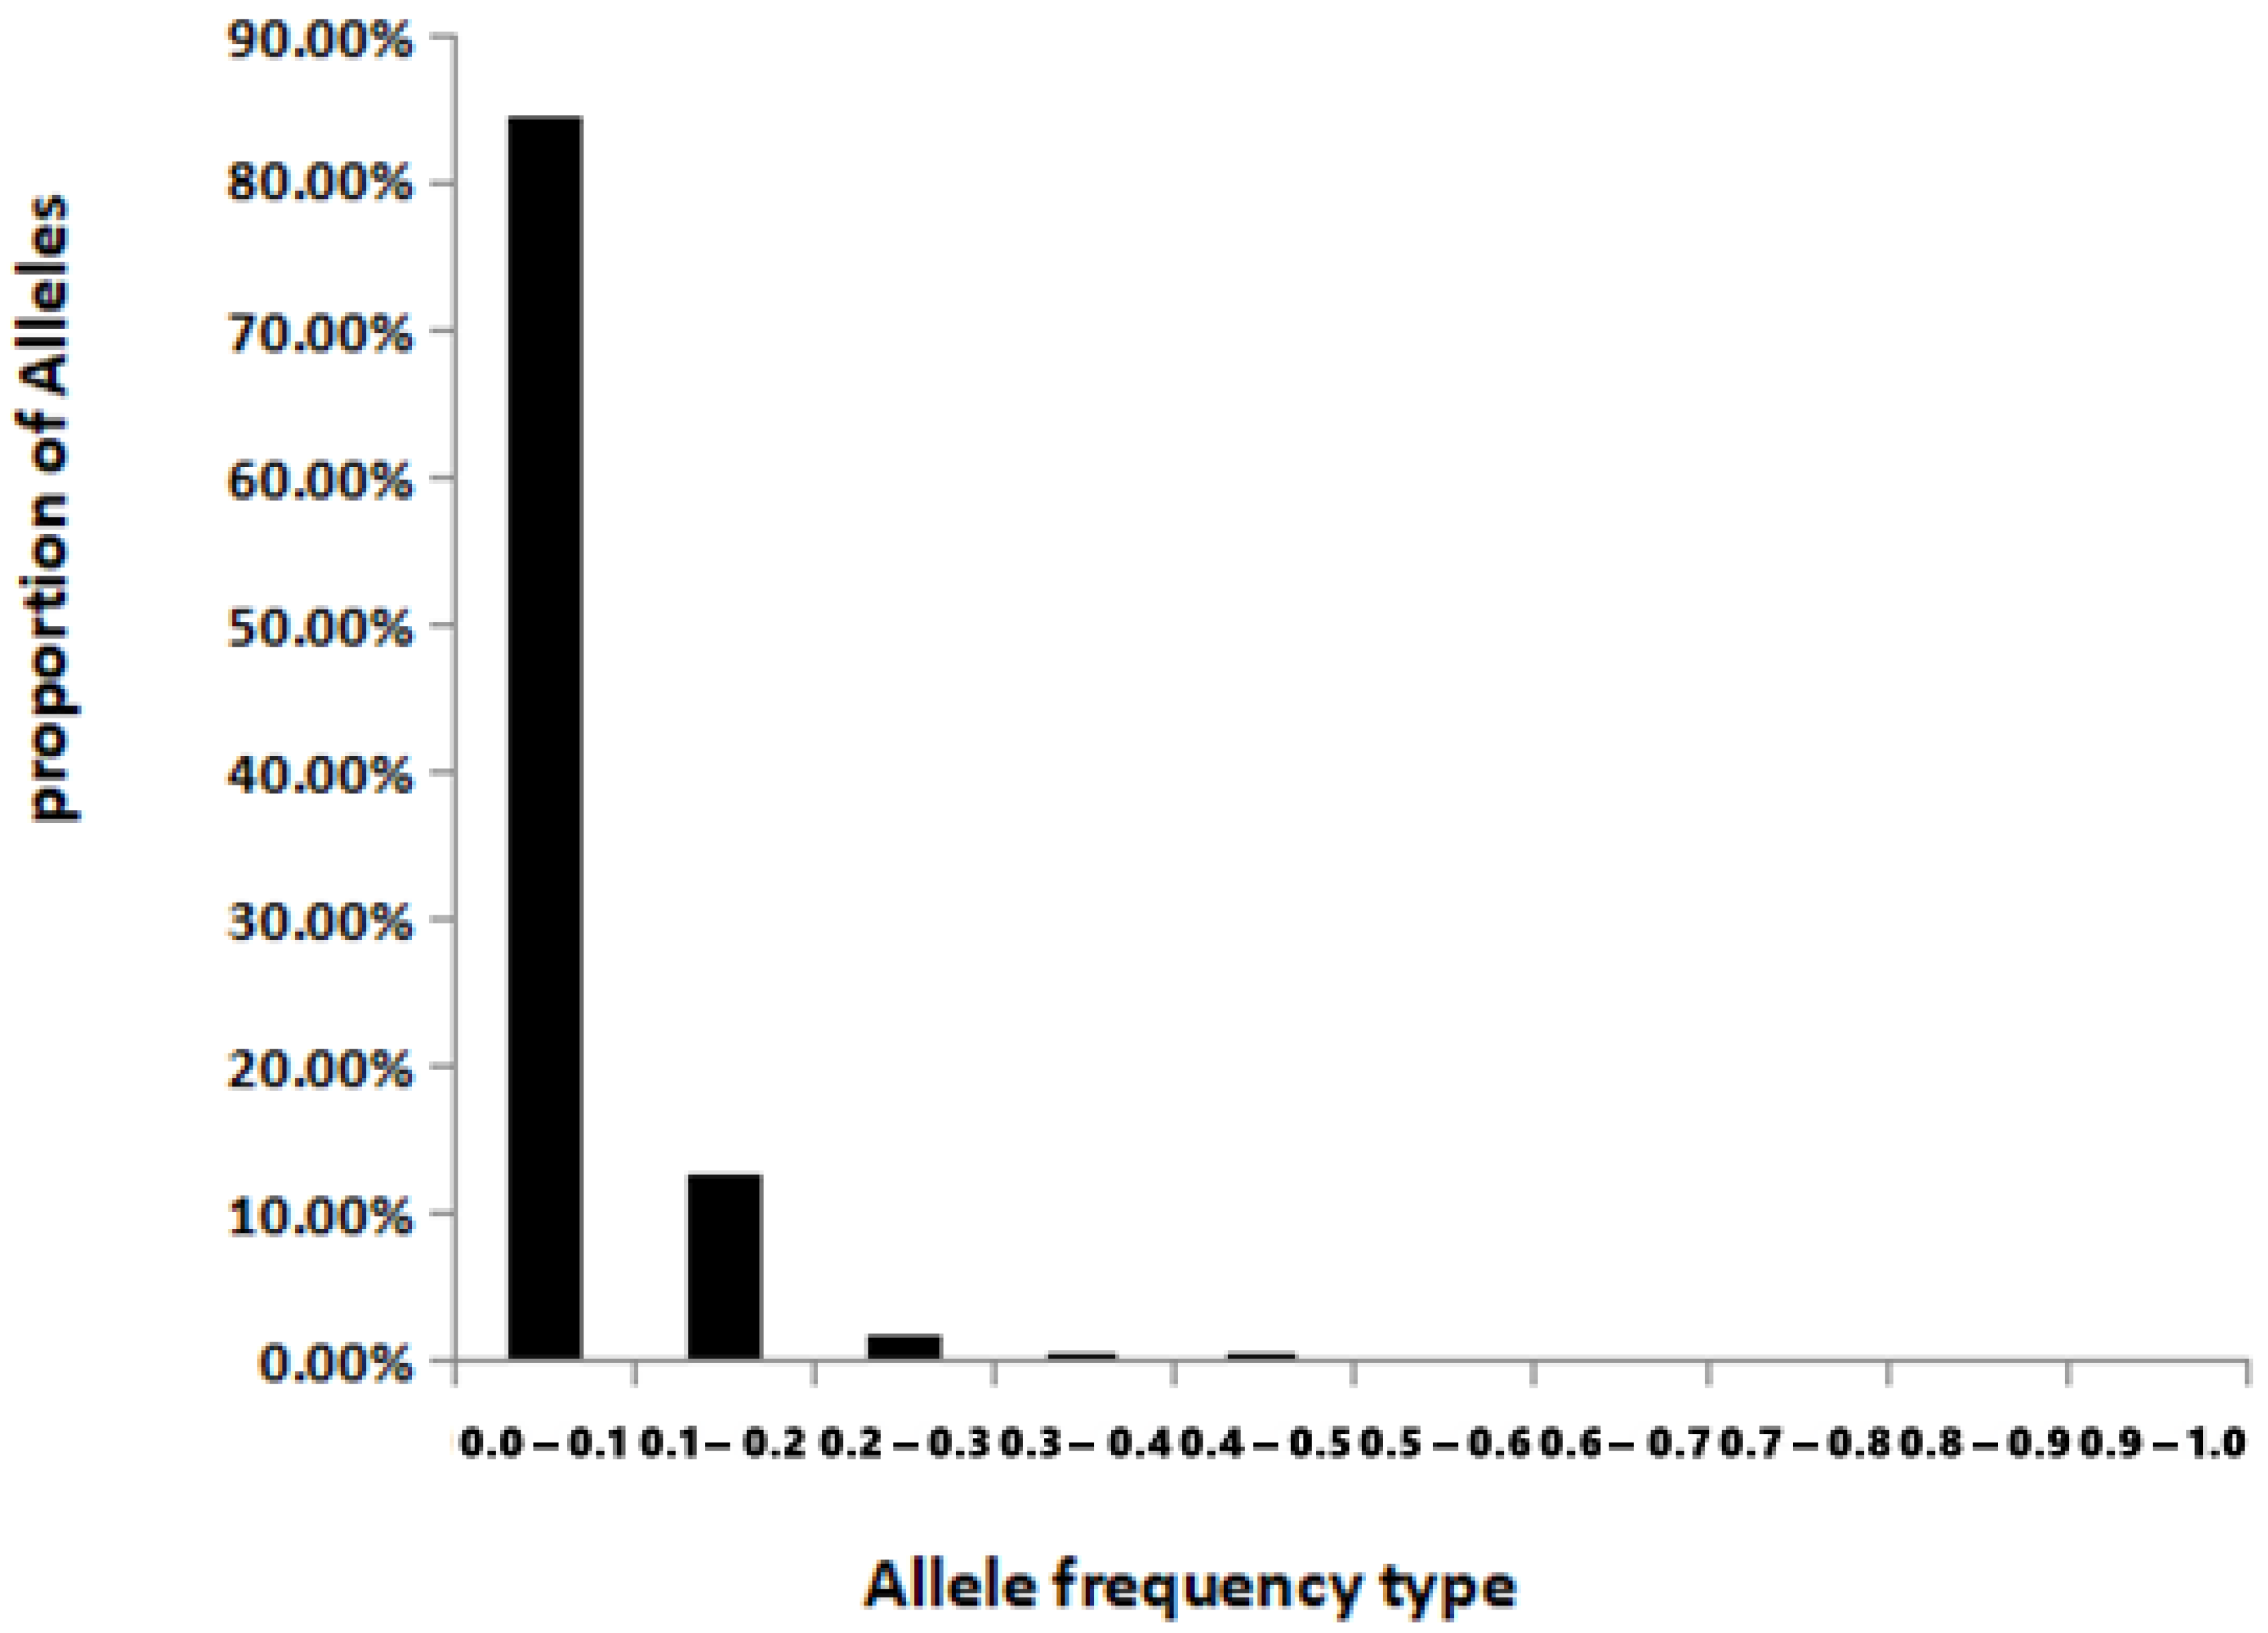
3.4. Population Bottleneck
3.5. Effective Population Size
4. Discussion
4.1. Tetranucleotide Microsatellite Markers
4.2. Genetic Diversity
4.3. Population Dynamics
5. Conclusions
Author Contributions
Funding
Institutional Review Board Statement
Informed Consent Statement
Data Availability Statement
Acknowledgments
Conflicts of Interest
References
- Houlahan, J.E.; Findlay, C.S.; Schmidt, B.R.; Meyer, A.H.; Kuzmin, S.L. Quantitative evidence for global amphibian population declines. Nature 2000, 404, 752–755. [Google Scholar] [CrossRef] [PubMed]
- Stuart, S.N.; Chanson, J.S.; Cox, N.A.; Young, B.E.; Rodrigues, A.S.; Fischman, D.L.; Waller, R.W. Status and trends of amphibian declines and extinctions worldwide. Science 2004, 306, 1783–1786. [Google Scholar] [CrossRef] [PubMed] [Green Version]
- McMenamin, S.K.; Hadly, E.A.; Wright, C.K. Climatic change and wetland desiccation cause amphibian decline in Yellowstone National Park. Proc. Natl. Acad. Sci. USA 2008, 105, 16988–16993. [Google Scholar] [CrossRef] [PubMed] [Green Version]
- Whitfield, S.M.; Bell, K.E.; Philippi, T.; Sasa, M.; Bolaños, F.; Chaves, G.; Savage, J.M.; Donnelly, M.A. Amphibian and reptile declines over 35 years at La Selva, Costa Rica. Proc. Natl. Acad. Sci. USA 2007, 104, 8352–8356. [Google Scholar] [CrossRef] [Green Version]
- Kiesecker, J.; Blaustein, A.; Belden, L. Complex causes of amphibian population declines. Nature 2001, 410, 681–684. [Google Scholar] [CrossRef]
- Fei, L.; Ye, C.Y. Amphibians of China (Ⅰ); Science Press: Beijing, China, 2016. (In Chinese) [Google Scholar]
- The IUCN Red List of Threatened Species. Available online: https://www.iucnredlist.org/species/57627/63864909 (accessed on 7 September 2021).
- Convention on Biological Diversity. Available online: https://www.cbd.int/sp/targets/ (accessed on 7 September 2021).
- Arens, P.; Bugter, R.; Van’t Westende, W.; Zollinger, R.; Stronks, J.; Vos, C.C.; Smulders, M.J. Microsatellite variation and population structure of a recovering Tree frog (Hyla arborea L.) metapopulation. Conserv. Genet. 2006, 7, 825–835. [Google Scholar] [CrossRef] [Green Version]
- Perl, R.B.; Geffen, E.; Malka, Y.; Barocas, A.; Renan, S.; Vences, M.; Gafny, S. Population genetic analysis of the recently rediscovered Hula painted frog (Latonia nigriventer) reveals high genetic diversity and low inbreeding. Sci. Rep. 2018, 8, 5588. [Google Scholar] [CrossRef] [Green Version]
- Yu, D.; Zheng, R.; Lu, Q.; Yang, G.; Fu, Y.; Zhang, Y. Genetic diversity and population structure for the conservation of giant spiny frog (Quasipaa spinosa) using microsatellite loci and mitochondrial DNA. Asian Herpetol. Res. 2016, 7, 75–86. [Google Scholar]
- Yun, S.A.; Son, H.D.; Im, H.T.; Kim, S.C. Genetic diversity and population structure of the endangered orchid Pelatantheria scolopendrifolia (Orchidaceae) in Korea. PLoS ONE 2020, 15, e0237546. [Google Scholar] [CrossRef]
- Allentoft, M.E.; O’Brien, J. Global amphibian declines, loss of genetic diversity and fitness: A review. Diversity 2010, 2, 47–71. [Google Scholar] [CrossRef] [Green Version]
- Frankham, R. Genetics and extinction. Biol. Conserv. 2005, 126, 131–140. [Google Scholar] [CrossRef]
- Frankham, R. Relationship of Genetic Variation to Population Size in Wildlife. Conserv. Biol. 1996, 10, 1500–1508. [Google Scholar] [CrossRef] [Green Version]
- Beebee, T.J.C. Conservation genetics of amphibians. Heredity 2005, 95, 423–427. [Google Scholar] [CrossRef]
- Lynch, M.; Conery, J.; Burger, R. Mutation Accumulation and the Extinction of Small Populations. Am. Nat. 1995, 146, 489–518. [Google Scholar] [CrossRef] [Green Version]
- Ralls, K.; Brugger, K.; Ballou, J. Inbreeding and juvenile mortality in small populations of ungulates. Science 1979, 206, 1101–1103. [Google Scholar] [CrossRef]
- Primmer, C.R. From conservation genetics to conservation genomics. Ann. N. Y. Acad. Sci. 2009, 1162, 357–368. [Google Scholar] [CrossRef] [PubMed]
- DeFaveri, J.; Viitaniemi, H.; Leder, E.; Merilä, J. Characterizing genic and nongenic molecular markers: Comparison of microsatellites and SNPs. Mol. Ecol. Resour. 2013, 13, 377–392. [Google Scholar] [CrossRef]
- Wilson, A.B.; Ashe, J.; Padron, M.; Hamilton, H. Comprehensive genus-wide screening of seahorse microsatellite loci identifies priority species for conservation assessment. Conserv. Genet. Resour. 2021, 13, 221–230. [Google Scholar] [CrossRef]
- Li, J.; Wei, S.; Hu, M.; Luo, Z.; Zhao, M.; Wu, H. Reflection of paleoclimate oscillations and tectonic events in the phylogeography of moustache toads in southern China. J. Zool. 2018, 305, 17–26. [Google Scholar] [CrossRef] [Green Version]
- Wang, J.; Cheng, J.; Zhang, R.P.; Wang, Y.Z.; Li, C.L.; Wu, H. Microsatellite DNA markers for mating systems analysis in the Leishan moustache toad (Vibrissaphora leishanensis). Conserv. Genet. Resour. 2011, 3, 761–763. [Google Scholar] [CrossRef]
- Zhang, W.; Luo, Z.; Zhao, M.; Wu, H. High genetic diversity in the endangered and narrowly distributed amphibian species Leptobrachium leishanense. Integr. Zool. 2015, 10, 465–481. [Google Scholar] [CrossRef]
- Archie, E.A.; Moss, C.J.; Alberts, S.C. Characterization of tetranucleotide microsatellite loci in the African savannah elephant (Loxodonta africana africana). Mol. Ecol. Notes 2003, 3, 244–246. [Google Scholar] [CrossRef]
- Hu, L.; Xia, Y.; Zheng, Y.; Zeng, X. Isolation and characterization of ten microsatellite loci for the Chong’an moustache toad Leptobrachium liui (Anura: Megophryidae). Conserv. Genet. Resour. 2012, 4, 877–879. [Google Scholar] [CrossRef] [Green Version]
- Xu, Z.C.; Jin, Y.C.; Milne, R.I.; Xiahou, Z.Y.; Qin, H.T.; Ye, L.J.; Gao, L.M.; Liu, J.; Li, D.Z. Development of 32 novel microsatellite loci in Juglans sigillata using genomic data. Appl. Plant. Sci. 2020, 8, e11328. [Google Scholar] [CrossRef] [Green Version]
- Li, J.; Yu, H.; Wang, W.; Fu, C.; Zhang, W.; Han, F.; Wu, H. Genomic and transcriptomic insights into molecular basis of sexually dimorphic nuptial spines in Leptobrachium leishanense. Nat. Commun. 2019, 10, 5551. [Google Scholar] [CrossRef] [PubMed] [Green Version]
- Beier, S.; Thiel, T.; Münch, T.; Scholz, U.; Mascher, M. MISA-web: A web server for microsatellite prediction. Bioinformatics 2017, 33, 2583–2585. [Google Scholar] [CrossRef] [Green Version]
- Botstein, D.; White, R.L.; Skolnick, M.; Davis, R.W. Construction of a genetic linkage map in man using restriction fragment length polymorphisms. Am. J. Hum. Genet. 1980, 32, 314–331. [Google Scholar]
- Holland, M.M.; Parson, W. GeneMarker® HID: A reliable software tool for the analysis of forensic STR data. J. Forensic Sci. 2011, 56, 29–35. [Google Scholar] [CrossRef]
- Park, S. Microsatellite Toolkit; Trinity College: Dublin, Ireland, 2001. [Google Scholar]
- Kalinowski, S.T.; Taper, M.L.; Marshall, T.C. Revising how the computer program CERVUS accommodates genotyping error increases success in paternity assignment. Mol. Ecol. 2007, 16, 1099–1106. [Google Scholar] [CrossRef]
- Van Oosterhout, C.; Hutchinson, W.F.; Wills, D.P.; Shipley, P. MICRO-CHECKER: Software for identifying and correcting genotyping errors in microsatellite data. Mol. Ecol. Notes 2004, 4, 535–538. [Google Scholar] [CrossRef]
- Raymond, M. GENEPOP (version 1.2): Population genetics software for exact tests and ecumenicism. J. Hered. 1995, 86, 248–249. [Google Scholar] [CrossRef]
- Peakall, R.O.D.; Smouse, P.E. GENALEX 6: Genetic analysis in Excel. Population genetic software for teaching and research. Mol. Ecol. Notes 2006, 6, 288–295. [Google Scholar] [CrossRef]
- Goudet, J. FSTAT (Version 2.9.3.2): A Program to Estimate and Test Gene Diversities and Fixation Indices. 2002. Available online: http://www.unil.ch/izea/software/fstat.html (accessed on 17 November 2019).
- Cornuet, J.M.; Luikart, G. Description and power analysis of two tests for detecting recent population bottlenecks from allele frequency data. Genetics 1996, 144, 2001–2014. [Google Scholar] [CrossRef]
- Do, C.; Waples, R.S.; Peel, D.; Macbeth, G.M.; Tillett, B.J.; Ovenden, J.R. NeEstimator v2: Re-implementation of software for the estimation of contemporary effective population size (Ne) from genetic data. Mol. Ecol. Resour. 2014, 14, 209–214. [Google Scholar] [CrossRef]
- Wright, S. Variability within and among Natural Populations. In Evolution and the Genetics of Populations; The University of Chicago Press: Chicago, IL, USA, 1978; Volume 4. [Google Scholar]
- O’Reilly, P. Isolation of twenty low stutter di- and tetranucleotide microsatellites for population analyses of walleye pollock and other gadoids. J. Fish. Biol. 2000, 56, 1074–1086. [Google Scholar] [CrossRef]
- Schlötterer, C.; Tautz, D. Slippage synthesis of simple sequence DNA. Nucleic. Acids. Res. 1992, 20, 211–215. [Google Scholar] [CrossRef] [Green Version]
- Edwards, A.; Civitello, A.; Hammond, H.A.; Caskey, C.T. DNA typing and genetic mapping with trimeric and tetrameric tandem repeats. Am. J. Hum. Genet. 1991, 49, 746. [Google Scholar] [PubMed]
- Walsh, P.S.; Fildes, N.J.; Reynolds, R. Sequence analysis and characterization of stutter products at the tetranucleotide repeat locus vWA. Nucleic. Acids. Res. 1996, 24, 2807–2812. [Google Scholar] [CrossRef]
- Huang, K.; Guo, S.; Cushman, S.A.; Dunn, D.W.; Qi, X.; Hou, R.; Zhang, J.; Li, Q.; Zhang, Q.; Shi, Z.; et al. Population structure of the golden snub-nosed monkey Rhinopithecus roxellana in the Qinling Mountains, central China. Integr. Zool. 2016, 11, 350–360. [Google Scholar] [CrossRef]
- Finger, A.; Kettle, C.J.; Kaiser-Bunbury, C.N.; Valentin, T.; Doudee, D.; Matatiken, D.; Ghazoul, J. Back from the brink: Potential for genetic rescue in a critically endangered tree. Mol. Ecol. 2011, 20, 3773–3784. [Google Scholar] [CrossRef] [PubMed]
- Jian, H.; Li, S.; Guo, J.; Li, S.; Wang, Q.; Yan, H.; Qiu, X.; Zhang, Y.; Cai, Z.; Volis, S.; et al. High genetic diversity and differentiation of an extremely narrowly distributed and critically endangered decaploid rose (Rosa praelucens): Implications for its conservation. Conserv. Genet. 2018, 19, 761–776. [Google Scholar] [CrossRef]
- Li, B.; Wang, A.; Zhang, P.; Li, W. Genetic diversity and population structure of endangered Glehnia littoralis (Apiaceae) in China based on AFLP analysis. Biotechnol. Biotechnol. Eq. 2019, 33, 331–337. [Google Scholar] [CrossRef] [Green Version]
- Yue, X.; Chen, J.; Guo, Y.; Wang, Q. Population genetic structure of Sagittaria natans (Alismataceae), an endangered species in China, revealed by nuclear SSR loci analyses. Biochem. Syst. Ecol. 2011, 39, 412–418. [Google Scholar] [CrossRef]
- Tzedakis, P.C.; Lawson, I.T.; Frogley, M.R.; Hewitt, G.M.; Preece, R.C. Buffered tree population changes in a Quaternary refugium: Evolutionary implications. Science 2002, 297, 2044–2047. [Google Scholar] [CrossRef] [PubMed] [Green Version]
- Zheng, Y.; Hu, J.; Zeng, X. Examining the interglacial high-elevation refugia scenario in East Asian subtropical mountain systems with the frog species Leptobrachium liui. Ecol. Evol. 2018, 8, 9326–9340. [Google Scholar] [CrossRef]
- Curik, I.; Zechner, P.; Solkner, J.; Achmann, R.; Bodo, I.; Dovc, P.; Kavar, T.; Marti, E.; Brem, G. Inbreeding, microsatellite heterozygosity, and morphological traits in Lipizzan horses. J. Hered. 2003, 94, 125–132. [Google Scholar] [CrossRef] [Green Version]
- Kosman, E.; Jokela, J. Dissimilarity of individual microsatellite profiles under different mutation models: Empirical approach. Ecol. Evol. 2019, 9, 4038–4054. [Google Scholar] [CrossRef]
- Nei, M.; Maruyama, T.; Chakraborty, R. The bottleneck effect and genetic variability in populations. Evolution 1975, 29, 1–10. [Google Scholar] [CrossRef]
- Luikart, G.; Allendorf, F.W.; Cornuet, J.M.; Sherwin, W.B. Distortion of allele frequency distributions provides a test for recent population bottlenecks. J. Hered. 1998, 89, 238–247. [Google Scholar] [CrossRef] [PubMed]
- Zhao, Y.; Zhu, X.; Li, Z.; Xu, W.; Dong, J.; Wei, H.; Li, Y.; Li, X. Genetic diversity and structure of Chinese grass shrimp, Palaemonetes sinensis, inferred from transcriptome-derived microsatellite markers. BMC Genet. 2019, 20, 75. [Google Scholar] [CrossRef]
- Nei, M.; Chakraborty, R.; Fuerst, P.A. Infinite allele model with varying mutation rate. Proc. Natl. Acad. Sci. USA 1976, 73, 4164–4168. [Google Scholar] [CrossRef] [PubMed] [Green Version]
- Hill, W.G. Estimation of linkage disequilibrium in randomly mating populations. Heredity 1974, 33, 229–239. [Google Scholar] [CrossRef] [PubMed] [Green Version]

| Locus | Primer Sequence (5′-3′) (F, Forward; R, Reverse) | Repeat Motif | PCR Production (μL) | Labelling Dye | Ta (°C) | Size Range (bp) | Na | Ho | He | PIC |
|---|---|---|---|---|---|---|---|---|---|---|
| LEA22 | F:TGCGACTACGTAACCCTGTG R:AGGAAATGAGCCTTTGCCTC | (AGAT)16 | 3 | 5′ FAM | 56 °C | 216–292 | 6 | 0.609 | 0.622 | 0.537 |
| LEA25 | F:GTGGTTGGTTGGTTGGGTC R:TGGTCAGGATGTGAGGAGTG | (TGGT)13 | 6 | 5′ HEX | 58 °C | 226–282 | 14 | 0.826 | 0.889 | 0.856 |
| LEA20 | F:ATTTGATGGTGTCTGGGAGG R:CTAAGAGAGCCGAAACGTCG | (GATA)13 | 9 | 5′ TAMRA | 58 °C | 195–263 | 16 | 0.870 | 0.930 | 0.903 |
| LEA35 | F:GCGGGAGTTTGAGCTGTATC R:CAGCTTACATTGTGTGCAGC | (CTAT)14 | 3 | 5′ FAM | 62 °C | 192–260 | 16 | 0.913 | 0.925 | 0.897 |
| LEA14 | F:ATAAGCTAAACAGGCGTGGG R:TTTCATATCAGGGGAGAGCG | (TTTC)18 | 6 | 5′ HEX | 62 °C | 150–234 | 14 | 0.870 | 0.882 | 0.851 |
| LEA23 | F:CCAGGAACAAGGTCAGTGGT R:CCCATGTTCGAGAGGAGAAG | (TCTA)18 | 9 | 5′ TAMRA | 64 °C | 178–258 | 10 | 0.739 | 0.850 | 0.812 |
| LEA5 | F:TCAACTCAACTCTCCCCCTG R:AACGCACATCCCTAGTGGTC | (CTTT)14 | 3 | 5′ FAM | 60 °C | 183–199 | 11 | 0.826 | 0.859 | 0.823 |
| LEA7 | F:ACCATCAATTTTAGGGGTGC R:TGGGATTTCCCAGTCATTTC | (AGAT)20 | 6 | 5′ HEX | 60 °C | 178–246 | 14 | 0.826 | 0.908 | 0.879 |
| LEA47 | F:GACAAATGGGGAGATGATGG R:AAAACGTCAGTGGCAAATCC | (AGAT)17 | 9 | 5′ TAMRA | 62 °C | 162–261 | 11 | 0.739 | 0.886 | 0.853 |
| LEA24 | F:GTGAAACTTGCATCCACTGC R:AAAATTAGCTATGGGTGGCG | (TATC)20 | 3 | 5′ FAM | 62 °C | 205–289 | 15 | 0.913 | 0.931 | 0.904 |
| LEA2 | F:CACCCCGTGACAATATACCC R:TGAGGGATCATTCTTCTGGC | (GATA)11 | 6 | 5′ HEX | 62 °C | 207–251 | 11 | 0.913 | 0.892 | 0.859 |
| LEA53 | F:ATGGATAGATGGATGGCTGG R:CAACGCGGAAAAAGAAACAT | (TAGA)13 | 9 | 5′ TAMRA | 62 °C | 210–254 | 13 | 0.913 | 0.918 | 0.889 |
| Locus | 2012–2018 | 2012 | 2013 | 2014 | 2015 | 2018 |
|---|---|---|---|---|---|---|
| PHWE | PHWE | PHWE | PHWE | PHWE | PHWE | |
| LEA22 | 0.061 | 0.441 | 0.073 | 0.157 | 0.282 | 0.031 |
| LEA25 | 0.044 | 0.737 | 0.009 | 0.139 | 0.509 | 0.073 |
| LEA20 | 0.019 | 1.000 | 0.003* | 0.541 | 0.205 | 0.335 |
| LEA35 | 0.435 | 0.229 | 0.607 | 0.207 | 0.917 | 0.151 |
| LEA14 | 0.070 | 0.266 | 0.025 | 0.479 | 0.395 | 0.091 |
| LEA23 | 0.000 * | 0.108 | 0.023 | 0.038 | 0.000 * | 0.003 * |
| LEA5 | 0.237 | 0.657 | 0.053 | 0.843 | 0.984 | 0.208 |
| LEA7 | 0.004 * | 0.541 | 0.330 | 0.426 | 0.004 * | 0.004 * |
| LEA47 | 0.000 * | 0.862 | 0.100 | 0.695 | 0.014 | 0.004 * |
| LEA24 | 0.037 | 0.133 | 0.914 | 0.844 | 0.447 | 0.086 |
| LEA2 | 0.000 * | 0.006 | 0.010 | 0.012 | 0.000 * | 0.008 |
| LEA53 | 0.001 * | 0.017 | 0.280 | 0.491 | 0.727 | 0.019 |
| Year | 2012 | 2013 | 2014 | 2015 | 2018 |
|---|---|---|---|---|---|
| 2012 | 0.000 | 0.006 | 0.010 | 0.011 | 0.000 |
| 2013 | 0.006 | 0.000 | 0.010 | 0.032 | 0.017 |
| 2014 | 0.010 | 0.010 | 0.000 | 0.038 | 0.019 |
| 2015 | 0.011 | 0.032 | 0.038 | 0.000 | 0.009 |
| 2018 | 0.000 | 0.017 | 0.019 | 0.009 | 0.000 |
| Locus | Na | Ar | Ne | PIC | Ho | He | Hs | Fis |
|---|---|---|---|---|---|---|---|---|
| LEA22 | 25.000 | 25.000 | 14.371 | 0.926 | 0.858 | 0.934 | 0.935 | 0.082 |
| LEA25 | 16.000 | 16.000 | 9.658 | 0.888 | 0.792 | 0.900 | 0.901 | 0.121 |
| LEA20 | 21.000 | 21.000 | 13.097 | 0.919 | 0.867 | 0.928 | 0.928 | 0.066 |
| LEA35 | 19.000 | 19.000 | 11.950 | 0.910 | 0.908 | 0.920 | 0.920 | 0.013 |
| LEA14 | 16.000 | 16.000 | 10.119 | 0.893 | 0.858 | 0.905 | 0.905 | 0.052 |
| LEA23 | 23.000 | 23.000 | 14.180 | 0.925 | 0.767 | 0.933 | 0.934 | 0.179 |
| LEA5 | 11.000 | 11.000 | 3.034 | 0.615 | 0.583 | 0.673 | 0.674 | 0.134 |
| LEA7 | 17.000 | 17.000 | 8.177 | 0.867 | 0.783 | 0.881 | 0.882 | 0.112 |
| LEA47 | 25.000 | 25.000 | 12.991 | 0.918 | 0.817 | 0.927 | 0.927 | 0.119 |
| LEA24 | 20.000 | 20.000 | 12.010 | 0.911 | 0.867 | 0.921 | 0.921 | 0.059 |
| LEA2 | 16.000 | 16.000 | 8.518 | 0.873 | 0.683 | 0.886 | 0.887 | 0.230 |
| LEA53 | 12.000 | 12.000 | 7.234 | 0.847 | 0.750 | 0.865 | 0.866 | 0.134 |
| Mean | 18.417 | 18.417 | 10.445 | 0.874 | 0.794 | 0.890 | 0.890 | 0.107 |
| Locus | Sample Size | He | IAM | TPM | SMM | |||
|---|---|---|---|---|---|---|---|---|
| Heq | p | Heq | p | Heq | p | |||
| LEA22 | 120 | 0.934 | 0.877 | 0.005 * | 0.930 | 0.453 | 0.937 | 0.336 |
| LEA25 | 120 | 0.900 | 0.792 | 0.004 * | 0.885 | 0.296 | 0.899 | 0.473 |
| LEA20 | 120 | 0.928 | 0.850 | 0.000 * | 0.914 | 0.228 | 0.923 | 0.502 |
| LEA35 | 120 | 0.920 | 0.829 | 0.002 * | 0.902 | 0.176 | 0.916 | 0.501 |
| LEA14 | 120 | 0.905 | 0.796 | 0.003 * | 0.884 | 0.186 | 0.899 | 0.456 |
| LEA23 | 120 | 0.933 | 0.864 | 0.001 * | 0.923 | 0.290 | 0.933 | 0.495 |
| LEA5 | 120 | 0.673 | 0.700 | 0.318 | 0.825 | 0.010 * | 0.848 | 0.000 * |
| LEA7 | 120 | 0.881 | 0.808 | 0.080 | 0.893 | 0.260 | 0.905 | 0.091 |
| LEA47 | 120 | 0.927 | 0.876 | 0.028 * | 0.930 | 0.371 | 0.937 | 0.144 |
| LEA24 | 120 | 0.921 | 0.836 | 0.007 * | 0.910 | 0.332 | 0.920 | 0.448 |
| LEA2 | 120 | 0.886 | 0.793 | 0.030 * | 0.884 | 0.476 | 0.900 | 0.205 |
| LEA53 | 120 | 0.865 | 0.727 | 0.018 * | 0.844 | 0.296 | 0.862 | 0.469 |
| Test | PIAM | PTPM | PSMM |
|---|---|---|---|
| Sign test | 0.0230 * | 0.1887 | 0.5983 |
| Wilcoxon test | 0.0002 * | 0.0549 | 0.7651 |
Publisher’s Note: MDPI stays neutral with regard to jurisdictional claims in published maps and institutional affiliations. |
© 2021 by the authors. Licensee MDPI, Basel, Switzerland. This article is an open access article distributed under the terms and conditions of the Creative Commons Attribution (CC BY) license (https://creativecommons.org/licenses/by/4.0/).
Share and Cite
Fu, C.; Ai, Q.; Cai, L.; Qiu, F.; Yao, L.; Wu, H. Genetic Diversity and Population Dynamics of Leptobrachium leishanense (Anura: Megophryidae) as Determined by Tetranucleotide Microsatellite Markers Developed from Its Genome. Animals 2021, 11, 3560. https://doi.org/10.3390/ani11123560
Fu C, Ai Q, Cai L, Qiu F, Yao L, Wu H. Genetic Diversity and Population Dynamics of Leptobrachium leishanense (Anura: Megophryidae) as Determined by Tetranucleotide Microsatellite Markers Developed from Its Genome. Animals. 2021; 11(12):3560. https://doi.org/10.3390/ani11123560
Chicago/Turabian StyleFu, Chao, Qingbo Ai, Ling Cai, Fuyuan Qiu, Lei Yao, and Hua Wu. 2021. "Genetic Diversity and Population Dynamics of Leptobrachium leishanense (Anura: Megophryidae) as Determined by Tetranucleotide Microsatellite Markers Developed from Its Genome" Animals 11, no. 12: 3560. https://doi.org/10.3390/ani11123560
APA StyleFu, C., Ai, Q., Cai, L., Qiu, F., Yao, L., & Wu, H. (2021). Genetic Diversity and Population Dynamics of Leptobrachium leishanense (Anura: Megophryidae) as Determined by Tetranucleotide Microsatellite Markers Developed from Its Genome. Animals, 11(12), 3560. https://doi.org/10.3390/ani11123560