
Measurements of Chemical Compositions in Corn Stover and Wheat Straw by Near-Infrared Reflectance Spectroscopy

Abstract
:Simple Summary
Abstract
1. Introduction
2. Materials and Methods
2.1. Sample Collection and Preparation
2.2. Analyses of Samples by Laboratory Reference Methods
2.3. Packing and Scanning by Near-Infrared Spectrometer
2.4. Development and Validation of NIRS Calibration Models
3. Results and Discussion
3.1. Laboratory Reference Data
3.2. Spectroscopic Analysis
3.3. Development of Calibration Models for Two Straw Materials
3.4. External Validation of the Calibration Models for Two Straw Materials
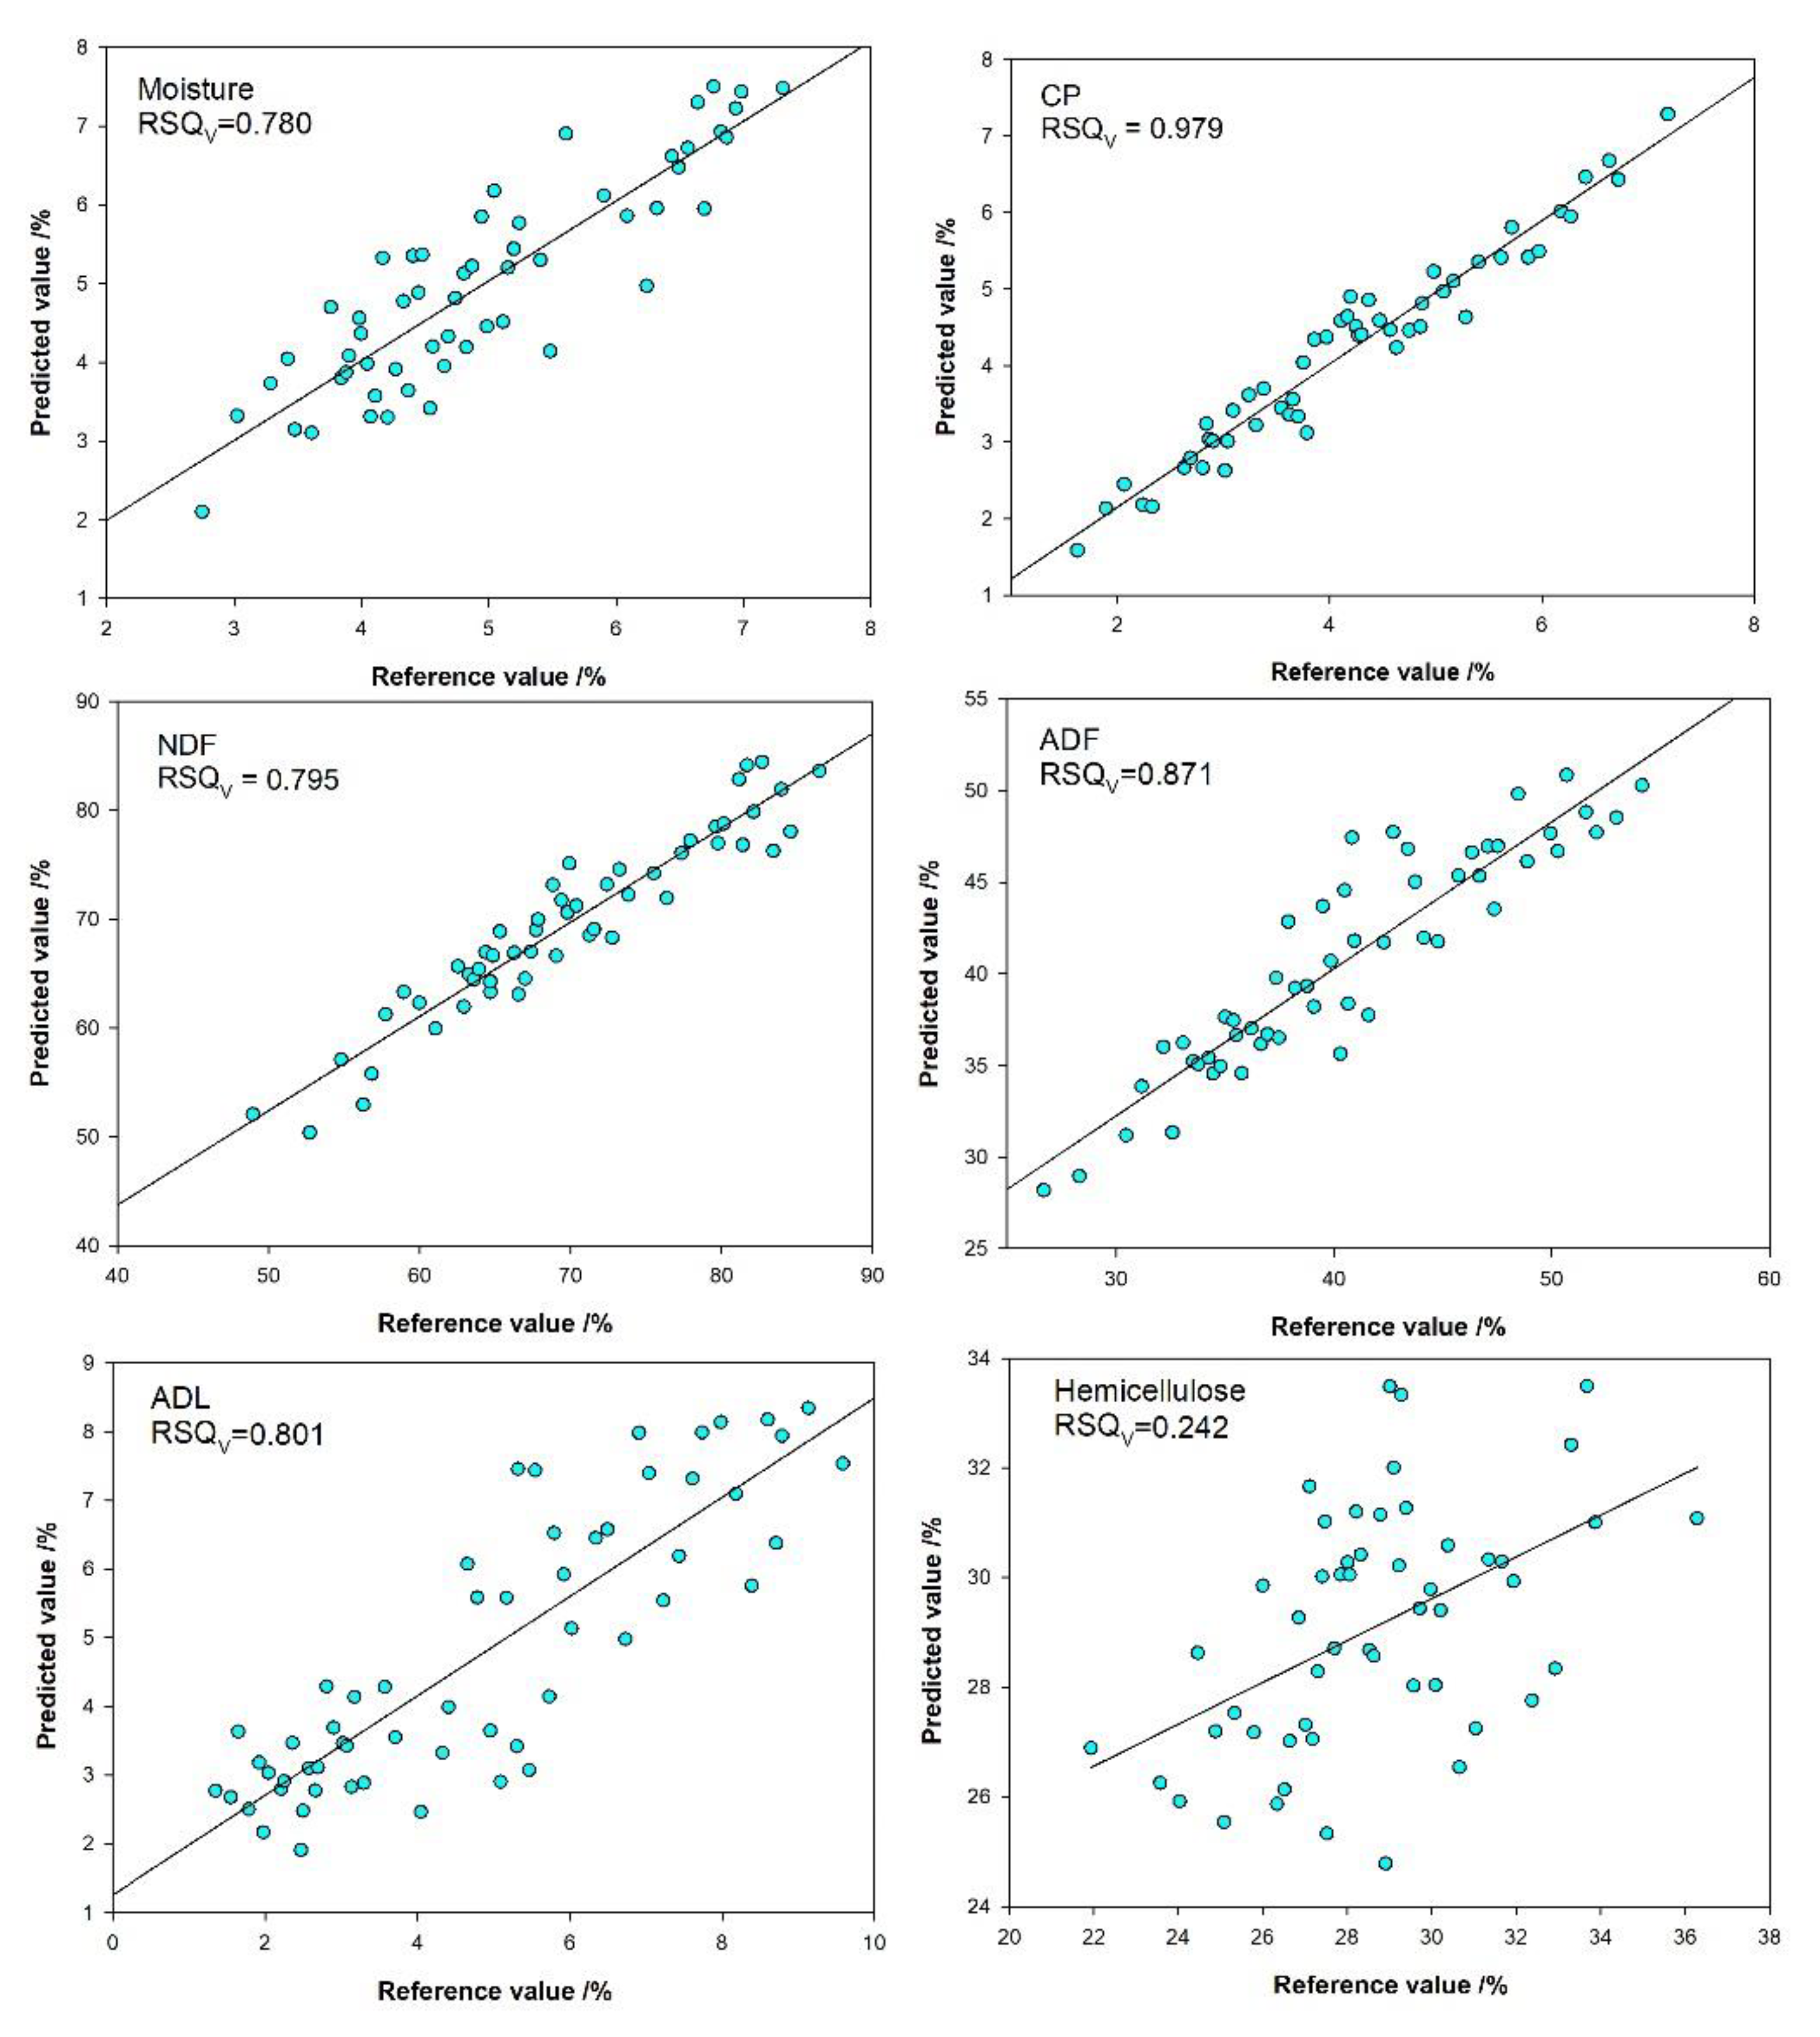
3.5. Best Calibration Models for Pooled Spectra of Both Corn and Wheat Straw
4. Conclusions
Author Contributions
Funding
Institutional Review Board Statement
Informed Consent Statement
Data Availability Statement
Acknowledgments
Conflicts of Interest
References
- Chang, S.; Timilsina, G.R.; Zhang, X.L.; Zhao, L. Development of Biofuels in China: Technologies, Economics and Policies. World Bank Policy Research Working Paper. 2012. Available online: https://openknowledge.worldbank.org/handle/10986/12076 (accessed on 5 December 2020).
- Bruun, S.; Jensen, J.W.; Magid, J.; Lindedam, J.; Engelsen, S.B. Prediction of the degradability and ash content of wheat straw from different cultivars using near infrared spectroscopy. Ind. Crop. Prod. 2010, 31, 321–326. [Google Scholar] [CrossRef]
- He, C.; Qi, B.; Song, H.; Zhang, H.; Lan, M.; Jiao, Y.; Li, Y.; Li, P.; Li, G.; Zhang, Q.; et al. Enhanced biohydrogen production from corn straw by basalt fiber addition. Bioresour. Technol. 2021, 338, 125528. [Google Scholar] [CrossRef]
- He, C.; Song, H.; Liu, L.; Li, P.P.; Awasthi, M.K.; Xu, G.Z.; Zhang, Q.G.; Jiao, Y.Z.; Chang, C.; Yang, Y.K. Enhancement of methane production by anaerobic digestion of corn straw with hydrogennanobubble water. Bioresour. Technol. 2022, 344, 126220. [Google Scholar] [CrossRef]
- Zhang, G.; Li, P.; Zhang, W.; Zhao, J. Analysis of multiple soybean phytonutrients by near-infrared reflectance spectroscopy. Anal. Bioanal. Chem. 2017, 409, 1–11. [Google Scholar] [CrossRef]
- Eastridge, M.; Starkey, R.; Gott, P.; Oelker, E.; Sewell, A.; Mathew, B.; Firkins, J. Dairy cows fed equivalent concentrations of forage neutral detergent fiber from corn silage, alfalfa hay, wheat straw, and corn stover had similar milk yield and total tract digestibility. Anim. Feed. Sci. Technol. 2017, 225, 81–86. [Google Scholar] [CrossRef]
- Diaz, J.T.; Veal, M.W.; Chinn, M.S. Development of NIRS models to predict composition of enzymatically processed sweetpotato. Ind. Crop. Prod. 2014, 59, 119–124. [Google Scholar] [CrossRef]
- Baath, G.S.; Baath, H.K.; Gowda, P.H.; Thomas, J.P.; Northup, B.K.; Rao, S.C.; Singh, H. Predicting forage quality of warm-season legumes by near infrared spectroscopy coupled with machine learning techniques. Sensors 2020, 20, 867. [Google Scholar] [CrossRef] [Green Version]
- Norris, K.H.; Barnes, R.F.; Moore, J.E.; Shenk, J.S. Predicting forage quality by infrared reflectance spectroscopy. J. Anim. Sci. 1976, 43, 889–897. [Google Scholar] [CrossRef]
- Yakubu, H.G.; Kovacs, Z.; Toth, T.; Bazar, G. The recent advances of near-infrared spectroscopy in dairy production—A review. Crit. Rev. Food Sci. Nutr. 2020, 1–22. [Google Scholar] [CrossRef] [PubMed]
- Rushing, J.B.; Saha, U.K.; Lemus, R.; Sonon, L.; Baldwin, B.S. Analysis of some important forage quality attributes of southeastern wildrye (elymus glabriflorus) using near-infrared reflectance spectroscopy. Am. J. Anal. Chem. 2016, 7, 642–662. [Google Scholar] [CrossRef] [Green Version]
- Huang, C.; Han, L.; Liu, X.; Ma, L. The rapid estimation of cellulose, hemicellulose, and lignin contents in rice straw by near infrared spectroscopy. Energy Sources Part A Recover. Util. Environ. Eff. 2010, 33, 114–120. [Google Scholar] [CrossRef]
- Nico, B.; Pacchioli, M.T.; Alessandra, I.; Fabrizio, R.; Andrea, F. The use of near-infrared reflectance spectroscopy (nirs) in the prediction of chemical composition and in vitro neutral detergent fiber (NDF) digestibility of Italian alfalfa hay. It. J. Anim. Sci. 2009, 8, 9–12. [Google Scholar]
- Mathison, G.W.; Hsu, H.; Soofi-Siawash, R.; Recinos-Diaz, G.; Okine, E.K.; Helm, J.; Juskiw, P. Prediction of composition and ruminal degradability characteristics of barley straw by near infrared reflectance spectroscopy. Can. J. Anim. Sci. 1999, 79, 519–523. [Google Scholar] [CrossRef]
- Jin, S.; Chen, H. Near-infrared analysis of the chemical composition of rice straw. Ind. Crop. Prod. 2007, 26, 207–211. [Google Scholar] [CrossRef]
- Karayilanli, E.; Cherney, J.H.; Sirois, P.; Kubinec, D.; Cherney, D.J. Botanical composition prediction of alfalfa-grass mixtures using NIRS: Developing a robust calibration. Crop. Sci. 2016, 56, 3361–3366. [Google Scholar] [CrossRef]
- Nie, Z.; Tremblay, G.F.; Belanger, G.; Berthiaume, R.; Castonguay, Y.; Bertrand, A.; Allard, G.; Han, J. Near-infrared reflectance spectroscopy prediction of neutral detergent-soluble carbohydrates in timothy and alfalfa. J. Dairy Sci. 2009, 92, 1702–1711. [Google Scholar] [CrossRef] [PubMed] [Green Version]
- Starks, P.J.; Brown, M.A. Prediction of forage quality from remotely sensed data: Comparison of cultivar-specific and cultivar-independent equations using three methods of calibration. Crop. Sci. 2010, 50, 2159–2170. [Google Scholar] [CrossRef]
- Chataigner, F.; Surault, F.; Huyghe, C.; Julier, B. Determination of Botanical Composition in Multispecies Forage Mixtures by Near Infrared Reflectance Spectroscopy; Springer: Dordrecht, The Netherlands, 2010; pp. 199–203. [Google Scholar]
- Association of Official Analytical Chemists (AOAC). Official Methods of Analysis, 16th ed.; AOAC International: Washington, DC, USA, 1997. [Google Scholar]
- ANKOM Technology. Method for Determining acid Detergent Lignin in Beakers, Method 08/05. 2017. Available online: http://www.ssco.com.tw/Ankom/PDF_file/ADL%20in%20Daisy%20Incubator.pdf (accessed on 5 January 2021).
- Brereton, R.G. Chemometrics: Applications of Mathematics and Chemometrics, Illustrated by Case Studies; Elsevier: Amsterdam, The Netherlands, 1992. [Google Scholar]
- Olga, E.; Ana, S.R.; Inmaculada, G.M.; Shantal, R.M.; Carmen, S.M. Potential of near infrared spectroscopy for predicting the physicochemical properties on potato flesh. Microchem. J. 2018, 141, 451–457. [Google Scholar]
- Saha, U.; Vann, R.A.; Chris Reberg-Horton, S.; Castillo, M.S.; Mirsky, S.B.; Mcgee, R.J.; Sonon, L. Near infrared spectroscopic models for analysis of winter pea (pisum sativum l.) quality constituents. J. Sci. Food Agric. 2018, 98, 4253–4267. [Google Scholar] [CrossRef]
- Malley, D.F.; McClure, C.; Martin, P.D.; Buckley, K.; McCaughey, W.P. Compositional analysis of cattle manure during composting using a field-portable near-infrared spectrometer. Commun. Soil Sci. Plant. Anal. 2005, 36, 455–475. [Google Scholar] [CrossRef]
- Pittman, J.J.; Arnall, D.B.; Interrante, S.M.; Wang, N.; Raun, W.; Butler, T. Bermudagrass, wheat, and tall fescue crude protein forage estimation using mobile-platform, active-spectral and canopy-height data. Crop. Sci. 2016, 56, 870–881. [Google Scholar] [CrossRef] [Green Version]
- Williams, P.C. Application of chemometrics to prediction of some wheat quality factors by near-infrared spectroscopy. Cereal Chem. J. 2020, 97, 27. [Google Scholar] [CrossRef]
- Kong, X.L.; Xie, J.K.; Wu, X.L.; Huang, Y.J.; Bao, J.S. Rapid prediction of acid detergent fiber, neutral detergent fiber, and acid detergent lignin of rice materials by near-infrared spectroscopy. J. Agric. Food Chem. 2005, 53, 2843–2848. [Google Scholar] [CrossRef]
- Berauer, B.J.; Wilfahrt, P.A.; Reu, B.; Schuchardt, M.A.; Garcia-Franco, N.; Zistl-Schlingmann, M.; Dannenmann, M.; Kiese, R.; Kühnel, A.; Jentsch, A. Predicting forage quality of species-rich pasture grasslands using vis-NIRS to reveal effects of management intensity and climate change. Agric. Ecosyst. Environ. 2020, 296, 106929. [Google Scholar] [CrossRef]
- Cozzolino, D.; Fassio, A.; Gimenez, A. The use of near-infrared reflectance spectroscopy (NIRS) to predict the composition of whole maize plants. J. Sci. Food Agric. 2001, 81, 142–146. [Google Scholar] [CrossRef]
- Wittkop, B.; Snowdon, R.J.; Friedt, W. New NIRS calibrations for fiber fractions reveal broad genetic variation in brassica napus seed quality. J. Agric. Food Chem. 2012, 60, 2248–2256. [Google Scholar] [CrossRef] [PubMed]
- Chen, J.; Zhu, R.; Xu, R.; Zhang, W.; Shen, Y.; Zhang, Y. Evaluation of leymus chinensis quality using near-infrared reflectance spectroscopy with three different statistical analyses. PeerJ 2015, 3, 15. [Google Scholar] [CrossRef] [PubMed] [Green Version]
- Hsu, H.; Mcneil, A.; Okine, E.; Mathison, G.; Soofi-Siawash, R. Near infrared spectroscopy for measuring in situ degrada-bility in barley forages. J. Near Infrared. Spectrosc. 1998, 6, 129–143. [Google Scholar] [CrossRef]
- Lavin, S.R.; Sullivan, K.E.; Wooley, S.C.; Stone, K.; Russell, S.; Valdes, E.V. Near infrared reflectance spectroscopy (NIRS) analyses of nutrient composition and condensed tannin concentrations in carolina willow (Salix caroliniana). Zoo Biol. 2015, 34, 576–582. [Google Scholar] [CrossRef]
- Fahey, G.C.; Jung, H.G. Lignin as a marker in digestion studies: A review. J. Anim. Sci. 1983, 57, 220–225. [Google Scholar] [CrossRef]
- Hatfield, R.; Fukushima, R.S. Can lignin be accurately measured. Crop Sci. 2005, 45, 832–839. [Google Scholar] [CrossRef] [Green Version]
- Dunn, B.W.; Batten, G.D.; Beecher, H.G.; Ciavarella, S. the potential of near-infrared reflectance spectroscopy for soil analysis—a case study from the riverine plain of south-eastern Australia. Aust. J. Exp. Agric. 2002, 42, 607–614. [Google Scholar] [CrossRef]
- Cozzolino, D.; Morón, A. Potential of near-infrared reflectance spectroscopy and chemometrics to predict soil organic carbon fractions. Soil Till. Res. 2006, 85, 78–85. [Google Scholar] [CrossRef]
- Manley, M. Near-infrared spectroscopy and hyperspectral imaging: Non-destructive analysis of biological materials. Chem. Soc. Rev. 2014, 43, 8200–8214. [Google Scholar] [CrossRef] [PubMed] [Green Version]
- Shi, H.T.; Lei, Y.G.; Prates, L.L.; Yu, P.Q. Evaluation of near-infrared (NIR) and fourier transform mid-infrared (ATR-FT/MIR) spectroscopy techniques combined with chemometrics for the determination of crude protein and intestinal protein digestibility of wheat. Food Chem. 2019, 272, 507–513. [Google Scholar] [CrossRef] [PubMed]
- Berzaghi, P.; Serva, L.; Piombino, M.; Mirisola, M.; Benozzo, F. Prediction performances of portable near infrared instruments for at farm forage analysis. Ital. J. Anim. Sci. 2005, 4, 145–147. [Google Scholar] [CrossRef]


| Provinces/Autonomous Region | Geographic Information |
|---|---|
| Gansu | 32°31′ to 42°57′ N and 92°13′ to 108°46′ E |
| Henan | 31°23′ to 36°22′ N and 110°21′ to 116°39′ E |
| Ningxia | 35°14′ to 39°23′ N and 104°17′ to 107°39′ E |
| Shanxi | 33°42′ to 34°45′ N and 107°40′ to 109°49′ E |
| Xinjiang | 34°25′ to 48°10′ N and 73°40′ to 96°18′ E |
| Items | Species | Calibration Set | Validation Set | ||||||||||
|---|---|---|---|---|---|---|---|---|---|---|---|---|---|
| n | Min (%) | Max (%) | Mean (%) | SD | CV (%) | n | Min (%) | Max (%) | Mean (%) | SD | CV (%) | ||
| Moisture | Corn stover | 121 | 3.01 | 7.41 | 5.35 | 1.14 | 21.31 | 31 | 3.12 | 7.31 | 5.36 | 1.15 | 21.43 |
| Wheat straw | 105 | 2.68 | 7.05 | 4.62 | 1.10 | 23.79 | 23 | 2.75 | 6.94 | 4.52 | 1.14 | 25.19 | |
| CP | Corn stover | 123 | 2.15 | 10.15 | 5.18 | 1.34 | 25.88 | 28 | 2.63 | 7.19 | 4.91 | 1.16 | 23.52 |
| Wheat straw | 105 | 1.52 | 6.75 | 3.36 | 0.94 | 28.14 | 26 | 1.62 | 5.11 | 3.27 | 0.87 | 26.72 | |
| NDF | Corn stover | 122 | 43.73 | 80.71 | 63.97 | 6.21 | 9.70 | 25 | 48.93 | 70.36 | 62.29 | 5.51 | 8.84 |
| Wheat straw | 105 | 64.64 | 87.81 | 77.27 | 5.94 | 7.69 | 21 | 67.86 | 86.83 | 78.52 | 5.02 | 6.40 | |
| ADF | Corn stover | 122 | 23.36 | 66.57 | 36.28 | 4.71 | 12.99 | 29 | 26.69 | 42.54 | 35.54 | 3.71 | 10.45 |
| Wheat straw | 105 | 35.73 | 58.72 | 46.79 | 4.98 | 10.64 | 20 | 39.49 | 56.78 | 48.22 | 4.61 | 9.56 | |
| ADL | Corn stover | 121 | 1.17 | 10.70 | 3.26 | 1.61 | 49.46 | 29 | 1.35 | 5.79 | 2.94 | 1.12 | 38.12 |
| Wheat straw | 105 | 4.34 | 9.93 | 6.92 | 1.55 | 22.34 | 26 | 4.40 | 9.59 | 6.93 | 1.56 | 22.47 | |
| Hemicellulose | Corn stover | 122 | 13.53 | 37.47 | 27.78 | 3.58 | 12.90 | 26 | 16.26 | 30.55 | 27.29 | 2.87 | 10.51 |
| Wheat straw | 105 | 23.34 | 44.91 | 30.58 | 3.67 | 12.00 | 24 | 25.81 | 36.26 | 30.28 | 2.94 | 9.70 | |
| Items | Species | n | Mathematical Treatment | Spectrum Treatment | RSQC | SEC | SECV | 1-VR |
|---|---|---|---|---|---|---|---|---|
| Moisture | Corn stover | 117 | 2, 4, 4, 1 | none | 0.8671 | 0.4131 | 0.5019 | 0.8020 |
| Wheat straw | 98 | 1, 4, 4, 1 | Detrend only | 0.8569 | 0.4075 | 0.4575 | 0.8177 | |
| CP | Corn stover | 117 | 1, 4, 4, 1 | SNV only | 0.9572 | 0.2543 | 0.3162 | 0.9332 |
| Wheat straw | 100 | 1, 4, 4, 1 | SNV only | 0.9368 | 0.2368 | 0.3151 | 0.8870 | |
| NDF | Corn stover | 114 | 1, 4, 4, 1 | Weighted MSC | 0.7861 | 2.7075 | 2.8284 | 0.7645 |
| Wheat straw | 104 | 1, 4, 4, 1 | Scale and liner | 0.4422 | 4.6916 | 4.6249 | 0.3753 | |
| ADF | Corn stover | 118 | 1, 4, 4, 1 | Detrend only | 0.8701 | 1.3924 | 1.6805 | 0.8092 |
| Wheat straw | 103 | 2, 4, 4, 1 | Standard MSC | 0.4266 | 3.7226 | 3.8597 | 0.3776 | |
| ADL | Corn stover | 118 | 2, 4, 4, 1 | Scale and liner | 0.7301 | 0.6784 | 1.0306 | 0.3717 |
| Wheat straw | 102 | 2, 4, 4, 1 | none | 0.4829 | 1.0754 | 1.1456 | 0.4074 | |
| Hemicellulose | Corn stover | 110 | 0, 0, 1, 1 | Scale and Quadratic | 0.5735 | 1.6110 | 1.6434 | 0.5521 |
| Wheat straw | 101 | 1, 4, 4, 1 | Scale and Quadratic | 0.1387 | 2.7950 | 2.9161 | 0.0531 |
| Constituent | Species | n | Bias | SEP | SEPC | Slope | RSQV | RPD |
|---|---|---|---|---|---|---|---|---|
| Moisture | Corn stover | 31 | −0.048 | 0.435 | 0.439 | 0.984 | 0.854 | 2.644 |
| Wheat straw | 23 | 0.028 | 0.377 | 0.385 | 0.903 | 0.896 | 3.024 | |
| CP | Corn stover | 28 | −0.102 | 0.342 | 0.333 | 1.037 | 0.918 | 3.392 |
| Wheat straw | 26 | −0.034 | 0.235 | 0.237 | 1.018 | 0.927 | 3.702 | |
| NDF | Corn stover | 25 | −0.426 | 2.103 | 2.102 | 0.925 | 0.860 | 2.620 |
| Wheat straw | 21 | 1.275 | 2.423 | 2.112 | 0.931 | 0.828 | 2.072 | |
| ADF | Corn stover | 29 | −0.213 | 1.739 | 1.756 | 0.944 | 0.779 | 2.133 |
| Wheat straw | 20 | 0.781 | 2.772 | 2.729 | 1.252 | 0.677 | 1.663 | |
| ADL | Corn stover | 29 | −0.566 | 1.254 | 1.139 | 0.471 | 0.125 | 0.893 |
| Wheat straw | 26 | 0.392 | 1.299 | 1.263 | 0.841 | 0.355 | 1.201 | |
| Hemicellulose | Corn stover | 26 | −0.519 | 1.643 | 1.590 | 1.073 | 0.696 | 1.747 |
| Wheat straw | 24 | 0.364 | 2.550 | 2.578 | 1.134 | 0.232 | 1.153 |
| Items | Calibration Set | Validation Set | ||||||||||
|---|---|---|---|---|---|---|---|---|---|---|---|---|
| n | Min (%) | Max (%) | Mean (%) | SD | CV (%) | n | Min (%) | Max (%) | Mean (%) | SD | CV (%) | |
| Moisture | 225 | 2.68 | 7.41 | 5.00 | 1.18 | 23.60 | 56 | 2.75 | 7.31 | 4.98 | 1.16 | 23.69 |
| CP | 225 | 1.52 | 10.15 | 4.30 | 1.47 | 34.19 | 55 | 1.62 | 7.19 | 4.16 | 1.34 | 35.34 |
| NDF | 223 | 43.73 | 87.81 | 70.20 | 8.99 | 12.81 | 56 | 48.93 | 86.47 | 70.01 | 9.07 | 12.84 |
| ADF | 224 | 23.36 | 66.57 | 41.10 | 7.18 | 17.47 | 55 | 26.69 | 56.85 | 40.86 | 7.05 | 17.57 |
| ADL | 227 | 1.17 | 10.70 | 4.93 | 2.42 | 49.09 | 58 | 1.35 | 9.59 | 4.92 | 2.41 | 49.19 |
| Hemicellulose | 226 | 13.53 | 44.91 | 29.07 | 3.87 | 13.31 | 52 | 21.93 | 36.28 | 28.59 | 2.84 | 13.54 |
| Items | Sample Number | Mathematical Treatment | Spectrum Treatment | RSQC | SEC | SECV | 1-VR |
|---|---|---|---|---|---|---|---|
| Moisture | 219 | 1, 4, 4, 1 | Detrend only | 0.8342 | 0.4759 | 0.5421 | 0.7839 |
| CP | 210 | 1, 4, 4, 1 | Weighted MSC | 0.9625 | 0.2708 | 0.3022 | 0.9530 |
| NDF | 215 | 1, 4, 4, 1 | none | 0.8349 | 3.6973 | 4.1753 | 0.7884 |
| ADF | 216 | 2, 4, 4, 1 | Scale and Quadratic | 0.8745 | 2.4250 | 2.9351 | 0.8154 |
| ADL | 215 | 0, 0, 1, 1 | Scale and Linear | 0.7939 | 1.0788 | 1.1377 | 0.7697 |
| Hemicellulose | 206 | 0, 0, 1, 1 | Standard MSC | 0.4388 | 2.2946 | 2.3247 | 0.4212 |
| Constituent | n | Bias | SEP | SEPC | Slope | RSQV | RPD |
|---|---|---|---|---|---|---|---|
| Moisture | 56 | −0.035 | 0.621 | 0.626 | 0.769 | 0.780 | 1.868 |
| CP | 55 | −0.004 | 0.195 | 0.197 | 1.017 | 0.979 | 6.872 |
| NDF | 56 | 0.464 | 4.104 | 4.114 | 0.977 | 0.795 | 2.210 |
| ADF | 55 | −0.042 | 2.563 | 2.586 | 1.092 | 0.871 | 2.751 |
| ADL | 58 | 0.079 | 1.067 | 1.074 | 1.018 | 0.801 | 2.259 |
| Hemicellulose | 52 | −0.484 | 2.618 | 2.598 | 0.634 | 0.242 | 1.085 |
Publisher’s Note: MDPI stays neutral with regard to jurisdictional claims in published maps and institutional affiliations. |
© 2021 by the authors. Licensee MDPI, Basel, Switzerland. This article is an open access article distributed under the terms and conditions of the Creative Commons Attribution (CC BY) license (https://creativecommons.org/licenses/by/4.0/).
Share and Cite
Guo, T.; Dai, L.; Yan, B.; Lan, G.; Li, F.; Li, F.; Pan, F.; Wang, F. Measurements of Chemical Compositions in Corn Stover and Wheat Straw by Near-Infrared Reflectance Spectroscopy. Animals 2021, 11, 3328. https://doi.org/10.3390/ani11113328
Guo T, Dai L, Yan B, Lan G, Li F, Li F, Pan F, Wang F. Measurements of Chemical Compositions in Corn Stover and Wheat Straw by Near-Infrared Reflectance Spectroscopy. Animals. 2021; 11(11):3328. https://doi.org/10.3390/ani11113328
Chicago/Turabian StyleGuo, Tao, Luming Dai, Baipeng Yan, Guisheng Lan, Fadi Li, Fei Li, Faming Pan, and Fangbin Wang. 2021. "Measurements of Chemical Compositions in Corn Stover and Wheat Straw by Near-Infrared Reflectance Spectroscopy" Animals 11, no. 11: 3328. https://doi.org/10.3390/ani11113328
APA StyleGuo, T., Dai, L., Yan, B., Lan, G., Li, F., Li, F., Pan, F., & Wang, F. (2021). Measurements of Chemical Compositions in Corn Stover and Wheat Straw by Near-Infrared Reflectance Spectroscopy. Animals, 11(11), 3328. https://doi.org/10.3390/ani11113328