Analysis of Hindgut Microbiome of Sheep and Effect of Different Husbandry Conditions

 ,
,  , , , ,
  , , ,
, , ,
Abstract
Simple Summary
Abstract
1. Introduction
2. Materials and Methods
2.1. Animals and Housing
2.2. Experimental Plan
2.3. Hair Collection
2.4. Cortisol Measurement
2.5. Sampling of the Hindgut Microbiome
2.6. 16 S rRNA-Gene Sequencing
2.7. Bioinformatics Processing
2.8. Alpha and Beta Diversity Indices
2.9. Statistical Analysis
3. Results
3.1. Hair Cortisol Concentration
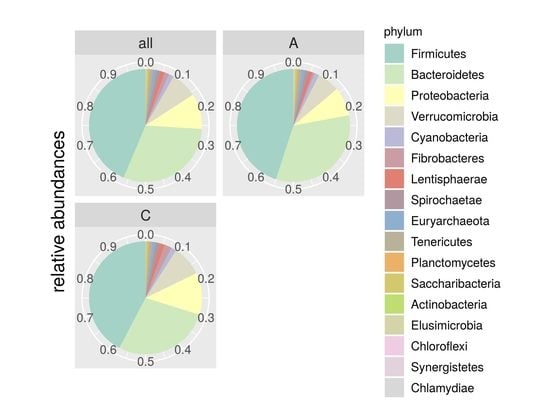
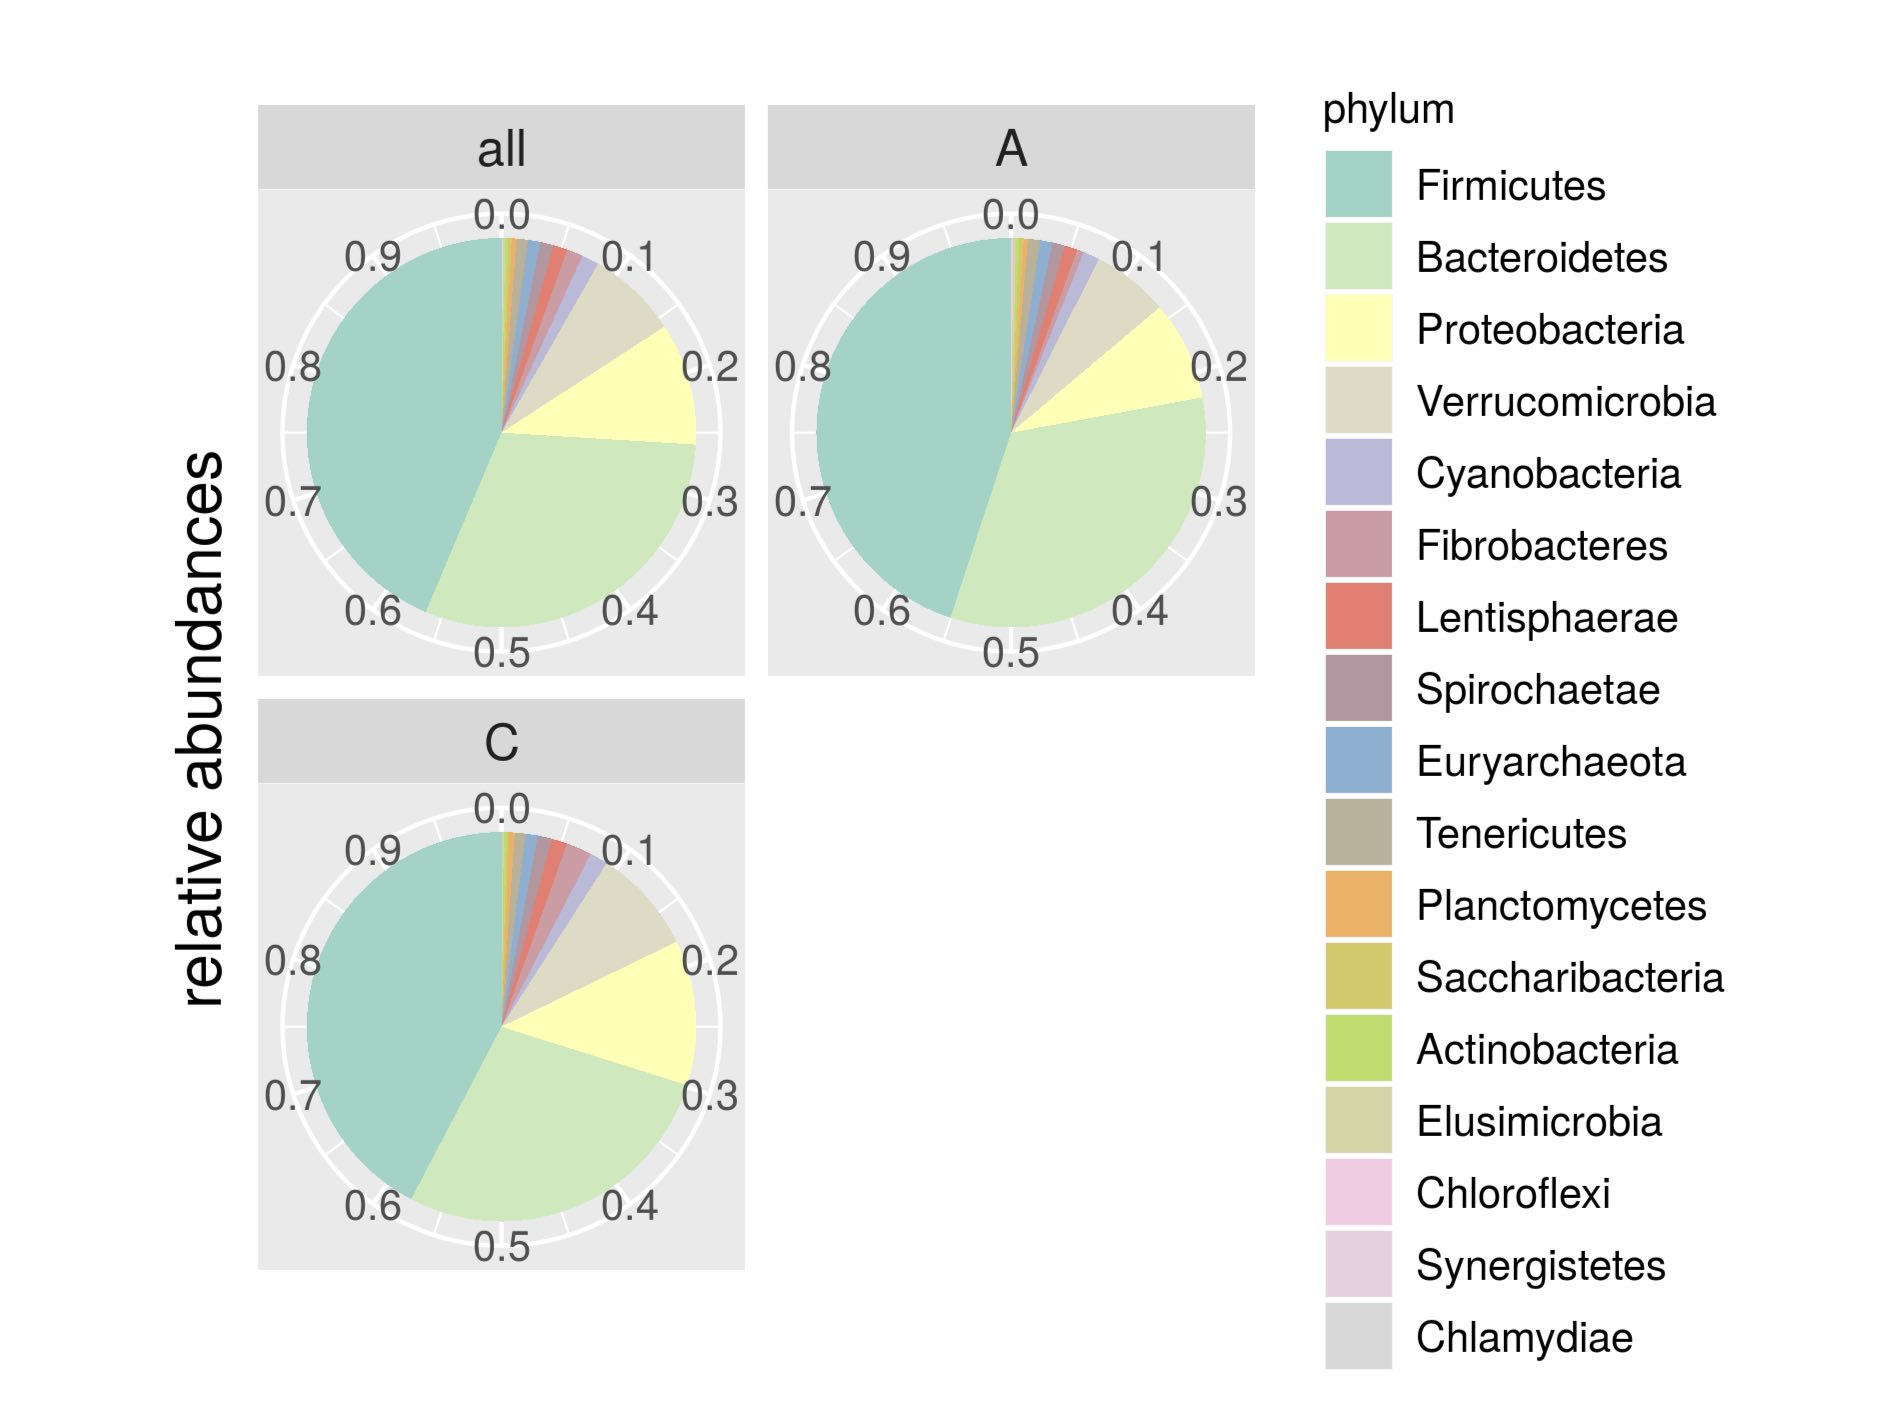
3.2. Sequencing Results and Taxonomy Description
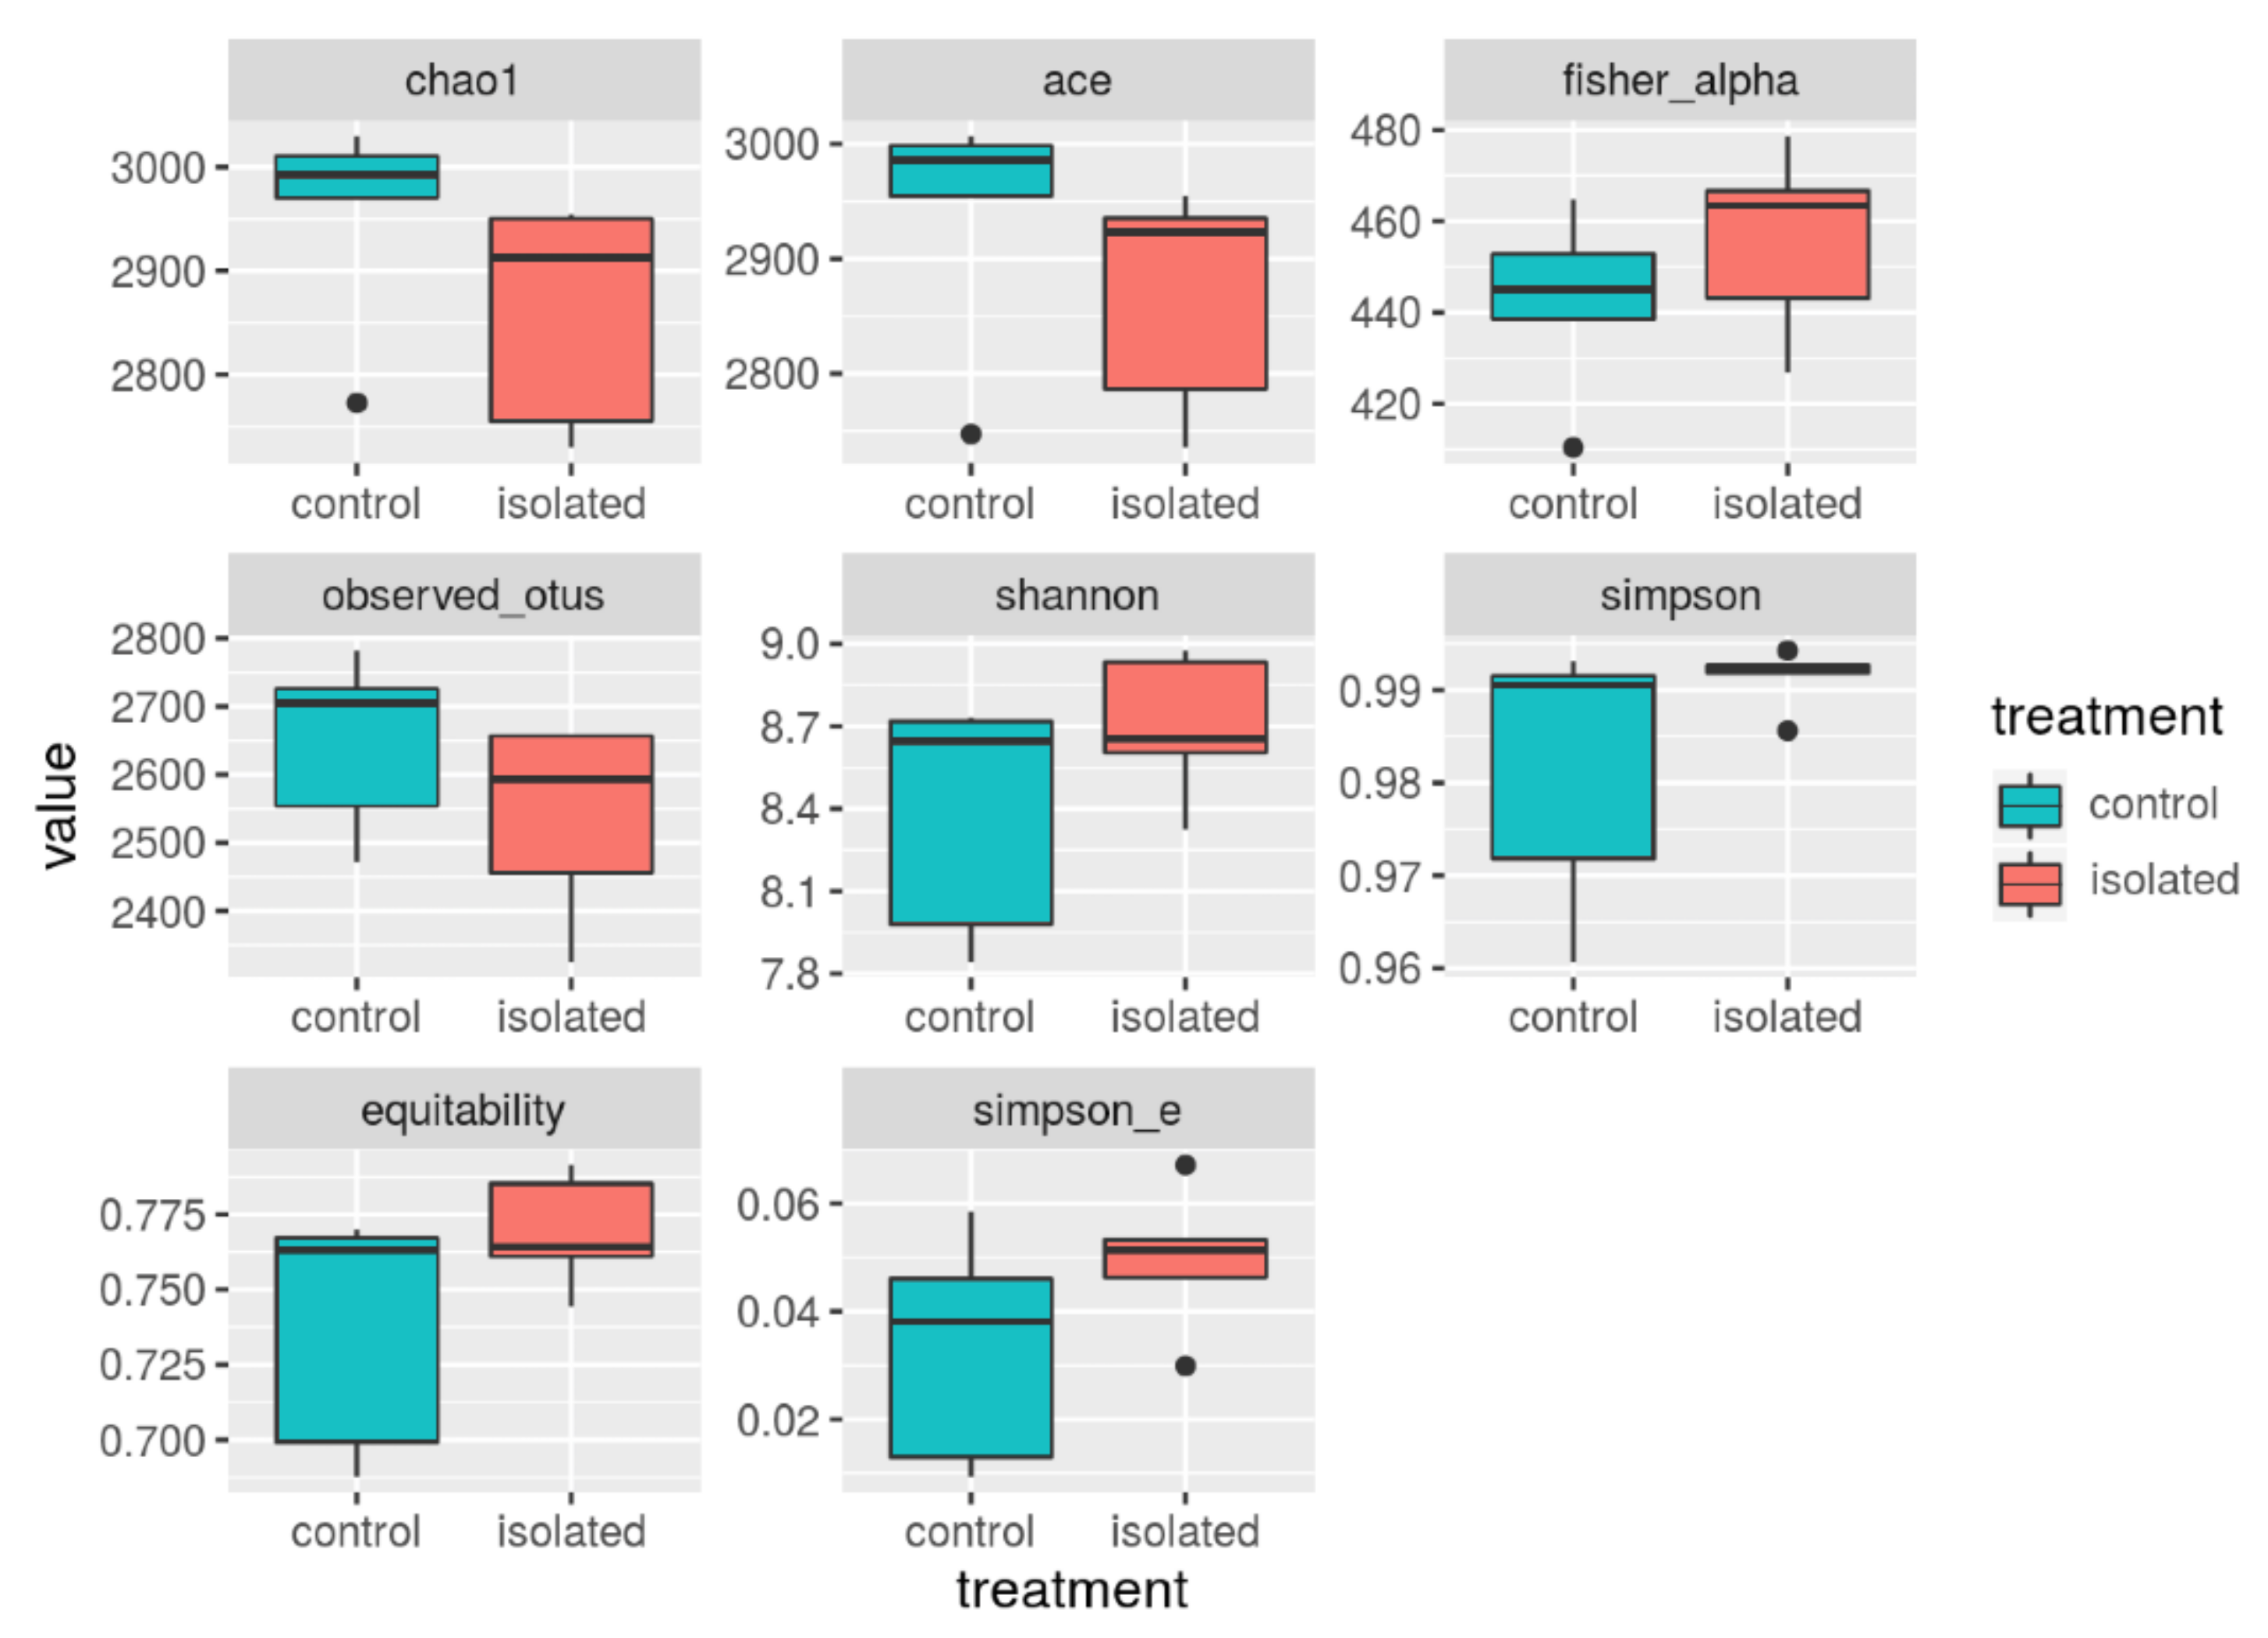
3.3. Diversity Indices
4. Discussion
5. Conclusions
Author Contributions
Funding
Acknowledgments
Conflicts of Interest
References
- Cussotto, S.; Sandhu, K.V.; Dinan, T.G.; Cryan, J.F. The Neuroendocrinology of the Microbiota-Gut-Brain Axis: A Behavioural Perspective. Front. Neuroendocrinol. 2018, 51, 80–101. [Google Scholar] [CrossRef]
- Dinan, T.G.; Cryan, J.F. Melancholic microbes: A link between gut microbiota and depression? Neurogastroenterol. Motil. 2013, 25, 713–719. [Google Scholar] [CrossRef]
- Dinan, T.G.; Cryan, J.F. Gut instincts: Microbiota as a key regulator of brain development, ageing and neurodegeneration. J. Physiol. 2017, 595, 489–503. [Google Scholar] [CrossRef] [PubMed]
- Biscarini, F.; Palazzo, F.; Castellani, F.; Masetti, G.; Grotta, L.; Cichelli, A.; Martino, G. Rumen microbiome in dairy calves fed copper and grape-pomace dietary supplementations: Composition and predicted functional profile. PLoS ONE 2018, 13, e0205670. [Google Scholar] [CrossRef] [PubMed]
- Pinto, A.C.J.; Bertoldi, G.P.; Felizari, L.D.; Dias, E.F.F.; Demartini, B.L.; Nunes, A.B.C.P.; Squizatti, M.M.; Silvestre, A.M.; Oliveira, L.F.R.; Skarlupka, J.H.; et al. Ruminal Fermentation Pattern, Bacterial Community Composition, and Nutrient Digestibility of Nellore Cattle Submitted to Either Nutritional Restriction or Intake of Concentrate Feedstuffs Prior to Adaptation Period. Front. Microbiol. 2020, 11, 1865. [Google Scholar] [CrossRef]
- Bergamaschi, M.; Tiezzi, F.; Howard, J.; Huang, Y.J.; Gray, K.A.; Schillebeeckx, C.; McNulty, N.P.; Maltecca, C. Gut microbiome composition differences among breeds impact feed efficiency in swine. Microbiome 2020, 8, 110. [Google Scholar] [CrossRef]
- O’Donnell, M.M.; Harris, H.M.; Ross, R.P.; O’Toole, P.W. Core fecal microbiota of domesticated herbivorous ruminant, hindgut fermenters, and monogastric animals. Microbiologyopen 2017, 6, e00509. [Google Scholar]
- Tanca, A.; Fraumene, C.; Manghina, V.; Palomba, A.; Abbondio, M.; Deligios, M.; Pagnozzi, D.; Addis, M.F.; Uzzau, S. Diversity and functions of the sheep faecal microbiota: A multi-omic characterization. Microb. Biotechnol. 2017, 10, 541–554. [Google Scholar] [CrossRef] [PubMed]
- Palomba, A.; Tanca, A.; Addis, M.F.; Pagnozzi, D.; Uzzau, S. The Sarda Sheep Host Fecal Proteome. Proteomics 2018, 18, 1–5. [Google Scholar] [CrossRef]
- Mamun, M.A.A.; Sandeman, M.; Rayment, P.; Brook-Carter, P.; Scholes, E.; Kasinadhuni, N.; Piedrafita, D.; Greenhill, A.R. The composition and stability of the faecal microbiota of Merino sheep. J. Appl. Microbiol. 2020, 128, 280–291. [Google Scholar] [CrossRef]
- Chang, J.; Yao, X.; Zuo, C.; Qi, Y.; Chen, D.; Ma, W. The gut bacterial diversity of sheep associated with different breeds in Qinghai province. BMC Vet. Res. 2020, 16, 254. [Google Scholar] [CrossRef]
- Wang, C.; Li, Y.; MaiTiSaiYiDi, T.; Yang, H.; Yang, K. Effect of dietary gossypol supplement on fermentation characteristics and bacterial diversity in the rumen of sheep. PLoS ONE 2020, 15, e0234378. [Google Scholar] [CrossRef] [PubMed]
- De Palma, G.; Blennerhassett, P.; Lu, J.; Deng, Y.; Park, A.J.; Green, W.; Denou, E.; Silva, M.A.; Santacruz, A.; Sanz, Y.; et al. Microbiota and host determinants of behavioural phenotype in maternally separated mice. Nat. Commun. 2015, 6. [Google Scholar] [CrossRef] [PubMed]
- Moloney, R.D.; Desbonnet, L.; Clarke, G.; Dinan, T.G.; Cryan, J.F. The microbiome: Stress, health and disease. Mamm. Genome 2014, 25, 49–74. [Google Scholar] [CrossRef] [PubMed]
- Bharwani, A.; Mian, M.F.; Foster, J.A.; Surette, M.G.; Bienenstock, J.; Forsythe, P. Structural and functional consequences of chronic psychosocial stress on the microbiome and host. Psychoneuroendocrinology 2016, 63. [Google Scholar] [CrossRef] [PubMed]
- Bailey, M.T.; Dowd, S.E.; Galley, J.D.; Hufnagle, A.R.; Allen, R.G.; Lyte, M. Exposure to a social stressor alters the structure of the intestinal microbiota: Implications for stressor-induced immunomodulation. Brain. Behav. Immun. 2011, 25, 397–407. [Google Scholar] [CrossRef]
- Foster, J.A.; Rinaman, L.; Cryan, J.F. Stress & the gut-brain axis: Regulation by the microbiome. Neurobiol. Stress 2017, 7, 124–136. [Google Scholar] [CrossRef]
- Aguayo-Ulloa, L.A.; Villarroel, M.; Pascual-Alonso, M.; Miranda-de la Lama, G.C.; María, G.A. Finishing feedlot lambs in enriched pens using feeder ramps and straw and its influence on behavior and physiological welfare indicators. J. Vet. Behav. 2014, 9, 347–356. [Google Scholar] [CrossRef]
- Mkwanazi, M.V.; Ncobela, C.N.; Kanengoni, A.T.; Chimonyo, M. Effects of environmental enrichment on behaviour, physiology and performance of pigs—A review. Asian-Australas. J. Anim. Sci. 2019, 32, 1–13. [Google Scholar] [CrossRef]
- Oesterwind, S.; Nürnberg, G.; Puppe, B.; Langbein, J. Impact of structural and cognitive enrichment on the learning performance, behavior and physiology of dwarf goats (Capra aegagrus hircus). Appl. Anim. Behav. Sci. 2016, 177, 34–41. [Google Scholar] [CrossRef]
- Nordquist, R.E.; van der Staay, F.J.; van Eerdenburg, F.J.C.M.; Velkers, F.C.; Fijn, L.; Arndt, S.S. Mutilating procedures, management practices, and housing conditions that may affect the welfare of farm animals: Implications for welfare research. Animals 2017, 7, 12. [Google Scholar] [CrossRef]
- Harding, E.J.; Paul, E.S.; Mendl, M. Animal behaviour: Cognitive bias and affective state. Nature 2004, 427, 312. [Google Scholar] [CrossRef] [PubMed]
- Destrez, A.; Deiss, V.; Lévy, F.; Calandreau, L.; Lee, C.; Chaillou-Sagon, E.; Boissy, A. Chronic stress induces pessimistic-like judgment and learning deficits in sheep. Appl. Anim. Behav. Sci. 2013, 148, 28–36. [Google Scholar] [CrossRef]
- Apple, J.K.; Minton, J.E.; Parsons, K.M.; Unruh, J.A. Influence of repeated restraint and isolation stress and electrolyte administration on pituitary-adrenal secretions, electrolytes, and other blood constituents of sheep. J. Anim. Sci. 1993, 71, 71–77. [Google Scholar] [CrossRef] [PubMed]
- Dwyer, C.M.; Bornett, H.L.I. Chronic stress in Sheep: Assessment tools and their use in different management conditions. Anim. Welf. 2004, 13, 293–304. [Google Scholar]
- Hernandez, C.E.; Matthews, L.R.; Oliver, M.H.; Bloomfield, F.H.; Harding, J.E. Effects of sex, litter size and periconceptional ewe nutrition on offspring behavioural and physiological response to isolation. Physiol. Behav. 2010, 101, 588–594. [Google Scholar] [CrossRef] [PubMed]
- Nowak, R.; Porter, R.; Blache, D.; Dwyer, C.M. Behaviour and the welfare of the sheep. In The Welfare of Sheep; Springer: Dordrecht, The Netherlands, 2008; pp. 81–134. [Google Scholar]
- Oliver, M.; Rossenrode, S. Optimised welfare for sheep in research and teaching. In Advances in Sheep Welfare; Woodhead Publishing: Cambridge, UK, 2017; pp. 263–281. [Google Scholar]
- Ortega, M.; Huerta, M.; Vera, I.; Herrera, J. The welfare of sheep and its assessment Bienestar en ovinos y su evaluación. Agroproductividad 2019, 12, 67–72. [Google Scholar] [CrossRef]
- Cockram, M.S.; Ranson, M.; Imlah, P.; Goddard, P.J.; Burrells, C.; Harkiss, G.D. The behavioural, endocrine and immune responses of sheep to isolation. Anim. Sci. 1994, 58, 389–399. [Google Scholar] [CrossRef]
- Stubsjøen, S.M.; Bohlin, J.; Dahl, E.; Knappe-Poindecker, M.; Fjeldaas, T.; Lepschy, M.; Palme, R.; Langbein, J.; Ropstad, E. Assessment of chronic stress in sheep (part I): The use of cortisol and cortisone in hair as non-invasive biological markers. Small Rumin. Res. 2015, 132, 25–31. [Google Scholar] [CrossRef]
- Doyle, R.; Fisher, A.; Hinch, G.; Boissy, A.; Lee, C. Release from restraint generates a positive judgement bias in sheep. Appl. Anim. Behav. Sci. 2010, 122, 28–34. [Google Scholar] [CrossRef]
- Verbeek, E.; Colditz, I.; Blache, D.; Lee, C. Chronic stress influences attentional and judgement bias and the activity of the HPA axis in sheep. PLoS ONE 2019, 14, e0211363. [Google Scholar] [CrossRef] [PubMed]
- Dreiling, M.; Schiffner, R.; Bischoff, S.; Rupprecht, S.; Kroegel, N.; Schubert, H.; Witte, O.W.; Schwab, M.; Rakers, F. Impact of chronic maternal stress during early gestation on maternal–fetal stress transfer and fetal stress sensitivity in sheep. Stress 2018, 21, 1–10. [Google Scholar] [CrossRef] [PubMed]
- Rakers, F.; Frauendorf, V.; Rupprecht, S.; Schiffner, R.; Bischoff, S.J.; Kiehntopf, M.; Reinhold, P.; Witte, O.W.; Schubert, H.; Schwab, M. Effects of early- and late-gestational maternal stress and synthetic glucocorticoid on development of the fetal hypothalamus–pituitary–adrenal axis in sheep. Stress 2013, 16, 122–129. [Google Scholar] [CrossRef] [PubMed]
- Heimbürge, S.; Kanitz, E.; Otten, W. The use of hair cortisol for the assessment of stress in animals. Gen. Comp. Endocrinol. 2019, 270, 10–17. [Google Scholar] [CrossRef] [PubMed]
- Burnett, T.A.; Madureira, A.M.L.; Silper, B.F.; Nadalin, A.; Tahmasbi, A.; Veira, D.M.; Cerri, R.L.A. Short communication: Factors affecting hair cortisol concentrations in lactating dairy cows. J. Dairy Sci. 2014, 97, 7685–7690. [Google Scholar] [CrossRef] [PubMed]
- Caporaso, J.G.; Lauber, C.L.; Walters, W.A.; Berg-Lyons, D.; Lozupone, C.A.; Turnbaugh, P.J.; Fierer, N.; Knight, R. Global patterns of 16S rRNA diversity at a depth of millions of sequences per sample. Proc. Natl. Acad. Sci. USA 2011, 108, 4516–4522. [Google Scholar] [CrossRef]
- Andrews, S. FastQC: A Quality Control Tool for High throughput Sequence Data. 2010. Available online: http://www.bioinformatics.babraham.ac.uk/projects/fastqc/ (accessed on 8 December 2020).
- John, J. SeqPrep v1.1-Tool for Stripping Adaptors and/or Merging Paired Reads with Overlap into Single Reads. Available online: https://github.com/jstjohn/SeqPrep (accessed on 8 December 2020).
- Quast, C.; Pruesse, E.; Yilmaz, P.; Gerken, J.; Schweer, T.; Yarza, P.; Peplies, J.; Glöckner, F.O. The SILVA ribosomal RNA gene database project: Improved data processing and web-based tools. Nucleic Acids Res. 2013, 41, 590–596. [Google Scholar] [CrossRef]
- Yilmaz, P.; Parfrey, L.W.; Yarza, P.; Gerken, J.; Pruesse, E.; Quast, C.; Schweer, T.; Peplies, J.; Ludwig, W.; Glöckner, F.O. The SILVA and “all-species Living Tree Project (LTP)” taxonomic frameworks. Nucleic Acids Res. 2014, 42, 643–648. [Google Scholar] [CrossRef]
- Li, W.; Godzik, A. Cd-hit: A fast program for clustering and comparing large sets of protein or nucleotide sequences. Bioinformatics 2006, 22, 1658–1659. [Google Scholar] [CrossRef]
- Caporaso, J.G.; Fierer, N.; Peña, A.G.; Goodrich, J.K.; Gordon, J.I.; Huttley, G.A.; Kelley, S.T.; Knights, D.; Mcdonald, D.; Muegge, B.D.; et al. QIIME allows analysis of high-throughput community sequencing data. Nat. Methods 2010, 7, 335–336. [Google Scholar] [CrossRef]
- Chao, A. Board of the Foundation of the Scandinavian Journal of Statistics Nonparametric Estimation of the Number of Classes in a Population. Scand. J. Stat. 1984, 11, 265–270. [Google Scholar]
- Chao, A.; Lee, S.M. Estimating the Number of Classes via Sample Coverage. J. Am. Stat. Assoc. 1992, 87, 210–217. [Google Scholar] [CrossRef]
- Chao, A.; Yang, M.C.K. Biometrika Trust Stopping Rules and Estimation for Recapture Debugging with Unequal Failure Rates. Biometrika 1993, 80, 193–201. [Google Scholar] [CrossRef]
- Fisher, R.A.; Corbet, S.A.; Williams, C.B. The Relation Between the Number of Species and the Number of Individuals in a Random Sample of an Animal Population. J. Anim. Ecol. 1943, 12, 42–58. [Google Scholar] [CrossRef]
- Shannon, C. Mathematical Theory of Communication. Bell Syst. Tech. J. 1948, 27, 379–427. [Google Scholar] [CrossRef]
- Simpson, E.H. Measurement of diversity. Nature 1949, 163, 688. [Google Scholar] [CrossRef]
- Bray, R.; Curtis, J. An ordination of the upland forestcommunities of southern Wisconsin. Ecol. Monogr. 1957, 27, 325–349. [Google Scholar] [CrossRef]
- Kruschke, J.K. Bayesian estimation supersedes the t test. J. Exp. Psychol. Gen. 2013, 142, 573–603. [Google Scholar] [CrossRef]
- Kruschke, J.; Meredith, M. BEST: Bayesian Estimation Supersedes the t-Test. R Package Version 0.5.2. Available online: https://cran.r-project.org/package=BEST (accessed on 8 December 2020).
- Cryan, J.F.; Dinan, T.G. Mind-altering microorganisms: The impact of the gut microbiota on brain and behaviour. Nat. Rev. Neurosci. 2012, 13, 701–712. [Google Scholar] [CrossRef]
- Mir, R.A.; Allen, H.K.; Coetzee, J.F.; Kleinhenz, M.D.; Kudva, I.T. Fecal microbiota changes associated with dehorning and castration stress primarily affects light-weight dairy calves. PLoS ONE 2019, 14, e0210203. [Google Scholar] [CrossRef]
- Aurich, J.; Wulf, M.; Ille, N.; Erber, R.; von Lewinski, M.; Palme, R.; Aurich, C. Effects of season, age, sex, and housing on salivary cortisol concentrations in horses. Domest. Anim. Endocrinol. 2015, 52, 11–16. [Google Scholar] [CrossRef] [PubMed]
- Möstl, E.; Palme, R. Hormones as indicators of stress. Domest. Anim. Endocrinol. 2002, 23, 67–74. [Google Scholar] [CrossRef]
- Meyer, J.S.; Novak, M.A. Minireview: Hair Cortisol: A Novel Biomarker of Hypothalamic-Pituitary-Adrenocortical Activity. Endocrinology 2012, 153, 4120–4127. [Google Scholar] [CrossRef]
- Keckeis, K.; Lepschy, M.; Schöpper, H.; Moser, L.; Troxler, J.; Palme, R. Hair cortisol: A parameter of chronic stress? Insights from a radiometabolism study in guinea pigs. J. Comp. Physiol. B 2012, 182, 985–996. [Google Scholar] [CrossRef] [PubMed]
- Comin, A.; Veronesi, M.C.; Montillo, M.; Faustini, M.; Valentini, S.; Cairoli, F.; Prandi, A. Hair cortisol level as a retrospective marker of hypothalamic–pituitary–adrenal axis activity in horse foals. Vet. J. 2012, 194, 131–132. [Google Scholar] [CrossRef]
- Sharma, A.; Umapathy, G.; Kumar, V.; Phillips, C.J.C. Hair Cortisol in Sheltered Cows and Its Association with Other Welfare Indicators. Animals 2019, 9, 248. [Google Scholar] [CrossRef] [PubMed]
- Caroprese, M.; Albenzio, M.; Marzano, A.; Schena, L.; Annicchiarico, G.; Sevi, A. Relationship between cortisol response to stress and behavior, immune profile, and production performance of dairy ewes. J. Dairy Sci. 2010, 93, 2395–2403. [Google Scholar] [CrossRef]
- Kelly, J.R.; Borre, Y.; O’Brien, C.; Patterson, E.; El Aidy, S.; Deane, J.; Kennedy, P.J.; Beers, S.; Scott, K.; Moloney, G.; et al. Transferring the blues: Depression-associated gut microbiota induces neurobehavioural changes in the rat. J. Psychiatr. Res. 2016, 82, 109–118. [Google Scholar] [CrossRef]
- Greenhalgh, K.; Meyer, K.M.; Aagaard, K.M.; Wilmes, P. The human gut microbiome in health: Establishment and resilience of microbiota over a lifetime. Environ. Microbiol. 2016, 18, 2103–2116. [Google Scholar] [CrossRef]
- Plaizier, J.C.; Li, S.; Tun, H.M.; Khafipour, E. Nutritional Models of Experimentally-Induced Subacute Ruminal Acidosis (SARA) Differ in Their Impact on Rumen and Hindgut Bacterial Communities in Dairy Cows. Front. Microbiol. 2017, 7. [Google Scholar] [CrossRef]
- Sun, G.; Zhang, H.; Wei, Q.; Zhao, C.; Yang, X.; Wu, X.; Xia, T.; Liu, G.; Zhang, L.; Gao, Y.; et al. Comparative analyses of fecal microbiota in European mouflon (Ovis orientalis musimon) and blue sheep (Pseudois nayaur) living at low or high altitudes. Front. Microbiol. 2019, 10, 1–15. [Google Scholar] [CrossRef] [PubMed]
- Cannas, S.; Palestrini, C.; Canali, E.; Cozzi, B.; Ferri, N.; Heinzl, E.; Minero, M.; Chincarini, M.; Vignola, G.; Dalla Costa, E. Thermography as a non-invasive measure of stress and fear of humans in sheep. Animals 2018, 8, 146. [Google Scholar] [CrossRef] [PubMed]


| Phylum | Control | Isolated | p-Value |
|---|---|---|---|
| Firmicutes | 0.4232 | 0.4496 | 0.077 |
| Bacteroidetes | 0.2782 | 0.3294 | 0.246 |
| Proteobacteria | 0.1204 | 0.0824 | 0.110 |
| Verrucomicrobia | 0.0870 | 0.0639 | 0.233 |
| Cyanobacteria | 0.0151 | 0.0134 | 0.116 |
| Fibrobacteres | 0.0210 | 0.0058 | 0.029 |
| Lentisphaerae | 0.0130 | 0.0106 | 0.068 |
| Spirochaetae | 0.0118 | 0.0102 | 0.213 |
| Euryarchaeota | 0.0100 | 0.0103 | 0.137 |
| Tenericutes | 0.0090 | 0.0101 | 0.257 |
| Planctomycetes | 0.0044 | 0.0033 | 0.089 |
| Saccharibacteria | 0.0019 | 0.0036 | 0.528 |
| Actinobacteria | 0.0025 | 0.0027 | 0.167 |
| Elusimicrobia | 0.0014 | 0.0022 | 0.980 |
| Chloroflexi | 0.0003 | 0.0017 | 0.289 |
| Synergistetes | 6,57E-01 | 7,72E-01 | 0.323 |
| Chlamydiae | 3,75E-01 | 8,72E-02 | 0.012 |
| Taxa | OTU | Control | Isolated |
|---|---|---|---|
| Class | Clostridia | 0.4047 | 0.4260 |
| Class | Bacteroidia | 0.2763 | 0.3270 |
| Class | Epsilonproteobacteria | 0.1090 | 0.0709 |
| Class | Verrucomicrobiae | 0.0860 | 0.0628 |
| Order | Clostridiales | 0.4041 | 0.4254 |
| Order | Bacteroidales | 0.2763 | 0.3270 |
| Order | Campylobacterales | 0.1090 | 0.0709 |
| Order | Verrucomicrobiales | 0.0860 | 0.0628 |
| Family | Ruminococcaceae | 0.2807 | 0.2923 |
| Family | Rikenellaceae | 0.0994 | 0.1107 |
| Family | Campylobacteraceae | 0.0975 | 0.0610 |
| Family | Verrucomicrobiaceae | 0.0860 | 0.0628 |
| Family | Prevotellaceae | 0.0564 | 0.0804 |
| Family | Bacteroidaceae | 0.0516 | 0.0648 |
| Genus | Ruminococcaceae UCG-010 | 0.0970 | 0.0801 |
| Genus | Campylobacter | 0.0975 | 0.0610 |
| Genus | Akkermansia | 0.0860 | 0.0628 |
| Genus | Ruminococcaceae UCG-005 | 0.0614 | 0.0717 |
| Genus | Bacteroides | 0.0516 | 0.0648 |
| Level | Taxon | Control | Isolated | p-Value | Bayesian 10% |
|---|---|---|---|---|---|
| phylum | Fibrobacteres | 3545 | 708.2 | 0.0293 | 0.928 |
| class | Fibrobacteria | 3545 | 708.2 | 0.0293 | 0.939 |
| order | Aeromonadales | 28.6 | 6 | 0.0132 | 0.956 |
| order | Desulfovibrionales | 511.8 | 268.8 | 0.0042 | 0.967 |
| order | Fibrobacterales | 3545 | 708.2 | 0.0293 | 0.936 |
| order | Micrococcales | 167.6 | 72.6 | 0.0299 | 0.924 |
| order | Thermoanaerobacterales | 118.4 | 66.2 | 0.0138 | 0.939 |
| family | Defluviitaleaceae | 212 | 108.8 | 0.0119 | 0.945 |
| family | Dermatophilaceae | 161 | 67.4 | 0.0266 | 0.929 |
| family | Desulfovibrionaceae | 511.8 | 268.8 | 0.0042 | 0.967 |
| family | Fibrobacteraceae | 3545 | 708.2 | 0.0293 | 0.935 |
| family | Methylobacteriaceae | 2.4 | 0.2 | 0.0302 | 0.949 |
| family | Succinivibrionaceae | 28.6 | 6 | 0.0132 | 0.957 |
| family | Thermoanaerobacteraceae | 118.4 | 66.2 | 0.0138 | 0.938 |
| genus | Asteroleplasma | 200.8 | 65 | 0.0442 | 0.956 |
| genus | Catenibacterium | 81.6 | 20.8 | 0.0154 | 0.953 |
| genus | Defluviitaleaceae UCG-011 | 212 | 108.8 | 0.0119 | 0.949 |
| genus | Desulfovibrio | 504.4 | 264 | 0.0046 | 0.966 |
| genus | Fibrobacter | 3545 | 708.2 | 0.0293 | 0.937 |
| genus | Gelria | 118.4 | 66.2 | 0.0138 | 0.938 |
| genus | Lachnoclostridium 10 | 754.6 | 328.4 | 0.0045 | 0.971 |
| genus | Methylobacterium | 2.4 | 0.2 | 0.0302 | 0.948 |
| genus | Rikenellaceae RC9 gut groupgutgroup | 8569.2 | 6187.4 | 0.0366 | 0.877 |
| genus | Ruminobacter | 28.6 | 6 | 0.0132 | 0.959 |
| genus | Ruminococcaceae UCG-011 | 1140.2 | 615.2 | 0.0025 | 0.975 |
| genus | Solobacterium | 1 | 10.8 | 0.0248 | 0.945 |
| genus | uncultured organism unculturedorganism | 67.8 | 24.4 | 0.0310 | 0.918 |
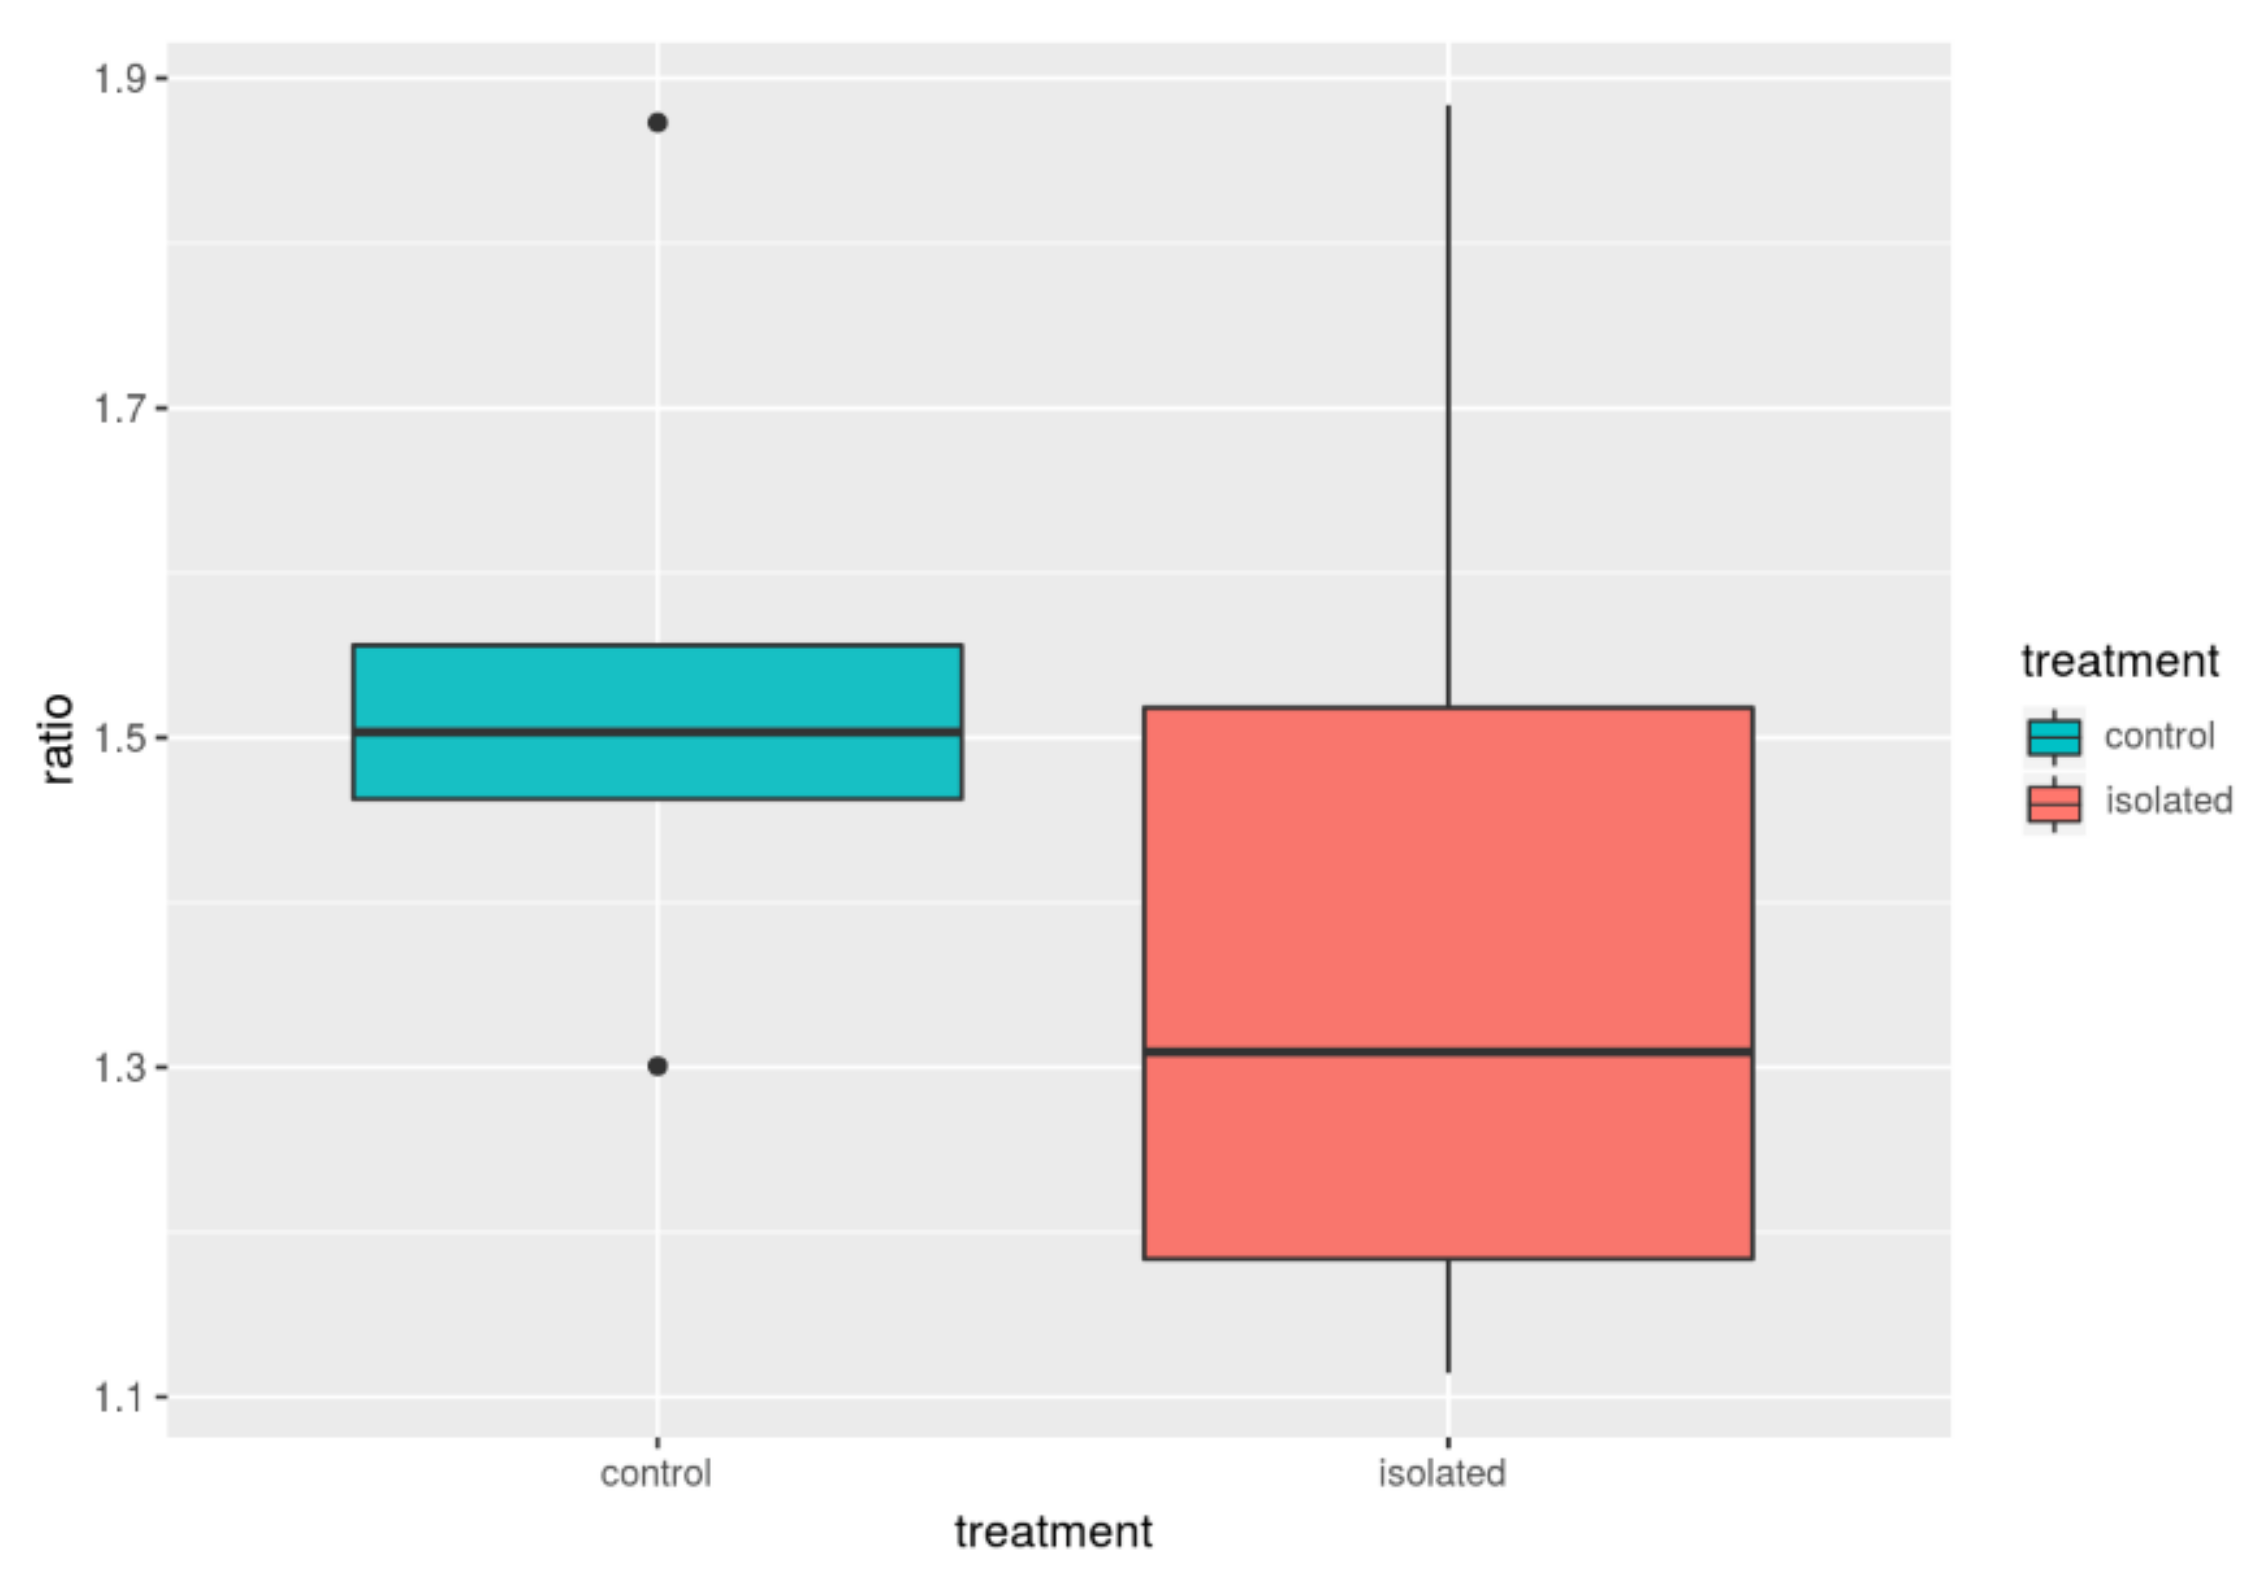
| Group | F/B_avg | B_avg | F_avg | F/B_med | B_med | F_med |
|---|---|---|---|---|---|---|
| Control | 1.54 | 0.28 | 0.42 | 1.50 | 0.29 | 0.43 |
| Isolated | 1.40 | 0.33 | 0.44 | 1.30 | 0.32 | 0.45 |
| Index. | n | Avg_v | Std |
|---|---|---|---|
| Chao1 | 10 | 2907 | 112.3 |
| ACE | 10 | 2902 | 104.9 |
| Fisher_alpha | 10 | 448.9 | 20.5 |
| Observed_otus | 10 | 2592.7 | 141.6 |
| Shannon | 10 | 8.5 | 0.38 |
| Simpson | 10 | 0.986 | 11 |
| Equitability | 10 | 0.753 | 0.03 |
| Simpson_e | 10 | 0.041 | 0.002 |
| Alpha Diversity | Control (n = 5) | Isolated (n = 5) | p-Value | Bayesian Prob. 10% |
|---|---|---|---|---|
| Chao1 | 2955.2, +/−104.29 | 2860.5, +/−109.2 | 0.198 | 0.044 |
| ACE | 2938.6, +/−108.6 | 2867.237, +/−99 | 0.309 | 0.032 |
| Fisher_alpha | 442.27, +/−20.31 | 455.72, +/−20.54 | 0.328 | 0.069 |
| Observed_otus | 2648+/−129.3 | 2537.4 +/−144.1 | 0.237 | 0.131 |
| Shannon | 8.4, +/−0.43 | 8.7, +/−0.26 | 0.203 | 0.072 |
| Simpson | 0.98, +/−0.015 | 0.99, +/−0.003 | 0.178 | 0.001 |
| Equitability | 0.74 +/−0.04 | 0.77 +/−0.019 | 0.151 | 0.084 |
| Simpson_e | 0.03, +/−0.021 | 0.05 +/−0.013 | 0.177 | 0.776 |
Publisher’s Note: MDPI stays neutral with regard to jurisdictional claims in published maps and institutional affiliations. |
© 2020 by the authors. Licensee MDPI, Basel, Switzerland. This article is an open access article distributed under the terms and conditions of the Creative Commons Attribution (CC BY) license (http://creativecommons.org/licenses/by/4.0/).
Share and Cite
Minozzi, G.; Biscarini, F.; Dalla Costa, E.; Chincarini, M.; Ferri, N.; Palestrini, C.; Minero, M.; Mazzola, S.; Piccinini, R.; Vignola, G.; et al. Analysis of Hindgut Microbiome of Sheep and Effect of Different Husbandry Conditions. Animals 2021, 11, 4. https://doi.org/10.3390/ani11010004
Minozzi G, Biscarini F, Dalla Costa E, Chincarini M, Ferri N, Palestrini C, Minero M, Mazzola S, Piccinini R, Vignola G, et al. Analysis of Hindgut Microbiome of Sheep and Effect of Different Husbandry Conditions. Animals. 2021; 11(1):4. https://doi.org/10.3390/ani11010004
Chicago/Turabian StyleMinozzi, Giulietta, Filippo Biscarini, Emanuela Dalla Costa, Matteo Chincarini, Nicola Ferri, Clara Palestrini, Michela Minero, Silvia Mazzola, Renata Piccinini, Giorgio Vignola, and et al. 2021. "Analysis of Hindgut Microbiome of Sheep and Effect of Different Husbandry Conditions" Animals 11, no. 1: 4. https://doi.org/10.3390/ani11010004
APA StyleMinozzi, G., Biscarini, F., Dalla Costa, E., Chincarini, M., Ferri, N., Palestrini, C., Minero, M., Mazzola, S., Piccinini, R., Vignola, G., & Cannas, S. (2021). Analysis of Hindgut Microbiome of Sheep and Effect of Different Husbandry Conditions. Animals, 11(1), 4. https://doi.org/10.3390/ani11010004