High Trophic Niche Overlap between a Native and Invasive Mink Does Not Drive Trophic Displacement of the Native Mink during an Invasion Process

 ,
, 
 and
and
Simple Summary
Abstract

1. Introduction
2. Materials and Methods
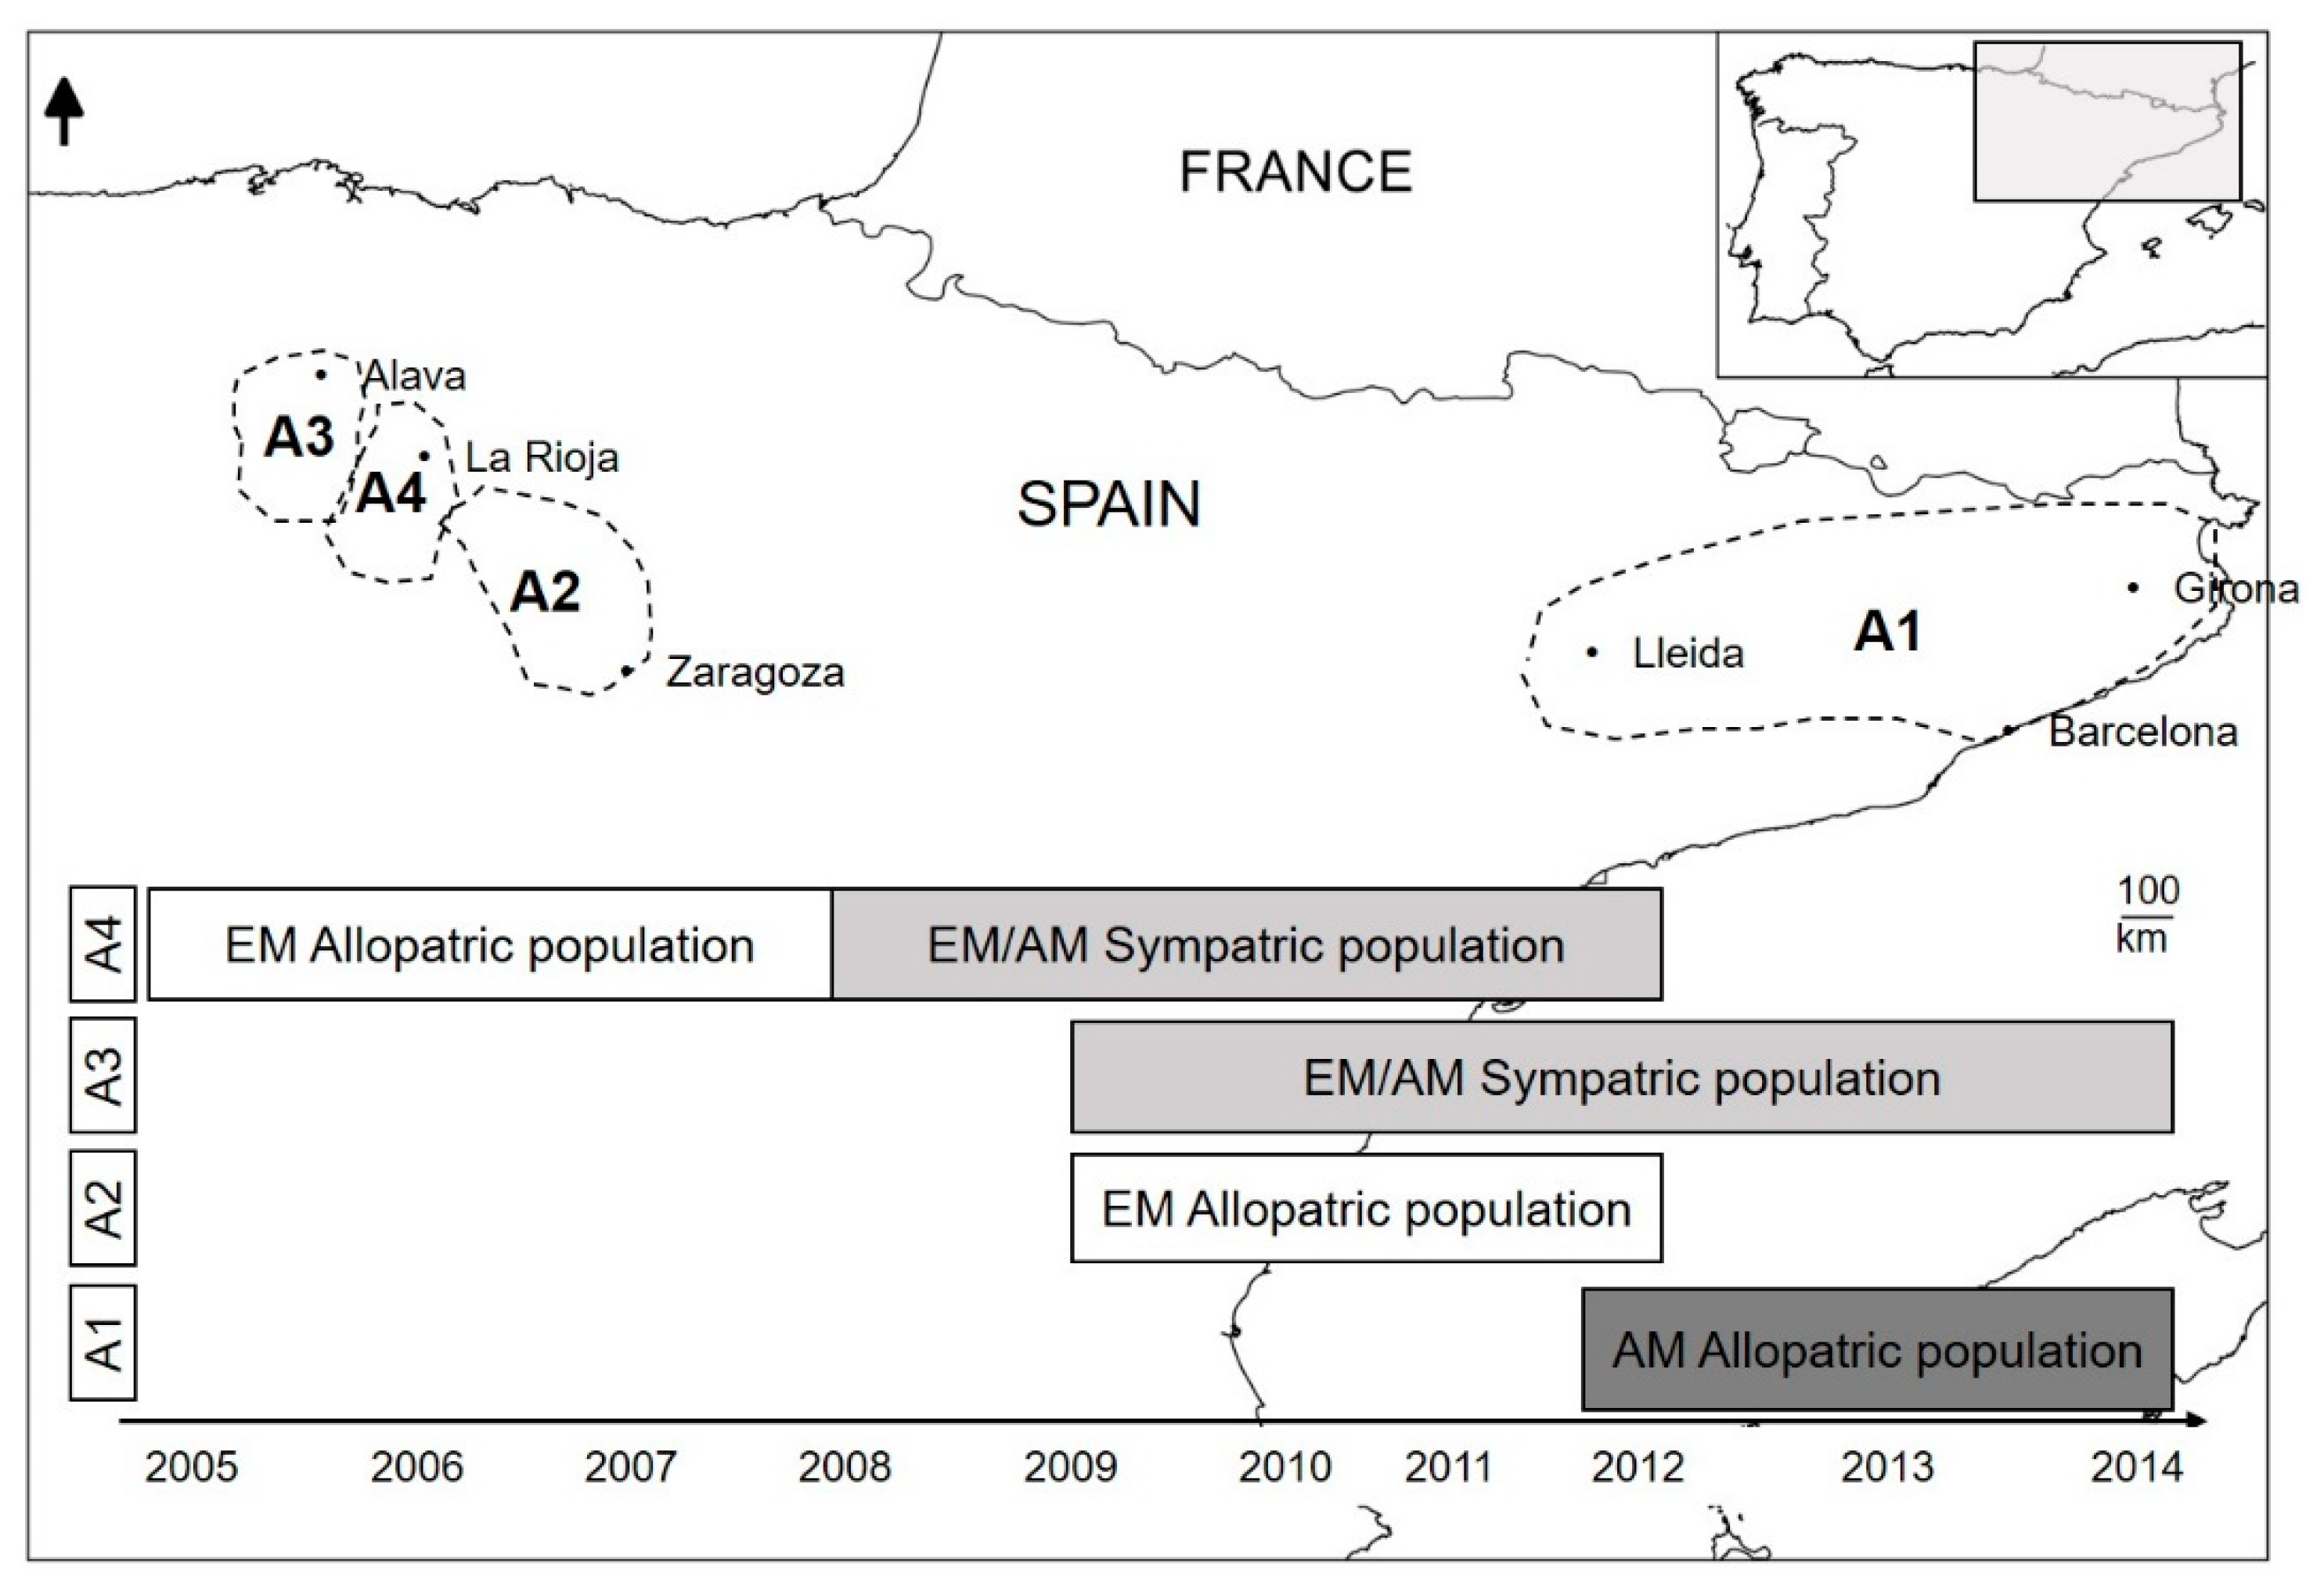
2.1. Study Area
2.2. Sample Collection
2.3. Stable Isotope Analyses
2.4. Data Analyses
3. Results
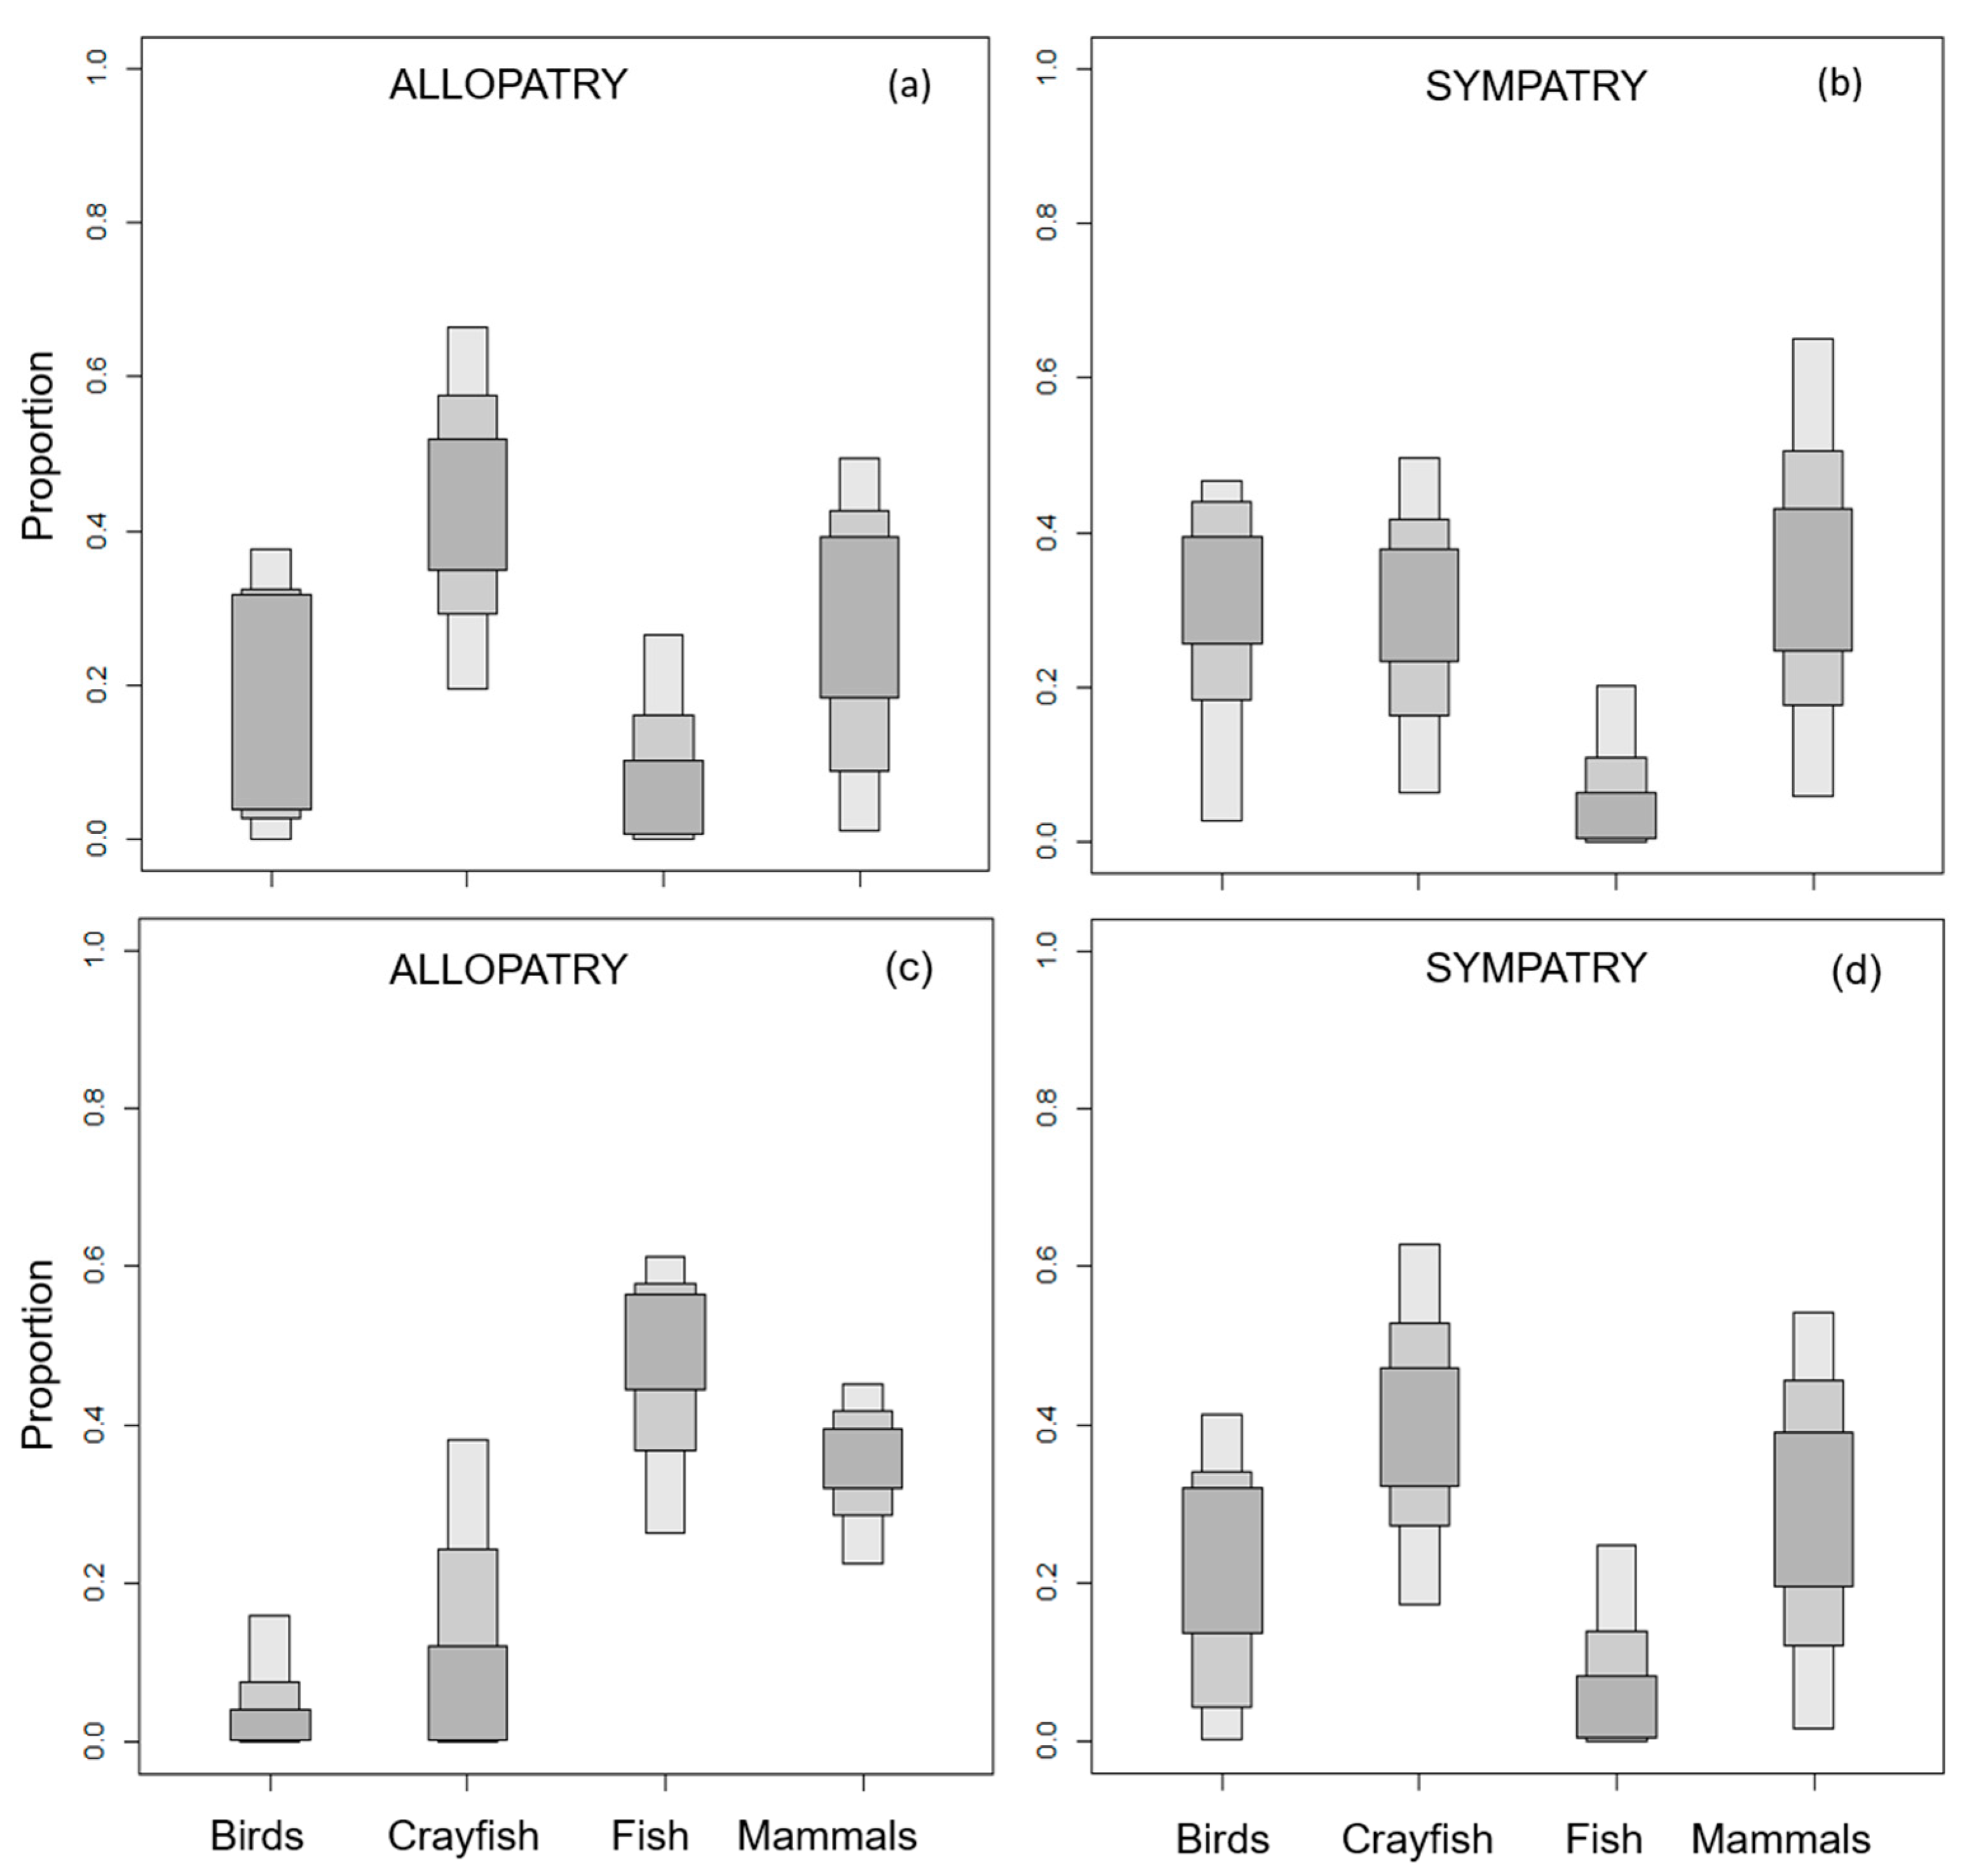
3.1. European Mink Diet
3.2. American Mink Diet
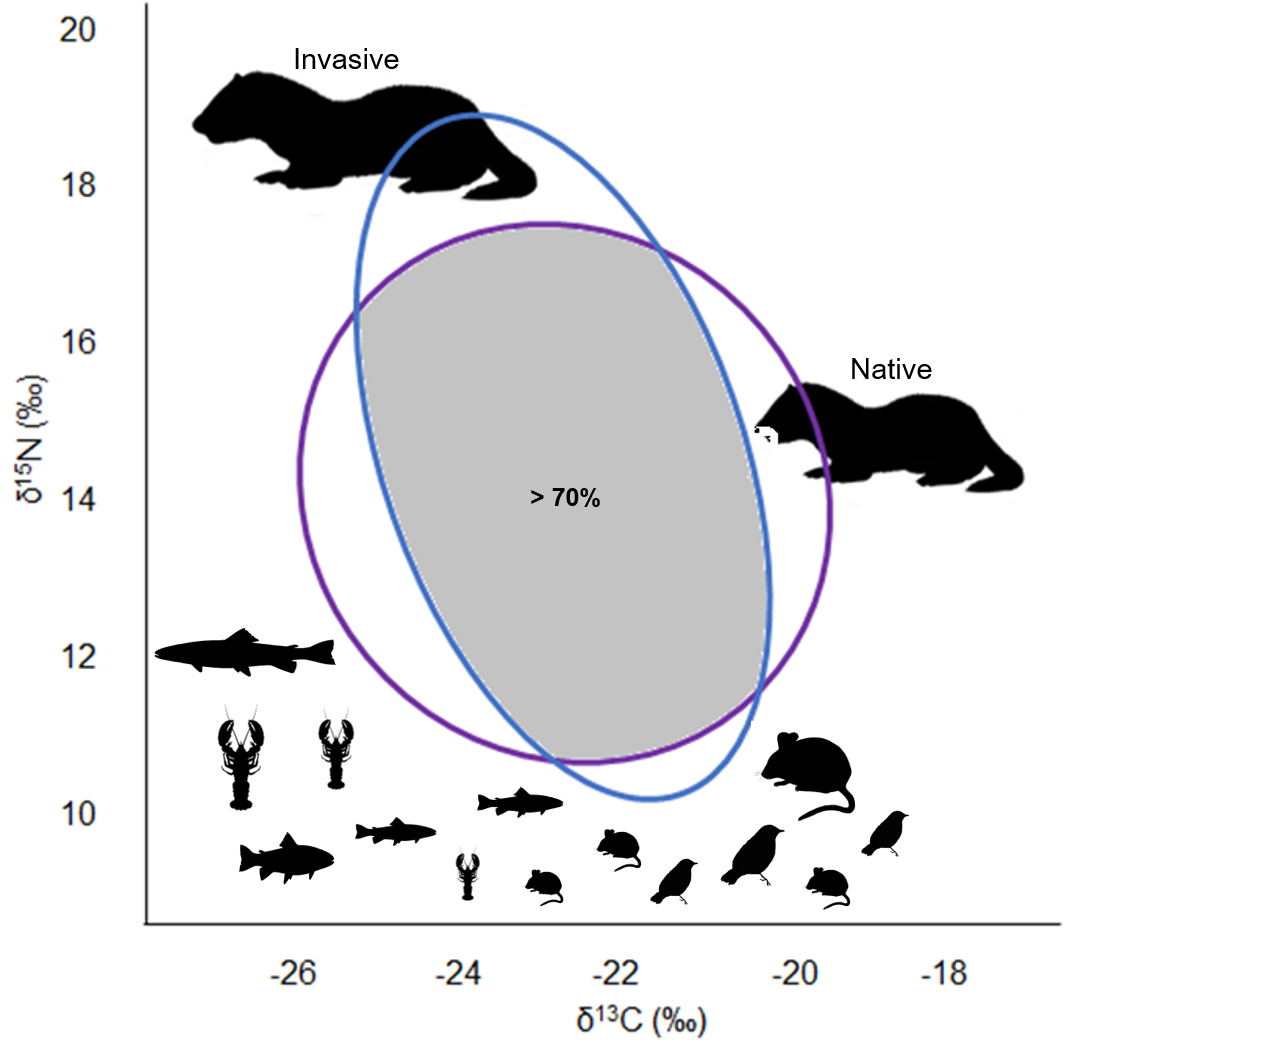
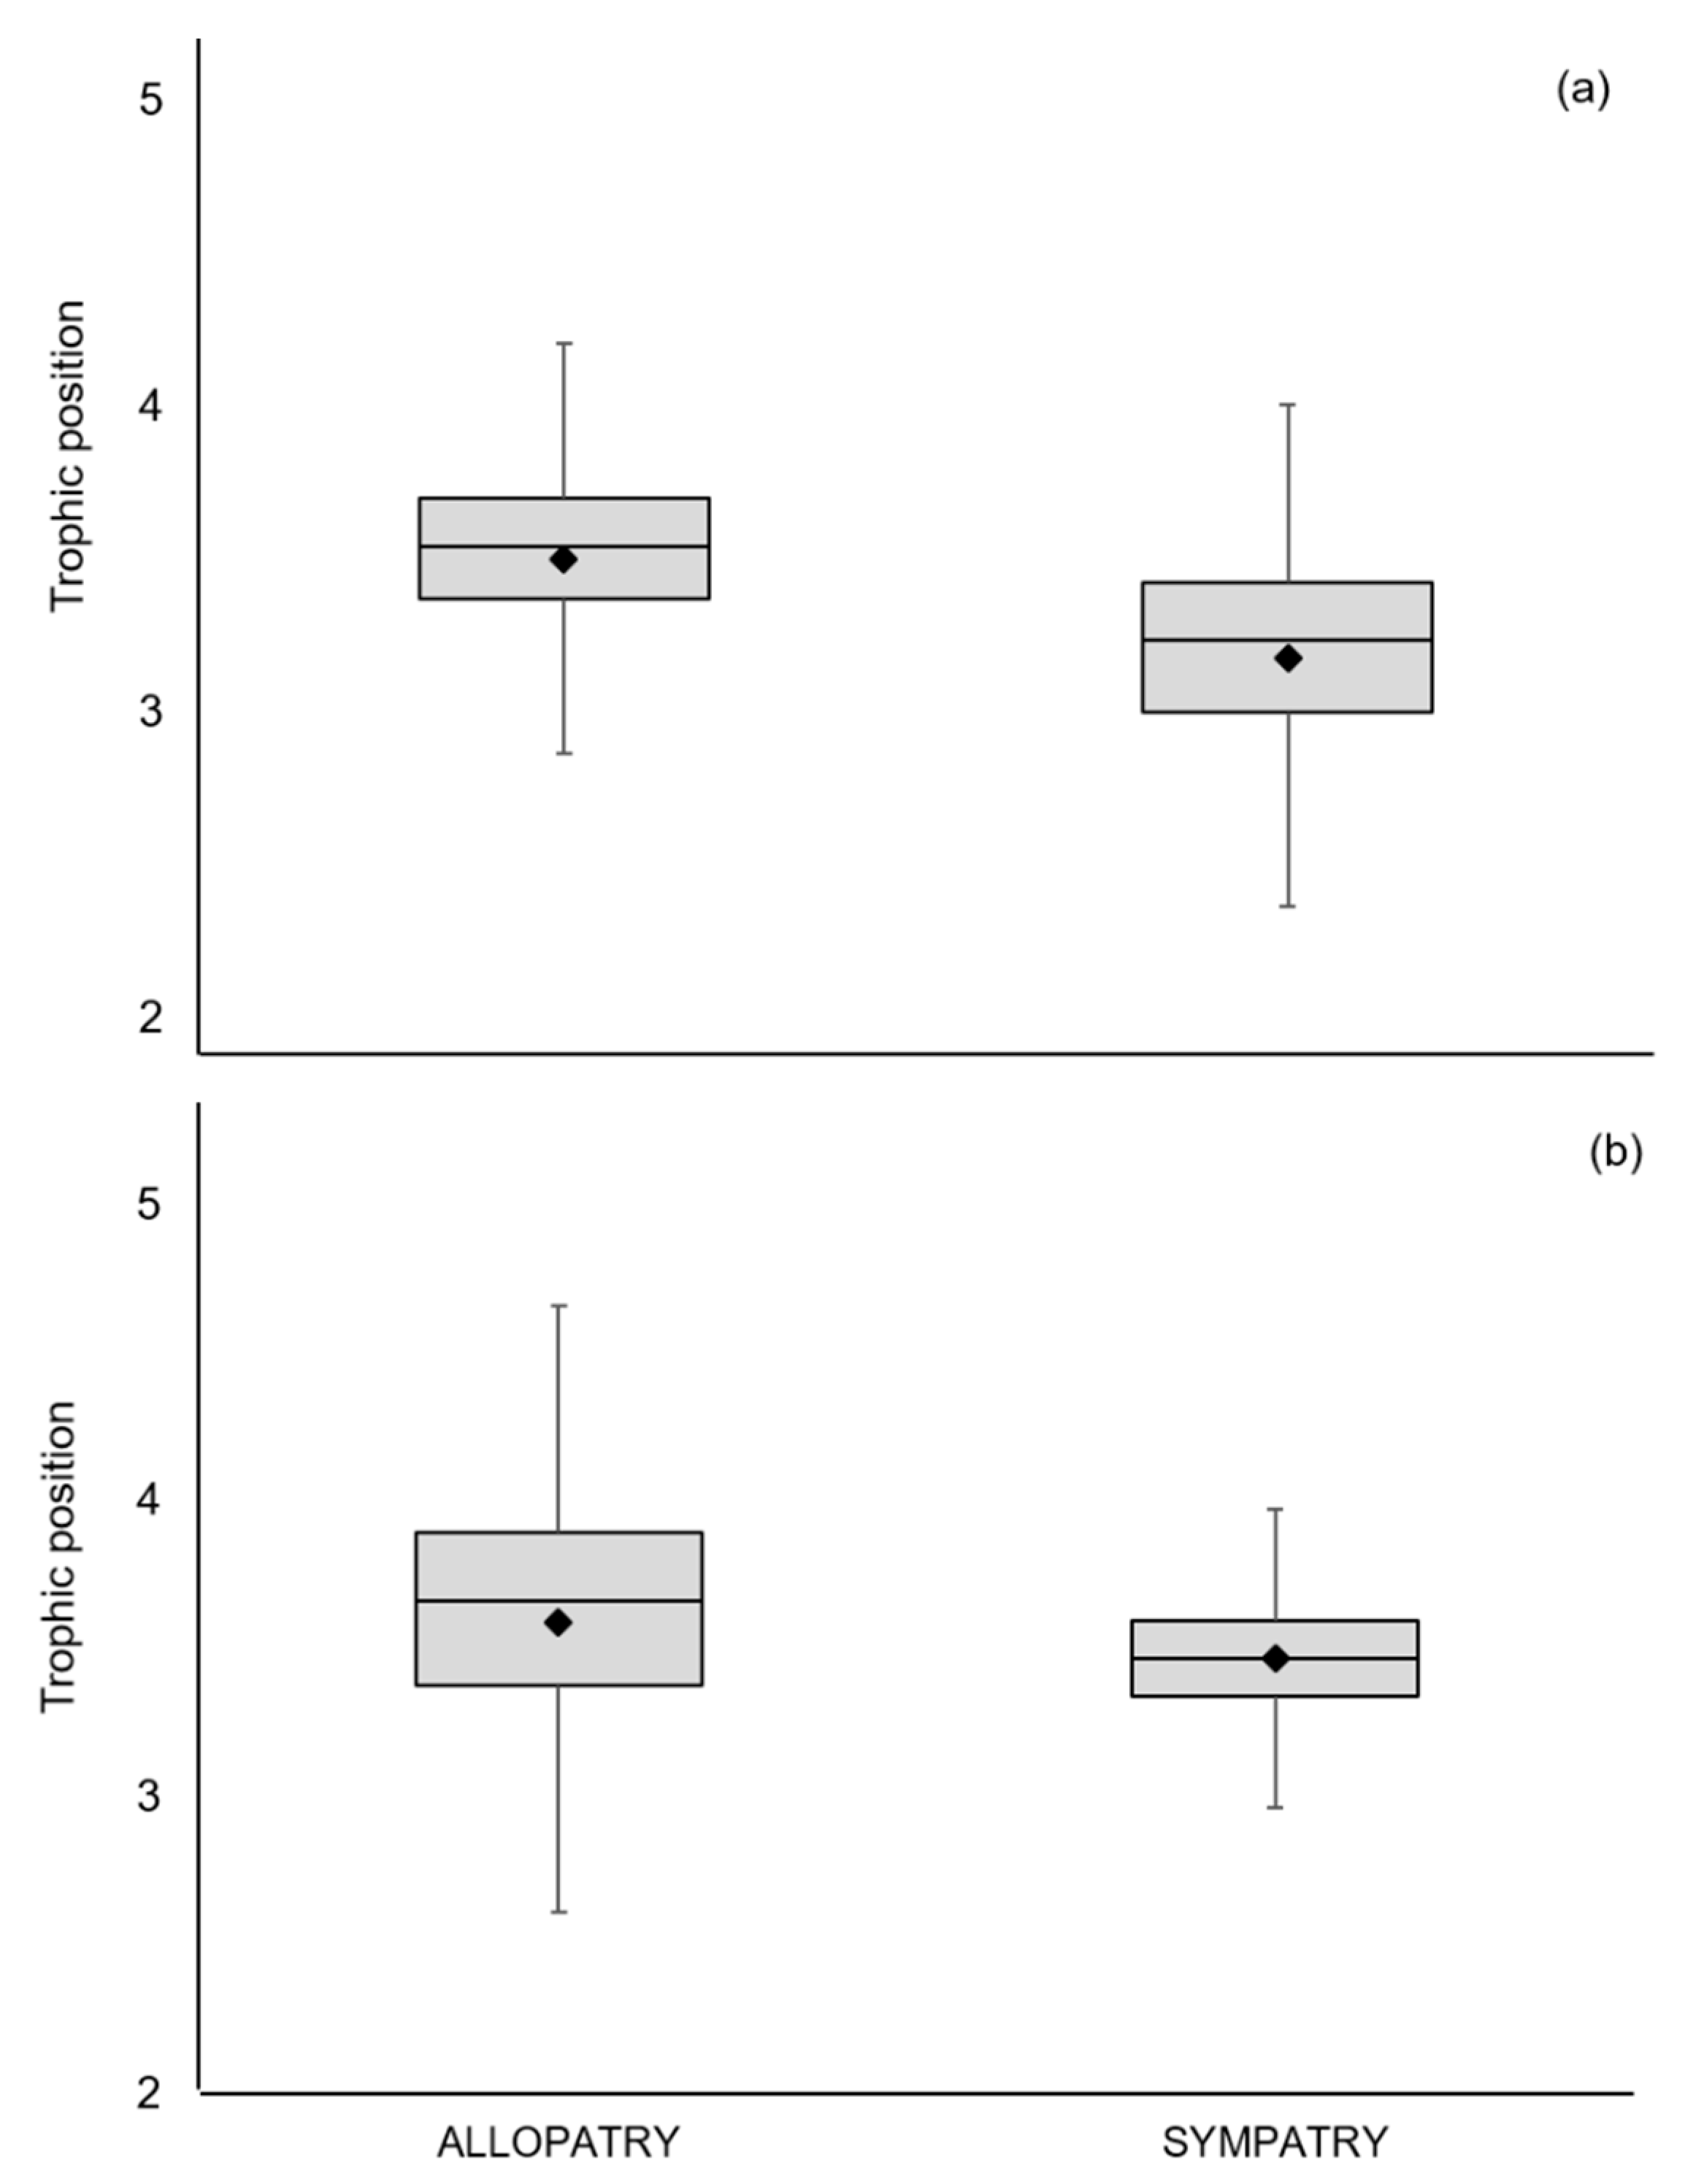
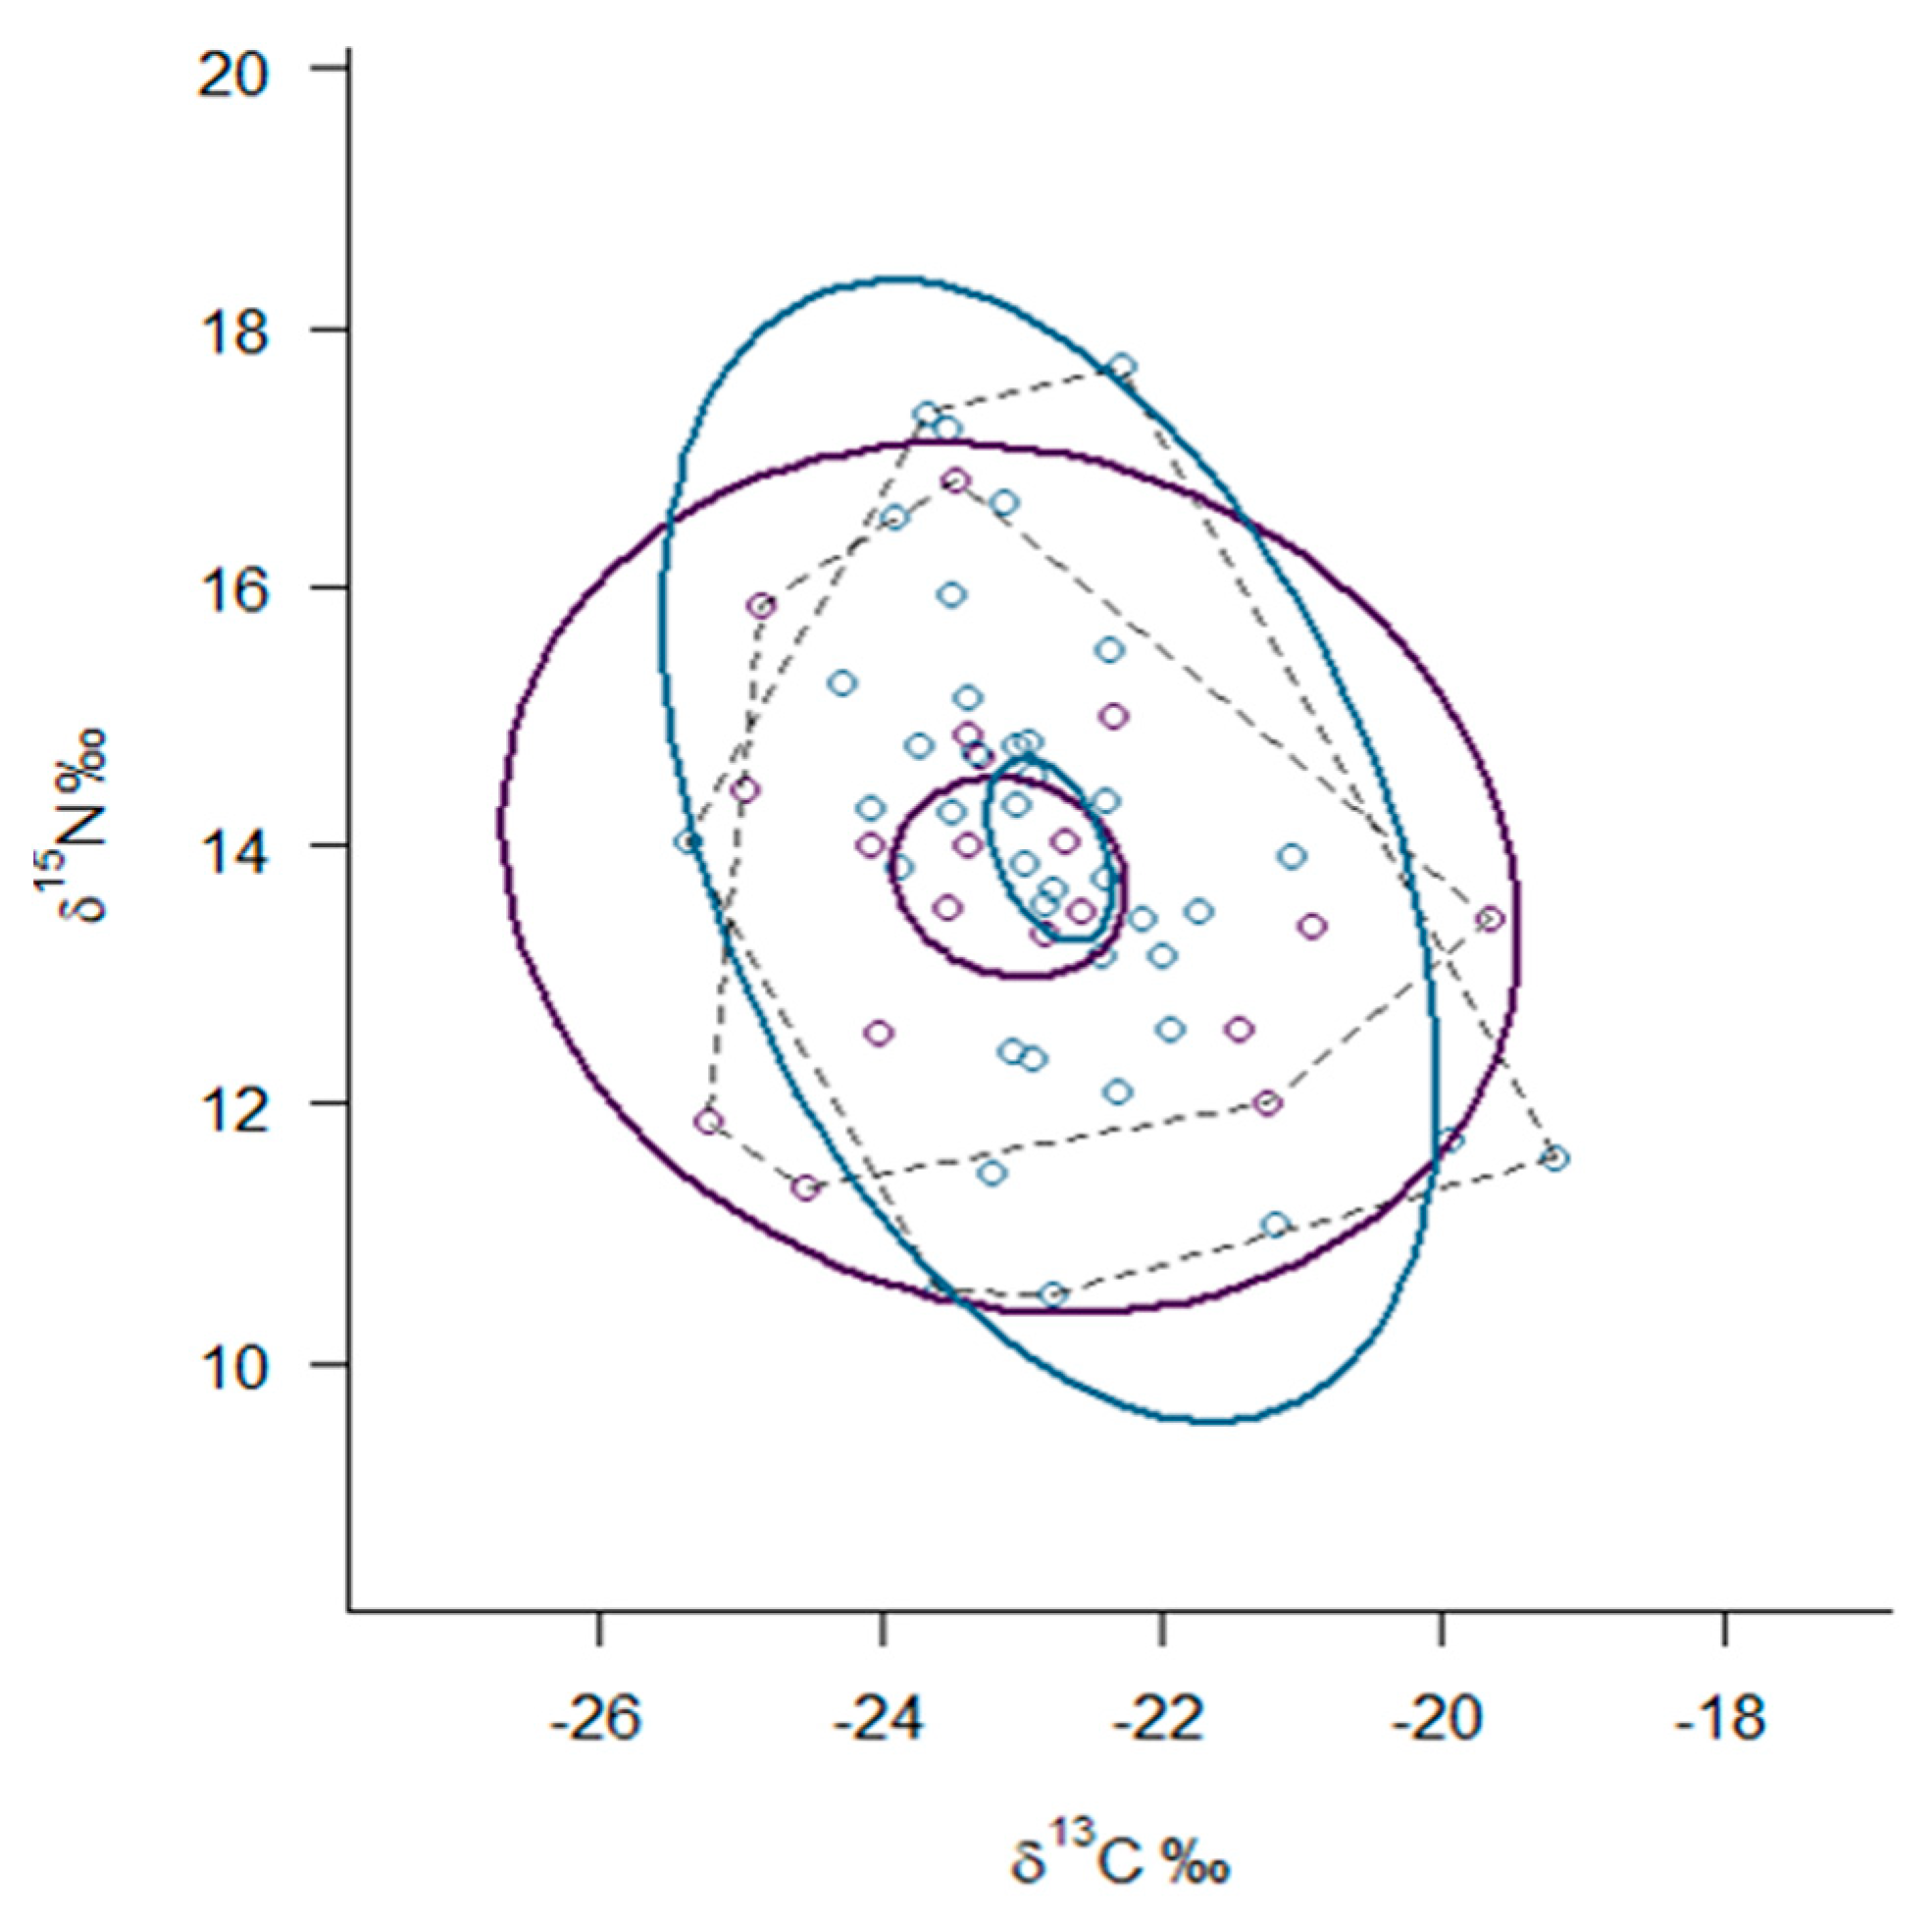
3.3. Trophic Niche Width and Niche Overlap
4. Discussion
5. Conclusions
Supplementary Materials
Author Contributions
Funding
Acknowledgments
Conflicts of Interest
References
- Balzani, P.; Vizzini, S.; Santini, G.; Masoni, A.; Ciofi, C.; Ricevuto, E.; Chelazzi, G. Stable isotope analysis of trophic niche in two co-occurring native and invasive terrapins, Emys orbicularis and Trachemys scripta elegans. Biol. Invasions 2016, 18, 3611–3621. [Google Scholar] [CrossRef]
- Carlsson, N.O.L.; Sarnelle, O.; Strayer, D.L. Native predators and exotic prey-An acquired taste? Front. Ecol. Environ. 2009, 7, 525–532. [Google Scholar] [CrossRef]
- Magoulick, D.D.; Piercey, G.L. Trophic overlap between native and invasive stream crayfish. Hydrobiologia 2016, 766, 237–246. [Google Scholar] [CrossRef]
- Santos, M.J.; Pinto, B.M.; Santos-Reis, M. Trophic niche partitioning between two native and two exotic carnivores in SW Portugal. Web Ecol. 2007, 7, 53–62. [Google Scholar] [CrossRef]
- Glen, A.S.; Dickman, C.R. Niche overlap between marsupial and eutherian carnivores: Does competition threaten the endangered spotted-tailed quoll? J. Appl. Ecol. 2008, 45, 700–707. [Google Scholar] [CrossRef]
- Bøhn, T.; Amundsen, P.A.; Sparrow, A. Competitive exclusion after invasion? Biol. Invasions 2008, 10, 359–368. [Google Scholar] [CrossRef]
- Davidson, A.M.; Michael, J.; Nicotra, A.B. Do invasive species show higher phenotypic plasticity than native species and, if so, is it adaptive? A meta-analysis. Ecol. Lett. 2011, 14, 419–431. [Google Scholar] [CrossRef]
- Einum, S.; Fleming, I.A. Highly fecund mothers sacrifice offspring survival to maximize fitness. Nature 2000, 405, 565–567. [Google Scholar] [CrossRef]
- Pilger, T.J.; Gido, K.B.; Propst, D.L. Diet and trophic niche overlap of native and nonnative fishes in the Gila River, USA: Implications for native fish conservation. Ecol. Freshw. Fish 2010, 19, 300–321. [Google Scholar] [CrossRef]
- Wood, K.A.; Hayes, R.B.; England, J.; Grey, J. Invasive crayfish impacts on native fish diet and growth vary with fish life stage. Aquat. Sci. 2017, 79, 1–13. [Google Scholar] [CrossRef]
- Ortiz-Sandoval, J.J.; Górski, K.; González-Díaz, A.; Habit, E. Trophic scaling of Percichthys trucha (Percichthyidae) in monospecific and multispecific lakes in western Patagonia. Limnologica 2015, 53, 50–59. [Google Scholar] [CrossRef]
- Bradley, B.A.; Laginhas, B.B.; Whitlock, R.; Allen, J.M.; Bates, A.E.; Bernatchez, G.; Diez, J.M.; Early, R.; Lenoir, J.; Vilà, M.; et al. Disentangling the abundance–impact relationship for invasive species. Proc. Natl. Acad. Sci. USA 2019, 116, 9919–9924. [Google Scholar] [CrossRef] [PubMed]
- Genovesi, P.; Carnevali, L.; Alonzi, A.; Scalera, R. Alien mammals in Europe: Updated numbers and trends, and assessment of the effects on biodiversity. Integr. Zool. 2012, 7, 247–253. [Google Scholar] [CrossRef] [PubMed]
- Maran, T.; Skumatov, D.; Valentinovich, F.; Fur Maran, T.; Skumatov, D.; Gomez, A.; Põdra, M.; Abramov, A.V.; Dinets, V. Mustela lutreola. IUCN Red List Threat. Species 2016, 13. [Google Scholar] [CrossRef]
- Macdonald, D.W.; Harrington, L.A. The American mink: The triumph and tragedy of adaptation out of context. N. Z. J. Zool. 2003, 30, 421–441. [Google Scholar] [CrossRef]
- Maran, T.; Kruuk, H.; Macdonald, D.W.; Polma, M. Diet of two species of mink in Estonia: Displacement of Mustela lutreola by M. vison. J. Zool. Lond 1998, 245, 218–222. [Google Scholar] [CrossRef]
- Sidorovich, V.E.; Polozov, A.G.; Zalewski, A. Food niche variation of European and American mink during the American mink invasion in north-eastern Belarus. Biol. Invasions 2010, 12, 2207–2217. [Google Scholar] [CrossRef]
- Santulli, G.; Palazón, S.; Melero, Y.; Gosálbez, J.; Lambin, X. Multi-season occupancy analysis reveals large scale competitive exclusion of the critically endangered European mink by the invasive non-native American mink in Spain. Biol. Conserv. 2014, 176, 21–29. [Google Scholar] [CrossRef]
- Palazón, S.; Ruiz-Olmo, J.; Gosàlbez, J. Diet of European mink (Mustela lutreola) in Northern Spain. Mammalia 2004, 68, 159–165. [Google Scholar] [CrossRef]
- Palazón, S.; Ruiz-Olmo, J.; Gosálbez, J. Autumn-winter diet of three carnivores, European mink (Mustela lutreola), Eurasian otter (Lutra lutra) and small-spotted genet (Genetta genetta), in Northern Spain. Anim. Biodivers. Conserv. 2008, 31, 37–43. [Google Scholar] [CrossRef]
- Melero, Y.; Palazón, S.; Bonesi, L.; Gosàlbez, J. Feeding habits of three sympatric mammals in NE Spain: The American mink, the spotted genet, and the Eurasian otter. Acta Theriol. Warsz 2008, 53, 263–273. [Google Scholar] [CrossRef]
- Caut, S.; Angulo, E.; Courchamp, F. Avoiding surprise effects on surprise island: Alien species control in a multitrophic level perspective. Biol. Invasions 2009, 11, 1689–1703. [Google Scholar] [CrossRef]
- Bolnick, D.I.; Yang, L.H.; Fordyce, J.A.; Davis, J.M.; Svanbäck, R. Measuring individual-level resource specialization. Ecology 2002, 83, 2936–2941. [Google Scholar] [CrossRef]
- Bodey, T.W.; Bearhop, S.; Roy, S.S.; Newton, J.; McDonald, R.A. Behavioural responses of invasive American mink Neovison vison to an eradication campaign, revealed by stable isotope analysis. J. Appl. Ecol. 2010, 47, 114–120. [Google Scholar] [CrossRef]
- Bearhop, S.; Adams, C.E.; Waldron, S.; Fuller, R.A.; Macleod, H. Determining trophic niche width: A novel approach using stable isotope analysis. J. Anim. Ecol. 2004, 73, 1007–1012. [Google Scholar] [CrossRef]
- Newsome, S.D.; Martinez del Rio, C.; Bearhop, S.; Phillips, D.L. A Niche for Isotope Ecology. Front. Ecol. Environ. 2007, 5, 429–436. [Google Scholar] [CrossRef]
- Bodey, T.W.; Bearhop, S.; McDonald, R.A. Invasions and stable isotope analysis–informing ecology and management. In Island Invasives: Eradication and Management; Veitch, C.R., Clout, M.N., Towns, D.R., Eds.; IUCN: Auckland, New Zealand, 2011; pp. 148–151. [Google Scholar]
- Inger, R.; Bearhop, S. Applications of stable isotope analyses to avian ecology. Ibis Lond. 1859 2008, 150, 447–461. [Google Scholar] [CrossRef]
- Middelburg, J.J. Stable isotopes dissect aquatic food webs from the top to the bottom. Biogeosciences 2014, 11, 2357–2371. [Google Scholar] [CrossRef]
- Kelly, J.F. Stable isotopes of carbon and nitrogen in the study of avian and mammalian trophic ecology. Can. J. Zool. 2000, 78, 1–27. [Google Scholar] [CrossRef]
- Boecklen, W.J.; Yarnes, C.T.; Yarnes, C.T.; Cook, B.A.; Cook, B.A.; James, A.C.; James, A.C. On the use of stable isotopes in trophic ecology. Annu. Rev. Ecol. Evol. Syst. 2011, 42, 411–440. [Google Scholar] [CrossRef]
- Guzzo, M.M.; Haffner, G.D.; Legler, N.D.; Rush, S.A.; Fisk, A.T. Fifty years later: Trophic ecology and niche overlap of a native and non-indigenous fish species in the western basin of Lake Erie. Biol. Invasions 2013, 15, 1695–1711. [Google Scholar] [CrossRef]
- MAGRAMA. Estrategia de gestión, control y erradicación del visón americano (Neovison vison) en España; Ministerio de Agricultura, Alimentación y Medio Ambiente: Madrid, Spain, 2014.
- Folch, J.; Lees, M.; Stanley, G.H.S. A simple method for the isolation and purification of total lipids from animal tissues. J. Biol. Chem. 1957, 226, 497–509. [Google Scholar] [PubMed]
- Hobson, K.A.; Clark, R.G. Assessing avian diets using stable isotopes II. Factors influencing diet-tissue fractionation. Condor 1992, 94, 189–197. [Google Scholar] [CrossRef]
- Newsome, S.D.; Tinker, M.T.; Monson, D.H.; Oftedal, O.T.; Staedler, M.M.; Fogel, M.L.; Estes, J.A.; Tinker, T.; Monson, H.; Fogel, L.; et al. Using stable isotopes to investigate individual diet specialization in California Sea Otters (Enhydra lutris nereis). Ecology 2009, 90, 961–974. [Google Scholar] [CrossRef] [PubMed]
- Newsome, S.D.; Bentall, G.B.; Tinker, M.T.; Oftedal, O.T.; Ralls, K.; Estes, J.A.; Fooel, M.L. Variation in δ13C and δ15N diet-vibrissae trophic discrimination factors in a wild population of California sea otters. Ecol. Appl. 2010, 20, 1744–1752. [Google Scholar] [CrossRef]
- Parnell, A.C.; Inger, R.; Bearhop, S.; Jackson, A.L. Source partitioning using stable isotopes: Coping with too much variation. PLoS ONE 2010, 5, e9672. [Google Scholar] [CrossRef]
- Quezada-Romegialli, C.; Jackson, A.L.; Hayden, B.; Kahilainen, K.K.; Lopes, C.; Harrod, C. TRophicPosition, an R package for the Bayesian estimation of trophic position from consumer stable isotope ratios. Methods Ecol. Evol. 2018, 9, 1592–1599. [Google Scholar] [CrossRef]
- Layman, C.; Arrington, D.A.; Montaña, C.; Post, D.M. Can stable isotope ratios provide for community-wide measures of trophic structure? Ecology 2007, 88, 42–48. [Google Scholar] [CrossRef]
- Jackson, A.L.; Inger, R.; Parnell, A.C.; Bearhop, S. Comparing isotopic niche widths among and within communities: SIBER-Stable Isotope Bayesian Ellipses in R. J. Anim. Ecol. 2011, 80, 595–602. [Google Scholar] [CrossRef]
- Layman, C.A.; Araujo, M.S.; Boucek, R.; Hammerschlag-Peyer, C.M.; Harrison, E.; Jud, Z.R.; Matich, P.; Rosenblatt, A.E.; Vaudo, J.J.; Yeager, L.A.; et al. Applying stable isotopes to examine food-web structure: An overview of analytical tools. Biol. Rev. 2012, 87, 545–562. [Google Scholar] [CrossRef]
- Palazón, S.; Melero, Y. Status, threats and management actions on the European mink Mustela lutreola (Linnaeus, 1761) in Spain: A review of the studies performed since 1992. Munibe Monogr. Nat. Ser. 2014, 3, 109–118. [Google Scholar] [CrossRef]
- Põdra, M.; Gómez, A.; Palazón, S. Do American mink kill European mink? Cautionary message for future recovery efforts. Eur. J. Wildl. Res. 2013, 59, 431–440. [Google Scholar] [CrossRef]
- Põdra, M.; Gómez, A. Rapid expansion of the American mink poses a serious threat to the European mink in Spain. Mammalia 2018, 82, 580–588. [Google Scholar] [CrossRef]
- Vander Zanden, M.J.; Casselman, J.M.; Rasmussen, J.B. Stable isotope evidence for the food web consequences of species invasions in lakes. Nature 1999, 401, 464–467. [Google Scholar] [CrossRef]
- Salo, P.; Korpimaki, E.; Banks, P.B.; Nordstrom, M.; Dickman, C.R. Alien predators are more dangerous than native predators to prey populations. Proc. R. Soc. B Biol. Sci. 2007, 274, 1237–1243. [Google Scholar] [CrossRef]
- Sidorovich, V. Individual feeding specialization in the European mink, Mustela lutreola and the American mink, M. vison in north-eastern Belarus. In Analysis of Vertebrate Predator-Prey Community; Sidorovich, V., Ed.; Tesey: Minsk, Belarus, 2011; pp. 498–514. [Google Scholar]
- Chibowski, P.; Zalewski, A.; Suska-Malawska, M.; Brzeziński, M. Study on geographical differences in American mink diets reveals variations in isotopic composition of potential mink prey. Mamm. Res. 2019, 64, 343–351. [Google Scholar] [CrossRef]
- Kranz, A.; Poledník, L.; Gotea, V. Conservation of the European Mink (Mustela lutreola) in the Danube delta background information and project plan. Sci. Ann. Danube Delta Inst. Res. Dev. 2002, 8, 124–129. [Google Scholar]
- Polacik, M.; Janác, M.; Jurajda, P.; Adamek, Z.; Ondrackova, M.; Trichkova, T.; Vassilev, M. Invasive gobies in the Danube: Invasion success facilitated by availability and selection of superior food resources. Ecol. Freshw. Fish 2009, 640–649. [Google Scholar] [CrossRef]
- Cucherousset, J.; Aymes, J.C.; Santoul, F.; Céréghino, R. Stable isotope evidence of trophic interactions between introduced brook trout Salvelinus fontinalis and native brown trout Salmo trutta in a mountain stream of south-west France. J. Fish Biol. 2007, 71, 210–223. [Google Scholar] [CrossRef]
- Olsson, K.; Stenroth, P.; Nystro, P.; Granéli, W. Invasions and niche width: Does niche width of an introduced crayfish differ from a native crayfish ? Freshw. Biol. 2009, 54, 1731–1740. [Google Scholar] [CrossRef]
- Pascual-Rico, R.; Sánchez-Zapata, J.A.; Navarro, J.; Eguía, S.; Anadón, J.D.; Botella, F. Ecological niche overlap between co-occurring native and exotic ungulates: Insights for a conservation conflict. Biol. Invasions 2020, 22, 2497–2508. [Google Scholar] [CrossRef]
- Harrington, L.A.; Macdonald, D.W. Spatial and temporal relationships between invasive american mink and native European polecats in the Southern United Kingdom. J. Mammal. 2008, 89, 991–1000. [Google Scholar] [CrossRef]
- Clout, M.N.; Russell, J.C. The invasion ecology of mammals: A global perspective. Wildl. Res. 2007, 180–184. [Google Scholar] [CrossRef]
- Blackburn, T.M.; Cassey, P.; Duncan, R.P.; Evans, K.L.; Gaston, K.J. Avian Extinction and Mammalian Introductions on Oceanic Islands. Science 2011, 305, 1955–1958. [Google Scholar] [CrossRef] [PubMed]
- Bonesi, L.; Palazón, S. The American mink in Europe: Status, impacts, and control. Biol. Conserv. 2007, 134, 470–483. [Google Scholar] [CrossRef]
- Fey, K.; Banks, P.B.; Oksanen, L.; Korpimäki, E. Does removal of an alien predator from small islands in the Baltic Sea induce a trophic cascade? Ecogr. Cop. 2009, 32, 546–552. [Google Scholar] [CrossRef]


| Species/Metrics | n | δ13C (‰) | δ15N (‰) | TP | TA | SEAc |
|---|---|---|---|---|---|---|
| Allopatry | ||||||
| Mustela lutreola | 25 | −23.13 (1.36) | 14.57 (1.41) | 3.5 (2.1–4.3) | ||
| Neovison vison | 45 | −23.83 (1.72) | 14.84 (2.22) | 3.6 (2.0–4.7) | ||
| Sympatry | ||||||
| Mustela lutreola | 19 | −23.08 (1.48) | 13.75 (1.37) | 3.2 (2.0–4.0) | 18.84 | 6.68 |
| Neovison vison | 40 | −22.78 (1.10) | 13.87 (1.84) | 3.5 (2.8–4.2) | 26.08 | 5.97 |
| Primary sources | ||||||
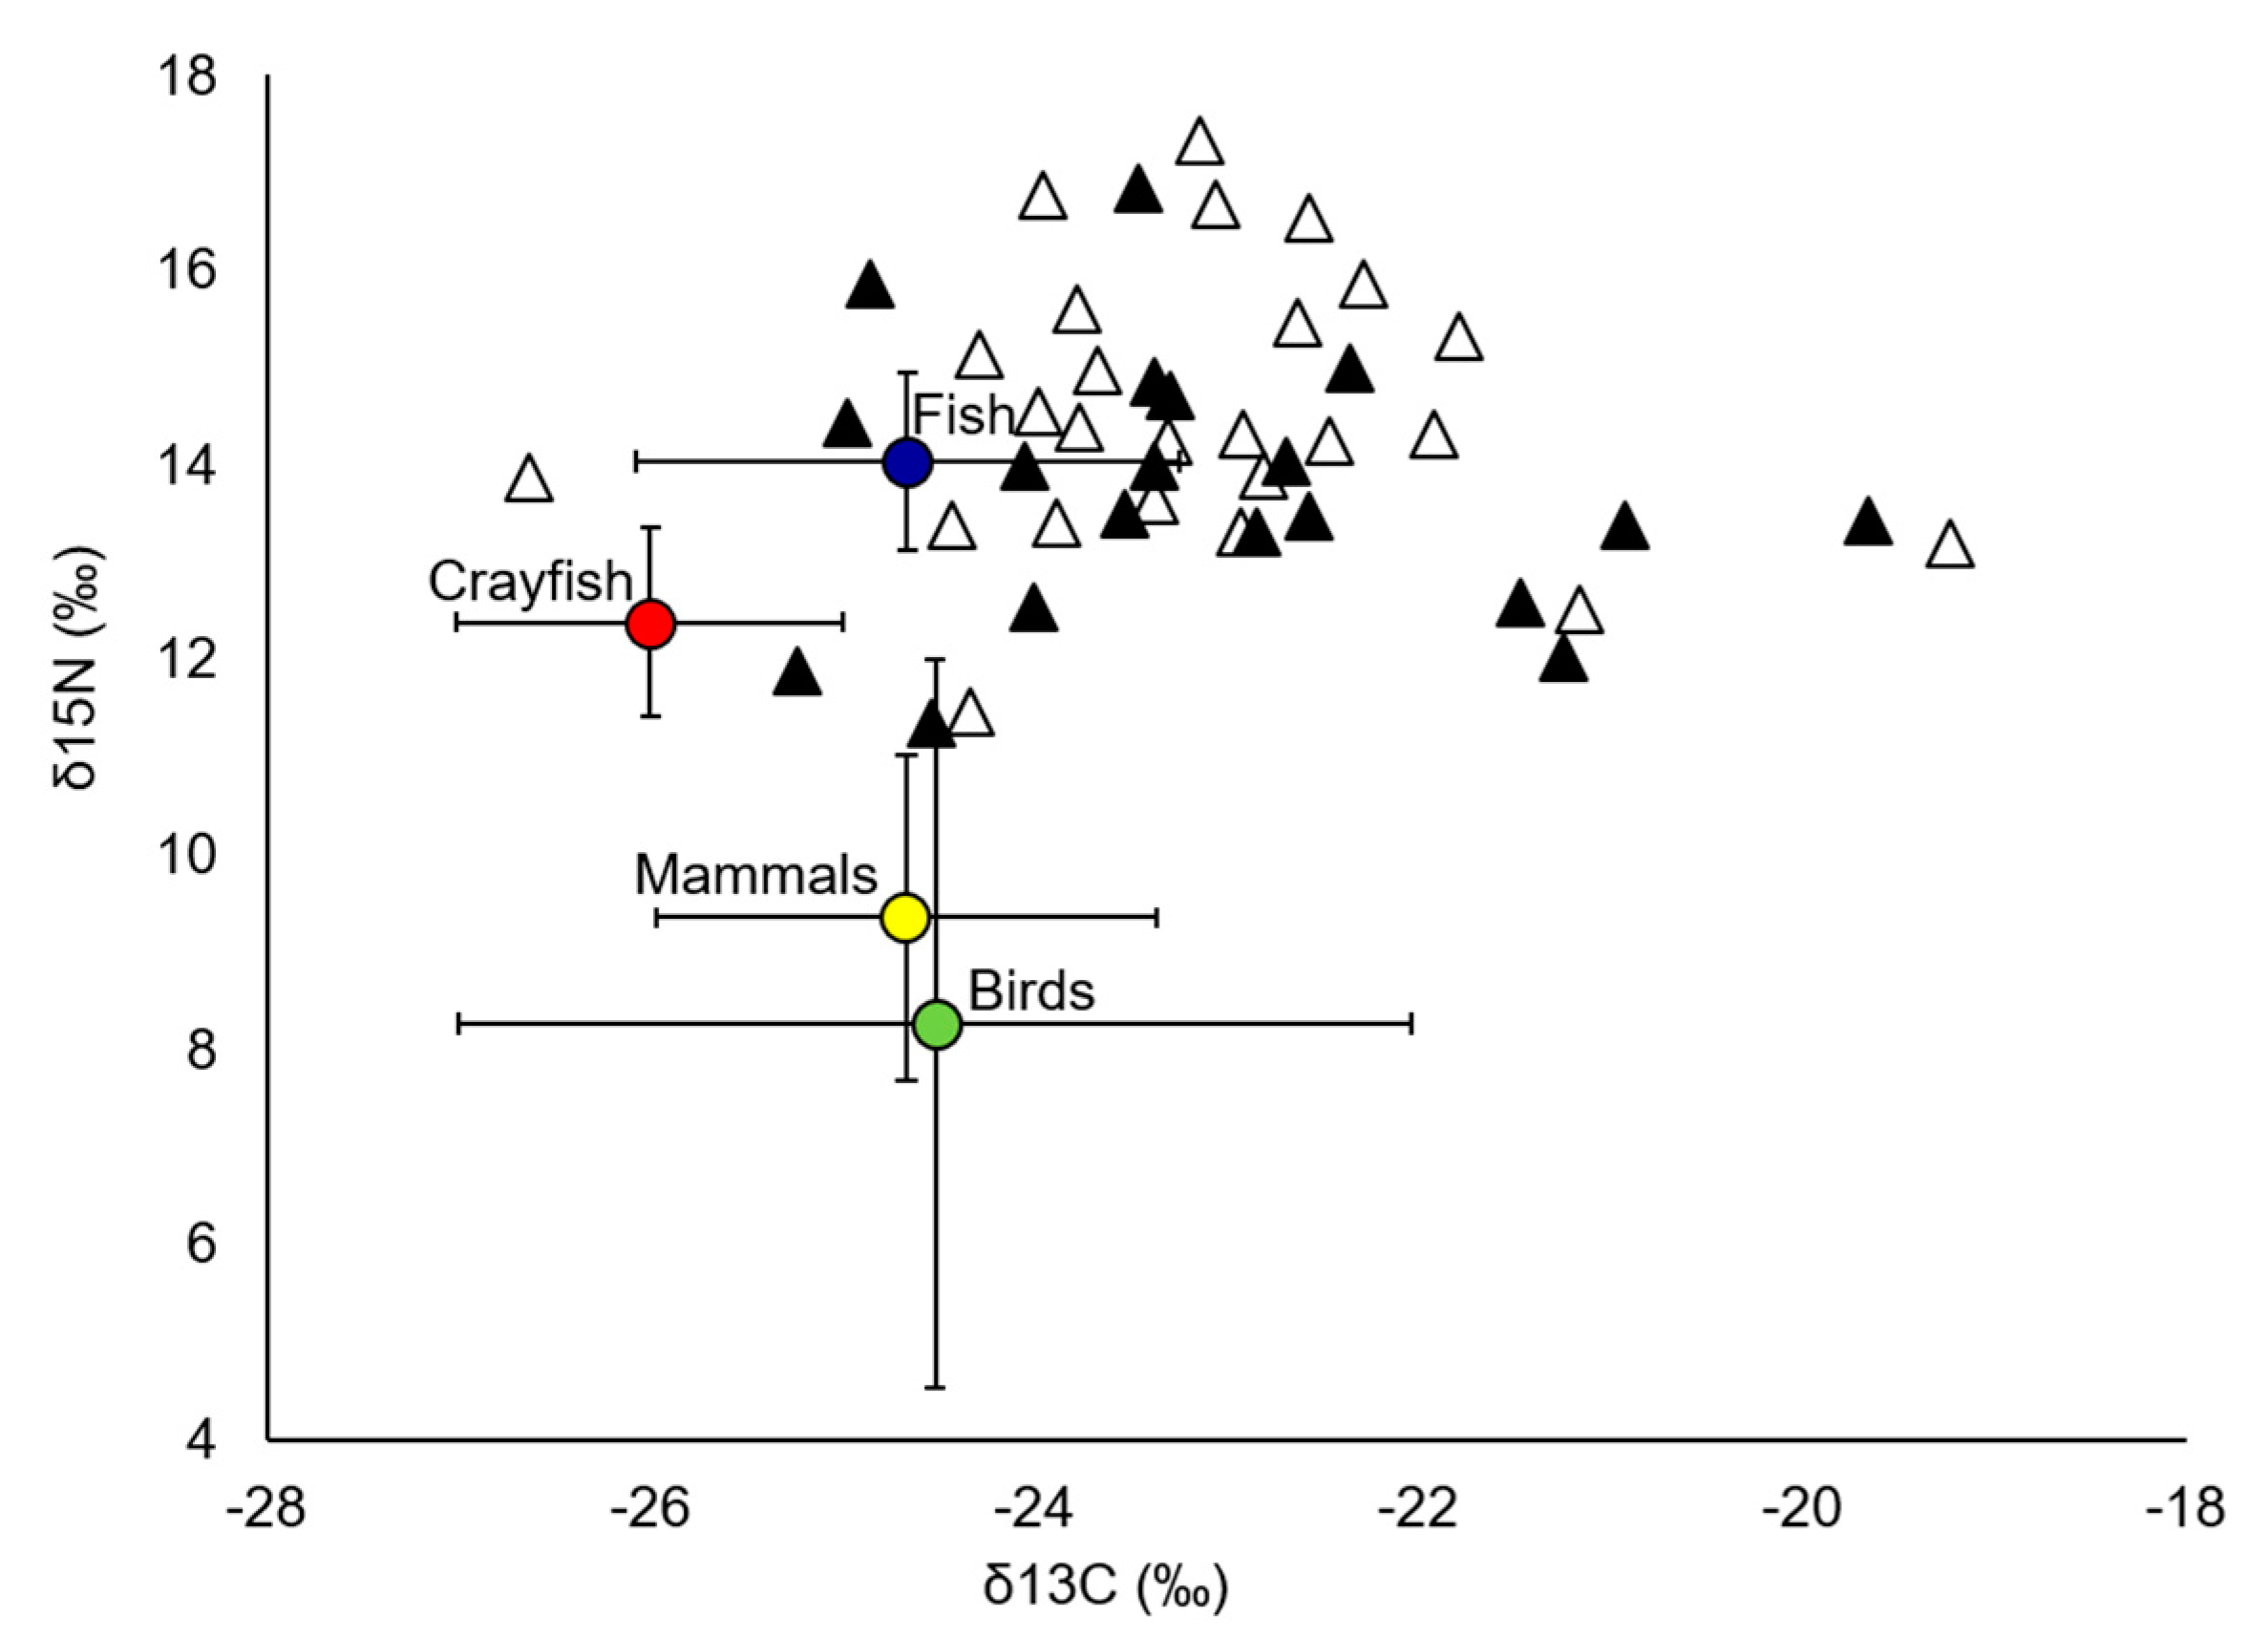
| Crayfish | 7 | −26.00 (1.01) | 12.38 (0.97) | |||
| Fish | 22 | −24.66 (1.42) | 14.04 (0.91) | |||
| Birds | 31 | −24.52 (2.48) | 8.26 (3.73) | |||
| Mammals | 11 | −24.67 (1.30) | 9.35 (1.67) |
© 2020 by the authors. Licensee MDPI, Basel, Switzerland. This article is an open access article distributed under the terms and conditions of the Creative Commons Attribution (CC BY) license (http://creativecommons.org/licenses/by/4.0/).
Share and Cite
García, K.; Sanpera, C.; Jover, L.; Palazón, S.; Gosálbez, J.; Górski, K.; Melero, Y. High Trophic Niche Overlap between a Native and Invasive Mink Does Not Drive Trophic Displacement of the Native Mink during an Invasion Process. Animals 2020, 10, 1387. https://doi.org/10.3390/ani10081387
García K, Sanpera C, Jover L, Palazón S, Gosálbez J, Górski K, Melero Y. High Trophic Niche Overlap between a Native and Invasive Mink Does Not Drive Trophic Displacement of the Native Mink during an Invasion Process. Animals. 2020; 10(8):1387. https://doi.org/10.3390/ani10081387
Chicago/Turabian StyleGarcía, Karla, Carola Sanpera, Lluís Jover, Santiago Palazón, Joaquim Gosálbez, Konrad Górski, and Yolanda Melero. 2020. "High Trophic Niche Overlap between a Native and Invasive Mink Does Not Drive Trophic Displacement of the Native Mink during an Invasion Process" Animals 10, no. 8: 1387. https://doi.org/10.3390/ani10081387
APA StyleGarcía, K., Sanpera, C., Jover, L., Palazón, S., Gosálbez, J., Górski, K., & Melero, Y. (2020). High Trophic Niche Overlap between a Native and Invasive Mink Does Not Drive Trophic Displacement of the Native Mink during an Invasion Process. Animals, 10(8), 1387. https://doi.org/10.3390/ani10081387