Communication

Molecular Identification of the “Facciuta Della Valnerina” Local Goat Population Reared in the Umbria Region, Italy

1
Department of Agricultural, Food and Environmental Sciences, University of Perugia, Borgo XX giugno 74, 06121, Italy
2
Department of Animal Science, Faculty of Agriculture, Akdeniz University, Antalya, 07058, Turkey
*
Authors to whom correspondence should be addressed.
Animals 2020, 10(4), 601; https://doi.org/10.3390/ani10040601
Submission received: 28 February 2020 / Revised: 27 March 2020 / Accepted: 30 March 2020 / Published: 1 April 2020
(This article belongs to the Special Issue Morpho-Functional and Genetic Characterization of Local Breeds)

Abstract

:

Simple Summary

The Facciuta goat originated from Valnerina, a geographic area in central Italy, including the adjacent parts of four regions: Umbria, Marche, Lazio, and Abruzzo. The aim of this study was to assess how useful microsatellite molecular markers are for the genetic discrimination of the local goat, Facciuta della Valnerina, compared with the two cosmopolitan breeds, Saanen and Camosciata delle Alpi, reared in the same geographic area. The results revealed a very clear separation between the local population (Facciuta della Valnerina) and the two reference goat breeds (Saanen and Camosciata delle Alpi). Furthermore, reducing the number of markers from 16 to 12 still allowed us to distinguish the local population, indicating that microsatellite markers are an inexpensive method to discriminate local livestock breeds. This could be a fast and inexpensive genomic tool to trace goat products and distinguish their origin.

Abstract

Italy holds important genetic resources of small ruminant breeds. By distinguishing goat breeds at the DNA level, certification of products from specific breeds can be valorized. The aim of this study was to establish the genetic identity of Facciuta della Valnerina, a local goat population of Italy, compared with the cosmopolitan breeds, Saanen and Camosciata delle Alpi, reared in the same geographic area. A total of 116 microsatellite alleles ranging from 4 to 13 were detected at 16 loci in the three goat populations/breeds. A total of 23 private alleles with frequencies lower than 0.3 were detected in the Facciuta della Valnerina population. The mean numbers of alleles were 6.67, 4.58, and 4.92 in Facciuta della Valnerina, Camosciata delle Alpi, and Saanen, respectively. The expected heterozygosity ranged from 0.20 to 0.86. Most loci were highly polymorphic and informative (polymorphic information content ≥0.50). Factorial correspondence analysis and principal components analysis revealed very clear separation between Facciuta della Valnerina and the two reference goat breeds. Reducing the number of markers from 16 to 12 (on the basis of polymorphic information content and the number of alleles) still allowed us to distinguish the local population, indicating that microsatellite markers are capable of discriminating local livestock breeds at a low cost.

1. Introduction

Goat (Capra hircus) is one of the most widespread livestock species in the world, comprising about 218 million goat heads in 2017. Asia has the largest proportion of the world population (52%), followed by Africa (39%), Europe (5%), the Americas (4%), and Oceania (<1%) [1]. Compared to other species (i.e., cattle), goats show a higher adaptability to different climatic and environmental conditions, a milder character, and a better ability to use forages [2]. Goats provide valuable milk and meat products [3], and goat meat prices are lower compared to other ruminant species. In terms of nutritional value, goat meat is appreciated for low fat (both in terms of intramuscular fat and fat deposits) and high protein content [4]. Moreover, it is characterized by a marked and unique flavor, which makes goat meat suitable for a variety of gastronomic preparations [5].
The preservation of local breeds is necessary to limit the loss of genetic resources, in particular for the species that are more important for food production, rural development, and environmental protection [3]. Among the actions aimed at preserving biodiversity, promotion, and valorization of local breeds, food products can be particularly effective [6]. The association between product and breed might be a way to satisfy consumer demand for specialty products, which, in turn, may improve the economic sustainability of local breeds [7]. Italy has a large variety of local breeds and typical products derived from them. Many of these typical products have obtained EU Protected Designation of Origin (DOP) or Protected Geographical Indication (IGP) labels, and many others are recognized by trademarks [3] to preserve their uniqueness.
Following the EU regulation 1825/2000, a mandatory labeling system for beef, sheep, and goat products was implemented to protect public health and to guarantee food safety [8]. Accordingly, each cut of meat must show a label carrying an alphanumeric identification called a "batch number" that identifies an animal, or a group of animals, and the country where the animal was born, reared, slaughtered, and sectioned. However, as pointed out by several authors, this system does not fully prevent frauds and errors along the production chain [9,10]. Animal identification using DNA-based techniques could address this problem, since DNA is unalterable throughout animal life and is present in derived products [11,12]. DNA-based identification could be extremely useful for traceability. However, the cost of using DNA analysis is one of its major limitations, and research has been carried out to develop fast and low-cost tests by using a low number of DNA markers [13,14,15,16,17]. Microsatellite markers or simple tandem repeats (STR), available for all livestock species, are commonly used for many applications such as parentage analysis and breed assignment [18]. These molecular markers are highly polymorphic, codominant, easily scored, and therefore very suitable to study small populations [19,20].
The aims of the present study were to establish the genetic differences and to indicate which alleles and which loci best describe the differences between the local population “Facciuta della Valnerina” (FAC) goat and two cosmopolitan breeds, Saanen (SAA) and Camosciata delle Alpi (CAM), that are widespread in the same geographic area, with the ultimate aim of valorizing the local population and exploiting its products.

2. Materials and Methods

2.1. Animal Sampling

A total of 24 blood samples of FAC were collected from three randomly taken animals (both sexes) per each of eight different flocks, all reared in Valnerina and Perugia, Italy. The approximate estimate of the current census of this population is around 200 heads, distributed in the areas mentioned and reared together with other goat breeds. Photos and supplementary information about the population studied are furnished in Table S1. The Vacutainer system was employed, using tubes containing an EDTA solution as an anticoagulant. The samples were transported at room temperature to the lab and then stored at −20 °C until analyses were performed. The analyzed animals can be considered as a representative sample of the population of FAC goats, since they were chosen trying to avoid closely related individuals in different farms that never exchanged bucks. In addition, DNA samples of 10 SAA and 10 CAM individuals (provided by the Italian Goat Consortium; http://www.goatit.eu/) were included as out-groups representative of cosmopolitan breeds reared in Italy. No ethical approval was required, in compliance with the European Directive 2010/63/UE and the Italian Regulation D. Lgs n. 26/2014, because samples were taken during obligatory routine animal sanitary controls by an authorized veterinarian.

2.2. Molecular Analyses

The GenElute Blood Genomic DNA kit (Sigma Aldrich, St. Louis, MO, USA) was used to extract the genomic DNA. Sixteen microsatellite loci (Table 1) were selected according to the recommendations of FAO and the International Society for Animal Genetics (ISAG) for genotyping and parentage analyses in goat breeds [21]. The markers were selected based on their degree of polymorphism and their position in the goat genome. STR markers were grouped in multiplex PCR according to reaction conditions and expected fragment sizes as reported by [22]. PCR products were separated by electrophoresis, with an automatic sequencer (ABI PRISM 3130xl, Applied Biosystems, Foster City, CA) according to the manufacturer’s recommendations. Allele sizes were estimated by using the internal size standard GeneScan-400 HD ROX (Applied Biosystems, Foster City, CA). Genotypes were visualized and interpreted with GeneMapper software, version 5.0 (Applied Biosystems, Foster City, CA).

2.3. Statistical Analysis

Allele frequencies, mean number of alleles, polymorphic information content (PIC) for each STR locus, and the observed and expected heterozygosity in the three populations/breeds were calculated using the Microsatellite Toolkit software [23]. The HP-RARE version 1.0 software was used to calculate average allelic richness for each population/breed (Rt), allowing comparisons among different sample sizes [24]. A test for departure from the Hardy–Weinberg equilibrium (HWE) was performed using a Markov chain Monte Carlo method (20 batches, 5000 iterations per batch, and a dememorization number of 10,000) implemented in the GENEPOP version 4.0 software [25]. The levels of significance were adjusted using the false discovery rate (FDR) procedure [26]. Population subdivision was investigated by calculating the global multilocus FST value. The pairwise FST index between populations [27] was estimated using the Arlequin 3.5 software [28], and their associated 95% confidence intervals (IC95%) were calculated using the GDA software [29]. Factorial correspondence analysis (FCA) [30], carried out with GENETIX 4.05, was used to further investigate the differentiation of the breeds. To investigate the distinctiveness of each breed when adopting an approach without assumptions about HWE or linkage disequilibrium, discriminant analysis of principal components (DAPC) was carried out with the method implemented in the ADEGENET software package [31] within the statistical package R version 3.6.2 [32]. A multivariate DAPC analysis performs a preliminary data transformation step using principal component analysis (PCA) to create uncorrelated variables that summarize total variability (e.g., within and between groups). These variables are then used as input to discriminant analysis (DA), which aims to maximize between-group variability and achieve the best discrimination of individuals into predefined clusters. DAPC was conducted without a posteriori group assignments by inferring the most likely number of genetic clusters (K) using the find.clusters function of ADEGENET. This function utilizes K-means clustering to calculate a Bayesian information criterion (BIC) value for each potential value of K (the most likely K has the lowest BIC value) and delineates individual group assignments for DAPC.

3. Results and Discussion

3.1. Genetic Variation

The number of observed alleles (Na), together with the expected heterozygosity (HE) and observed heterozygosity (HO), PIC values, and Hardy–Weinberg equilibrium test for each locus are presented in Table 1. A total of 116 alleles were found for the sixteen microsatellites analyzed, ranging from 4 (ETH10 and MAF209) to 13 (HSC) alleles per locus. The mean number of alleles per locus over all breeds was 7.25. The expected heterozygosity varied from 0.86 at HSC to 0.20 at MAF209, and the average across all loci was 0.65, indicating a moderate genetic diversity across the three goat breeds. The mean PIC ranged from 0.18 to 0.80, with a mean value of 0.60. Due to its low PIC value, also observed in other Italian and foreign breeds [33,34,35,36], the MAF209 marker was excluded for further statistical analysis. The remaining 15 loci had PIC ≥ 0.50 and therefore were highly informative. Since significant deviation from the Hardy–Weinberg equilibrium was detected for the loci OarFCB11, CRSM60, and ILST19, they were excluded from further statistical analysis. The mean number of alleles per locus ranged from 4.58 for CAM to 6.67 for FAC (Table 2). After adopting the rarefaction methodology [24], the mean allelic richness ranged from 4.36 (CAM) to 5.17 (FAC) in a sample size of eight individuals. Lower allelic diversity was found in many local goat breeds [37,38,39,40], but higher MNA values were reported in both Italian [41,42,43] and foreign [20,44] breeds. FAC had higher observed heterozygosity compared to the cosmopolitan breeds, with HO of 0.68. Although lower than HE (0.74), this value of HO is similar to that reported for other Italian or foreign breeds [40,41,44]. Higher HE values were reported in other cases [20,37,38]. The presence of private alleles (i.e., alleles present in one breed and absent in the others) were observed in all three populations/breeds, but were about 5-fold more abundant in FAC (25 in FAC, 4 in CAM and 5 in SAA). Considering the allele distribution within the three breeds, it is possible to note the presence, both in CAM and SAA, of four alleles that are missing in FAC (Table 3); these differences can be used to trace monobreed products. The frequencies of the 25 private alleles of FAC ranged from 0.0217 to 0.7708. A similar number of private alleles (21) were reported in Sukuma goats [40], while lower numbers were reported in some Italian goat breeds such as Alpine and Girgentana [41,43]. Again, this number is affected by the factors mentioned above.

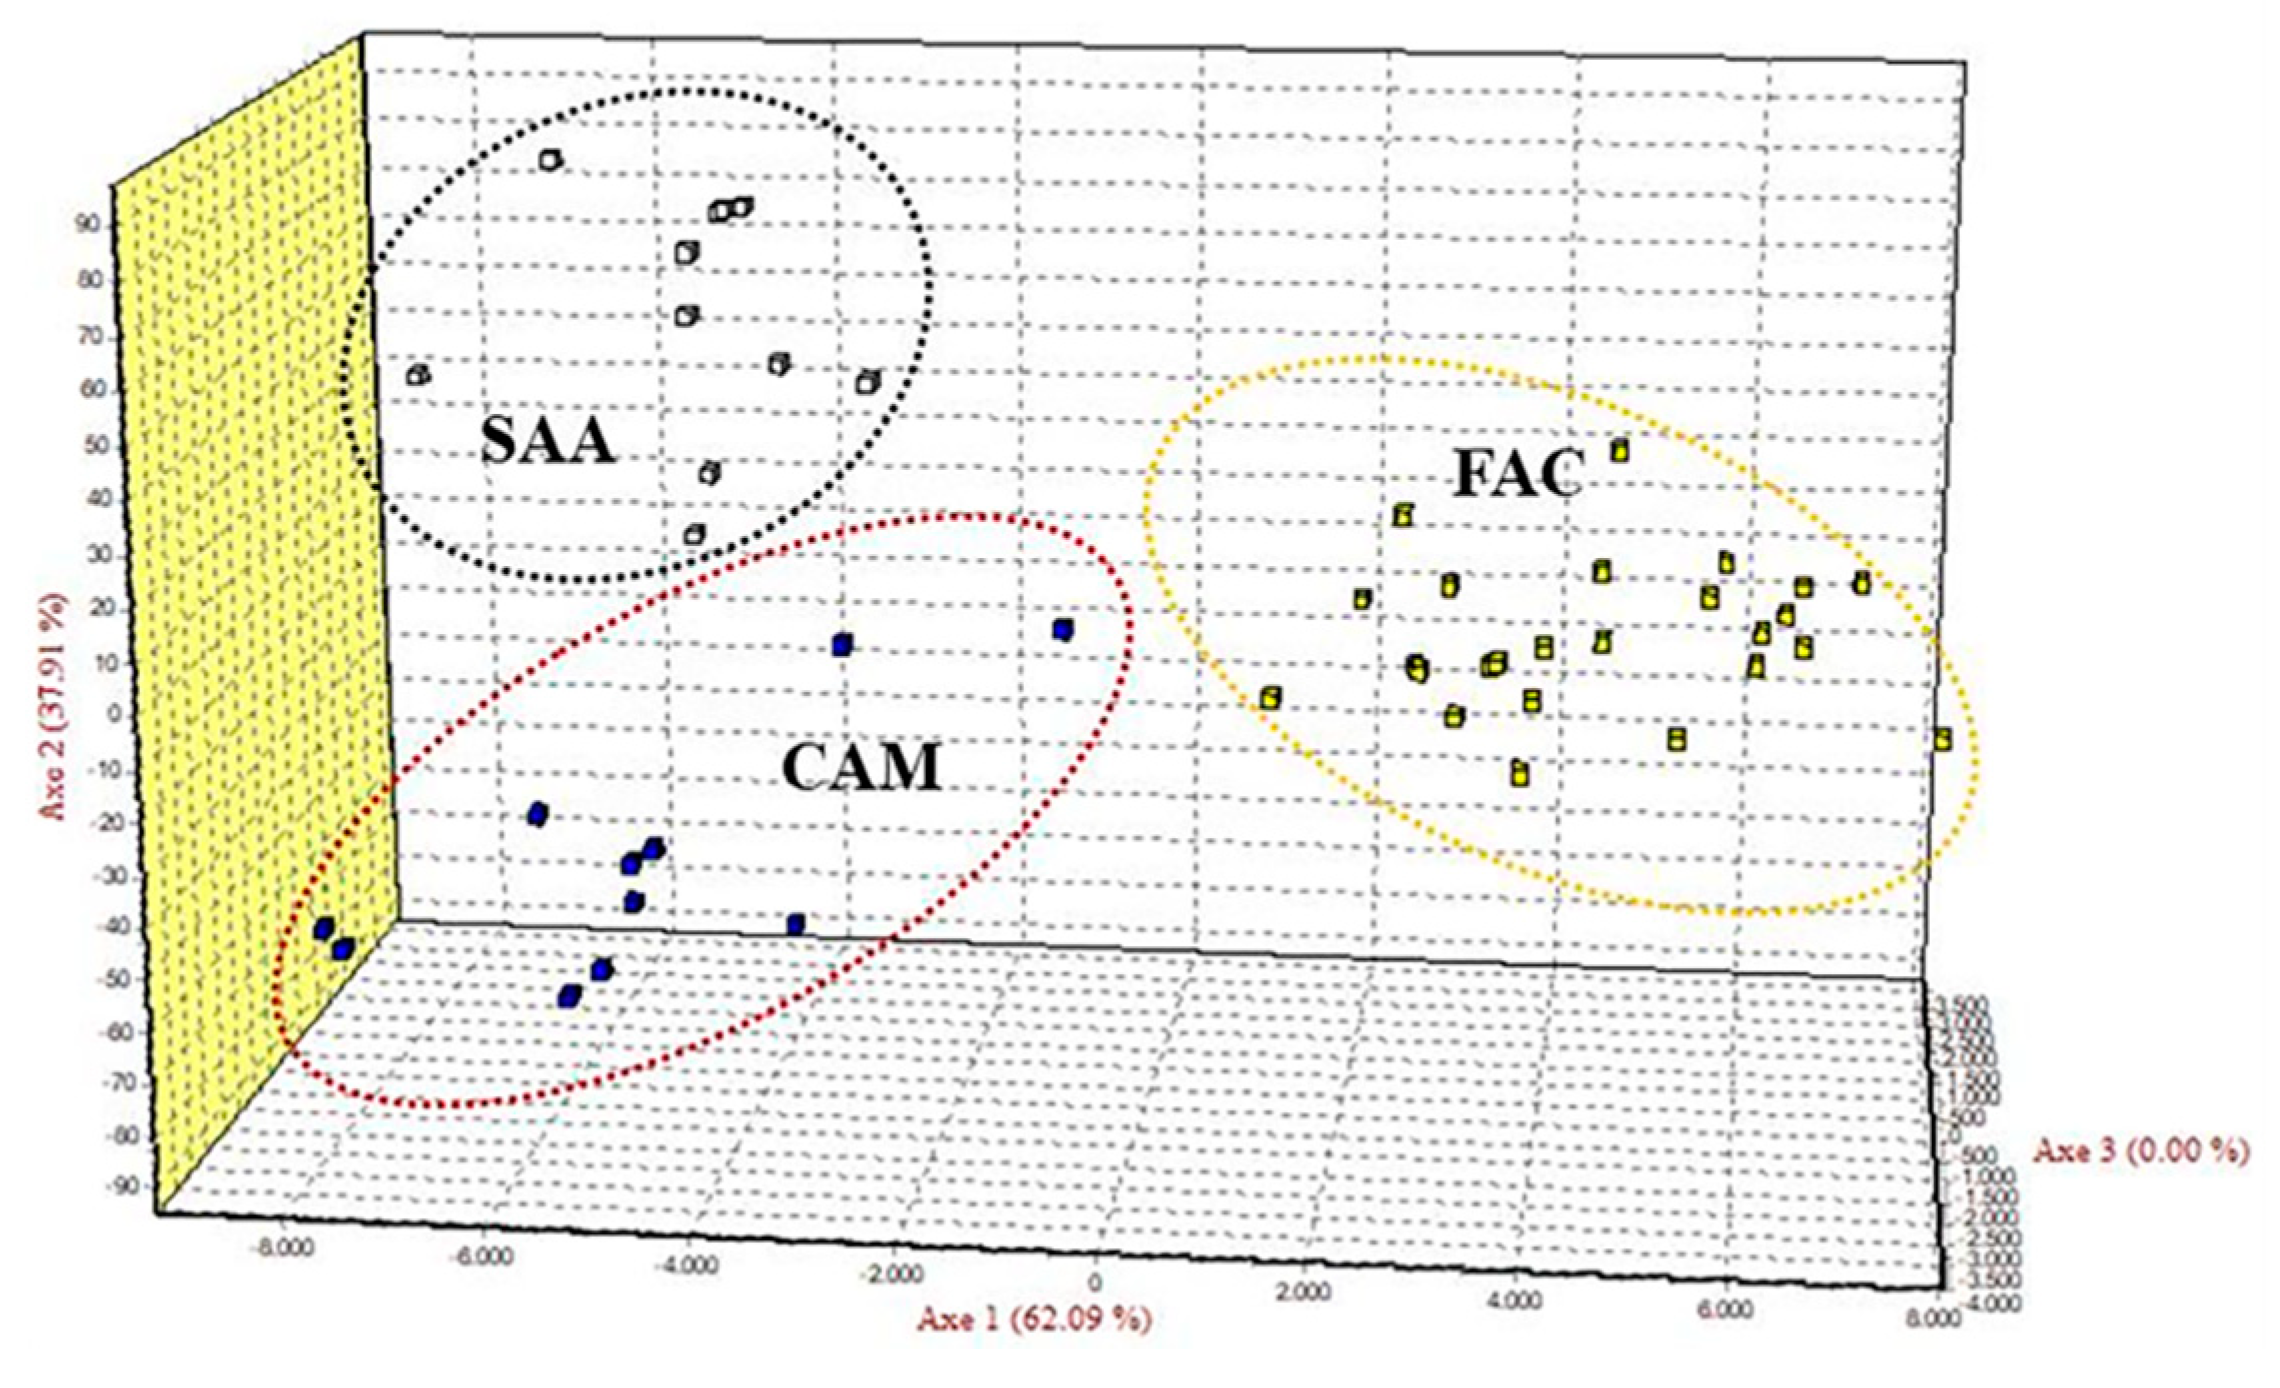
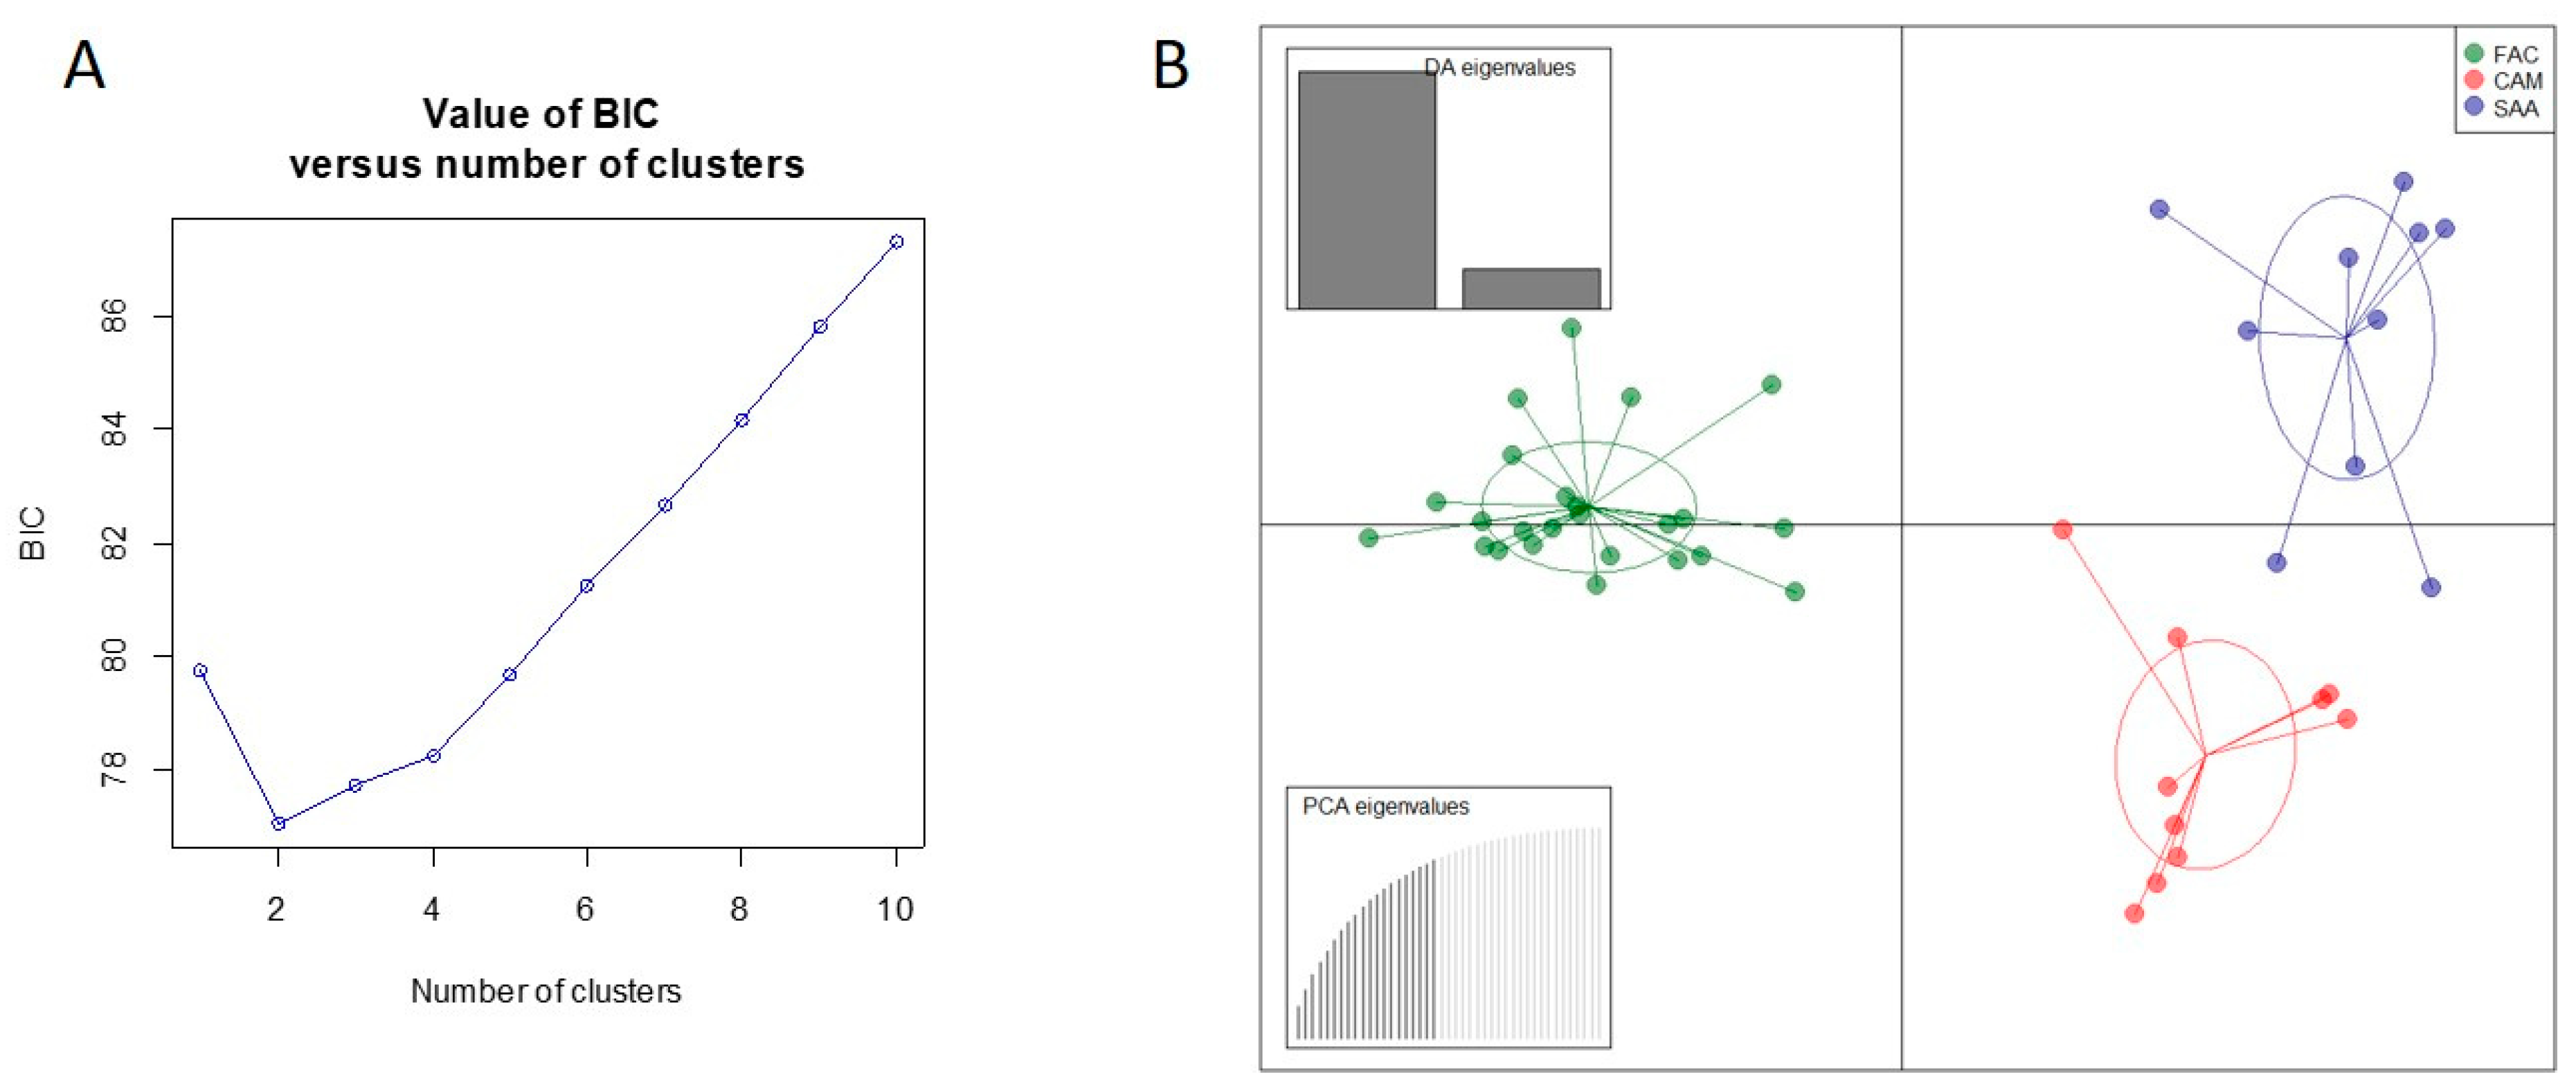
3.2. Genetic Differentiation

Pairwise genetic differentiation indexes (FST) were found significant (p < 0.001) for all the breeds (Table 4). In this study, the lowest (0.0729, IC95% 0.042–0.141) and the highest (0.0928, IC95% 0.060–0.109) pairwise FST values were detected between SAA and CAM and between FAC and SAA, respectively, with a mean of 0.084 (IC95% 0.061–0.113). Additionally, the FST value between FAC and CAM was high (0.0897, IC95% 0.038–0.131), indicating a clear-cut genetic differentiation between FAC and the cosmopolitan breeds. A previous study [21] reported similar mean FST value (0.085) in Small East African goats, while a lower mean FST value (0.07) was reported in eight Italian goat breeds [42]. The results of correspondence analysis further highlighted the genetic differentiation between the breeds (Figure 1) and sharply distinguished FAC individuals from those of the other breeds. A clear-cut differentiation between local goat breeds was shown by FCA analyses in other studies [20,42]. In the DAPC analysis, 25 principal components were retained as input for discriminant analysis, accounting for 84.5% of the total genetic variability. The Bayesian information criterion (BIC) statistic generated by discriminant analysis of principal components (DAPC) indicates that the optimal number of clusters in the data set is K = 2 (Figure 2A). On the scatterplot of the first two components of the DA (Figure 2B), FAC appeared distinct from both SAA and CAM. Hence, these results reinforce the evidence from the pairwise FST values and the factorial correspondence analysis, as observed in other studies [45,46].

4. Conclusions

The present study represents a first attempt to show the genetic distinctiveness of the local goat population of Facciuta della Valnerina in comparison to two cosmopolitan goat breeds (Saanen and Camosciata delle Alpi) using as little as 12 microsatellite markers. Four private alleles were detected for this local population, which can be used to trace monobreed products. Although the scope of this work was limited in terms of the number of populations/breeds and sample size, the results are sufficiently clear-cut to propose that these markers could be used for product traceability and market protection of products derived from Facciuta della Valnerina. The same methodology could be applied to other local goat breeds, with the objective of providing a molecular tool that could help to protect and valorize local genetic diversity in goats.

Supplementary Materials

The following are available online at https://www.mdpi.com/2076-2615/10/4/601/s1 Table S1: Description of the “Facciuta della Valnerina” population.

Author Contributions

Conceptualization and methodology, S.C., E.L.; data curation and formal analysis, S.C.; writing—original draft preparation, S.C., E.D., G.R., F.M.S., E.L.; writing—review and editing, E.L., S.C, G.R., E.A, F.M.S., F.V., D.R.; project supervision and administration, D.R.; funding acquisition, D.R., E.A., F.V. All authors have read and agreed to the published version of the manuscript.

Funding

This study was funded by Fondazione Cassa di Risparmio di Perugia (Project 2016.0024.021—Ricerca scientifica e tecnologica, P.I. Daniele Rosellini).

Acknowledgments

The authors want to thank Amparo Martínez Martínez and Vincenzo Landi (ABC Consulting, Cordoba, Spain) for their technical support in setting up the microsatellites panel used in this research. The authors want to also thank two anonymous referees for their valuable comments on the manuscript and their constructive suggestions.

Conflicts of Interest

The authors declare no conflict of interest.

References

  1. Miller, B.A.; Lu, C.D. Current status of global dairy goat production: An overview. Asian-Australas. J. Anim. Sci. 2019, 32, 1219–1232. [Google Scholar] [CrossRef] [PubMed]
  2. Aziz, M.A. Present status of the world goat populations and their productivity. Lohmann. Inf. 2010, 45, 42–52. [Google Scholar]
  3. Hersleth, M.; Næs, T.; Rødbotten, M.; Lind, V.; Monteleone, E. Lamb meat—Importance of origin and grazing system for Italian and Norwegian consumers. Meat Sci. 2012, 90, 899–907. [Google Scholar] [CrossRef]
  4. Global Plan of Action for Animal Genetic Resources and the Interlaken Declaration; FAO Document Repository: Rome, Italy, 2007.
  5. Webb, E.C.; Casey, N.H.; Simela, L. Goat meat quality. Small Rumin. 2005, 60, 153–166. [Google Scholar] [CrossRef]
  6. Montossi, F.; Font-i-Furnols, M.; Del Campo, M.; San Julián, R.; Brito, G.; Sanudo, C. Sustainable sheep production and consumer preference trends compatibilities, contradictions, and unresolved dilemmas. Meat Sci. 2013, 95, 772–789. [Google Scholar] [CrossRef] [PubMed]
  7. Di Stasio, L.; Piatti, P.; Fontanella, E.; Costa, S.; Bigi, D.; Lasagna, E.; Pauciullo, A. Lamb meat traceability: The case of Sambucana sheep. Small Rumin. Res. 2017, 149, 85–90. [Google Scholar] [CrossRef]
  8. Ciampolini, R.; Leveziel, H.; Mozzanti, E.; Grohs, C.; Cianci, D. Genomic identification of an individual or its tissue. Meat Sci. 2000, 54, 35–40. [Google Scholar] [CrossRef]
  9. Pizzuti, T.; Mirabelli, G.; Grasso, G.; Paldino, G. MESCO (MEat Supply Chain Ontology): An ontology for supporting traceability in the meat supply chain. Food Control 2017, 72, 123–133. [Google Scholar] [CrossRef]
  10. Biswas, A.K.; Mandal, P.K. Current perspectives of meat quality evaluation: Techniques, technologies, and challenges. Meat Qual. Anal. 2020, 3–17. [Google Scholar] [CrossRef]
  11. Orrú, L.; Napolitano, F.; Catillo, G.; Moioli, B. Meat molecular traceability: How to choose the best set of microsatellites? Meat Sci. 2006, 72, 312–317. [Google Scholar] [CrossRef]
  12. Jobling, M.A.; Gill, P. Encoded evidence: DNA in forensic analysis. Nat. Rev. Genet. 2004, 10, 739–751. [Google Scholar] [CrossRef] [PubMed]
  13. Dalvit, C.; De Marchi, M.; Cassandro, M. Genetic traceability of livestock products: A review. Meat Sci. 2007, 77, 437–449. [Google Scholar] [CrossRef] [PubMed]
  14. Negrini, R.; Nicoloso, L.; Crepaldi, P.; Milanesi, E.; Marino, R.; Perini, D.; Pariset, L.; Dunner, S.; Leveziel, H.; Williams, J.L.; et al. Traceability of four European protected geographic indication (PGI) beef products using single nucleotide polymorphisms (SNP) and Bayesian statistics. Meat Sci. 2008, 80, 1212–1217. [Google Scholar] [CrossRef] [PubMed]
  15. Martins-Lopes, P.; Gomes, S.; Pereira, L.; Guedes-Pinto, H. Molecular markers for food traceability. Food Technol. Biotechnol. 2013, 51, 198–207. [Google Scholar]
  16. Zhao, J.; Zhu, C.; Xu, Z.; Jiang, X.; Yang, S.; Chen, A. Microsatellite markers for animal identification and meat traceability of six beef cattle breeds in the Chinese market. Food Control 2017, 78, 469–475. [Google Scholar] [CrossRef]
  17. Dalvit, C.; De Marchi, M.; Targhetta, C.; Gervaso, M.; Cassandro, M. Genetic traceability of meat using microsatellite markers. Food Res. Int. 2008, 41, 301–307. [Google Scholar] [CrossRef]
  18. Cao, J.; Li, X.; Du, X.; Zhao, S. Microsatellite based genetic diversity and population structure of nine indigenous Chinese domestic goats. Small Rumin. Res. 2017, 148, 80–86. [Google Scholar] [CrossRef]
  19. Selepe, M.M.; Ceccobelli, S.; Lasagna, E.; Kunene, N.W. Genetic structure of South African Nguni (Zulu) sheep populations reveals admixture with exotic breeds. PLoS ONE 2018, 13, e0196276. [Google Scholar] [CrossRef] [Green Version]
  20. Tefiel, H.; Ata, N.; Chabbar, M.; Benyarou, M.; Fantazi, K.; Yilmaz, O.; Cemal, I.; Karaca, O.; Boudouma, D.; Gaouar, S.B.S. Genetic characterization of four Algerian goat breeds assessed by microsatellite markers. Small Rumin. Res. 2018, 160, 65–71. [Google Scholar] [CrossRef]
  21. Secondary Guidelines for Development of National Farm Animal Genetic Resources Management Plans. Measurements of Domestic Animal Diversity (MoDAD): Recommended Microsatellite Markers; FAO/ISAG Document: Rome, Italy, 2004.
  22. Murital, I.; Afolayan, O.; Bemji, M.N.; Dadi, O.; Landi, V.; Martínez, A.; Delgado, J.V.; Aina, A.B.J.; Adebambo, A.O. Genetic diversity and population structure of Nigerian indigenous goat using DNA microsatellite markers. Archivos de zootecnia 2015, 64, 93–98. [Google Scholar] [CrossRef] [Green Version]
  23. Park, S.D.E. Trypanotolerance in West African Cattle and the Population Genetic Effects of Selection. Ph.D. Thesis, Dublin University, Dublin, Ireland, 2001. [Google Scholar]
  24. Kalinowski, S.T. HP-RARE 1.0: A computer program for performing rarefaction on measures of allelic richness. Mol. Ecol. Notes 2005, 5, 187–189. [Google Scholar] [CrossRef]
  25. Rousset, F. GENEPOP’007: A complete re-implementation of the GENEPOP software for Windows and Linux. Mol. Ecol. Resour. 2008, 8, 103–106. [Google Scholar] [CrossRef]
  26. Benjamini, Y.; Hochberg, Y. Controlling the false discovery rate: A practical and powerful approach to multiple testing. J. R. Stat. Soc. Ser. B Methodol. 1995, 57, 289–300. [Google Scholar] [CrossRef]
  27. Weir, B.S.; Cockerham, C.C. Estimating F-statistics for the analysis of population structure. Evolution 1984, 38, 1358–1370. [Google Scholar]
  28. Excoffier, L.; Lischer, H.E. Arlequin suite ver 3.5: A new series of programs to perform population genetic analyses under Linux and Windows. Mol. Ecol. Resour. 2010, 10, 564–567. [Google Scholar] [CrossRef] [PubMed]
  29. Lewis, P.O.; Zaykin, D. Genetic data analysis. In Computer Program for the Analysis of Allelic Data; Version 1.0.; Lewis Labs, Univ of Connecticut: Storrs, CT, USA, 1999. [Google Scholar]
  30. Benzécri, J.P. L’analyse des données Volume II. L’analyse des correspondances; Dunod: Paris, France, 1973. [Google Scholar]
  31. Jombart, T. Adegenet: A R package for the multivariate analysis of genetic markers. Bioinformatics 2008, 24, 1403–1405. [Google Scholar] [CrossRef] [PubMed] [Green Version]
  32. R Core Team. R: A Language and Environment for Statistical Computing; R Foundation for Statistical Computing; R Core Team: Vienna, Austria, 2017. [Google Scholar]
  33. Criscione, A.; Marletta, D.; Ådnøy, T.; Bordonaro, S.; Guastella, A.M.; Lien, S.; D’Urso, G. Characterization of biodiversity in six goat breeds reared in Southern Italy by means of microsatellite and SNP markers. Ital. J. Anim. 2007, 6 (Suppl. 1), 95–97. [Google Scholar] [CrossRef]
  34. Bruno-de-Sousa, C.; Martinez, A.M.; Ginja, C.L.; Santos-Silva, F.; Carolino, M.I.; Delgado, J.V.; Gama, L.T. Genetic diversity and population structure in Potuguese goat breeds. Livest. Sci. 2011, 135, 131–139. [Google Scholar] [CrossRef]
  35. Hoda, A. Genetic diversity of the Capore goat in Albania based on 30 microsatellite markers. Maced. J. Anim. Sci. 2011, 1, 53–56. [Google Scholar]
  36. Aljumaah, R.S.; Musthafa, M.M.; Al-Shaikh, M.A.; Badri, O.M.; Hussein, M.F. Genetic diversity of Ardi goat based on microsatellite analysis. Afr. J. Biotechnol. 2012, 11, 16539–16545. [Google Scholar]
  37. Asroush, F.; Mirhoseini, S.Z.; Badbarin, N.; Seidavi, A.; Tufarelli, V.; Laudadio, V.; Dario, C.; Selvaggi, M. Genetic characterization of Markhoz goat breed using microsatellite markers. Arch. Anim. Breed. 2018, 61, 469–473. [Google Scholar] [CrossRef]
  38. Guang-Xin, E.; Hong, Q.; Zhao, Y.; Ma, Y.; Chu, M.; Zhu, L.; Huang, Y. Genetic diversity estimation of Yunnan indigenous goat breeds using microsatellite markers. Ecol. Evol. 2019, 9, 5916–5924. [Google Scholar]
  39. Hussain, T.; Shaheen, M.; Barbar, M.; Musthafa, M.; Nadeem, A.; Nawaz, A.; Javed, M.; Marikar, F. Molecular diversity analysis of Jattal and Dera Din Panah goat breeds of Pakistan using microsatellite markers. J. Hell. Vet. Med. Soc. 2018, 69, 791–796. [Google Scholar] [CrossRef] [Green Version]
  40. Nguluma, A.S.; Huang, Y.; Zhao, Y.; Chen, L.; Msalya, G.; Lyimo, C.; Guangxin, E.; Chenyambuga, S.W. Assessment of genetic variation among four populations of Small East African goats using microsatellite markers. S. Afr. J. Anim. Sci. 2018, 48, 117–127. [Google Scholar] [CrossRef] [Green Version]
  41. Iamartino, D.; Bruzzone, A.; Lanza, A.; Blasi, M.; Pilla, F. Genetic diversity of Southern Italian goat populations assessed by microsatellite markers. Small Rumin. Res. 2005, 57, 249–255. [Google Scholar] [CrossRef]
  42. Negrini, R.; D’Andrea, M.; Crepaldi, P.; Colli, L.; Nicoloso, L.; Guastella, A.M.; Sechi, T.; Bordonaro, S.; Ajmone-Marsan, P.; Pilla, F. Econogene Consortium. Effect of microsatellite outliers on the genetic structure of eight Italian goat breeds. Small Rumin. Res. 2012, 103, 99–107. [Google Scholar] [CrossRef]
  43. Sardina, M.T.; Tortorici, L.; Mastrangelo, S.; Di Gerlando, R.; Tolone, M.; Portolano, B. Application of microsatellite markers as potential tools for traceability of Girgentana goat breed dairy products. Food Res. Int. 2015, 74, 115–122. [Google Scholar] [CrossRef] [Green Version]
  44. Ojo, O.A.; Akpa, G.N.; Orunmuyi, M.; Adeyinka, I.A.; Kabir, M.; Alphonsus, C. Genetic analysis of Nigerian indigenous goat populations using microsatellite markers. Iran. J. Appl. Anim. Sci. 2018, 8, 287–294. [Google Scholar]
  45. Takahashi, H.; Nyamsamba, D.; Mandakh, B.; Zagdsuren, Y.; Amano, T.; Nomura, K.; Yokohama, M.; Ito, S.; Minezawa, M. Genetic structure of Mongolian goat populations using microsatellite loci analysis. Asian-Australas. J. Anim. Sci. 2008, 21, 947–953. [Google Scholar] [CrossRef]
  46. Oliveira, J.D.; Igarashi, M.L.S.P.; Machado, T.M.M.; Miretti, M.M.; Ferro, J.A.; Contel, E.P.B. Structure and genetic relationships between Brazilian naturalized and exotic purebreed goat domestic goat (Capra hircus) breeds based on microsatellites. Genet. Mol. Biol. 2007, 30, 356–363. [Google Scholar] [CrossRef]
Figure 1. Factorial correspondence analysis of the three goat populations/breeds studied with 12 markers. FAC, Facciuta della Valnerina; CAM, Camosciata delle Alpi; SAA, Saanen.
Animals 10 00601 g001
Figure 2. Results of discriminant analysis of principal components (DAPC). (A) Bayesian information criterion (BIC) values plotted for the number of clusters ranging from K = 1 to 10. (B) Scatterplot of the first two principal components of DAPC using populations as an a posteriori cluster. The individuals are assigned to populations a posteriori, that is, after automated determination of the number of clusters, instead of forcing them into known populations. Populations are labeled inside their 95% inertia ellipses, and dots represent individuals. The inset above indicates the eigenvalues of the first two principal components. The inset below represents the total variance explained by the principal components. FAC, Facciuta della Valnerina; CAM, Camosciata delle Alpi; SAA, Saanen.
Animals 10 00601 g002
Table 1. Characteristics of the SSR markers used for this study, relative to all 44 heads: chromosome position (Chr), size range (S.R.), number of alleles (Na), expected heterozygosity (HE) and observed heterozygosity (HO), mean polymorphic information content (PIC), number of breeds deviating from the Hardy–Weinberg equilibrium (HWE Breed). The markers excluded from further analysis on the bases of PIC values and/or deviation from HWE are shown in grey.
LocusChr.S.R. (bp)NaHEHOPICHWE Breed †
INRA00510176–19050.590.540.510
BM812517110–13090.710.630.631
CSRD24714220–24780.650.570.591
HAUT2726128–15870.770.820.710
TGLA12221137–18180.750.780.680
HSC20267–301130.860.780.800
MCM5275165–18770.650.720.600
SRCRSP8Not reported215–25590.520.560.500
BM13296155–20060.660.500.581
OarFCB112122–14070.750.710.702
MAF20917100–10440.200.190.182
MAF6515116–158100.750.520.681
CRSM60Not reported75–9160.720.430.663
ETH105212–22440.460.440.500
ILSTS019Not reported142–16260.780.780.722
SRCRSP521156–17870.640.760.570
Total (±SD) 116 ± 2.290.65 ± 0.160.61 ± 0.170.60 ± 0.15
†: After Benjamini and Hochberg (1995) correction.
Table 2. Sample size of each population/breed (N), mean number of alleles (MNA), allelic richness per population/breed (Rt), number of private alleles (PA), and mean observed (HO) and expected heterozygosity (HE).
Population/BreedNMNA ± SDRt (1)PAHO ± SDHE ± SD
FAC246.67 ± 2.105.17250.68 ± 0.030.74 ± 0.03
CAM104.58 ± 1.624.3640.59 ± 0.050.63 ± 0.06
SAA104.92 ± 1.384.5650.64 ± 0.040.64 ± 0.04
(1) Based on eight individuals. FAC, Facciuta della Valnerina; CAM, Camosciata delle Alpi; SAA, Saanen.
Table 3. Private alleles (frequencies in brackets) found in the three goat populations/breeds. Alleles in bold are present in CAM and SAA and absent in FAC.
LocusPopulation/Breed
FACCAMSAA
INRA5 113 (0.1000)
BM8125109 (0.0217)123 (0.0500)119 (0.0500)
121 (0.0217)
127 (0.0217)
CSRD247216 (0.1304)228 (0.3125)228 (0.1111)
232 (0.2174)234 (0.1875)242 (0.1250)
HAUT27 145 (0.0500)145 (0.1000)
TGLA122147 (0.0455)133 (0.1000)
HSC268 (0.0217) 266 (0.0500)
276 (0.0435)270 (0.0500)270 (0.2000)
278 (0.0435)
296 (0.0217)
MCM527160 (0.1304)
SRCRSP8218 (0.0217) 224 (0.0500)
230 (0.0217) 242 (0.1000)
238 (0.0435)
BM1329174 (0.1087)
180 (0.0870)
MAF65117 (0.0870)
119 (0.0435)
125 (0.1957)
127 (0.0435)
129 (0.2391)
MAF209105 (0.7708)101 (0.0500)101 (0.0500)
107 (0.1042)
SRCRSP5161 (0.1250)
179 (0.0313)
FAC, Facciuta della Valnerina; CAM, Camosciata delle Alpi; SAA, Saanen.
Table 4. Pairwise and global FST distance (with confidence intervals at 95%—IC95%) between the three goat populations/breeds studied with 12 markers.
Population/breedNFACCAMSAA
FAC240.0000
CAM100.0897 (0.038–0.131)0.0000
SAA100.0928 (0.060–0.109)0.0729 (0.042–0.141)0.0000
Global FST = 0.084 (0.061–0.113)
FAC, Facciuta della Valnerina; CAM, Camosciata delle Alpi; SAA, Saanen; N, sample size of each population/breed.

