Article

Influence of Age and Immunostimulation on the Level of Toll-Like Receptor Gene (TLR3, 4, and 7) Expression in Foals

1
Department of Genetics, Animal Breeding and Ethology, Faculty of Animal Sciences, University of Agriculture in Krakow, al. 29 Listopada 46, 31-425 Kraków, Poland
2
Department of Animal Molecular Biology, National Research Institute of Animal Production, Krakowska 1, 32-083 Balice, Poland
3
Institute of Veterinary Science, University Centre of Veterinary Medicine UJ-UR, University of Agriculture in Krakow, al. Mickiewicza 24/28, 30-059 Kraków, Poland
4
Laboratory of Reproductive Immunology, Hirszfeld Institute of Immunology and Experimental Therapy, Polish Academy of Sciences, Weigla 12 Street, 53-114 Wroclaw, Poland
5
Department of Immunology, Pathophysiology and Veterinary Preventive Medicine, Division of Immunology and Veterinary Preventive Medicine, Faculty of Veterinary Medicine, Wroclaw University of Environmental and Life Sciences, Norwida 31 Street, 50-375 Wroclaw, Poland
*
Author to whom correspondence should be addressed.
Animals 2020, 10(11), 1966; https://doi.org/10.3390/ani10111966
Submission received: 19 August 2020 / Revised: 17 October 2020 / Accepted: 20 October 2020 / Published: 26 October 2020
(This article belongs to the Special Issue Genetics of Animal Health and Disease in Livestock)

Abstract

:

Simple Summary

Detailed knowledge of the molecular mechanisms of immunoglobulin synthesis appears necessary for a better understanding of foal immunity maturity and its influencing factors. At the same time, it encourages studies regarding the influence of the signaling cascade’s proteins on the primary immunological response, which provides an opportunity to develop extremely precise methods of regulating acquired immunity. The results revealed that the expression of theTLR3 and TLR4 genes, as well as the levels of immunoglobulins and interleukins, can be modulated by stimulation with the pharmacological agent, and that the expression of the TLR3 and TLR4genes in peripheral blood cells is dependent on age.

Abstract

The aim of this study was to investigate the molecular mechanisms leading to the identification of pathogens by congenital immune receptors in foals up to 60 days of age. The study was conducted on 16 foal Polish Pony Horses (Polish Konik) divided into two study groups: control (n = 9) and experimental (n = 7). Foals from the experimental group received an intramuscular duplicate injection of 5 mL of Biotropina (Biowet) at 35 and 40 days of age. The RNA isolated from venous blood was used to evaluate the expression of theTLR3, TLR4, and TLR7 genes using RT-PCR. The results of the experiment demonstrated a statistically significant increase in the level of TLR3 gene expression and a decrease in the level ofTLR4 gene expression with foal aging. The level of TLR7 gene expression did not show age dependence. Immunostimulation with Biotropina had a significant impact on the level of the genes’ expression for Toll-like receptors. It increased the level of TLR4 expression and decreased TLR3 expression. Thus, it was concluded that the expression of theTLR3 and TLR4genes in peripheral blood cells is dependent on age. This experiment demonstrated a strong negative correlation between TLR3 and TLR4 gene expression.

1. Introduction

Immune response differs in newborn and adult horses. Despite involving similar components, the regulation of immunity and the response to antigens vary. Foals are born with small, non-protective amounts of endogenous serum immunoglobulins (i.e., IgM and IgG) [1]. Immunoglobulin transport is limited due to the structure of the horse placenta (placenta spuria). That is why the suckling of colostrum is essential in the first hours of a foal’s life. Immunological outcomes in newborn foals differ as compared to adults and are distinguished by modified cytokine profiles, as well as reduced antibody and T-cell responses [2]. Moreover, foals have a very low level of immunoglobulins in their blood plasma. An innate immune system composed of pre-existing or rapidly induced defenses is critical for newborn foals, while an antigen-specific response requires exposure to pathogens and time for development after birth [3]. The effectiveness of the immunological reaction is controlled by a complexity of direct and indirect mechanisms involving interactions among various cells and cytokine-induced actions. Many different immune cells are involved in maintaining a balanced immune response [4]. Receptors called pathogen recognition receptors (PRRs) represent very important elements found in immune cells. Thanks to their conservative structure, these receptors can recognize signals associated with a variety of pathogens. Pathogen-associated molecular patterns (PAMPs), PRR ligands, are molecules specific to viruses, bacteria, and other microorganisms with evolutionarily conserved structures [5]. Toll-like receptors (TLRs) are the most closely investigated PRRs and are one of the most essential components of immune responses [6,7]. Toll-like receptors play a key role in activating and stimulating innate as well as acquired immunity [8]. Identification of the threat and activation of TLRs triggers an immune response, leading to the elimination of this threat from the organism, which involves two basic reactions, namely, inflammatory, and antiviral. Cells with activated receptors release large amounts of proinflammatory cytokines, chemokines, and defensins, and these released factors initiate the migration and aggregation of immune cells (e.g., leukocytes, macrophages, mast cells, and dendritic cells) at the site of the pathogen invasion [7]. Activated TLRs present on the surface of macrophages lead to increased synthesis of the proinflammatory cytokines IL-1, -6, -8, -12, and TNF-α. In addition, complexes of ligands and TLR4 receptors increase the phagocytic activity of macrophages and stimulate the production of reactive oxygen species (ROIs) and the synthesis of nitric oxide (NO). TLR-activated macrophages enhance the expression of major histocompatibility complexes I and II (MHCI and MHCII), CD80, CD86, and co-stimulators that make immune cells more efficient in displaying T-cell antigens that induce specific immune responses [9,10].
Approximately 20% of foals die before the end of the second month, which brings significant economic and breeding losses [11,12]. This justifies undertaking research into new and novel techniques for stimulation of the immune system. Gaining insight into the behavior of TLRs seems to be necessary for expanding our understanding of the mechanism responsible for the development of foal resistance/immunity, and the identification of determinants for further building it up. In addition, it is also an important element contributing to finding innovative solutions in the fight against infections and new ways to improve the prevention and treatment of infections in animals. The paradox of neonatal vaccination is the need of immediate protection during early days, the perceived limitations of the immune system of neonate foals, and the theory of maternal antibody interference [13]. Studies have shown that the immune system of neonatal foals is also naive and immature relative to juvenile and adult horses [14,15,16,17]. Several studies have suggested that basal TLR expression in full-term neonatal blood monocytes is similar to that of adults [18,19]. The TLR-mediated production of cytokines by neonatal monocytes, however, is very different in newborns compared to that of adults [19]. Thus far, little is known about the development of the horse immune system during pre- and postnatal periods, which negatively affects the ability to devise strategies for maintaining and improving foal health. Based on its biological properties, as well as the influence of Toll-like receptors on the immune response traits of farm animals and humans, we hypothesized that gene expression for Toll-like receptors TLR-3, TLR-4, and TLR-7 in foals is dependent on factors such as age and immunostimulation. The aim of this work was to investigate the molecular mechanisms leading to the identification of pathogens by congenital immune receptors in foals up to 60 days of age, including the verification of the hypothesis concerning age-related expression of theTLR3, TLR4, and TLR7 genes.

2. Materials and Methods

This experiment was granted permission from the Local Ethics Committee in Kraków (no 37, 30 May 2016).

2.1. Animals and Feeding

Studies were carried out on 16 foals representing Polish Pony horses (Polish Konik). This primitive horse breed is genetically and phenotypically closely related to its wild ancestor, the Tarpan Horse (Eurasian wild horse) [20].
All foals with mares were kept in the same stable in individual boxes (size 2.15 × 3.50 m) on permanent straw bedding at the Experimental Station of the University of Agriculture in Krakow. All animals were clinically healthy throughout the experimental period. Mares of 5–17 years of age and 270–340 kg live body weight were not vaccinated during pregnancy. Foal birth weight was 27–35 kg, and weight loss on the first day of life was <1.5%. The horses had all been used by university students in the teaching program. No horses were used for equestrian purposes. Inclusion criteria consisted of foals born from healthy mares with no placentitis, a normal gestational period, an uneventful birth, and normal physical and neurological examination findings. The foals had to successfully stand and nurse within 2 h of birth and remain clinically healthy during the study period.
Mares were fed ad libitum with hay (Lolium 40% and Trifolium L. 20%) with the addition of oats in the amount of 1.5 kg/mare/day [21]. Foals were fed only with colostrum and mother’s milk ad libitum, without additional supplementation. Water was offered from automatic water drinkers (flow ~ 10 L/min).

2.2. Experimental Design

Two weeks before delivery, birth alarms (Abfohlsystem, Jan Wolters, Steinfeld, Germany) were placed in the labia, and mares were moved to box stalls inside a stable lit with natural light (Figure S1). During the experiment, foals were kept with their mothers in individual boxes, and when leaving the stalls with their mothers for the pasture, they were randomly assigned into the following groups:
  • The control group (Group C) (n = 9)—foals without any pharmacological and feed additives that may influence immune system;
  • The experimental group (Group E) (n = 7)—foals that were administered an immunostimulating agent.
For the immunostimulation, a commercially available immunostimulator was used in the present study, namely, Biotropine (Biowet Drwalew S.A., Drwalew, Poland), which consists of a mixture of inactivated Gram-positive bacteria, e.g., Staphylococcus aureus (74 mg/mL), Streptococcus zooepidermicus (24.6 mg/mL), Streptococcus equi (24.6 mg/mL), Streptococcus equisimilis (24.6 mg/mL), Streptococcus agalactiae (24.6 mg/mL), Streptococcus dysgalactiae (24.6 mg/mL), Erysipelothrix insidiosa (49 mg/mL),and Gram-negative bacteria, e.g., Escherichia coli (123 mg/mL) and Pasteurella multocida (123 mg/mL) as well as pork spleen extract (10 mg/mL). On days 35 and 40 after birth, the foals from the experimental group received an intramuscular (m. pectoralis descendens) injection of 5 mL of Biotropine.

2.3. Blood Sampling and Blood Analysis

Blood samples were collected from foals by jugular venipuncture. Blood samples were obtained from foals up until 60 days of age according to the following scheme: After birth before the first suckling and then on the 1st, 3rd, 5th, 10th, 20th, 30th, 40th, 50th, and 60th days of age. Three milliliters of blood were collected into TEMPUS tubes (Applied Biosystems, Foster City, CA, USA) with RNA stabilizing factor. Samples were stored at −20 °C until further processing. Isolation of RNA was carried out using TEMPUS SPIN (Ambion, Waltham, MA, USA) according to the manufacturer’s protocol (Supplementary File 1). One microgram of RNA was transcribed into cDNA using a High-Capacity cDNA Reverse Transcription Kit (Applied Biosystems, Foster City, CA, USA) according to the manufacturer’s protocol.
A “No-RT” (non-reverse transcriptase) control was used for selected RNA samples to analyzed contamination in samples.
Gene expression analyses (Table S2 presents the reaction efficiency of each gene) were performed on an Illumina Eco system (Illumina, San Diego, CA, USA, Country)using TaqMan®MGB (Applied Biosystems, Foster City, CA, USA) probes (Table 1). Every sample was analyzed in triplicate in a final volume of 10 µL (Table S1). Amplification was performed according to the following protocol: polymerase activation at 95 °C (2 min) and 40 cycles at 95 °C for 15 s and 60 °C for 1 min. The SDHA and HPRT genes were used as housekeeping genes (Table 1).
In addition, an analysis of the blood morphotic parameters was performed (Supplementary File 1).

2.4. Statistical Analysis

Data are presented as means ± standard error. The data were analyzed using SAS 9.4 software (SAS Institute Inc., Cary, NC, USA). The Shapiro–Wilk test was considered the best test to check the normality of the distribution of random variables. Because the data did not have a normal distribution, the Kruskal–Wallis test was used with immunostimulation and age as the effects. The degree of association between the parameters was examined using a non-parametric Spearman’s rank correlation coefficient. Values ranging from 0.0 to 0.5, from 0.5 to 1.0, from −0.5 to 0.0, and from −1.0 to −0.5 indicate weak positive, strong positive, weak negative, and strong negative correlations, respectively.

3. Results

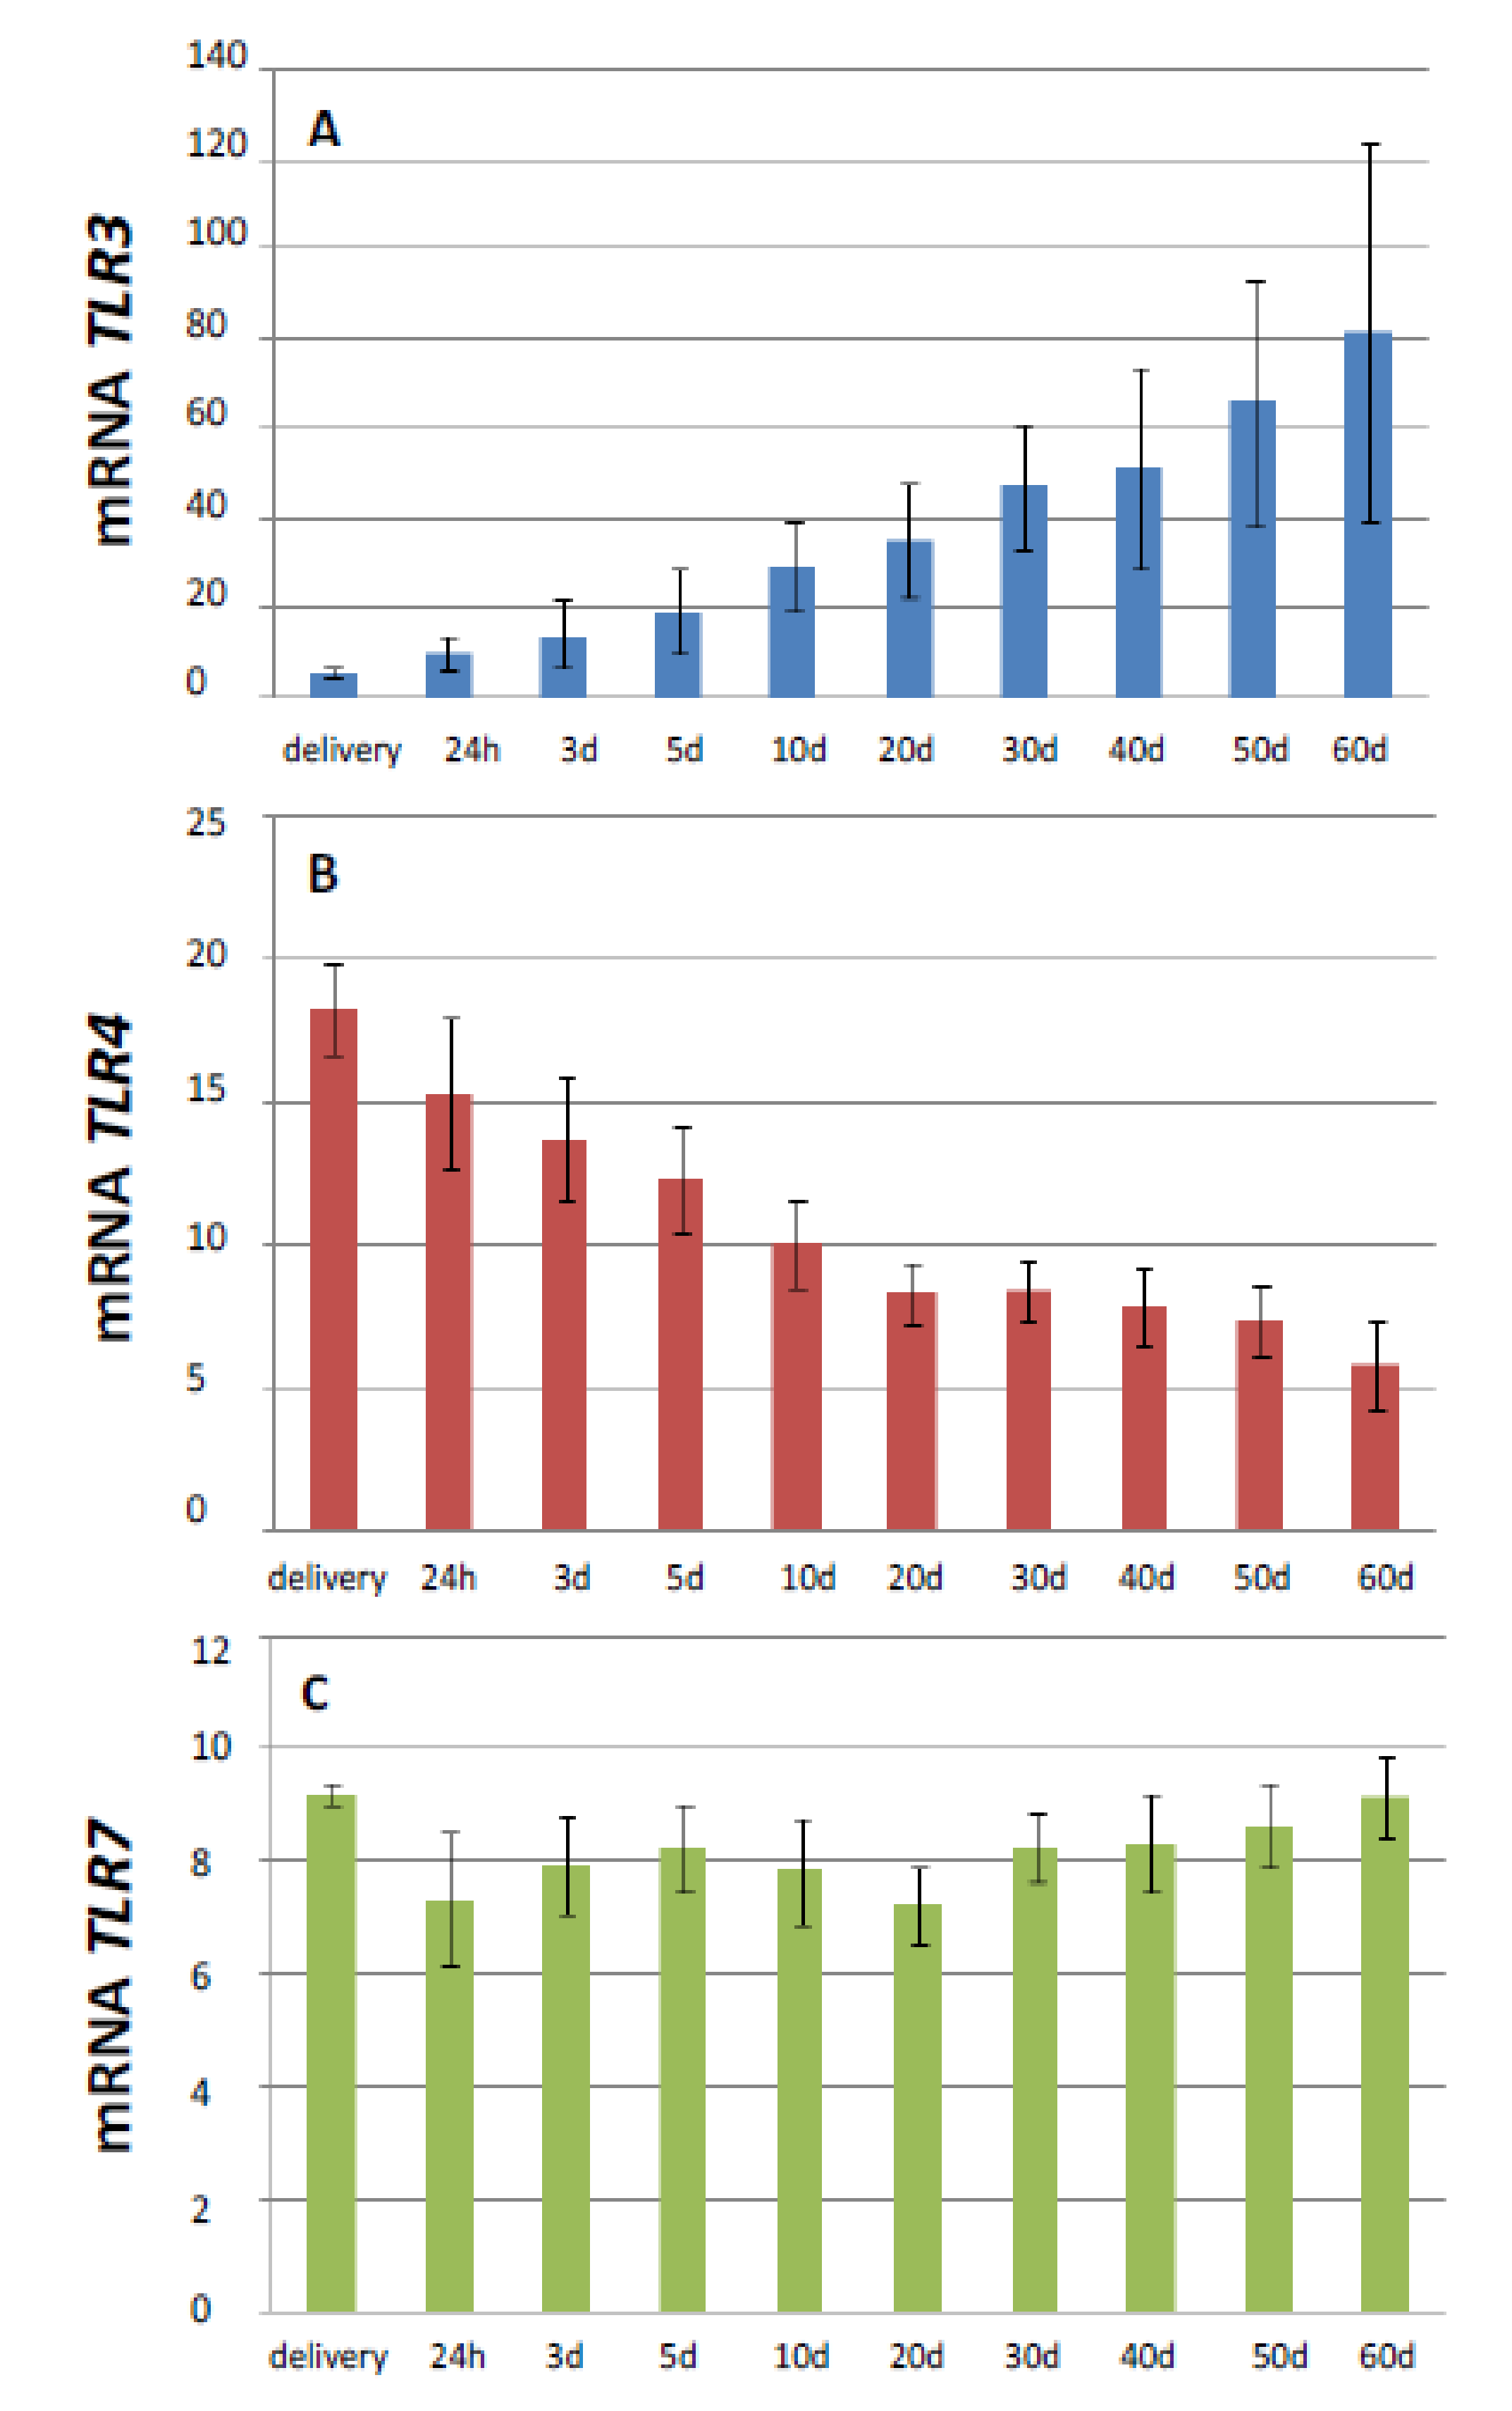
3.1. Influence of Age on the Expression of TLR3, 4, and 7 mRNA

The lowest expression of TLR3 was observed during delivery (6.20 ± 0.89) (Figure 1—data presented from control group). After delivery, the level of TLR3 mRNA increased. In the period between delivery and 60 days of age, the level of TLR3 expression increased by 94.34%. We found a highly statistically significant difference between the age and expression of TLR3 mRNA (p > 0.01), as presented in Table 2. From the 5th day of age, we found statistical differences between samples, with the highest expression level on the 60th day after delivery.
The highest level of TLR4 mRNA expression was observed during the delivery (18.3 ± 2.6) of newborn foals. From the day of the delivery to 20th day of age, we observed a steady significant decrease of TLR4 mRNA expression (Figure 1) in the blood of the examined foals. During the subsequent days of observation, the expression of the mRNA of this receptor remained at a similar level. The lowest expression value was observed at the 60th day of age (5.82 ± 0.96) (Table 2). Between the delivery day and the 60th day of age, the expression of mRNA for TLR4 decreased by 76.89%. Statistical analysis showed highly statistically significant differences between the age of foals and the expression of TLR4 mRNA (p < 0.01).
The expression oftheTLR7 gene remained statistically unchanged throughout the experiment (Figure 1). The highest values were observed during the day of delivery (9.20 ± 1.20), while the lowest was observed 20 days after delivery (7.20 ± 0.61). There was no statistically significant correlation between the age and the expression of TLR7 mRNA (p > 0.2366) (Table 2).

3.2. Influence of Stimulation with Biotropina on the Expression of TLR3, 4, and 7 mRNA

Analysis of changes in the expression of TLR3 mRNA after the injection of the immunostimulant (Group E) showed a decrease by 41.65% (Table 3), while in the control group (Group C), a dynamic increase in the expression was observed until the last day of observation (116.22 ± 13.93). Highly statistically significant differences were found between immunostimulation and the expression of TLR3 mRNA.
The level of TLR4 mRNA expression at 30 days of age was similar in both groups (Table 3). After Biotropina injection, TLR4 mRNA expression increased by 41.33% (Group E), while the expression of TLR4 mRNA in foals from Group C decreased by 20.22%. On the following days after immunostimulation, TLR4 mRNA expression in the foals from Group E was higher, but we did not find statistically significant differences between groups. Statistical analysis showed statistically significant differences in TLR4 mRNA expression after immunostimulation.
The initial expression of TLR7 mRNA before first suckling was higher in Group C. In Group E, the highest level of expression was observed during delivery at 7.57 ± 0.88 (Table 3). In Group C, the expression was higher during the experiment compared to Group E, and we found highly statistically significant differences between groups (p < 0.001). No statistically significant differences were found between the expression of TLR7 mRNA and immunostimulation.
The Spearman’s rank correlation test showed a strong negative correlation between theTLR3 and TLR4 genes, and lack of correlation between TLR3 and TLR7as well asTLR4 and TLR7 (Table 4).

3.3. Influence of Age and Stimulation with Biotropina on the Level of Blood Morphotic Elements

Statistical analysis showed (Table 5):
-
A significant influence of age on the hematocrit level;
-
A highly significant influence of age on the hemoglobin level;
-
A significant influence of age on the level of erythrocytes;
-
A highly significant influence of age and immunostimulation on the level of leukocytes;
-
A highly significant influence of age and immunostimulation on the level of lymphocytes;
-
A highly significant influence of immunostimulation on the number of monocytes;
-
A significant influence of age and immunostimulation on the number of neutrophils.
-
A highly significant influence of immunostimulation, significant influence of age on the number of basophils;
-
A highly significant influence of immunostimulation and age on the number of basophils.

4. Discussion

Infectious diseases are common in foals between the first and fifth months of age. Analysis of the concentrations of immune system components during this period in healthy and infected foals may help understand the basics of the maturation of the immune system and also better understand infection mechanisms [22]. To the best of our knowledge, there are very limited reports where weekly collections and the expression of immune-related genes have been performed. Therefore, our results may be interesting for better understanding the changes during the first weeks of a foal’s life and the changes it undergoes during this time. Most studies report data from the first 24 h of a foal’s life, from the first 42 days, and very often from adult horses. Moreover, most data include thoroughbreds, while we performed our analysis on a primitive horse breed that is known for their adaptation to harsh conditions. While this study was performed on a primitive domestic breed, the results from this study may differ from potential results if performed on selectively breed domestic horses. Flaminio et al. [22] reported that healthy lymphocytes of healthy foals were the lowest at birth and that values increased until the sixth month of age. In our study, we obtained similar results; however, in Polish Pony, lymphocyte counts were higher (Table 5).

4.1. Changes in TLR4 Gene Expression

Because of the increased vulnerability of foals to some pathogens (e.g., Rhodococcus equi), it seems reasonable to analyze changes in the expression of the genes that are responsible for the recognition of the conserved constituents of pathogens [23]. In the present study, a highly significant influence of age and stimulation with Biotropina was observed for TLR4. Data available in the literature indicate that the influence of age on TLR4 expression in horses is contradictory. Vendrig et al. [24] found no differences between the expression of TLR4 in the blood mononuclear cells of foals at 12 h of life or in adult horses. Stimulation with lipopolysaccharides (LPS) resulted in higher TLR4 mRNA expression in adult horses, while no response to LPS stimulation was found in foals in an in vivo study [24]. In contrast, Tessier et al. [25], having compared TLR4 mRNA expression in umbilical cord blood and peripheral blood from adult horses, demonstrated higherTLR4 mRNA expression in umbilical cord blood in response to LPS administration. The influence of age on the expression of TLR4was observed by Hansen et al. [26] in horses aged between 5 and 27 years. Higher TLR4 mRNA levels were found in younger horses, but the decrease in mRNA levels with age were not statistically significant. TLR4 mRNA levels were higher in blood mononuclear cells compared to the same cells from pulmonary vascular secretions. Osorio et al. [27] and Strong et al. [28] evaluated the expression of the TLR4 gene in the first weeks of a calf’s life, and their results were similar to the one produced in our study. The highest level ofTLR4 gene expression was observed after birth, and a statistically significant decrease in expression was reported during the following days. A similar trend was identified in our study. Yerkovich et al. [29] and Levy et al. [30] showed that the expression of the TLR4 gene was significantly higher in peripheral blood in premature and full-term infants than in adults, both before and after LPS stimulation [31]. This trend, indicating a decreasing expression of TLR4 with age, was also found in humans and mice [32,33]. On the other hand, some results illustrate a higher expression of TLR4 in newborns compared to adults [34] or decreasing expression of TLR4 after stimulation [35]. The differences in TLR4 expression revealed in these studies and in our experiment may be caused by different concentrations of LPS in the stimulation.

4.2. Changes in TLR3 Gene Expression

We found that TLR3 mRNA levels increased with the age of the foals. Our results are in agreement with other reports about horses and mostly human newborns [25,36,37,38]. Interestingly, there are reports proving epigenetics control TLR3 expression mechanisms [36]. As Porras et al. [36] reported in their results from healthy donors, it can be presumed that a low level of TLR3 in newborns is a developmentally desirable trend. In a mouse model, Zhang et al. [37] reported higher abortion rates linked with higher TLR3 levels. It was also mentioned that TLR3 expression was age-dependent, which can be confirmed by our results. As TLR3 binds double-stranded RNAs (dsRNAs), its decreased level may increase susceptibility to viral infection in young foals. In our study, the lowest level was recorded before the first suckling, which is in agreement with other reports in premature infants [38] and newborns [39,40]. The data presented above, and the results obtained in our study of the TLR3 gene, may explain the higher incidence of equine herpesvirus-1 (EHV-1) and equine herpesvirus-4 (EHV-4), responsible for massive respiratory tract infections in foals and young horses. A severe course and high mortality due to contracting equine viral arteritis (EVA) in young horses may also be a result of the decreased expression of TLR3. Hussey et al. [41] suggested that TLR3 plays an essential role in recognizing EHV-1 infections. In our study, a decrease in TLR3 gene expression was observed after stimulation with Biotropina. We analyzed the level of expression in foals up to 60 days of age, but the literature indicates that the immune system of horses develops most intensively until about 90 days of life [42]. Foals have all of the components of an immune system characteristic of adult horses—but many mechanisms of the immune response have yet to mature. The results indicate that activation of horse monocytes by ligands for the TLR2 and TLR4 genes increases their expression, but not that of TLR3. Additionally, TLR3 gene expression decreases with the increase of TLR4 gene expression after the stimulation of monocytes [43].

4.3. Changes in TLR7 Gene Expression

TLR7 is responsible for recognizing guanidine-rich, single-stranded viral RNA (ssRNA) and is an important mediator of the peripheral immune response. Asquith at al. [41] and Slavica at al. [39] observed no effect of age onTLR7 gene expression in newborns, similar to Talmadge et al. [22] in horses. Belnoue et al. [44] reported significantly higher levels of TLR7 gene expression in two-week-old foals compared to adult horses. Harrington et al. [9] found neither an age-dependent pattern in the expression of the TLR7/8 genes, nor did they detect the effect of imidazoquinol R848 stimulation on its expression, despite increasing the levels of IL-6 and IL-8. Our results also did not confirm any relationship between a foal’s age and expression of TLR7. Until now, little was known about the signaling mechanisms of Toll-like receptors in foals. Identifying the receptors and describing ligands that react with them can provide new insights into immunological responses and can also point to new pathways in the field of therapy and prevention of diseases, particularly infectious ones.

5. Conclusions

In summary, on the basis of the results obtained, it was concluded that the expression of the TLR3 and TLR4 genes in peripheral blood cells is dependent on age. The expression of the TLR3 and TLR4 genes, as well as the levels of immunoglobulins and interleukins, can be modulated by stimulation with the pharmacological agent Biotropina. This experiment demonstrated a strong negative correlation between TLR3 and TLR4 gene expression. Detailed knowledge of the molecular mechanisms of immunoglobulin synthesis appears necessary for a better understanding of foal immunity maturity and its influencing factors. At the same time, this experiment encourages studies regarding the influence of the signaling cascade’s proteins on the primary immunological response, providing an opportunity to develop extremely precise methods of regulating acquired immunity. There is still little information about the maturity of a horse’s immune system in the pre- and postnatal period, which negatively affects the planning of health protection strategies for foals.

Supplementary Materials

The following are available online at https://www.mdpi.com/2076-2615/10/11/1966/s1, Supplementary File 1: TEMPUS SPIN manufacturer protocol and Morphotic Blood Parameters, Figure S1: Birth system alarm, Table S1: Mastermix reaction, Table S2: Reaction efficiency.

Author Contributions

Conceptualization, A.M., A.O. and A.C.-S.; methodology A.M. and M.O.; collection and analysis of samples, A.M., Ł.M. and A.O.; Data interpretation A.M., Ł.M., M.O. and A.C.-S.; writing A.M. and Ł.M. All authors have read and agreed to the published version of the manuscript.

Funding

This work was financed by the Ministry of Science and Higher Education of the Republic of Poland (funds for statutory activity, DS 3208 and SUB.2015-D201).

Conflicts of Interest

The authors declare that they have no competing interests. The funders had no role in the design of the study; in the collection, analyses, or interpretation of data; in the writing of the manuscript, or in the decision to publish the results.

References

  1. Tallmadge, R.; McLaughlin, K.; Secor, E.; Ruano, D.; Matychak, M.; Julia, M.; Flaminio, B.F. Expression of essential Bcell genes and immunoglobulin isotypes suggests active development and gene recombination during equine gestation. Dev. Comp. Immunol. 2009, 33, 1027–1038. [Google Scholar] [CrossRef] [PubMed]
  2. Perkins, G.A.; Wagner, B. The development of equine immunity: Current knowledge on immunology in the young horse. Equine Vet. J. 2015, 47, 267–274. [Google Scholar] [CrossRef]
  3. Flamino, M.J.; Rush, B.R.; Davis, E.G.; Hennessy, K.; Shuman, W.; Wilkerson, M.J. Characterization of peripheral blood and pulmonary leukocyte function in healthy foal. Vet. Immunol. Immunopathol. 2000, 73, 267–285. [Google Scholar] [CrossRef]
  4. Miyara, M.; Sakaguchi, S. Natural regulatory T cells: Mechanisms of suppression. Trends Mol. Med. 2007, 13, 108–116. [Google Scholar] [CrossRef] [PubMed]
  5. Janeway, C.A., Jr.; Medzhitov, R. Innate immune recognition. Annu. Rev. Immunol. 2002, 20, 197–216. [Google Scholar] [CrossRef] [Green Version]
  6. Lemaitre, B.; Nicolas, E.; Michaut, L.; Reichhart, J.M.; Hoffmann, J.A. The dorsoventral regulatory gene cassette spätzle/Toll/cactus controls the potent antifungal response in Drosophila adults. Cell 1996, 6, 973–983. [Google Scholar] [CrossRef] [Green Version]
  7. Medzhitov, R.; Preston-Hurlburt, P.; Janeway, C., Jr. A human homologue of the Drosophila Toll protein signals activation of adaptive immunity. Nature 1997, 388, 394–397. [Google Scholar] [CrossRef]
  8. Kawai, T.; Akira, S. The role of pattern-recognition receptors in innate immunity: Update on Toll-like receptors. Nat. Immunol. 2010, 11, 373–384. [Google Scholar] [CrossRef]
  9. Harrington, J.R.; Wilkerson, C.P.; Brake, C.N.; Cohen, N.D. Effects of age and R848 stimulation on expression of Toll-like receptor 8mRNA by foal neutrophils. Vet. Immunol. Immunopathol. 2012, 150, 10–18. [Google Scholar] [CrossRef]
  10. Hayashi, F.; Means, T.K.; Luster, A.D. Toll-like receptors stimulate human neutrophil function. Blood 2003, 102, 2660–2669. [Google Scholar] [CrossRef]
  11. Kulisa, M.; Makieła, K.; Długosz, B.; Gaj, M. Thoroughbred foals’ mortality causes during first six months of life. PartII. Diseases and injuries. Roczniki Naukowe Polskiego Towarzystwa Zootechnicznego 2009, 5, 79–84. [Google Scholar]
  12. Haas, S.D.; Bristol, F.; Card, C.E. Risk factors associated with the incidence of foal mortality in a managed mare herd. Can. Vet. J. 1996, 37, 91–95. [Google Scholar] [PubMed]
  13. Wilson, W.D.; Mihalyi, J.E.; Hussey, S.; Lunn, D.P. Passive transfer of maternal immunoglobulin isotype antibodies against tetanus and influenza and their effect on the response of foals to vaccination. Equine Vet. J. 2001, 33, 644–650. [Google Scholar] [CrossRef] [PubMed]
  14. Ainsworth, D.M.; Eicker, S.W.; Yeagar, A.E.; Sweeney, C.R.; Viel, L.; Tesarowski, D.; Lavoie, J.P.; Hoffman, A.; Paradis, M.R.; Reed, S.M.; et al. Associations between physical examination, laboratory, and radiographic findings and outcome and subsequent racing performance of foals with Rhodococcus equi infection: 115 cases (1984–1992). J. Am. Vet. Med. Assoc. 1998, 213, 510–515. [Google Scholar] [PubMed]
  15. Breathnach, C.C.; Sturgill-Wright, T.; Stiltner, J.L.; Adams, A.A.; Lunn, D.P.; Horohov, D.W. Foals are interferon gamma-deficient at birth. Vet. Immunol. Immunopathol. 2006, 112, 199–209. [Google Scholar] [CrossRef] [PubMed]
  16. Boyd, N.K.; Cohen, N.D.; Lim, W.S.; Martens, R.J.; Chaffin, M.K.; Ball, J.M. Temporal changes in cytokine expression of foals during the first month of life. Vet. Immunol. Immunopathol. 2003, 92, 75–85. [Google Scholar] [CrossRef]
  17. Prescott, J.F.; Nicholson, V.M.; Patterson, M.C.; Zandona Meleiro, M.C.; de Caterino, A.A.; Yager, J.A.; Holmes, M.A. Use of Rhodococcus equi virulence-associated protein for immunization of foals against R. equi pneumonia. Am. J. Vet. Res. 1997, 58, 356–359. [Google Scholar]
  18. Fleer, A.; Krediet, T.G. Innate immunity: Toll-like receptors and some more. Neonatology 2007, 92, 145–157. [Google Scholar] [CrossRef]
  19. Levy, O. Innate immunity of the newborn: Basic mechanisms and clinical correlates. Nat. Rev. Immunol. 2007, 7, 379–390. [Google Scholar] [CrossRef]
  20. Jaworski, Z. Tablice Genealogiczne Koników Polskich Genealogical Tables of the Polish Primitive Horse; Stacja Badawcza Rolnictwa Ekologicznego i Hodowli Zachowawczej Zwierzat PAN: Popielno, Poland, 1997. (In Polish) [Google Scholar]
  21. Hoehler, D. The Institute for Animal Nutrition and Metabolic Physiology; Kiel University: Kiel, Germany, 1997. [Google Scholar]
  22. Flaminio, M.; Rush, B.; Shuman, W. Peripheral Blood Lymphocyte Subpopulations and Immunoglobulin Concentrations in Healthy Foals and Foals with Rhodococcus Equi Pneumonia. J. Vet. Intern. Med. 1999, 13, 206–212. [Google Scholar] [CrossRef]
  23. Tallmadge, R.; Wang, M.; Sun, Q.; Felippe, M.J.B. Transcriptome analysis of immune genes in peripheral blood mononuclear cells of young foals and adult horses. PLoS ONE 2018, 13, e0202646. [Google Scholar] [CrossRef] [PubMed] [Green Version]
  24. Vendrig, J.C.; Coffeng, L.E.; Fink-Gremmels, J. Effects of Separate and Concomitant TLR-2 and TLR-4 Activation in Peripheral Blood Mononuclear Cells of Newborn and Adult Horses. PLoS ONE 2013, 8, e66897. [Google Scholar] [CrossRef] [PubMed] [Green Version]
  25. Tessier, L.; Bienzle, D.; Williams, L.B.; Koch, T.G. Phenotypic and Immunomodulatory Properties of Equine Cord Blood-Derived Mesenchymal Stromal Cells. PLoS ONE 2015, 10, e0122954. [Google Scholar] [CrossRef] [PubMed]
  26. Hansen, S.; Baptiste, K.; Fjeldborg, J.; Betancourt, A.; Horohov, D. A comparison of pro-inflammatory cytokine mRNA expression in equine bronchoalveolar lavage (BAL) and peripheral blood. Vet. Immunol. Immunopathol. 2014, 158, 238–243. [Google Scholar] [CrossRef]
  27. Osorio, J.; Trevisi, E.; Ballou, M.; Bertoni, G.; Drackley, J.; Loor, J. Effect of the level of maternal energy intake prepartum on immune metabolic markers, polymorphonuclear leukocyte function, and neutrophil gene network expression in neonatal Holstein heifer calves. J. Dairy Sci. 2013, 96, 3573–3587. [Google Scholar] [CrossRef] [Green Version]
  28. Strong, R.; Silva, E.; Cheng, H.; Eicher, S.D. Acute brief heat stress in late gestation alters neonatal calf innate immune functions. J. Dairy Sci. 2015, 98, 7771–7783. [Google Scholar] [CrossRef]
  29. Yerkovich, S.T.; Wikstrom, M.E.; Suriyaarachchi, D.; Prescott, S.L.; Upham, J.W.; Holt, P.G. Postnatal Development of Monocyte Cytokine Responses to Bacterial Lipopolysaccharide. Pediatr. Res. 2007, 62, 547–552. [Google Scholar] [CrossRef] [Green Version]
  30. Levy, E.; Xanthou, G.; Petrakou, E.; Zacharioudaki, V.; Tsatsanis, C.; Fotopoulos, S.; Xanthou, M. Distinct Roles of TLR4 and CD14 in LPS-Induced Inflammatory Responses of Neonates. Pediatr. Res. 2009, 66, 179–184. [Google Scholar] [CrossRef] [Green Version]
  31. Boehmer, E.D.; Goral, J.; Faunce, D.E.; Kovacs, E.J. Age-dependent decrease in Toll-like receptor 4-mediated proinflammatory cytokine production and mitogen-activated protein kinase expression. J. Leukoc. Biol. 2003, 75, 342–349. [Google Scholar] [CrossRef]
  32. Chelvarajan, R.L.; Collins, S.M.; Van Willigen, J.M.; Bondada, S. The unresponsiveness of aged mice to polysaccharide antigens is a result of a defect in macrophage function. J. Leukoc. Biol. 2005, 77, 503–512. [Google Scholar] [CrossRef]
  33. Förster-Waldl, E.; Sadeghi, K.; Tamandl, D.; Gerhold, B.; Hallwirth, U.; Meistersinger, K.; Hayde, M.; Prusa, A.R.; Herkner, K.; Boltz-Nitulescu, G.; et al. Monocyte toll-like receptor 4 expression and LPS induced cytokine production increase during gestational aging. Pediatr. Res. 2005, 58, 121–124. [Google Scholar] [CrossRef] [PubMed] [Green Version]
  34. Levy, O.; Zarember, K.A.; Roy, R.M.; Cywes, C.; Godowski, P.J.; Wessels, M.R. Selective impairment of TLR-mediated innate immunity in human newborns: Neonatal blood plasma reduces monocyte TNF-alpha induction by bacterial lipopeptides, lipopolysaccharide, and imiquimod, but preserves the response to R-848. J. Immunol. 2004, 173, 4627–4634. [Google Scholar] [CrossRef] [PubMed] [Green Version]
  35. Yan, S.R.; Qing, G.; Byers, D.M.; Stadnyk, A.W.; Al-Hertani, W.; Bortolussi, R. Role of MyD88 in Diminished Tumor Necrosis Factor Alpha Production by Newborn Mononuclear Cells in Response to Lipopolysaccharide. Infect. Immun. 2004, 72, 1223–1229. [Google Scholar] [CrossRef] [Green Version]
  36. Porrás, A.; Kozar, S.; Russanova, V.; Salpea, P.; Hirai, T.; Sammons, N.; Mittal, P.; Kim, J.Y.; Ozato, K.; Romero, R.; et al. Developmental and epigenetic regulation of the human TLR3 gene. Mol. Immunol. 2008, 46, 27–36. [Google Scholar] [CrossRef]
  37. Zhang, J.; Wei, H.; Wu, D.; Tian, Z. Toll-like receptor 3 agonist induces impairment of uterine vascular remodeling and fetal losses in CBA × DBA/2 mice. J. Reprod. Immunol. 2007, 74, 61–67. [Google Scholar] [CrossRef]
  38. Gibbons, D.L.; Haque, S.F.; Silberzahn, T.; Hamilton, K.; Langford, C.; Ellis, P.; Carr, R.; Hayday, A.C. Neonates harbour highly active gamma delta T cells with selective impairments in preterm infants. Eur. J. Immunol. 2009, 39, 1794–1806. [Google Scholar] [CrossRef] [PubMed]
  39. Pott, J.; Stockinger, S.; Torow, N.; Smoczek, A.; Lindner, C.; McInerney, G.; Bäckhed, F.; Baumann, U.; Pabst, O.; Bleich, A.; et al. Age-Dependent TLR3 Expression of the Intestinal Epithelium Contributes to Rotavirus Susceptibility. PLoS Pathog. 2012, 8, e1002670. [Google Scholar] [CrossRef]
  40. Slavica, L.; Nordström, I.; Karlsson, M.N.; Valadi, H.; Kacerovsky, M.; Jacobsson, B.; Eriksson, K. TLR3 impairment in human newborns. J. Leukoc. Biol. 2013, 94, 1003–1011. [Google Scholar] [CrossRef] [Green Version]
  41. Hussey, G.S.; Ashton, L.V.; Quintana, A.M.; Lunn, P.D.; Goehring, L.S.; Annis, K.; Landolt, G. Innate immune responses of airway epithelial cells to infection with Equine herpesvirus-1. Vet. Microbiol. 2014, 170, 28–38. [Google Scholar] [CrossRef]
  42. Asquith, M.; Haberthur, K.; Brown, M.; Engelmann, F.; Murphy, A.; Al-Mahdi, Z.; Messaoudi, I. Age-dependent changes in innate immune phenotype and function in rhesus macaques (Macaca mulatta). Pathobiol. Aging Age Relat. Dis. 2012, 2, 3331. [Google Scholar] [CrossRef] [Green Version]
  43. Kwon, S.; Vandenplas, M.L.; Figueiredo, M.D.; Salter, C.E.; Andrietti, A.L.; Robertson, T.P.; Moore, J.N.; Hurley, D.J. Differential induction of Toll-like receptor gene expression in equine monocytes activated by Toll-like receptor ligands or TNF-α. Vet. Immunol. Immunopathol. 2010, 138, 213–217. [Google Scholar] [CrossRef]
  44. Belnoue, E.; Fontannaz, P.; Rochat, A.-F.; Tougne, C.; Bergthaler, A.; Lambert, P.-H.; Pinschewer, D.D.; Siegrist, C.-A. Functional Limitations of Plasmacytoid Dendritic Cells Limit Type I Interferon, T Cell Responses and Virus Control in Early Life. PLoS ONE 2013, 8, e85302. [Google Scholar] [CrossRef]
Figure 1. Trends in the change of TLR3 (A), TLR4 (B), and TLR7 (C) expression during foals’ growth. Delivery, sample collected at delivery; 24 h, sample collected 24 h after delivery; 3 days, sample collected every 3rd day after delivery; 5 days, sample collected every 5 days after delivery; 10 days, sample collected every 10 days after delivery; 20 days, sample collected every 20 days after delivery; 30 days, sample collected 30 days after delivery; 40 days, sample collected every 40 days after delivery; 50 days, sample collected every 50 days after delivery; 60 days, sample collected 60 days after delivery. The means are reported with their standard errors.
Animals 10 01966 g001
Table 1. Probes used for amplification of Toll-like receptor (TLR) genes and housekeeping genes.
Gen.Full Name of the GeneAccess Number GenBankTaqMan Gene Expression Assay IDDye
TLR3Toll-like receptor 3NC_009170.2Ec03467747_m1FAM
TLR4Toll-like receptor 4NC_009168.2Ec03468993_m1FAM
TLR7Toll-like receptor 7NC_009175.2Ec03467530_m1VIC
SDHASuccinate dehydrogenase complex subunit AXM_001490889Ec03470479_m1VIC
HPRTHypoxanthinephosphoribosyl transferaseAY372182.1Ec03470217_m1VIC
Table 2. Expression of TLR3, TLR4, and TLR7 mRNA over the foals’ subsequent days of age from the control group (mean ± standard error (SE).
AgeTLR3TLR4TLR7
Delivery 16.2 A ± 0.9 218.3 A ± 2.69.2 ± 1.2
24 h9.8 B ± 1.715.3 B ± 2.27.3 ± 0.9
3 days14.1 A,C ± 2.113.7 C ± 1.87.9 ± 0.8
5 days19.1 A,B,D ± 2.212.3 A,D ± 1.58.2 ± 0.9
10 days29.3 A,B,C,E ± 2.810.1 A ± 1.17.8 ± 0.7
20 days35.1 A,B,C,F ± 3.18.3 A,B ± 1.17.2 ± 0.6
30 days48.4 A,B,C,D,G ± 4.98.4 A,B ± 148.3 ± 0.9
40 days53.6 ABCDEF ± 5.87.8 A,B,C ± 1.28.3 ± 0.7
50 days80.4 ABCDEFG ± 8.77.3 A,B,C ± 1.58.6 ± 0.7
60 days87.9 A,B,C,D,E,F,G ± 8.05.8 A,B,C,D ± 0.99.2 ± 07
1 Delivery, sample collected at delivery; 24 h, sample collected 24 h after delivery; 3 days, sample collected 3 days after delivery; 5 days, sample collected 5 days after delivery; 10 days, sample collected 10 days after delivery; 20 days, sample collected 20 days after delivery; 30 days, sample collected 30 days after delivery; 40 days, sample collected 40 days after delivery; 50 days, sample collected 50 days after delivery; 60 days, sample collected 60 days after delivery. 2 Means are reported with their standard errors. Means with same letter in column show highly statistically significant differences (p < 0.01).
Table 3. Influence of stimulation with Biotropina on the expression of mRNA for selected Toll-like receptors (TLR3, TRL4, TLR7) (mean ± SE).
AgeTLR3TLR4TLR7
Group CGroup EGroup CGroup EGroup CGroup E
Delivery 18.3 ** ± 1.8 24.1 ** ± 0.5519.9 * ± 4.013.7 * ± 0.512.9 * ± 2.97.6 * ± 0.9
24 h14.7 ** ± 3.86.5 ** ± 1.2417.5 * ± 3.311.5 * ± 0.610.2 ± 2.17.0 ± 0.8
3 days20.0 ** ± 4.98.7 ** ± 2.2416.7 ** ± 2.49.9 ** ± 1.19.6 ± 1.78.3 ± 1.1
5 days28.0 ± 2.615.1 * ± 1.7014.5 * ± 1.99.7 * ± 1.111.4 * ± 2.27.4 * ± 0.9
10 days32.7 ± 3.330.1 ± 5.4310.9 ± 0.77.1 ± 1.39.7 ± 1.47.4 ± 0.6
20 days36.7 ± 4.636.4 ± 4.938.0 ± 1.27.2 ± 1.58.7 ± 1.57.0 ± 0.7
30 days62.2 * ± 9.639.6 * ± 7.438.2 ± 2.37.1 ± 1.910.0 ± 2.07.1 ± 0.9
40 days78.2 ** ± 6.823.1 ** ± 8.826.5 * ± 1.310.0 * ± 2.49.7 ± 1.67.9 ± 0.8
50 days107.0 ** ± 15.326.0 ** ± 9.715.5 ± 1.96.8 ± 1.911.2 * ± 1.26.9 * ± 0.9
60 days116.2 ** ± 13.944.6 ** ± 10.204.2 ± 1.46.5 ± 1.711.5 ± 1.27.6 ± 0.7
1 Delivery, sample collected at delivery; 24 h, sample collected 24 h after delivery; 3 days, sample collected 3 days after delivery; 5 days, sample collected 5 days after delivery; 10 days, sample collected 10 days after delivery; 20 days, sample collected 20 days after delivery; 30 days, sample collected 30 days after delivery; 40 days, sample collected 40 days after delivery; 50 days, sample collected 50 days after delivery; 60 days, sample collected 60 days after delivery. 2 Means are reported with their standard errors; Group C, control group; Group E, experimental Biotropina-stimulated group (injection at the 35th and 40th days after delivery). * Means in row/line for receptor show significant differences (p < 0.05); ** Means in row/line for receptor show highly statistically significant differences (p < 0.01).
Table 4. Correlations (p-value) of the expression of TLR3, TLR4, and TLR7 mRNA over the subsequent days of age of the foals from the control group.
GeneAgeTLR4TLR7
TLR3<1 h−0.160 (0.6273)0.62857 (0.1631)
24 h−0.191 (0.4199)0.462 (0.1400)
3 days−0.100 (0.6726)0.492 (0.1276)
5 days−0.095 (0.6912)0.328 (0.1582)
10 days0.350 (0.0299)0.567 (0.1917)
20 days0.582 (0.0071)0.423 (0.1634)
30 days0.04361 (0.0085)0.368 (0.1098)
40 days0.56992 (0.0087)0.472 (0.0355)
50 days0.46466 (0.0039)0.76541 (0.0251)
60 days0.35338 (0.0026)0.82105 (0.0341)
TLR4<1 h−0.340 (0.1376)
24 h−0.385 (0.0936)
3 days−0.472 (0.1355)
5 days−0.341 (0.1408)
10 days−0.191 (0.4199)
20 days−0.319 (0.1707)
30 days−0.271 (0.2468)
40 days−0.53083 (0.1600)
50 days−0.67519 (0.0111)
60 days−0.360 (0.0116)
<1 h, sample collected at delivery; 24 h, sample collected 24 h after delivery; 3 days, sample collected 3 days after delivery; 5 days, sample collected 5 days after delivery; 10 days, sample collected 10 days after delivery; 20 days, sample collected 20 days after delivery; 30 days, sample collected 30 days after delivery; 40 days, sample collected 40 days after delivery; 50 days, sample collected 50 days after delivery; 60 days, sample collected 60 days after delivery. Correlations (p-value) bolded show significant differences (p < 0.05) while underlined show highly significant differences (p < 0.01).
Table 5. Level of blood morphotic elements in foals (mean ± SE).
Age<1 h 124 h3 Days5 Days10 Days20 Days30 Days40 Days50 Days60 Days
Parameters
Hematocrit (PCV) %C50.00 2 ± 1.243.33 ± 1.239.83 ± 1.541.11 ± 1.141.56 ± 1.934.44 ± 1.637.33 ± 1.136.33 ± 1.337.72 ± 1.237.56 ± 1.7
E50.50 ± 1.244.50 ± 1.843.67 ± 1.739.58 ± 1.541.17 ± 0.938.20 ± 1.139.75 ± 2.936.50 ± 1.737.25 ± 1.337.75 ± 0.9
Hemoglobin (g/dL)C15.46 ± 0.714.55 ± 0.713.26 ± 0.513.75 ± 0.713.63 ± 0.714.57 * ± 1.215.11 * ± 0.914.85 * ± 1.313.30 ± 0.613.98 * ± 1.1
E13.94 ± 0.913.04 ± 1.713.50 ± 0.812.71 ± 0.612.39 ± 0.213.03 ± 0.911.80 * ± 0.311.70 * ± 0.412.39 ± 0.510.08 * ± 0.3
RBC count (106/µL)C10.93 ± 0.910.62 ± 0.79.99 ± 0.610.55 ± 0.69.53 ± 0.410.38 ± 1.311.24 ± 1.59.98 ± 0.810.43 ± 0.89.86 ± 0.8
E11.50 ± 0.510.01 ± 0.39.17 ± 0.410.24 ± 0.99.33 ± 0.89.04 ± 0.79.59 ± 1.09.69 ± 0.710.29 ± 0.310.22 ± 0.3
WBC count (103/µL)C7.35 ± 0.87.71 ± 0.710.35 ± 1.29.86 ± 1.011.03 ± 0.811.30 ± 0.812.60 ± 1.014.31 ** ± 0.814.62 * ± 0.713.07 ** ± 0.7
E6.25 ± 0.68.17 ± 0.59.15 ± 0.810.64 ± 1.412.40 ± 1.112.48 ± 0.910.91 * ± 1.621.75 ** ± 0.518.98 * ± 0.414.89 ** ± 0.2
Eosinophils (/µL)C105 ** ± 2.2116 ** ± 2.472 ** ± 1.5296 ** ± 6.2110 ** ± 2.3226 ** ± 4.7315 ** ± 6.6286 ** ± 6.0292 ** ± 6.1327 ** ± 6.9
E0 ** ± 0.016 ** ± 0.322 ** ± 0.431 ** ± 0.637 ** ± 0.742 ** ± 0.855 ** ± 1.0206 ** ± 3.7105 ** ± 1.9133 ** ± 2.4
Basophils (/µL)C44 ± 0.939 ± 0.831 ± 0.699 ± 2.155 ± 1.2113 * ± 2.494 * ± 1.972 ** ± 1.5146 ** ± 3.1196 ** ± 4.1
E18 ± 0.329 ± 0.538 ± 0.739 ± 0.752 ± 0.964 * ± 1.175 * ± 1.3308 ** ± 5.5205 ** ± 3.776 ** ± 1.4
Neutrophils (/µL)C4471 * ± 59.54488 * ± 59.37041 ± 93.46903 ± 91.65898 * ± 78.36104 ± 81.07150 * ± 94.98583 ± 113.98186 ± 108.66403 * ± 84.9
E5650 ± 50.86942 ± 62.57374 ± 66.47645 ± 68.88804 * ± 79.27773 ± 69.95705 * ± 51.39499 * ± 85.59109 ± 81.97523 ± 67.7
Lymphocytes (/µL)C2554 ** ± 35.72852 * ± 39.93003 * ± 42.02465 ± 34.54686 ** ± 65.64635 * ± 64.94945 ** ± 69.25150 ** ± 72.15701 ** ± 79.85880 ** ± 82.3
E470 ** ± 4.21090 * ± 9.81609 ** ± 14.52802 ± 25.23110 ** ± 28.04280 * ± 38.54850 ** ± 43.610953 ** ± 98.69355 ** ± 84.27054 ** ± 63.5
Myelocytes (/µL)C162 ± 2.3231 ** ± 3.2207 * ± 2.999 ± 1.4276 * ± 3.7226 * ± 3.294 ** ± 1.3215 ** ± 3.0292 * ± 4.1261 * ± 3.7
E112 ± 1.093 **± 0.8107 *± 0.9123 ± 1.1397 * ± 3.6321 *± 2.9225 *± 2.0784 **± 7.1206 * ± 1.8104 * ± 0.9
1 <1, sample collected at delivery; 24 h, sample collected 24 h after delivery; 3 days, sample collected 3 days after delivery; 5 days, sample collected 5 days after delivery; 10 days, sample collected 10 days after delivery; 20 days, sample collected 20 days after delivery; 30 days, sample collected 30 days after delivery; 40 days, sample collected 40 days after delivery; 50 days, sample collected 50 days after delivery; 60 days, sample collected 60 days after delivery. 2 Means are reported with their standard errors. Group C, control group; Group E, experimental Biotropina-stimulated group (injection on the 35th and 40th days after delivery). * Means in row/line for receptor show significant differences (p < 0.05); ** means in row/line for receptor show highly statistically significant differences (p < 0.01).
Publisher’s Note: MDPI stays neutral with regard to jurisdictional claims in published maps and institutional affiliations.

