
Root-Associated Bacterial Community Shifts in Hydroponic Lettuce Cultured with Urine-Derived Fertilizer

 ,
,  ,
,  , , and
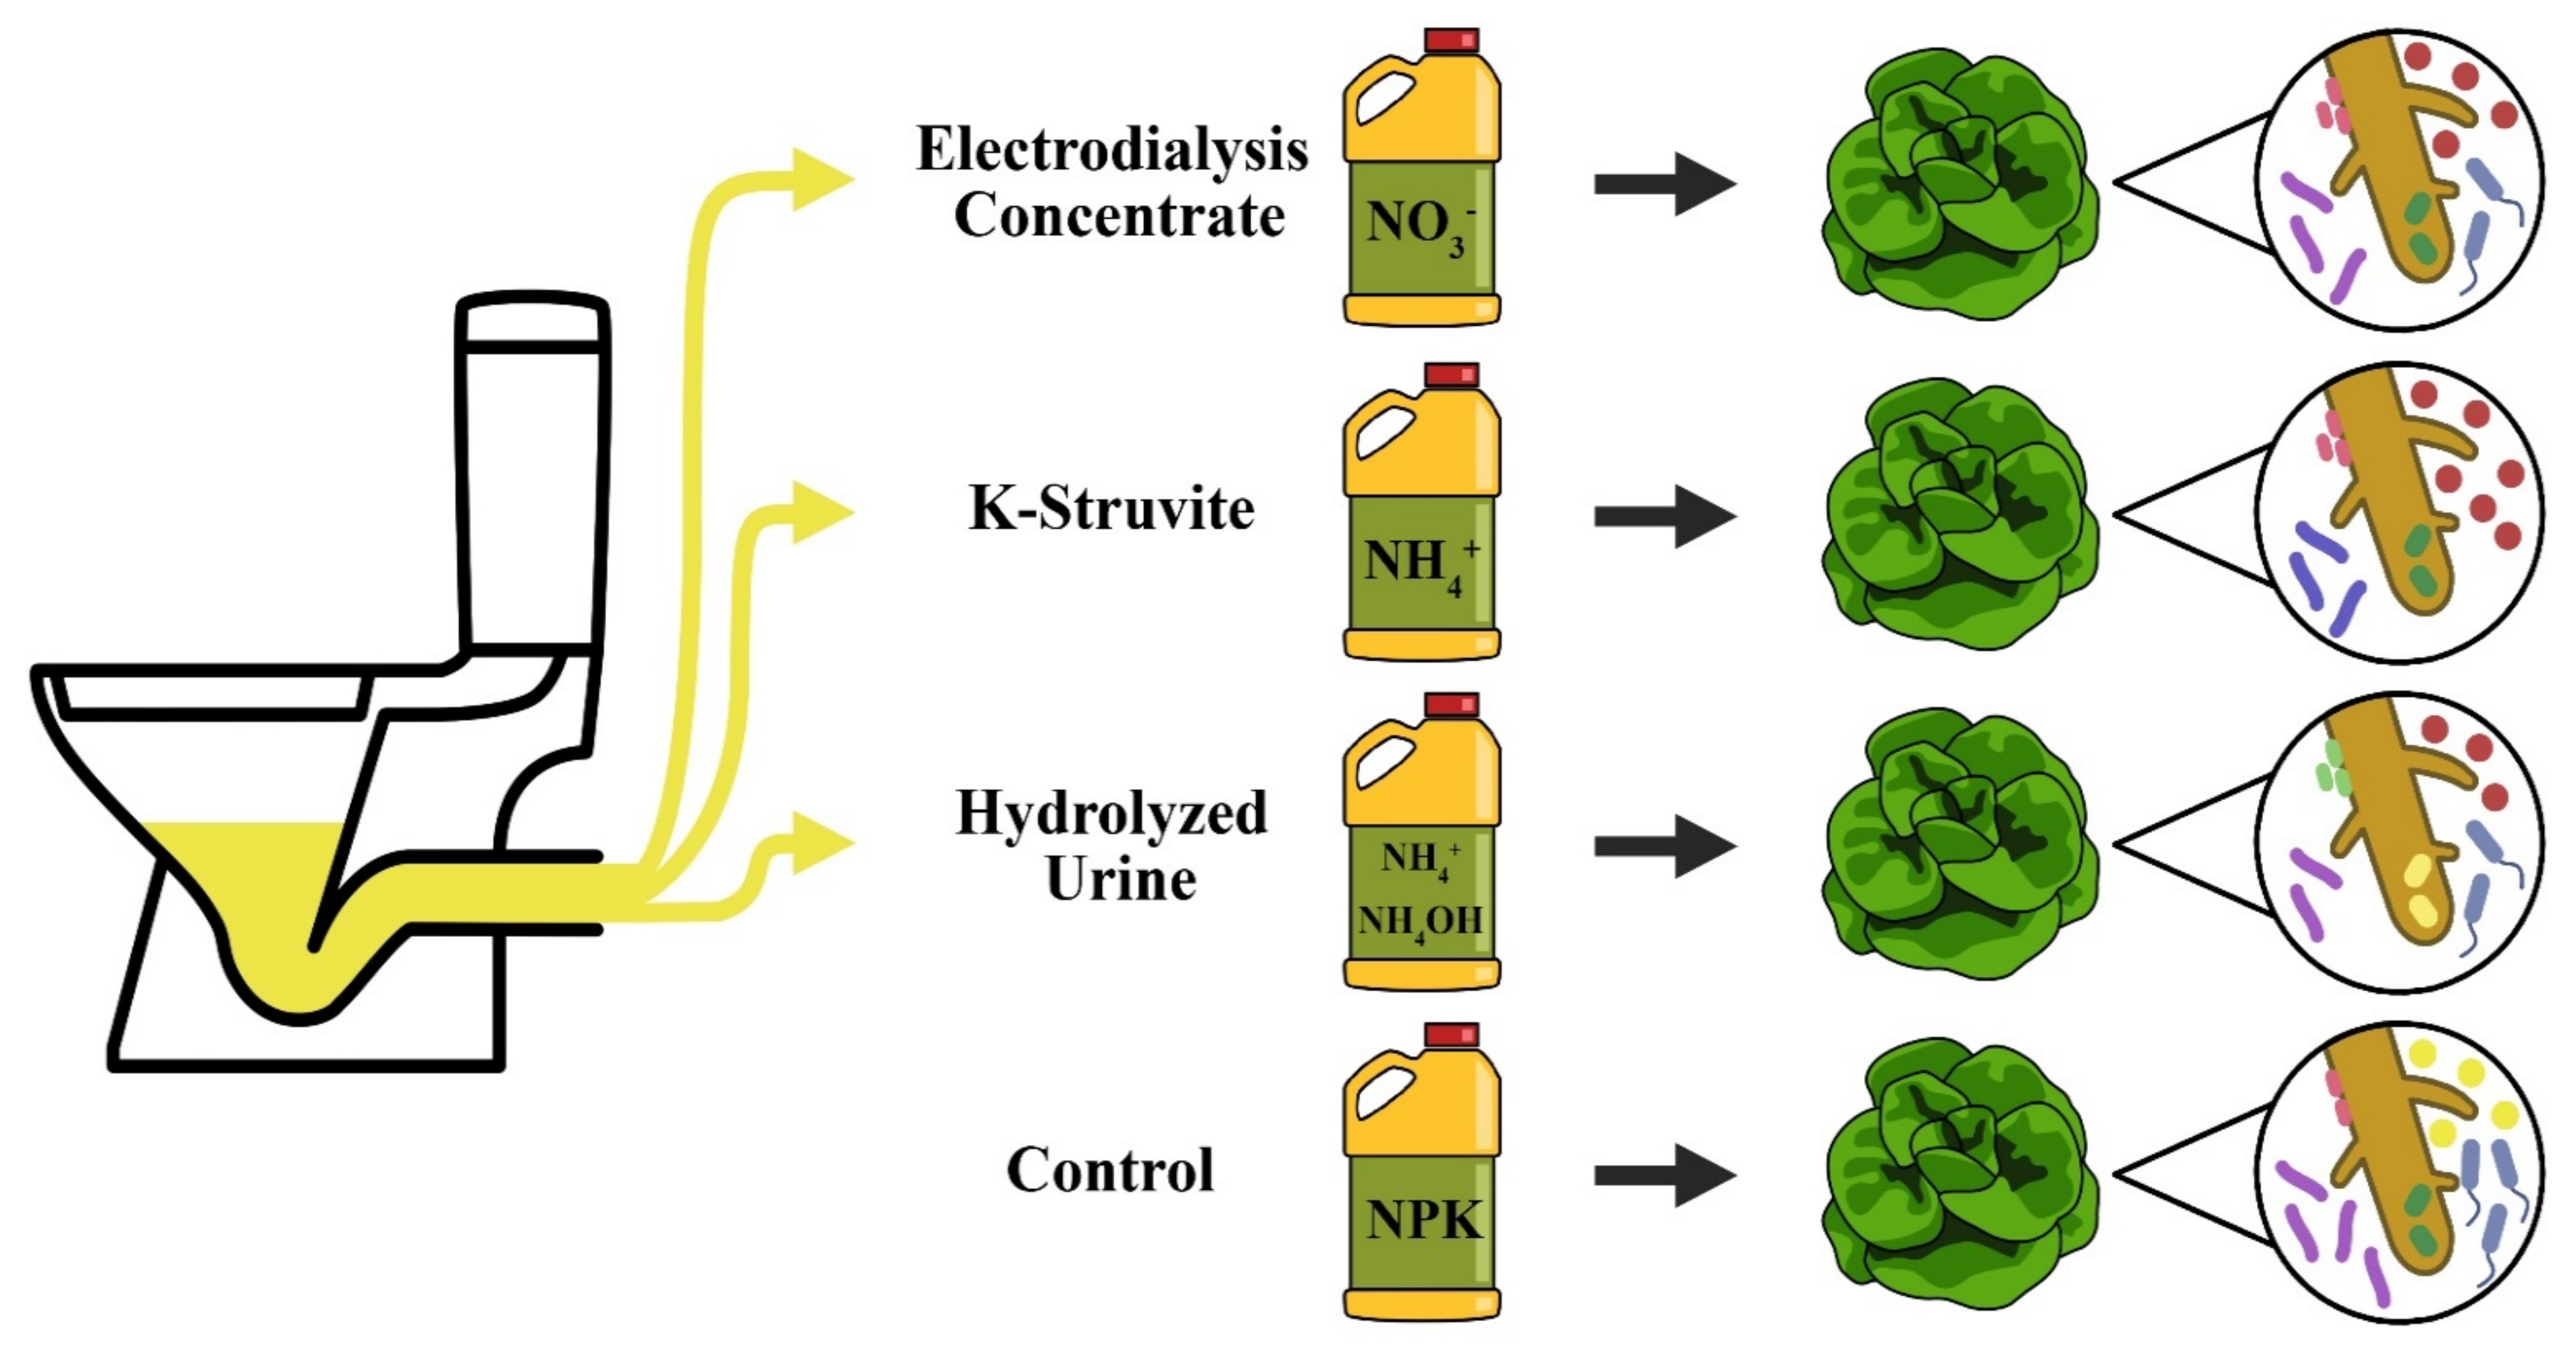
Abstract
1. Introduction
2. Materials and Methods
2.1. Plant Material, Growth Conditions, and Treatments
- ED concentrate was prepared by treating human urine with precipitation, nitrification and electrodialysis [11]. NO3− was the main N compound;
- The K-struvite precipitate was produced from human urine by removing all NH4-N (below 50 mg N/L), adding an equivalent molar amount of Mg2+, and increasing the pH to 10. NH4+ was the predominant N compound;
- Hydrolyzed urine was obtained after spontaneous urea hydrolysis during storage of collected human urine at room temperature for several weeks. Total ammonia N (TAN; NH₄OH and NH4+) was the main N compound.
2.2. Plant Sample Analysis
2.2.1. Soil Plant Analysis Development Index, Biomass Determination, Growth Analysis, Total N, Mineral Content, and Organic Acids Content Analysis
2.2.2. Chlorophylls and Carotenoids Content Analysis
2.2.3. Total Phenolic Content
2.2.4. Total Antioxidant Capacity
2.2.5. Plant Sample Statistical Analysis
2.3. Root-Associated Bacterial Community Analysis
2.3.1. Root-Associated Bacterial Community Sample Collection
2.3.2. 16S rRNA Gene Amplicon Sequencing
2.3.3. Root-Associated Bacterial Community Statistical Analysis
3. Results
3.1. Does the Type of Urine-Derived Fertilizer Differently Affect Lettuce Phenotype and Physiology?
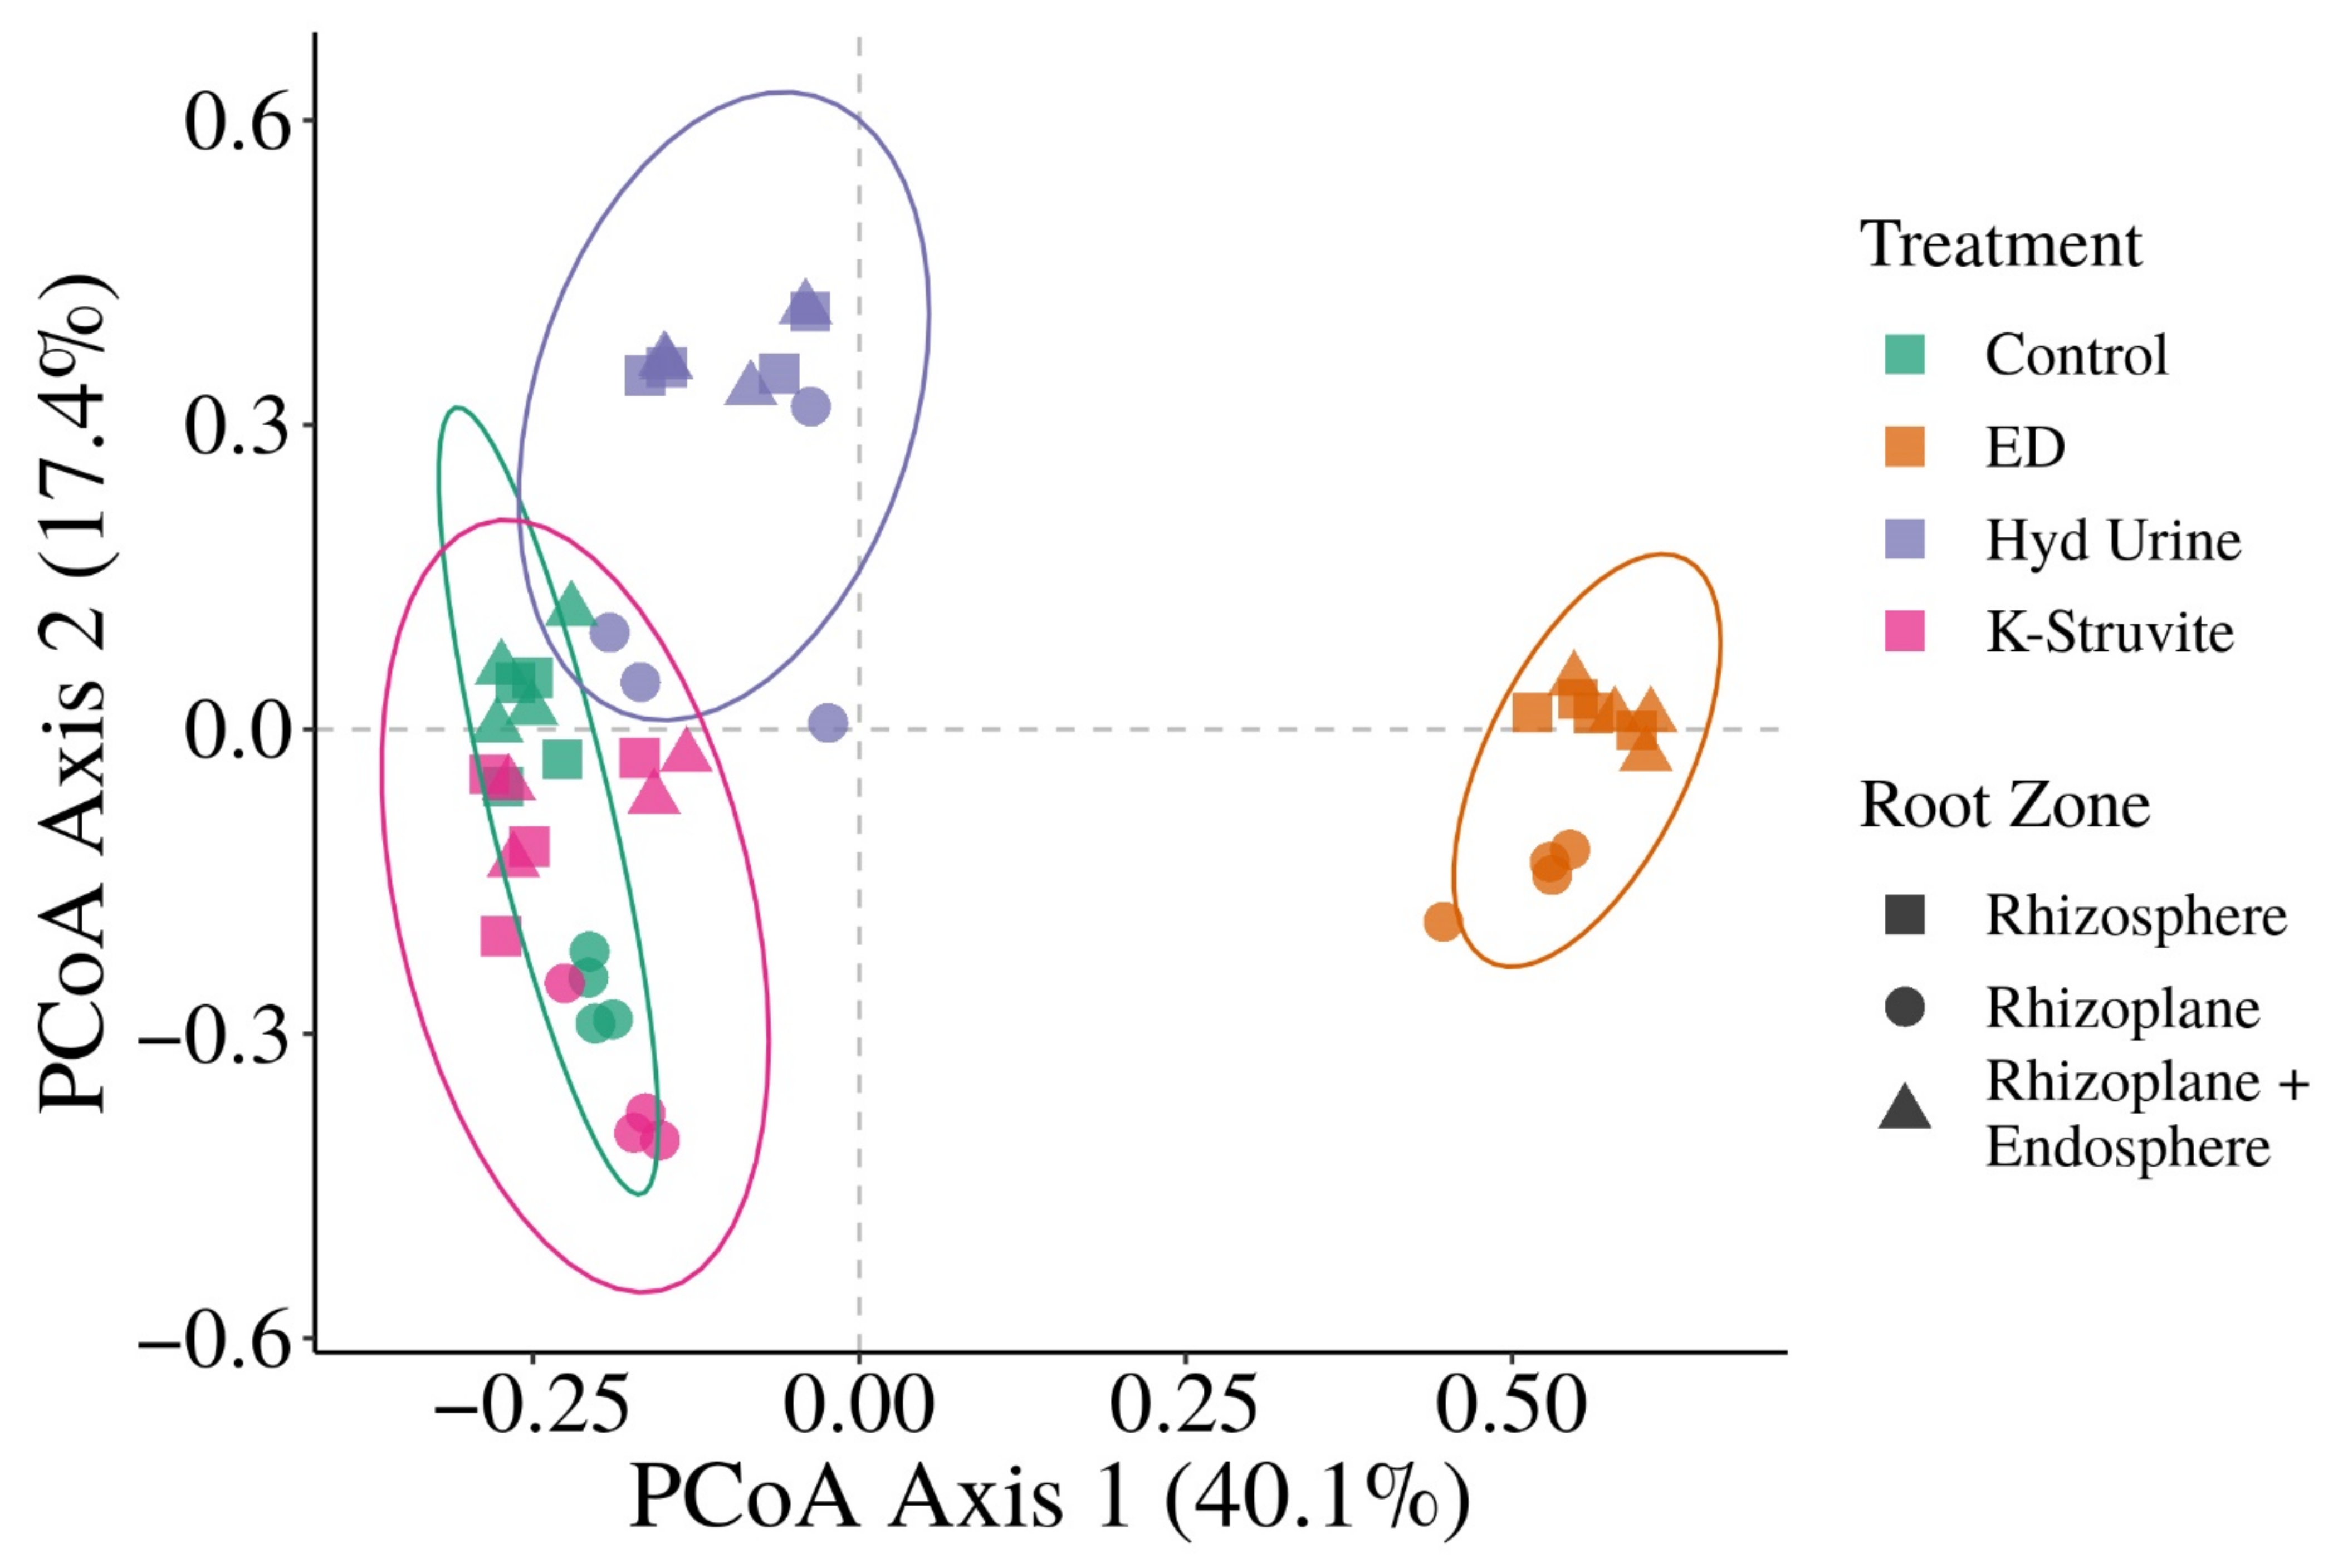
3.2. Does the Application of Urine-Derived Fertilizers Result in Distinct Root-Associated Bacterial Community Structures?
3.3. Are the Key Members of the Community Networks Correlated to Plant Phenotype and Physiology as Affected by the Urine-Derived Fertilizers’ Nutrient Status?
4. Discussion
5. Conclusions
Supplementary Materials
Author Contributions
Funding
Institutional Review Board Statement
Informed Consent Statement
Data Availability Statement
Acknowledgments
Conflicts of Interest
References
- Stewart, W.M.; Dibb, D.W.; Johnston, A.E.; Smyth, T.J. The contribution of commercial fertilizer nutrients to food production. Agron. J. 2005, 97, 1–6. [Google Scholar] [CrossRef]
- Chen, M.; Graedel, T.E. A half-century of global phosphorus flows, stocks, production, consumption, recycling, and environmental impacts. Glob. Environ. Chang. 2016, 36, 139–152. [Google Scholar] [CrossRef]
- Manning, D.A.C. Mineral sources of potassium for plant nutrition. A review. Agron. Sustain. Dev. 2010, 30, 281–294. [Google Scholar] [CrossRef]
- Dawson, C.J.; Hilton, J. Fertiliser availability in a resource-limited world: Production and recycling of nitrogen and phosphorus. Food Policy 2011, 36, S14–S22. [Google Scholar] [CrossRef]
- Bol, R.; Gruau, G.; Mellander, P.E.; Dupas, R.; Bechmann, M.; Skarbøvik, E.; Bieroza, M.; Djodjic, F.; Glendell, M.; Jordan, P.; et al. Challenges of reducing phosphorus based water eutrophication in the agricultural landscapes of Northwest Europe. Front. Mar. Sci. 2018, 5, 276. [Google Scholar] [CrossRef]
- Ganesapillai, M.; Simha, P.; Gupta, K.; Jayan, M. Nutrient Recovery and Recycling from Human Urine: A Circular Perspective on Sanitation and Food Security. In Proceedings of the Procedia Engineering; Elsevier Ltd.: Amsterdam, The Netherlands, 2016; Volume 148, pp. 346–353. [Google Scholar]
- Hilton, S.P.; Keoleian, G.A.; Daigger, G.T.; Zhou, B.; Love, N.G. Life Cycle Assessment of Urine Diversion and Conversion to Fertilizer Products at the City Scale. Environ. Sci. Technol. 2021, 55, 593–603. [Google Scholar] [CrossRef] [PubMed]
- Lam, L.; Kurisu, K.; Hanaki, K. Comparative environmental impacts of source-separation systems for domestic wastewater management in rural China. J. Clean. Prod. 2015, 104, 185–198. [Google Scholar] [CrossRef]
- Harder, R.; Wielemaker, R.; Larsen, T.A.; Zeeman, G.; Öberg, G. Recycling nutrients contained in human excreta to agriculture: Pathways, processes, and products. Crit. Rev. Environ. Sci. Technol. 2019, 49, 695–743. [Google Scholar] [CrossRef]
- Nakao, S.; Nishio, T.; Kanjo, Y. Simultaneous recovery of phosphorus and potassium as magnesium potassium phosphate from synthetic sewage sludge effluent. Environ. Technol. 2017, 38, 2416–2426. [Google Scholar] [CrossRef]
- De Paepe, J.; Lindeboom, R.E.F.; Vanoppen, M.; De Paepe, K.; Demey, D.; Coessens, W.; Lamaze, B.; Verliefde, A.R.D.; Clauwaert, P.; Vlaeminck, S.E. Refinery and concentration of nutrients from urine with electrodialysis enabled by upstream precipitation and nitrification. Water Res. 2018, 144, 76–86. [Google Scholar] [CrossRef] [PubMed]
- Udert, K.M.; Larsen, T.A.; Gujer, W. Fate of major compounds in source-separated urine. Water Sci. Technol. 2006, 54, 413–420. [Google Scholar] [CrossRef] [PubMed]
- Antonini, S.; Arias, M.A.; Eichert, T.; Clemens, J. Greenhouse evaluation and environmental impact assessment of different urine-derived struvite fertilizers as phosphorus sources for plants. Chemosphere 2012, 89, 1202–1210. [Google Scholar] [CrossRef] [PubMed]
- Ricardo, G.P.; López-de-Sá, E.G.; Plaza, C. Lettuce response to phosphorus fertilization with struvite recovered from municipal wastewater. HortScience 2009, 44, 426–430. [Google Scholar] [CrossRef]
- Mchunu, N.; Odindo, A.; Muchaonyerwa, P. The effects of urine and urine-separated plant nutrient sources on growth and dry matter production of perennial ryegrass (Lolium perenne. L). Agric. Water Manag. 2018, 207, 37–43. [Google Scholar] [CrossRef]
- Pandorf, M.; Hochmuth, G.; Boyer, T.H. Human Urine as a Fertilizer in the Cultivation of Snap Beans (Phaseolus vulgaris) and Turnips (Brassica rapa). J. Agric. Food Chem. 2019, 67, 50–62. [Google Scholar] [CrossRef]
- Nagy, J.; Mikola, A.; Pradhan, S.K.; Zseni, A. The utilization of struvite produced from human urine in agriculture as a natural fertilizer: A review. Period. Polytech. Chem. Eng. 2019, 63, 478–484. [Google Scholar] [CrossRef]
- El-Nakhel, C.; Geelen, D.; De Paepe, J.; Clauwaert, P.; De Pascale, S.; Rouphael, Y. An Appraisal of Urine Derivatives Integrated in the Nitrogen and Phosphorus Inputs of a Lettuce Soilless Cultivation System. Sustainability 2021, 13, 4218. [Google Scholar] [CrossRef]
- García-Herrera, P.; Morales, P.; Fernández-Ruiz, V.; Sánchez-Mata, M.C.; Cámara, M.; Carvalho, A.M.; Ferreira, I.C.F.R.; Pardo-de-Santayana, M.; Molina, M.; Tardio, J. Nutrients, phytochemicals and antioxidant activity in wild populations of Allium ampeloprasum L., a valuable underutilized vegetable. Food Res. Int. 2014, 62, 272–279. [Google Scholar] [CrossRef]
- Savvas, D.; Passam, H.C.; Olympios, C.; Nasi, E.; Moustaka, E.; Mantzos, N.; Barouchas, P. Effects of ammonium nitrogen on lettuce grown on pumice in a closed hydroponic system. HortScience 2006, 41, 1667–1673. [Google Scholar] [CrossRef]
- Andrews, M.; Raven, J.A.; Lea, P.J. Do plants need nitrate? the mechanisms by which nitrogen form affects plants. Ann. Appl. Biol. 2013, 163, 174–199. [Google Scholar] [CrossRef]
- Adhikari, N.D.; Simko, I.; Mou, B. Phenomic and physiological analysis of salinity effects on lettuce. Sensors 2019, 19, 4814. [Google Scholar] [CrossRef]
- Tavakkoli, E.; Rengasamy, P.; McDonald, G.K. The response of barley to salinity stress differs between hydroponic and soil systems. Funct. Plant. Biol. 2010, 37, 621–633. [Google Scholar] [CrossRef]
- Berlanga-Clavero, M.V.; Molina-Santiago, C.; de Vicente, A.; Romero, D. More than words: The chemistry behind the interactions in the plant holobiont. Environ. Microbiol. 2020, 22, 4532–4544. [Google Scholar] [CrossRef] [PubMed]
- Lyu, D.; Zajonc, J.; Pagé, A.; Tanney, C.A.S.; Shah, A.; Monjezi, N.; Msimbira, L.A.; Antar, M.; Nazari, M.; Backer, R.; et al. Plant holobiont theory: The phytomicrobiome plays a central role in evolution and success. Microorganisms 2021, 9, 675. [Google Scholar] [CrossRef]
- Garcia, J.; Kao-Kniffin, J. Microbial group dynamics in plant rhizospheres and their implications on nutrient cycling. Front. Microbiol. 2018, 9, 1516. [Google Scholar] [CrossRef] [PubMed]
- Masson-Boivin, C.; Sachs, J.L. Symbiotic nitrogen fixation by rhizobia—The roots of a success story. Curr. Opin. Plant. Biol. 2018, 44, 7–15. [Google Scholar] [CrossRef]
- Hirsch, P.R.; Mauchline, T.H. The Importance of the Microbial N Cycle in Soil for Crop Plant Nutrition. Adv. Appl. Microbiol. 2015, 93, 45–71. [Google Scholar] [CrossRef]
- Näsholm, T.; Kielland, K.; Ganeteg, U. Uptake of organic nitrogen by plants. New Phytol. 2009, 182, 31–48. [Google Scholar] [CrossRef]
- Alori, E.T.; Glick, B.R.; Babalola, O.O. Microbial phosphorus solubilization and its potential for use in sustainable agriculture. Front. Microbiol. 2017, 8, 971. [Google Scholar] [CrossRef]
- Crowley, D.E. Microbial Siderophores in the Plant Rhizosphere. In Iron Nutrition in Plants and Rhizospheric Microorganisms; Springer: Dordrecht, The Netherlands, 2006; pp. 169–198. ISBN 1402047428. [Google Scholar]
- Bhat, M.A.; Kumar, V.; Bhat, M.A.; Wani, I.A.; Dar, F.L.; Farooq, I.; Bhatti, F.; Koser, R.; Rahman, S.; Jan, A.T. Mechanistic Insights of the Interaction of Plant Growth-Promoting Rhizobacteria (PGPR) With Plant Roots Toward Enhancing Plant Productivity by Alleviating Salinity Stress. Front. Microbiol. 2020, 11, 1952. [Google Scholar] [CrossRef]
- Meena, M.; Swapnil, P.; Divyanshu, K.; Kumar, S.; Harish; Tripathi, Y.N.; Zehra, A.; Marwal, A.; Upadhyay, R.S. PGPR-mediated induction of systemic resistance and physiochemical alterations in plants against the pathogens: Current perspectives. J. Basic Microbiol. 2020, 60, 828–861. [Google Scholar]
- Jiao, X.; Takishita, Y.; Zhou, G.; Smith, D.L. Plant Associated Rhizobacteria for Biocontrol and Plant Growth Enhancement. Front. Plant. Sci. 2021, 12, 17. [Google Scholar] [CrossRef] [PubMed]
- Grunert, O.; Robles-Aguilar, A.A.; Hernandez-Sanabria, E.; Schrey, S.D.; Reheul, D.; Van Labeke, M.C.; Vlaeminck, S.E.; Vandekerckhove, T.G.L.; Mysara, M.; Monsieurs, P.; et al. Tomato plants rather than fertilizers drive microbial community structure in horticultural growing media. Sci. Rep. 2019, 9, 1–15. [Google Scholar] [CrossRef]
- Robles-Aguilar, A.A.; Grunert, O.; Hernandez-Sanabria, E.; Mysara, M.; Meers, E.; Boon, N.; Jablonowski, N.D. Effect of Applying Struvite and Organic N as Recovered Fertilizers on the Rhizosphere Dynamics and Cultivation of Lupine (Lupinus angustifolius). Front. Plant. Sci. 2020, 11, 1752. [Google Scholar] [CrossRef]
- Schmidt, J.E.; Kent, A.D.; Brisson, V.L.; Gaudin, A.C.M. Agricultural management and plant selection interactively affect rhizosphere microbial community structure and nitrogen cycling. Microbiome 2019, 7, 1–18. [Google Scholar] [CrossRef] [PubMed]
- Suleiman, A.K.A.; Lourenço, K.S.; Clark, C.; Luz, R.L.; da Silva, G.H.R.; Vet, L.E.M.; Cantarella, H.; Fernandes, T.V.; Kuramae, E.E. From toilet to agriculture: Fertilization with microalgal biomass from wastewater impacts the soil and rhizosphere active microbiomes, greenhouse gas emissions and plant growth. Resour. Conserv. Recycl. 2020, 161, 104924. [Google Scholar] [CrossRef]
- Grunert, O.; Hernandez-Sanabria, E.; Vilchez-Vargas, R.; Jauregui, R.; Pieper, D.H.; Perneel, M.; Van Labeke, M.-C.; Reheul, D.; Boon, N. Mineral and organic growing media have distinct community structure, stability and functionality in soilless culture systems. Sci. Rep. 2016, 6, 18837. [Google Scholar] [CrossRef]
- Van Gerrewey, T.; Vandecruys, M.; Ameloot, N.; Perneel, M.; Van Labeke, M.-C.; Boon, N.; Geelen, D. Microbe–Plant Growing Media Interactions Modulate the Effectiveness of Bacterial Amendments on Lettuce Performance inside a Plant Factory with Artificial Lighting. Agronomy 2020, 10, 1456. [Google Scholar] [CrossRef]
- Bremner, J.M. Total Nitrogen. In Methods of Soil Analysis: Part 2 Chemical and Microbiological Properties, 9.2; John Wiley & Sons, Ltd.: Hoboken, NJ, USA, 1965; pp. 1149–1178. [Google Scholar]
- Pannico, A.; El-Nakhel, C.; Kyriacou, M.C.; Giordano, M.; Stazi, S.R.; De Pascale, S.; Rouphael, Y. Combating Micronutrient Deficiency and Enhancing Food Functional Quality Through Selenium Fortification of Select Lettuce Genotypes Grown in a Closed Soilless System. Front. Plant. Sci. 2019, 10, 1495. [Google Scholar] [CrossRef]
- Lichtenthaler, H.K.; Buschmann, C. Chlorophylls and carotenoids: Measurement and characterization by UV-VIS spectroscopy. Curr. Protoc. Food Anal. Chem. 2001, 1, F4.3.1–F4.3.8. [Google Scholar] [CrossRef]
- Liu, X.; Ardo, S.; Bunning, M.; Parry, J.; Zhou, K.; Stushnoff, C.; Stoniker, F.; Yu, L.; Kendall, P. Total phenolic content and DPPH radical scavenging activity of lettuce (Lactuca sativa L.) grown in Colorado. LWT Food Sci. Technol. 2007, 40, 552–557. [Google Scholar] [CrossRef]
- Re, R.; Pellegrini, N.; Proteggente, A.; Pannala, A.; Yang, M.; Rice-Evans, C. Antioxidant activity applying an improved ABTS radical cation decolorization assay. Free Radic. Biol. Med. 1999, 26, 1231–1237. [Google Scholar] [CrossRef]
- Barillot, C.D.C.; Sarde, C.O.; Bert, V.; Tarnaud, E.; Cochet, N. A standardized method for the sampling of rhizosphere and rhizoplan soil bacteria associated to a herbaceous root system. Ann. Microbiol. 2013, 63, 471–476. [Google Scholar] [CrossRef]
- De Vrieze, J.; Coma, M.; Debeuckelaere, M.; Van der Meeren, P.; Rabaey, K. High salinity in molasses wastewaters shifts anaerobic digestion to carboxylate production. Water Res. 2016, 98, 293–301. [Google Scholar] [CrossRef]
- De Paepe, K.; Kerckhof, F.M.; Verspreet, J.; Courtin, C.M.; Van de Wiele, T. Inter-individual differences determine the outcome of wheat bran colonization by the human gut microbiome. Environ. Microbiol. 2017, 19, 3251–3267. [Google Scholar] [CrossRef] [PubMed]
- Klindworth, A.; Pruesse, E.; Schweer, T.; Peplies, J.; Quast, C.; Horn, M.; Glöckner, F.O. Evaluation of general 16S ribosomal RNA gene PCR primers for classical and next-generation sequencing-based diversity studies. Nucleic Acids Res. 2013, 41, e1. [Google Scholar] [CrossRef] [PubMed]
- Schloss, P.D.; Gevers, D.; Westcott, S.L. Reducing the Effects of PCR Amplification and Sequencing Artifacts on 16S rRNA-Based Studies. PLoS ONE 2011, 6, e27310. [Google Scholar] [CrossRef]
- Kozich, J.J.; Westcott, S.L.; Baxter, N.T.; Highlander, S.K.; Schloss, P.D. Development of a dual-index sequencing strategy and curation pipeline for analyzing amplicon sequence data on the miseq illumina sequencing platform. Appl. Environ. Microbiol. 2013, 79, 5112–5120. [Google Scholar] [CrossRef]
- Wang, Q.; Garrity, G.M.; Tiedje, J.M.; Cole, J.R. Naïve Bayesian classifier for rapid assignment of rRNA sequences into the new bacterial taxonomy. Appl. Environ. Microbiol. 2007, 73, 5261–5267. [Google Scholar] [CrossRef]
- Quast, C.; Pruesse, E.; Yilmaz, P.; Gerken, J.; Schweer, T.; Yarza, P.; Peplies, J.; Glöckner, F.O. The SILVA ribosomal RNA gene database project: Improved data processing and web-based tools. Nucleic Acids Res. 2013, 41, D590–D596. [Google Scholar] [CrossRef]
- R Core Team. R: A Language and Environment for Statistical Computing. R Foundation for Statistical Computing, Vienna, Austria. Available online: https://www.r-project.org/ (accessed on 17 March 2021).
- McMurdie, P.J.; Holmes, S. Phyloseq: An R Package for Reproducible Interactive Analysis and Graphics of Microbiome Census Data. PLoS ONE 2013, 8, e61217. [Google Scholar] [CrossRef] [PubMed]
- Willis, A.; Bunge, J.; Whitman, T. Improved detection of changes in species richness in high diversity microbial communities. J. R. Stat. Soc. Ser. C Appl. Stat. 2017, 66, 963–977. [Google Scholar] [CrossRef]
- Willis, A.D. Rarefaction, alpha diversity, and statistics. Front. Microbiol. 2019, 10, 2407. [Google Scholar] [CrossRef] [PubMed]
- Hurlbert, S.H. The Nonconcept of Species Diversity: A Critique and Alternative Parameters. Ecology 1971, 52, 577–586. [Google Scholar] [CrossRef]
- McMurdie, P.J.; Holmes, S. Waste Not, Want Not: Why Rarefying Microbiome Data Is Inadmissible. PLoS Comput. Biol. 2014, 10, e1003531. [Google Scholar] [CrossRef]
- Mason, N.W.H.; Holdaway, R.J.; Richardson, S.J. Incorporating measurement error in testing for changes in biodiversity. Methods Ecol. Evol. 2018, 9, 1296–1307. [Google Scholar] [CrossRef]
- Willis, A.; Bunge, J. Estimating diversity via frequency ratios. Biometrics 2015, 71, 1042–1049. [Google Scholar] [CrossRef]
- Willis, A.D.; Martin, B.D. Estimating diversity in networked communities. Biostatistics 2020, kxaa015. [Google Scholar] [CrossRef]
- Shannon, C.E. A Mathematical Theory of Communication. Bell Syst. Tech. J. 1948, 27, 379–423. [Google Scholar] [CrossRef]
- Simpson, E.H. Measurement of diversity. Nature 1949, 163, 688. [Google Scholar] [CrossRef]
- Wickham, H. ggplot2: Elegant Graphics for Data Analysis. Available online: https://cran.r-project.org/web/packages/ggplot2/index.html (accessed on 17 March 2021).
- Oksanen, J.; Blanchet, F.G.; Friendly, M.; Kindt, R.; Legendre, P.; McGlinn, D.; Minchin, P.R.; O’Hara, R.B.; Simpson, G.L.; Solymos, P.; et al. Vegan: Community Ecology Package. Available online: https://cran.r-project.org/web/packages/vegan/index.html (accessed on 18 March 2021).
- Love, M.I.; Huber, W.; Anders, S. Moderated estimation of fold change and dispersion for RNA-seq data with DESeq2. Genome Biol. 2014, 15, 1–21. [Google Scholar] [CrossRef] [PubMed]
- Dufrêne, M.; Legendre, P. Species assemblages and indicator species: The need for a flexible asymmetrical approach. Ecol. Monogr. 1997, 67, 345–366. [Google Scholar] [CrossRef]
- De Cáceres, M.; Legendre, P. Associations between species and groups of sites: Indices and statistical inference. Ecology 2009, 90, 3566–3574. [Google Scholar] [CrossRef] [PubMed]
- Zamkovaya, T.; Foster, J.S.; de Crécy-Lagard, V.; Conesa, A. A network approach to elucidate and prioritize microbial dark matter in microbial communities. ISME J. 2021, 15, 228–244. [Google Scholar] [CrossRef]
- Faust, K.; Bauchinger, F.; Laroche, B.; de Buyl, S.; Lahti, L.; Washburne, A.D.; Gonze, D.; Widder, S. Seqtime: Time Series Analysis of Sequencing Data. Available online: https://github.com/hallucigenia-sparsa/seqtime (accessed on 19 March 2021).
- Kurtz, Z.D.; Müller, C.L.; Miraldi, E.R.; Littman, D.R.; Blaser, M.J.; Bonneau, R.A. Sparse and Compositionally Robust Inference of Microbial Ecological Networks. PLoS Comput. Biol. 2015, 11, e1004226. [Google Scholar] [CrossRef]
- Csardi, G.; Nepusz, T. The igraph software package for complex network research. Inter. J. Complex Syst. 2006, 1695, 1–9. [Google Scholar]
- Magwaza, S.T.; Magwaza, L.S.; Odindo, A.O.; Mashilo, J.; Mditshwa, A.; Buckley, C. Evaluating the feasibility of human excreta-derived material for the production of hydroponically grown tomato plants—Part I: Photosynthetic efficiency, leaf gas exchange and tissue mineral content. Agric. Water Manag. 2020, 234, 106114. [Google Scholar] [CrossRef]
- Halbert-Howard, A.; Häfner, F.; Karlowsky, S.; Schwarz, D.; Krause, A. Evaluating recycling fertilizers for tomato cultivation in hydroponics, and their impact on greenhouse gas emissions. Environ. Sci. Pollut. Res. 2020, 1–20. [Google Scholar] [CrossRef]
- Wang, Y.K.; Geng, Y.K.; Pan, X.R.; Sheng, G.P. In situ utilization of generated electricity for nutrient recovery in urine treatment using a selective electrodialysis membrane bioreactor. Chem. Eng. Sci. 2017, 171, 451–458. [Google Scholar] [CrossRef]
- Orsini, F.; Pennisi, G.; Mancarella, S.; Al Nayef, M.; Sanoubar, R.; Nicola, S.; Gianquinto, G. Hydroponic lettuce yields are improved under salt stress by utilizing white plastic film and exogenous applications of proline. Sci. Hortic. 2018, 233, 283–293. [Google Scholar] [CrossRef]
- Zuluaga, M.Y.A.; Milani, K.M.L.; Gonçalves, L.S.A.; De Oliveira, A.L.M. Diversity and plant growth-promoting functions of diazotrophic/N-scavenging bacteria isolated from the soils and rhizospheres of two species of Solanum. PLoS ONE 2020, 15, e0227422. [Google Scholar] [CrossRef]
- Lei, S.; Xu, X.; Cheng, Z.; Xiong, J.; Ma, R.; Zhang, L.; Yang, X.; Zhu, Y.; Zhang, B.; Tian, B. Analysis of the community composition and bacterial diversity of the rhizosphere microbiome across different plant taxa. Microbiologyopen 2019, 8, e00762. [Google Scholar] [CrossRef]
- Trivedi, P.; Leach, J.E.; Tringe, S.G.; Sa, T.; Singh, B.K. Plant–microbiome interactions: From community assembly to plant health. Nat. Rev. Microbiol. 2020, 18, 607–621. [Google Scholar] [CrossRef] [PubMed]
- Olanrewaju, O.S.; Ayangbenro, A.S.; Glick, B.R.; Babalola, O.O. Plant health: Feedback effect of root exudates-rhizobiome interactions. Appl. Microbiol. Biotechnol. 2019, 103, 1155–1166. [Google Scholar] [CrossRef]
- De la Fuente Cantó, C.; Simonin, M.; King, E.; Moulin, L.; Bennett, M.J.; Castrillo, G.; Laplaze, L. An extended root phenotype: The rhizosphere, its formation and impacts on plant fitness. Plant J. 2020, 103, 951–964. [Google Scholar] [CrossRef] [PubMed]
- Mallon, C.A.; Le Roux, X.; Van Doorn, G.S.; Dini-Andreote, F.; Poly, F.; Salles, J.F. The impact of failure: Unsuccessful bacterial invasions steer the soil microbial community away from the invader’s niche. ISME J. 2018, 12, 728–741. [Google Scholar] [CrossRef] [PubMed]
- Moncada, A.; Vetrano, F.; Miceli, A. Alleviation of Salt Stress by Plant Growth-Promoting Bacteria in Hydroponic Leaf Lettuce. Agronomy 2020, 10, 1523. [Google Scholar] [CrossRef]
- Schreiter, S.; Ding, G.C.; Heuer, H.; Neumann, G.; Sandmann, M.; Grosch, R.; Kropf, S.; Smalla, K. Effect of the soil type on the microbiome in the rhizosphere of field-grown lettuce. Front. Microbiol. 2014, 5, 144. [Google Scholar] [CrossRef] [PubMed]
- Adhikari, M.; Yadav, D.R.; Kim, S.W.; Um, Y.H.; Kim, H.S.; Lee, S.C.; Song, J.Y.; Kim, H.G.; Lee, Y.S. Biological control of bacterial fruit blotch of watermelon pathogen (Acidovorax citrulli) with Rhizosphere associated bacteria. Plant Pathol. J. 2017, 33, 170–183. [Google Scholar] [CrossRef] [PubMed]
- Thiele, K.; Smalla, K.; Kropf, S.; Rabenstein, F. Detection of Acidovorax valerianellae, the causing agent of bacterial leaf spots in corn salad [Valerianella locusta (L.) Laterr.], in corn salad seeds. Lett. Appl. Microbiol. 2012, 54, 112–118. [Google Scholar] [CrossRef]
- Saleem, M.; Law, A.D.; Sahib, M.R.; Pervaiz, Z.H.; Zhang, Q. Impact of root system architecture on rhizosphere and root microbiome. Rhizosphere 2018, 6, 47–51. [Google Scholar] [CrossRef]
- Maynaud, G.; Willems, A.; Soussou, S.; Vidal, C.; Mauré, L.; Moulin, L.; Cleyet-Marel, J.C.; Brunel, B. Molecular and phenotypic characterization of strains nodulating Anthyllis vulneraria in mine tailings, and proposal of Aminobacter anthyllidis sp. nov., the first definition of Aminobacter as legume-nodulating bacteria. Syst. Appl. Microbiol. 2012, 35, 65–72. [Google Scholar] [CrossRef] [PubMed]
- Wang, X.; Zhu, H.; Yan, B.; Shutes, B.; Bañuelos, G.; Cheng, R. Response of the microbial community to salt stress and its stratified effect in constructed wetlands. Environ. Sci. Pollut. Res. 2021, 28, 18089–18101. [Google Scholar] [CrossRef]
- Van Teeseling, M.C.F.; Mesman, R.J.; Kuru, E.; Espaillat, A.; Cava, F.; Brun, Y.V.; Vannieuwenhze, M.S.; Kartal, B.; Van Niftrik, L. Anammox Planctomycetes have a peptidoglycan cell wall. Nat. Commun. 2015, 6, 6878. [Google Scholar] [CrossRef]
- Kim, H.; Kang, H.; Joh, K. Allopseudarcicella aquatilis gen. Nov., sp. nov., isolated from freshwater. Int. J. Syst. Evol. Microbiol. 2019, 69, 3574–3580. [Google Scholar] [CrossRef]
- Ramaprasad, E.V.V.; Sasikala, C.; Ramana, C.V. Flectobacillus rhizosphaerae sp. Nov., isolated from the rhizosphere soil of oryza sativa (L.), and emended description of the genus flectobacillus. Int. J. Syst. Evol. Microbiol. 2015, 65, 3451–3456. [Google Scholar] [CrossRef] [PubMed]
- Diep, C.N. Phosphate and Potassium Solubilizing Bacteria from Weathered Materials of denatured Rock Mountain, Ha Tien, Kien Giang Province, Vietnam. Am. J. Life Sci. 2013, 1, 88. [Google Scholar] [CrossRef]
- Phour, M.; Sindhu, S.S. Amelioration of salinity stress and growth stimulation of mustard (Brassica juncea L.) by salt-tolerant Pseudomonas species. Appl. Soil Ecol. 2020, 149, 103518. [Google Scholar] [CrossRef]
- Fatima, T.; Arora, N.K. Pseudomonas entomophila PE3 and its exopolysaccharides as biostimulants for enhancing growth, yield and tolerance responses of sunflower under saline conditions. Microbiol. Res. 2021, 244, 126671. [Google Scholar] [CrossRef]
- Vives-Peris, V.; Gómez-Cadenas, A.; Pérez-Clemente, R.M. Salt stress alleviation in citrus plants by plant growth-promoting rhizobacteria Pseudomonas putida and Novosphingobium sp. Plant Cell Rep. 2018, 37, 1557–1569. [Google Scholar] [CrossRef]
- Yasmin, H.; Naeem, S.; Bakhtawar, M.; Jabeen, Z.; Nosheen, A.; Naz, R.; Keyani, R.; Mumtaz, S.; Hassan, M.N. Halotolerant rhizobacteria Pseudomonas pseudoalcaligenes and Bacillus subtilis mediate systemic tolerance in hydroponically grown soybean (Glycine max L.) against salinity stress. PLoS ONE 2020, 15, e0231348. [Google Scholar] [CrossRef]
- Cipriano, M.A.P.; Lupatini, M.; Lopes-Santos, L.; da Silva, M.J.; Roesch, L.F.W.; Destéfano, S.A.L.; Freitas, S.S.; Kuramae, E.E. Lettuce and rhizosphere microbiome responses to growth promoting Pseudomonas species under field conditions. FEMS Microbiol. Ecol. 2016, 92, fiw197. [Google Scholar] [CrossRef]
- Cui, Y.; Chun, S.J.; Ko, S.R.; Lee, H.G.; Srivastava, A.; Oh, H.M.; Ahn, C.Y. Reyranella aquatilis sp. Nov., an alphaproteobacterium isolated from a eutrophic lake. Int. J. Syst. Evol. Microbiol. 2017, 67, 3496–3500. [Google Scholar] [CrossRef] [PubMed]
- Chen, S.; Qi, G.; Ma, G.; Zhao, X. Biochar amendment controlled bacterial wilt through changing soil chemical properties and microbial community. Microbiol. Res. 2020, 231, 126373. [Google Scholar] [CrossRef]
- Van Bruggen, A.H.C. Corky Root of Lettuce in California Caused by a Gram-Negative Bacterium. Phytopathology 1988, 78, 1139. [Google Scholar] [CrossRef]
- Van Bruggen, A.H.C.; Francis, I.M.; Jochimsen, K.N. Non-pathogenic rhizosphere bacteria belonging to the genera Rhizorhapis and Sphingobium provide specific control of lettuce corky root disease caused by species of the same bacterial genera. Plant Pathol. 2014, 63, 1384–1394. [Google Scholar] [CrossRef]
- Yu, R.-Q.; Kurt, Z.; He, F.; Spain, J.C. Biodegradation of the Allelopathic Chemical Pterostilbene by a Sphingobium sp. Strain from the Peanut Rhizosphere. Appl. Environ. Microbiol. 2018, 85, 1–12. [Google Scholar] [CrossRef] [PubMed]
- Weinert, N.; Meincke, R.; Gottwald, C.; Radl, V.; Dong, X.; Schloter, M.; Berg, G.; Smalla, K. Effects of genetically modified potatoes with increased zeaxanthin content on the abundance and diversity of rhizobacteria with in vitro antagonistic activity do not exceed natural variability among cultivars. Plant Soil 2010, 326, 437–452. [Google Scholar] [CrossRef]
- Araujo, R.; Dunlap, C.; Barnett, S.; Franco, C.M.M. Decoding Wheat Endosphere–Rhizosphere Microbiomes in Rhizoctonia solani–Infested Soils Challenged by Streptomyces Biocontrol Agents. Front. Plant Sci. 2019, 10, 1038. [Google Scholar] [CrossRef]
- Yin, C.; Hulbert, S.H.; Schroeder, K.L.; Mavrodi, O.; Mavrodi, D.; Dhingra, A.; Schillinger, W.F.; Paulitz, T.C. Role of bacterial communities in the natural suppression of Rhizoctonia solani bare patch disease of wheat (Triticum aestivum L.). Appl. Environ. Microbiol. 2013, 79, 7428–7438. [Google Scholar] [CrossRef]
- Kuffner, M.; De Maria, S.; Puschenreiter, M.; Fallmann, K.; Wieshammer, G.; Gorfer, M.; Strauss, J.; Rivelli, A.R.; Sessitsch, A. Culturable bacteria from Zn- and Cd-accumulating Salix caprea with differential effects on plant growth and heavy metal availability. J. Appl. Microbiol. 2010, 108, 1471–1484. [Google Scholar] [CrossRef] [PubMed]
- Chun, J.; Kang, J.Y.; Joung, Y.; Kim, H.; Joh, K.; Jahng, K.Y. Dyadobacter jejuensis sp. nov., isolated from seawater. Int. J. Syst. Evol. Microbiol. 2013, 63, 1788–1792. [Google Scholar] [CrossRef] [PubMed]
- Spence, C.; Alff, E.; Johnson, C.; Ramos, C.; Donofrio, N.; Sundaresan, V.; Bais, H. Natural rice rhizospheric microbes suppress rice blast infections. BMC Plant Biol. 2014, 14, 130. [Google Scholar] [CrossRef] [PubMed]
- Prakash, O.; Green, S.J.; Jasrotia, P.; Overholt, W.A.; Canion, A.; Watson, D.B.; Brooks, S.C.; Kostka, J.E. Rhodanobacter denitrificans sp. nov., isolated from nitrate-rich zones of a contaminated aquifer. Int. J. Syst. Evol. Microbiol. 2012, 62, 2457–2462. [Google Scholar] [CrossRef] [PubMed]
- Lee, S.A.; Kanth, B.K.; Kim, H.S.; Kim, T.W.; Sang, M.K.; Song, J.; Weon, H.Y. Complete genome sequence of the plant growth-promoting endophytic bacterium Rhodanobacter glycinis T01E-68 isolated from tomato (Solanum lycopersicum L.) plant roots. Korean J. Microbiol. 2019, 55, 422–424. [Google Scholar] [CrossRef]
- Huo, Y.; Kang, J.P.; Park, J.K.; Li, J.; Chen, L.; Yang, D.C. Rhodanobacter ginsengiterrae sp. nov., an antagonistic bacterium against root rot fungal pathogen Fusarium solani, isolated from ginseng rhizospheric soil. Arch. Microbiol. 2018, 200, 1457–1463. [Google Scholar] [CrossRef]
- Shoebitz, M.; Ribaudo, C.M.; Pardo, M.A.; Cantore, M.L.; Ciampi, L.; Curá, J.A. Plant growth promoting properties of a strain of Enterobacter ludwigii isolated from Lolium perenne rhizosphere. Soil Biol. Biochem. 2009, 41, 1768–1774. [Google Scholar] [CrossRef]
- Madhaiyan, M.; Poonguzhali, S.; Lee, J.S.; Saravanan, V.S.; Lee, K.C.; Santhanakrishnan, P. Enterobacter arachidis sp. nov., a plant-growth-promoting diazotrophic bacterium isolated from rhizosphere soil of groundnut. Int. J. Syst. Evol. Microbiol. 2010, 60, 1559–1564. [Google Scholar] [CrossRef]
- Chen, W.M.; Laevens, S.; Lee, T.M.; Coenye, T.; De Vos, P.; Mergeay, M.; Vandamme, P. Ralstonia taiwanensis sp. nov., isolated from root nodules of Mimosa species and sputum of a cystic fibrosis patient. Int. J. Syst. Evol. Microbiol. 2001, 51, 1729–1735. [Google Scholar] [CrossRef]
- Vandamme, P.; Coenye, T. Taxonomy of the genus Cupriavidus: A tale of lost and found. Int. J. Syst. Evol. Microbiol. 2004, 54, 2285–2289. [Google Scholar] [CrossRef]
- Estrada-de los Santos, P.; Vacaseydel-Aceves, N.B.; Martínez-Aguilar, L.; Cruz-Hernández, M.A.; Mendoza-Herrera, A.; Caballero-Mellado, J. Cupriavidus and Burkholderia species associated with agricultural plants that grow in alkaline soils. J. Microbiol. 2011, 49, 867–876. [Google Scholar] [CrossRef]
- Estrada-de los Santos, P.; Martínez-Aguilar, L.; López-Lara, I.M.; Caballero-Mellado, J. Cupriavidus alkaliphilus sp. nov., a new species associated with agricultural plants that grow in alkaline soils. Syst. Appl. Microbiol. 2012, 35, 310–314. [Google Scholar] [CrossRef]
- Peeters, N.; Guidot, A.; Vailleau, F.; Valls, M. Ralstonia solanacearum, a widespread bacterial plant pathogen in the post-genomic era. Mol. Plant. Pathol. 2013, 14, 651–662. [Google Scholar] [CrossRef]
- Berrios, L.; Ely, B. Plant growth enhancement is not a conserved feature in the Caulobacter genus. Plant Soil 2020, 449, 81–95. [Google Scholar] [CrossRef]
- Liao, H.; Zheng, C.; Long, J.; Guzmán, I. Effects of biochar amendment on tomato rhizosphere bacterial communities and their utilization of plant-derived carbon in a calcareous soil. Geoderma 2021, 396, 115082. [Google Scholar] [CrossRef]
- Rivas, R.; Velázquez, E.; Willems, A.; Vizcaíno, N.; Subba-Rao, N.S.; Mateos, P.F.; Gillis, M.; Dazzo, F.B.; Martínez-Molina, E. A new species of Devosia that forms a unique nitrogen-fixing root-nodule symbiosis with the aquatic legume Neptunia natans (L.f.) Druce. Appl. Environ. Microbiol. 2002, 68, 5217–5222. [Google Scholar] [CrossRef] [PubMed]
- Banerjee, S.; Kirkby, C.A.; Schmutter, D.; Bissett, A.; Kirkegaard, J.A.; Richardson, A.E. Network analysis reveals functional redundancy and keystone taxa amongst bacterial and fungal communities during organic matter decomposition in an arable soil. Soil Biol. Biochem. 2016, 97, 188–198. [Google Scholar] [CrossRef]
- Yue, Y.; Shao, T.; Long, X.; He, T.; Gao, X.; Zhou, Z.; Liu, Z.; Rengel, Z. Microbiome structure and function in rhizosphere of Jerusalem artichoke grown in saline land. Sci. Total Environ. 2020, 724, 138259. [Google Scholar] [CrossRef] [PubMed]
- Li, B.; Xu, R.; Sun, X.; Han, F.; Xiao, E.; Chen, L.; Qiu, L.; Sun, W. Microbiome–environment interactions in antimony-contaminated rice paddies and the correlation of core microbiome with arsenic and antimony contamination. Chemosphere 2021, 263, 128227. [Google Scholar] [CrossRef]
- Rostampour Yasouri, S.; Doudi, M.; Ghane, M.; Sadat Naghavi, N.; Rezaei, A. The effect of environmental stresses on lipL32 gene expression in pathogenic leptospira spp. Through real-time PCR. Pol. J. Microbiol. 2020, 69, 301–310. [Google Scholar] [CrossRef]
- Asaf, S.; Numan, M.; Khan, A.L.; Al-Harrasi, A. Sphingomonas: From diversity and genomics to functional role in environmental remediation and plant growth. Crit. Rev. Biotechnol. 2020, 40, 138–152. [Google Scholar] [CrossRef] [PubMed]
- Chen, W.M.; Yang, S.H.; Young, C.C.; Sheu, S.Y. Arcicella rigui sp. nov., isolated from water of a wetland, and emended descriptions of the genus Arcicella, Arcicella aquatica, Arcicella rosea and Arcicella aurantiaca. Int. J. Syst. Evol. Microbiol. 2013, 63, 134–140. [Google Scholar] [CrossRef] [PubMed]
- Abraham, W.; Macedo, A.J.; Lünsdorf, H.; Nikitin, D.I. Arcicella Bergey’s Man. Syst. Archaea Bact. 2015, 1–5. [Google Scholar] [CrossRef]
- Hou, J.; Liu, W.; Wang, B.; Wang, Q.; Luo, Y.; Franks, A.E. PGPR enhanced phytoremediation of petroleum contaminated soil and rhizosphere microbial community response. Chemosphere 2015, 138, 592–598. [Google Scholar] [CrossRef] [PubMed]
- Thierry, S.; Macarie, H.; Iizuka, T.; Geißdörfer, W.; Assih, E.A.; Spanevello, M.; Verhe, F.; Thomas, P.; Fudou, R.; Monroy, O.; et al. Pseudoxanthomonas mexicana sp. nov. and Pseudoxanthomonas japonensis sp. nov., isolated from diverse environments, and emended descriptions of the genus Pseudoxanthomonas Finkmann et al. 2000 and of its type species. Int. J. Syst. Evol. Microbiol. 2004, 54, 2245–2255. [Google Scholar] [CrossRef]
- Akter, S.; Jo, H.; Du, J.; Won, K.H.; Yin, C.S.; Kook, M.C.; Yu, H.; Choi, H.S.; Kim, M.K.; Yi, T.H. Pseudoxanthomonas humi sp. nov., a bacterium isolated from rhizospheric soil of Fraxinus chinensis in Gyeonggi Province, South Korea. Arch. Microbiol. 2015, 197, 1165–1172. [Google Scholar] [CrossRef] [PubMed]
- Hu, Y.; Li, J.; Li, J.; Zhang, F.; Wang, J.; Mo, M.; Liu, Y. Biocontrol efficacy of Pseudoxanthomonas japonensis against Meloidogyne incognita and its nematostatic metabolites. FEMS Microbiol. Lett. 2019, 366, 287. [Google Scholar] [CrossRef]
- Contreras Sánchez-Matamoros, R.; Gil-Serrano, A.M.; Espuny, M.R.; Ollero, F.J.; Megías, M.; Rodríguez-Carvajal, M.A. Structure of surface polysaccharides from Aeromonas sp. AMG272, a plant-growth promoting rhizobacterium isolated from rice rhizosphere. Carbohydr. Res. 2018, 462, 1–6. [Google Scholar] [CrossRef]
- Fernández-Bravo, A.; Figueras, M.J. An Update on the Genus Aeromonas: Taxonomy, Epidemiology, and Pathogenicity. Microorganisms 2020, 8, 129. [Google Scholar] [CrossRef]
- Mukhtar, S.; Mirza, B.S.; Mehnaz, S.; Mirza, M.S.; Mclean, J.; Malik, K.A. Impact of soil salinity on the microbial structure of halophyte rhizosphere microbiome. World J. Microbiol. Biotechnol. 2018, 34, 136. [Google Scholar] [CrossRef] [PubMed]
- Ngo, H.T.T.; Kook, M.C.; Yi, T.H. Pedobacter ureilyticus sp. Nov., isolated from tomato rhizosphere soil. Int. J. Syst. Evol. Microbiol. 2015, 65, 1008–1014. [Google Scholar] [CrossRef]
- Kwon, S.W.; Son, J.A.; Kim, S.J.; Kim, Y.S.; Park, I.C.; Bok, J.I.; Weon, H.Y. Pedobacter rhizosphaerae sp. nov. and Pedobacter soli sp. nov., isolated from rhizosphere soil of Chinese cabbage (Brassica campestris). Int. J. Syst. Evol. Microbiol. 2011, 61, 2874–2879. [Google Scholar] [CrossRef]
- Vanparys, B.; Heylen, K.; Lebbe, L.; De Vos, P. Pedobacter caeni sp. nov., a novel species isolated from a nitrifying inoculum. Int. J. Syst. Evol. Microbiol. 2005, 55, 1315–1318. [Google Scholar] [CrossRef]
- Kim, D.U.; Kim, Y.J.; Shin, D.H.; Weon, H.Y.; Kwon, S.W.; Seong, C.N.; Ka, J.O. Pedobacter namyangjuensis sp. nov. isolated from soil and reclassification of Nubsella zeaxanthinifaciens Asker et al. 2008 as Pedobacter zeaxanthinifaciens comb. nov. J. Microbiol. 2013, 51, 25–30. [Google Scholar] [CrossRef]
- Seo, J.H.; Kang, I.; Yang, S.J.; Cho, J.C. Characterization of spatial distribution of the bacterial community in the South Sea of Korea. PLoS ONE 2017, 12, e0174159. [Google Scholar] [CrossRef]
- Apprill, A.; Hughen, K.; Mincer, T. Major similarities in the bacterial communities associated with lesioned and healthy Fungiidae corals. Environ. Microbiol. 2013, 15, 2063–2072. [Google Scholar] [CrossRef] [PubMed]
- Edmonds, J.W.; Sackett, J.D.; Lomprey, H.; Hudson, H.L.; Moser, D.P. The aeroponic rhizosphere microbiome: Community dynamics in early succession suggest strong selectional forces. Antonie van Leeuwenhoek. Int. J. Gen. Mol. Microbiol. 2020, 113, 83–99. [Google Scholar] [CrossRef]
- Correa-Galeote, D.; Bedmar, E.J.; Arone, G.J. Maize Endophytic Bacterial Diversity as Affected by Soil Cultivation History. Front. Microbiol. 2018, 9, 484. [Google Scholar] [CrossRef] [PubMed]
- Im, W.T.; Hu, Z.Y.; Kim, K.H.; Rhee, S.K.; Meng, H.; Lee, S.T.; Quan, Z.X. Description of fimbriimonas ginsengisoli gen. nov., sp. nov. within the fimbriimonadia class nov., of the phylum armatimonadetes. Antonie van Leeuwenhoek. Int. J. Gen. Mol. Microbiol. 2012, 102, 307–317. [Google Scholar] [CrossRef]
- Rahlff, J.; Giebel, H.A.; Stolle, C.; Wurl, O.; Probst, A.J.; Herlemann, D.P.R. Overlooked diversity of ultramicrobacterial minorities at the air-sea interface. Atmosphere 2020, 11, 1214. [Google Scholar] [CrossRef]
- Lopez, S.; Goux, X.; van der Ent, A.; Erskine, P.D.; Echevarria, G.; Calusinska, M.; Morel, J.L.; Benizri, E. Bacterial community diversity in the rhizosphere of nickel hyperaccumulator species of Halmahera Island (Indonesia). Appl. Soil Ecol. 2019, 133, 70–80. [Google Scholar] [CrossRef]
- Görtz, H.; Schmidt, H.J. Holosporaceae fam. nov. Bergey’s Man. Syst. Archaea Bact. 2015, 1–6. [Google Scholar] [CrossRef]
- Cope-Selby, N.; Cookson, A.; Squance, M.; Donnison, I.; Flavell, R.; Farrar, K. Endophytic bacteria in Miscanthus seed: Implications for germination, vertical inheritance of endophytes, plant evolution and breeding. GCB Bioenergy 2017, 9, 57–77. [Google Scholar] [CrossRef]
- Xie, C.H.; Yokota, A. Zoogloea oryzae sp. nov., a nitrogen-fixing bacterium isolated from rice paddy soil, and reclassification of the strain ATCC 19623 as Crabtreella saccharophila gen. nov., sp. nov. Int. J. Syst. Evol. Microbiol. 2006, 56, 619–624. [Google Scholar] [CrossRef]
- Dahal, R.H.; Chaudhary, D.K.; Kim, D.U.; Kim, J. Zoogloea dura sp. Nov., a n2-fixing bacterium isolated from forest soil and emendation of the genus zoogloea and the species zoogloea oryzae and zoogloea ramigera. Int. J. Syst. Evol. Microbiol. 2020, 70, 5312–5318. [Google Scholar] [CrossRef] [PubMed]
- Felföldi, T.; Vengring, A.; Kéki, Z.; Márialigeti, K.; Schumann, P.; Tóth, E.M. Eoetvoesia caeni gen. nov., sp. nov., isolated from an activated sludge system treating coke plant effluent. Int. J. Syst. Evol. Microbiol. 2014, 64, 1920–1925. [Google Scholar] [CrossRef]
- Wolińska, A.; Kuźniar, A.; Gałązka, A. Biodiversity in the Rhizosphere of Selected Winter Wheat (Triticum aestivum L.) Cultivars—Genetic and Catabolic Fingerprinting. Agronomy 2020, 10, 953. [Google Scholar] [CrossRef]
- Xia, F.; Ou-Yang, T.N.; Gao, Z.H.; Qiu, L.H. Edaphobacter flagellatus sp. Nov. and edaphobacter bradus sp. nov., two acidobacteria isolated from forest soil. Int. J. Syst. Evol. Microbiol. 2018, 68, 2530–2537. [Google Scholar] [CrossRef]
- Miralles, I.; Soria, R.; Lucas-Borja, M.E.; Soriano, M.; Ortega, R. Effect of biocrusts on bacterial community composition at different soil depths in Mediterranean semi-arid ecosystems. Sci. Total Environ. 2020, 733, 138613. [Google Scholar] [CrossRef]
- Reis, V.M.; Teixeira, K.R. dos S. Nitrogen fixing bacteria in the family Acetobacteraceae and their role in agriculture. J. Basic Microbiol. 2015, 55, 931–949. [Google Scholar] [CrossRef]
- Loganathan, P.; Nair, S. Swaminathania salitolerans gen. nov., sp. nov., a salt-tolerant, nitrogen-fixing and phosphate-solubilizing bacterium from wild rice (Porteresia coarctata Tateoka). Int. J. Syst. Evol. Microbiol. 2004, 54, 1185–1190. [Google Scholar] [CrossRef]
- Saravanan, V.S.; Madhaiyan, M.; Osborne, J.; Thangaraju, M.; Sa, T.M. Ecological occurrence of Gluconacetobacter diazotrophicus and nitrogen-fixing Acetobacteraceae members: Their possible role in plant growth promotion. Microb. Ecol. 2008, 55, 130–140. [Google Scholar] [CrossRef]
- Ofek, M.; Hadar, Y.; Minz, D. Ecology of root colonizing Massilia (Oxalobacteraceae). PLoS ONE 2012, 7, e40117. [Google Scholar] [CrossRef]
- Sheridan, C.; Depuydt, P.; De Ro, M.; Petit, C.; Van Gysegem, E.; Delaere, P.; Dixon, M.; Stasiak, M.; Aciksöz, S.B.; Frossard, E.; et al. Microbial Community Dynamics and Response to Plant Growth-Promoting Microorganisms in the Rhizosphere of Four Common Food Crops Cultivated in Hydroponics. Microb. Ecol. 2017, 73, 378–393. [Google Scholar] [CrossRef] [PubMed]
- Lee, J.C.; Song, J.S.; Whang, K.S. Sphingobium pinisoli sp. nov., isolated from the rhizosphere soil of a Korean native pine tree. Antonie van Leeuwenhoek. Int. J. Gen. Mol. Microbiol. 2019, 112, 815–825. [Google Scholar] [CrossRef]
- Francis, I.M.; Jochimsen, K.N.; De Vos, P.; van Bruggen, A.H.C. Reclassification of rhizosphere bacteria including strains causing corky root of lettuce and proposal of Rhizorhapis suberifaciens gen. nov., comb. nov., Sphingobium mellinum sp. nov., Sphingobium xanthum sp. nov. and Rhizorhabdus argentea gen. nov., sp. Int. J. Syst. Evol. Microbiol. 2014, 64, 1340–1350. [Google Scholar] [CrossRef] [PubMed]
- Chen, L.; Gao, X.; Ma, Q.; Liu, H.; Wang, X.; Xu, Y.; Liu, Y. Dyadobacter luteus sp. nov., isolated from rose rhizosphere soil. Arch. Microbiol. 2020, 202, 191–196. [Google Scholar] [CrossRef] [PubMed]
- Lee, H.; Kim, D.U.; Lee, S.; Park, S.; Yoon, J.H.; Seong, C.N.; Ka, J.O. Reyranella terrae sp. Nov., isolated from an agricultural soil, and emended description of the genus Reyranella. Int. J. Syst. Evol. Microbiol. 2017, 67, 2031–2035. [Google Scholar] [CrossRef] [PubMed]
- Fuentes, A.; Herrera, H.; Charles, T.C.; Arriagada, C. Fungal and bacterial microbiome associated with the rhizosphere of native plants from the atacama desert. Microorganisms 2020, 8, 209. [Google Scholar] [CrossRef] [PubMed]
- Kim, S.J.; Ahn, J.H.; Lee, T.H.; Weon, H.Y.; Hong, S.B.; Seok, S.J.; Whang, K.S.; Kwon, S.W. Reyranella soli sp. nov., isolated from forest soil, and emended description of the genus Reyranella Pagnier et al. 2011. Int. J. Syst. Evol. Microbiol. 2013, 63, 3164–3167. [Google Scholar] [CrossRef]
- Das, S.; Chou, M.L.; Jean, J.S.; Yang, H.J.; Kim, P.J. Arsenic-enrichment enhanced root exudates and altered rhizosphere microbial communities and activities in hyperaccumulator Pteris vittata. J. Hazard. Mater. 2017, 325, 279–287. [Google Scholar] [CrossRef] [PubMed]
- Chen, X.G.; Geng, A.L.; Yan, R.; Gould, W.D.; Ng, Y.L.; Liang, D.T. Isolation and characterization of sulphur-oxidizing Thiomonas sp. and its potential application in biological deodorization. Lett. Appl. Microbiol. 2004, 39, 495–503. [Google Scholar] [CrossRef] [PubMed]
- Bruneel, O.; Personné, J.C.; Casiot, C.; Leblanc, M.; Elbaz-Poulichet, F.; Mahler, B.J.; Le Flèche, A.; Grimont, P.A.D. Mediation of arsenic oxidation by Thiomonas sp. in acid-mine drainage (Carnoulès, France). J. Appl. Microbiol. 2003, 95, 492–499. [Google Scholar] [CrossRef] [PubMed]


Publisher’s Note: MDPI stays neutral with regard to jurisdictional claims in published maps and institutional affiliations. |
© 2021 by the authors. Licensee MDPI, Basel, Switzerland. This article is an open access article distributed under the terms and conditions of the Creative Commons Attribution (CC BY) license (https://creativecommons.org/licenses/by/4.0/).
Share and Cite
Van Gerrewey, T.; El-Nakhel, C.; De Pascale, S.; De Paepe, J.; Clauwaert, P.; Kerckhof, F.-M.; Boon, N.; Geelen, D. Root-Associated Bacterial Community Shifts in Hydroponic Lettuce Cultured with Urine-Derived Fertilizer. Microorganisms 2021, 9, 1326. https://doi.org/10.3390/microorganisms9061326
Van Gerrewey T, El-Nakhel C, De Pascale S, De Paepe J, Clauwaert P, Kerckhof F-M, Boon N, Geelen D. Root-Associated Bacterial Community Shifts in Hydroponic Lettuce Cultured with Urine-Derived Fertilizer. Microorganisms. 2021; 9(6):1326. https://doi.org/10.3390/microorganisms9061326
Chicago/Turabian StyleVan Gerrewey, Thijs, Christophe El-Nakhel, Stefania De Pascale, Jolien De Paepe, Peter Clauwaert, Frederiek-Maarten Kerckhof, Nico Boon, and Danny Geelen. 2021. "Root-Associated Bacterial Community Shifts in Hydroponic Lettuce Cultured with Urine-Derived Fertilizer" Microorganisms 9, no. 6: 1326. https://doi.org/10.3390/microorganisms9061326
APA StyleVan Gerrewey, T., El-Nakhel, C., De Pascale, S., De Paepe, J., Clauwaert, P., Kerckhof, F.-M., Boon, N., & Geelen, D. (2021). Root-Associated Bacterial Community Shifts in Hydroponic Lettuce Cultured with Urine-Derived Fertilizer. Microorganisms, 9(6), 1326. https://doi.org/10.3390/microorganisms9061326