
Further Studies on the 3-Ketosteroid 9α-Hydroxylase of Rhodococcus ruber Chol-4, a Rieske Oxygenase of the Steroid Degradation Pathway


Abstract
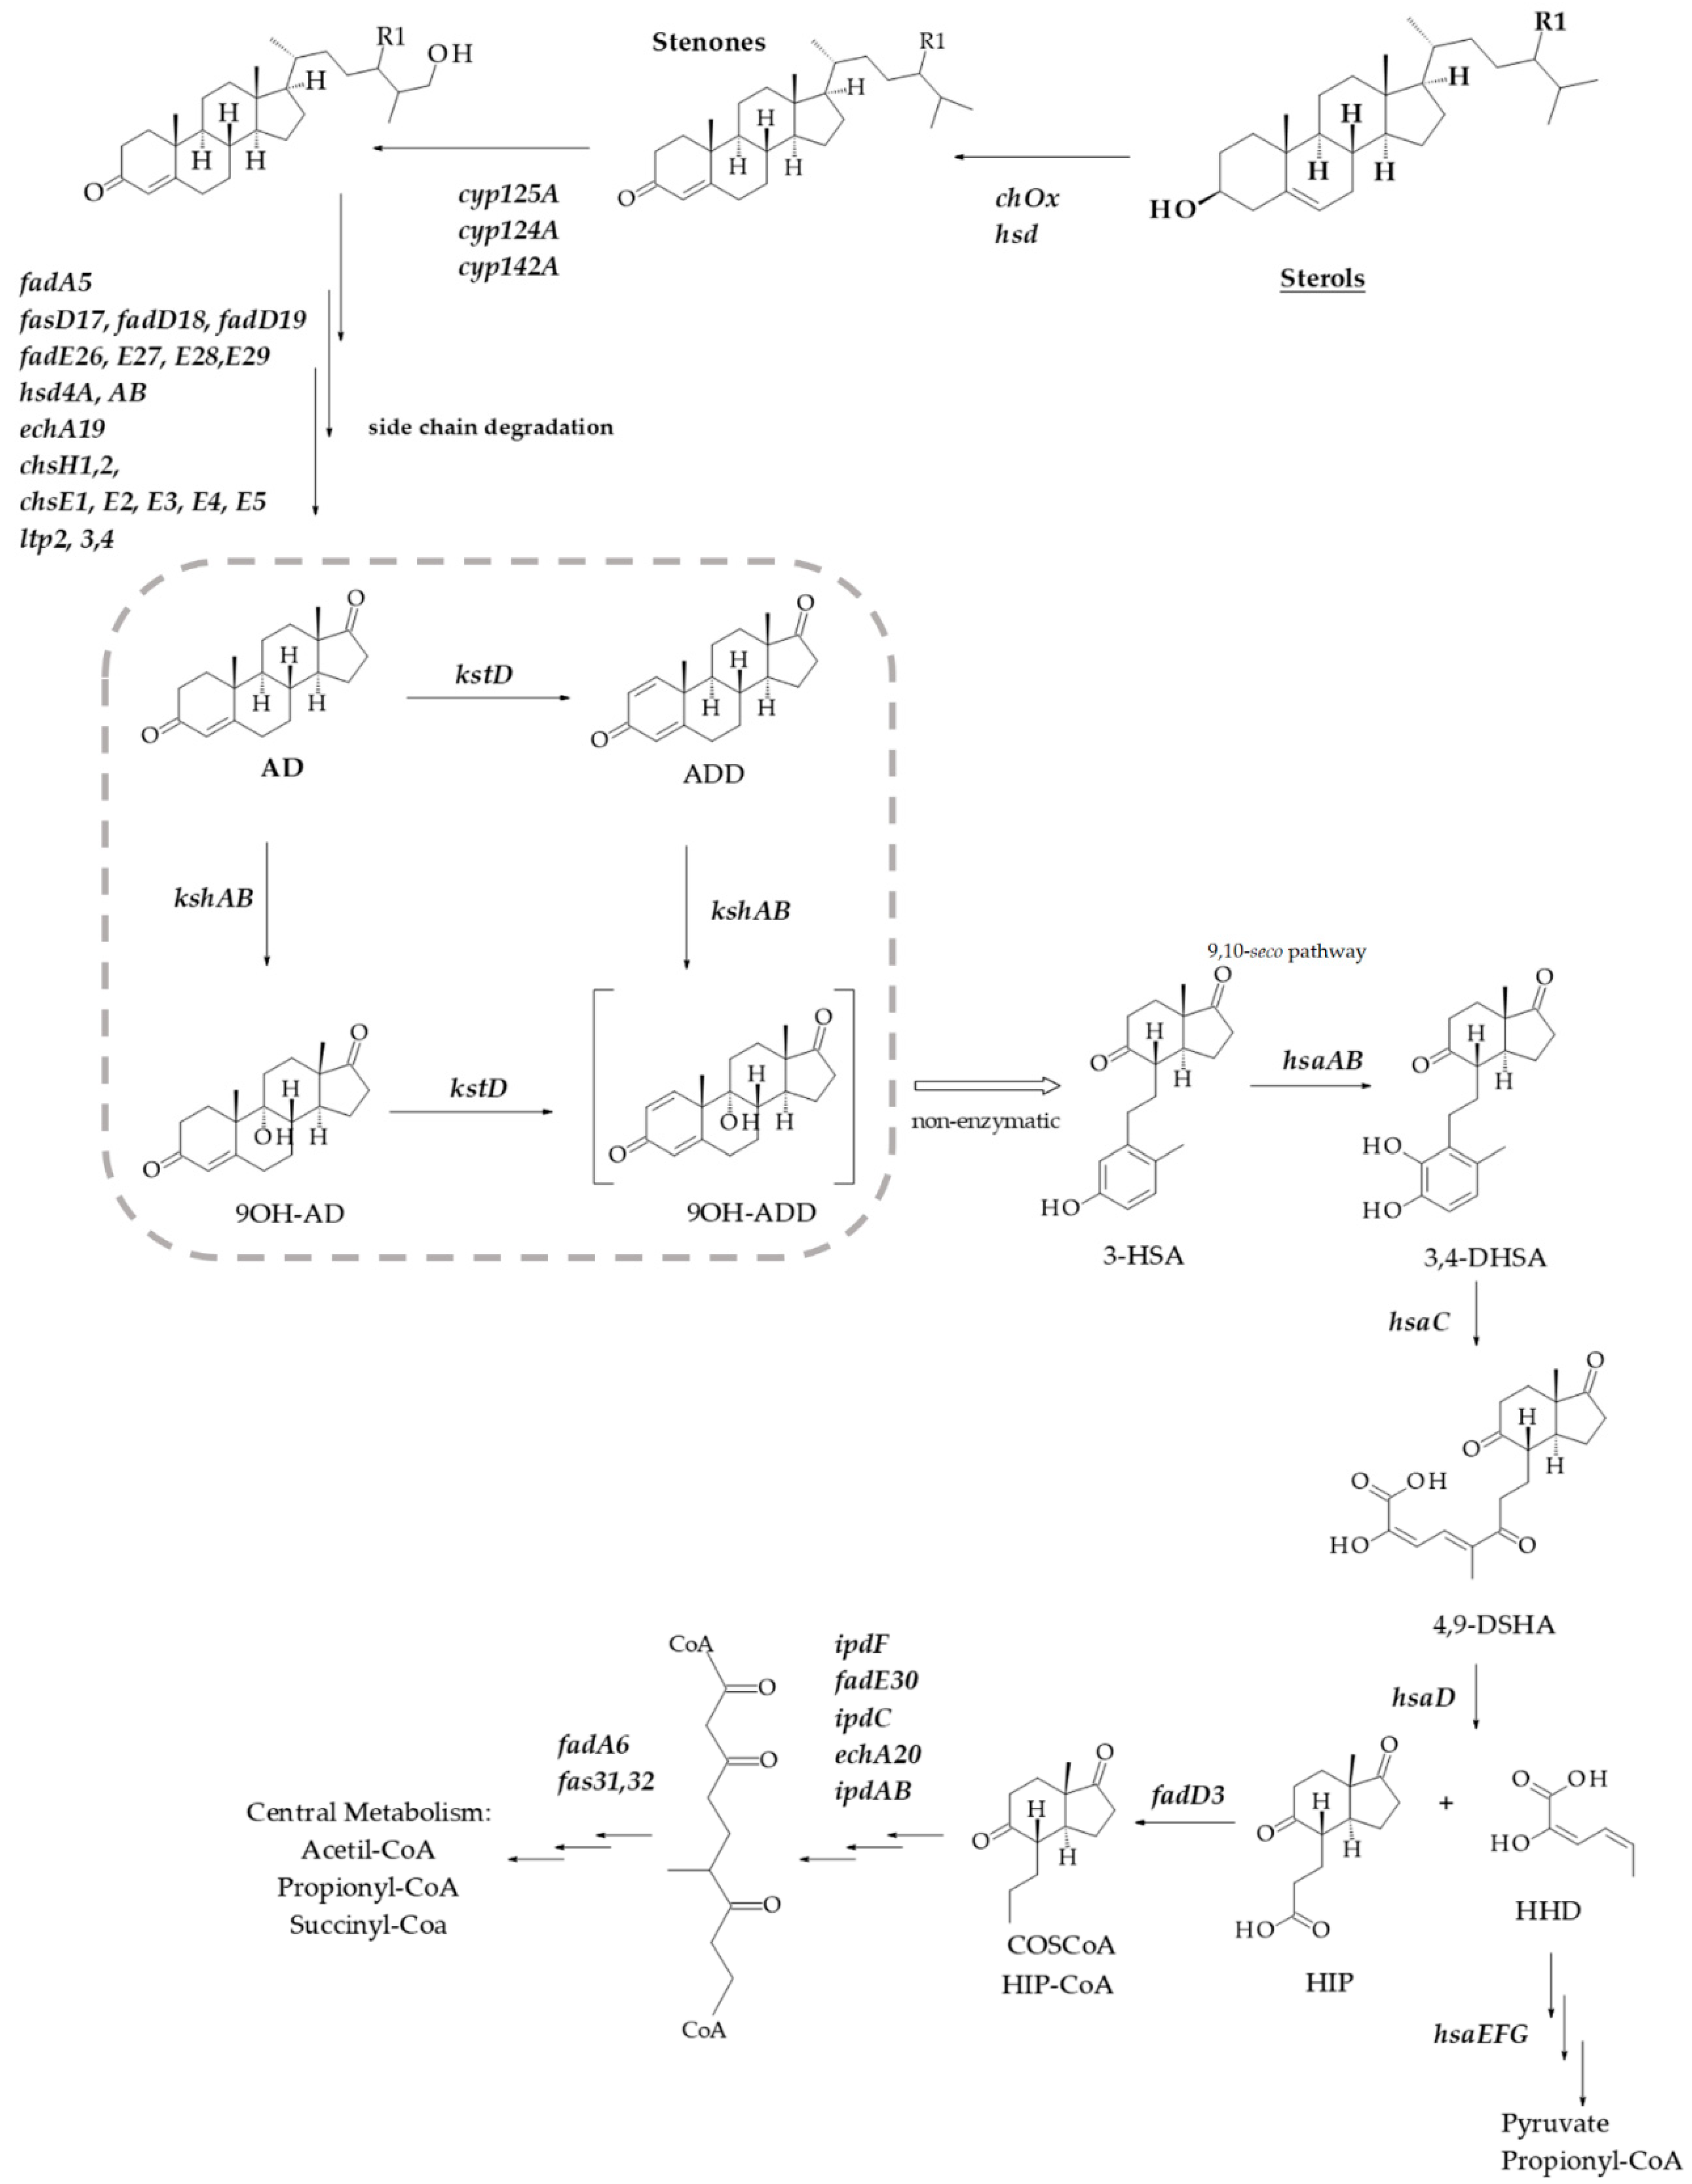
1. Introduction
2. Materials and Methods
2.1. Bacterial Strains, Plasmids and Growth Conditions
2.2. In Silico Analyses
2.3. Promoter Cloning and Characterization
2.4. PCR and RT-qPCR Analysis
3. Results and Discussion
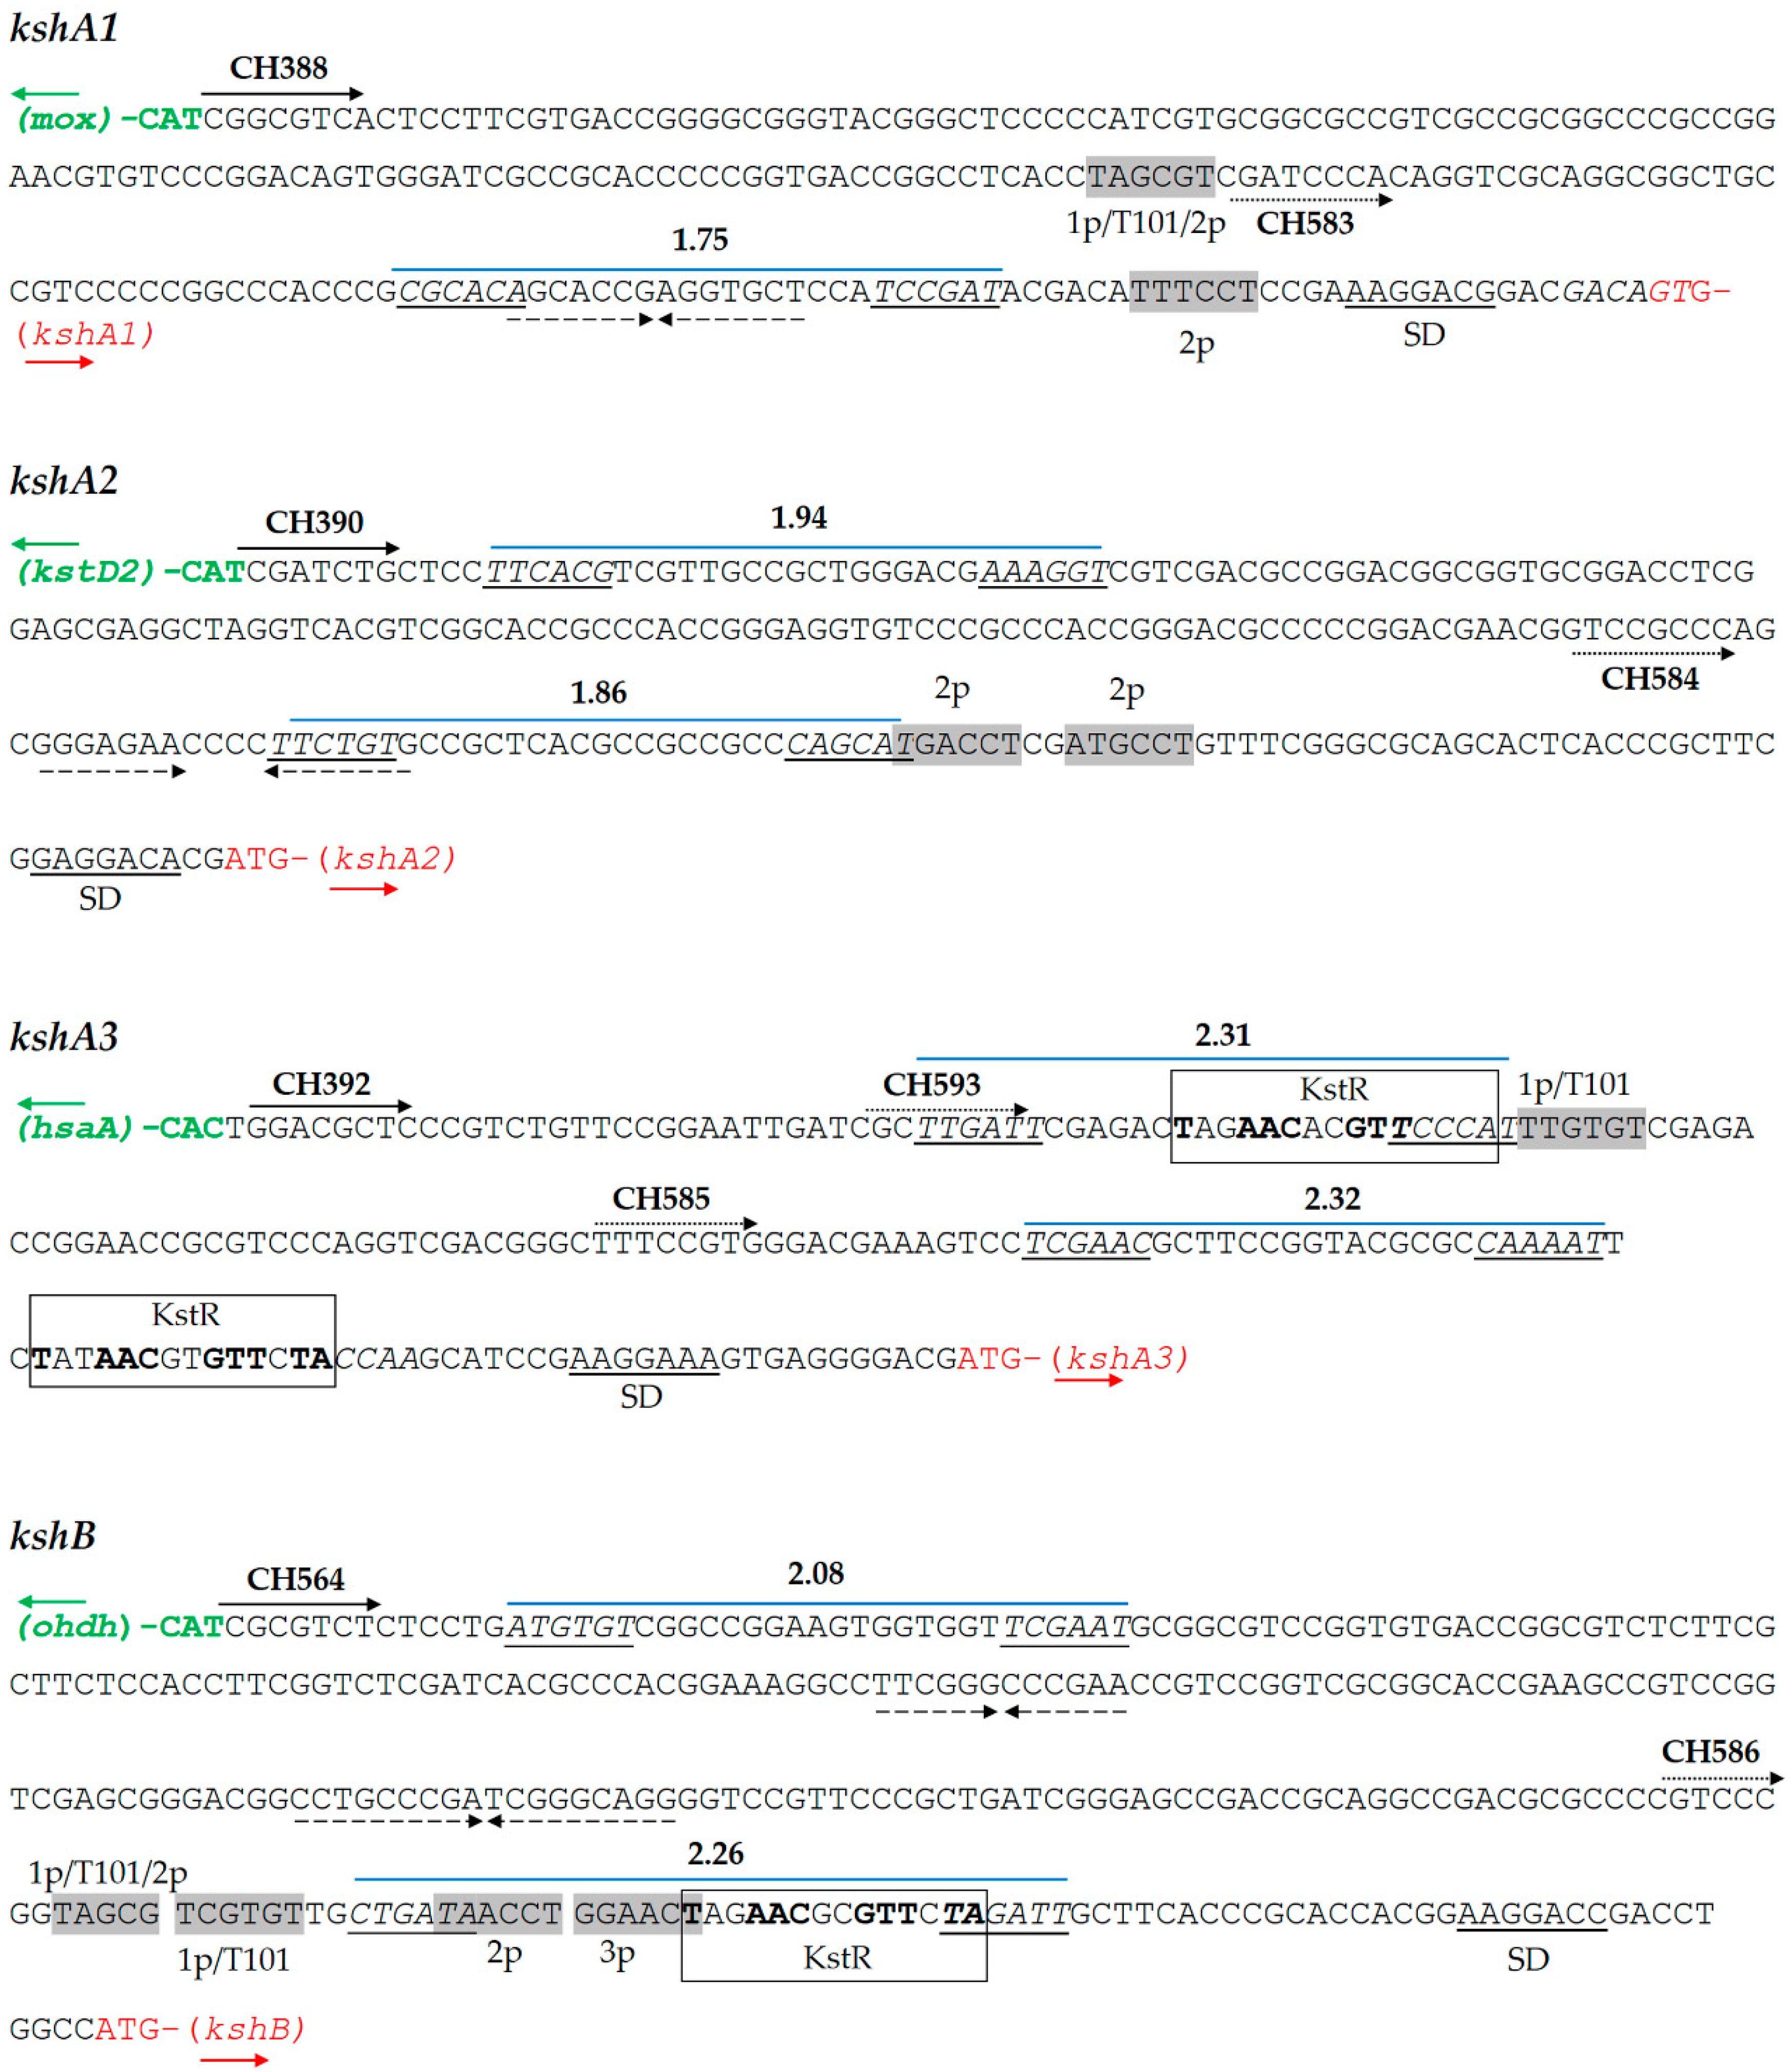
3.1. kshs Promoters Search
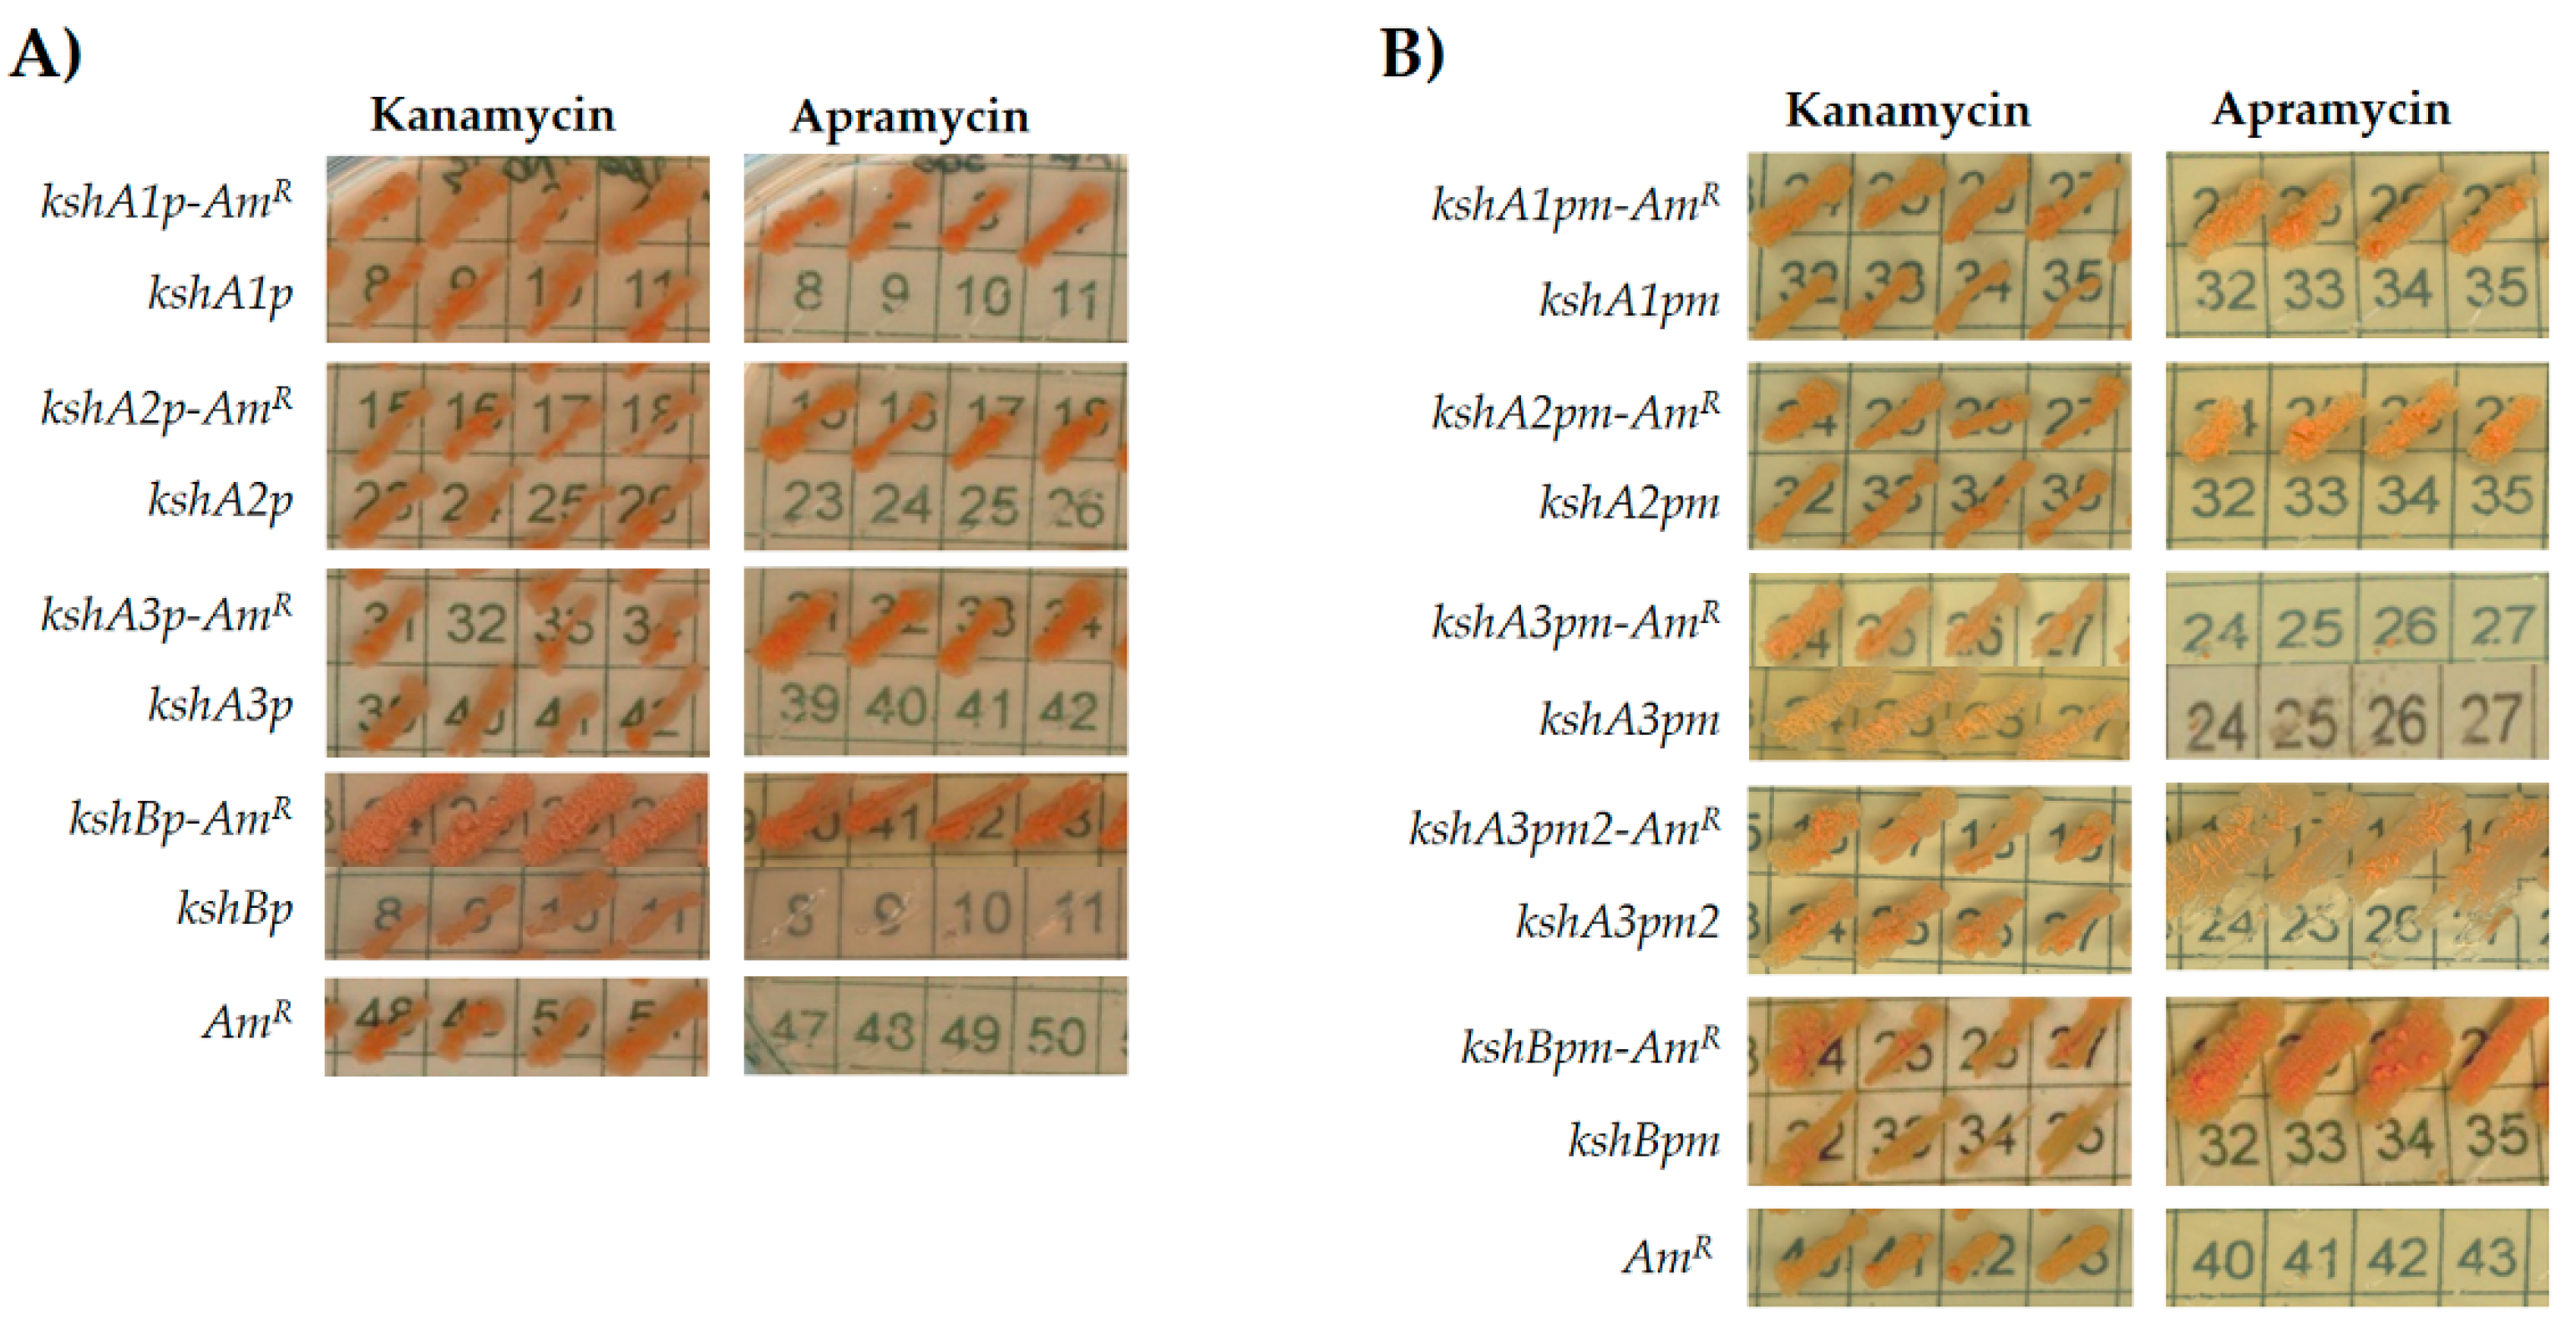
3.2. Promoter Cloning and Characterization
3.3. Growth of R. ruber Strain Chol-4 ΔkshA Strains in Different Steroids Substrates
3.4. Transcriptional Analysis of kshA Genes in R. ruber Strain Chol-4
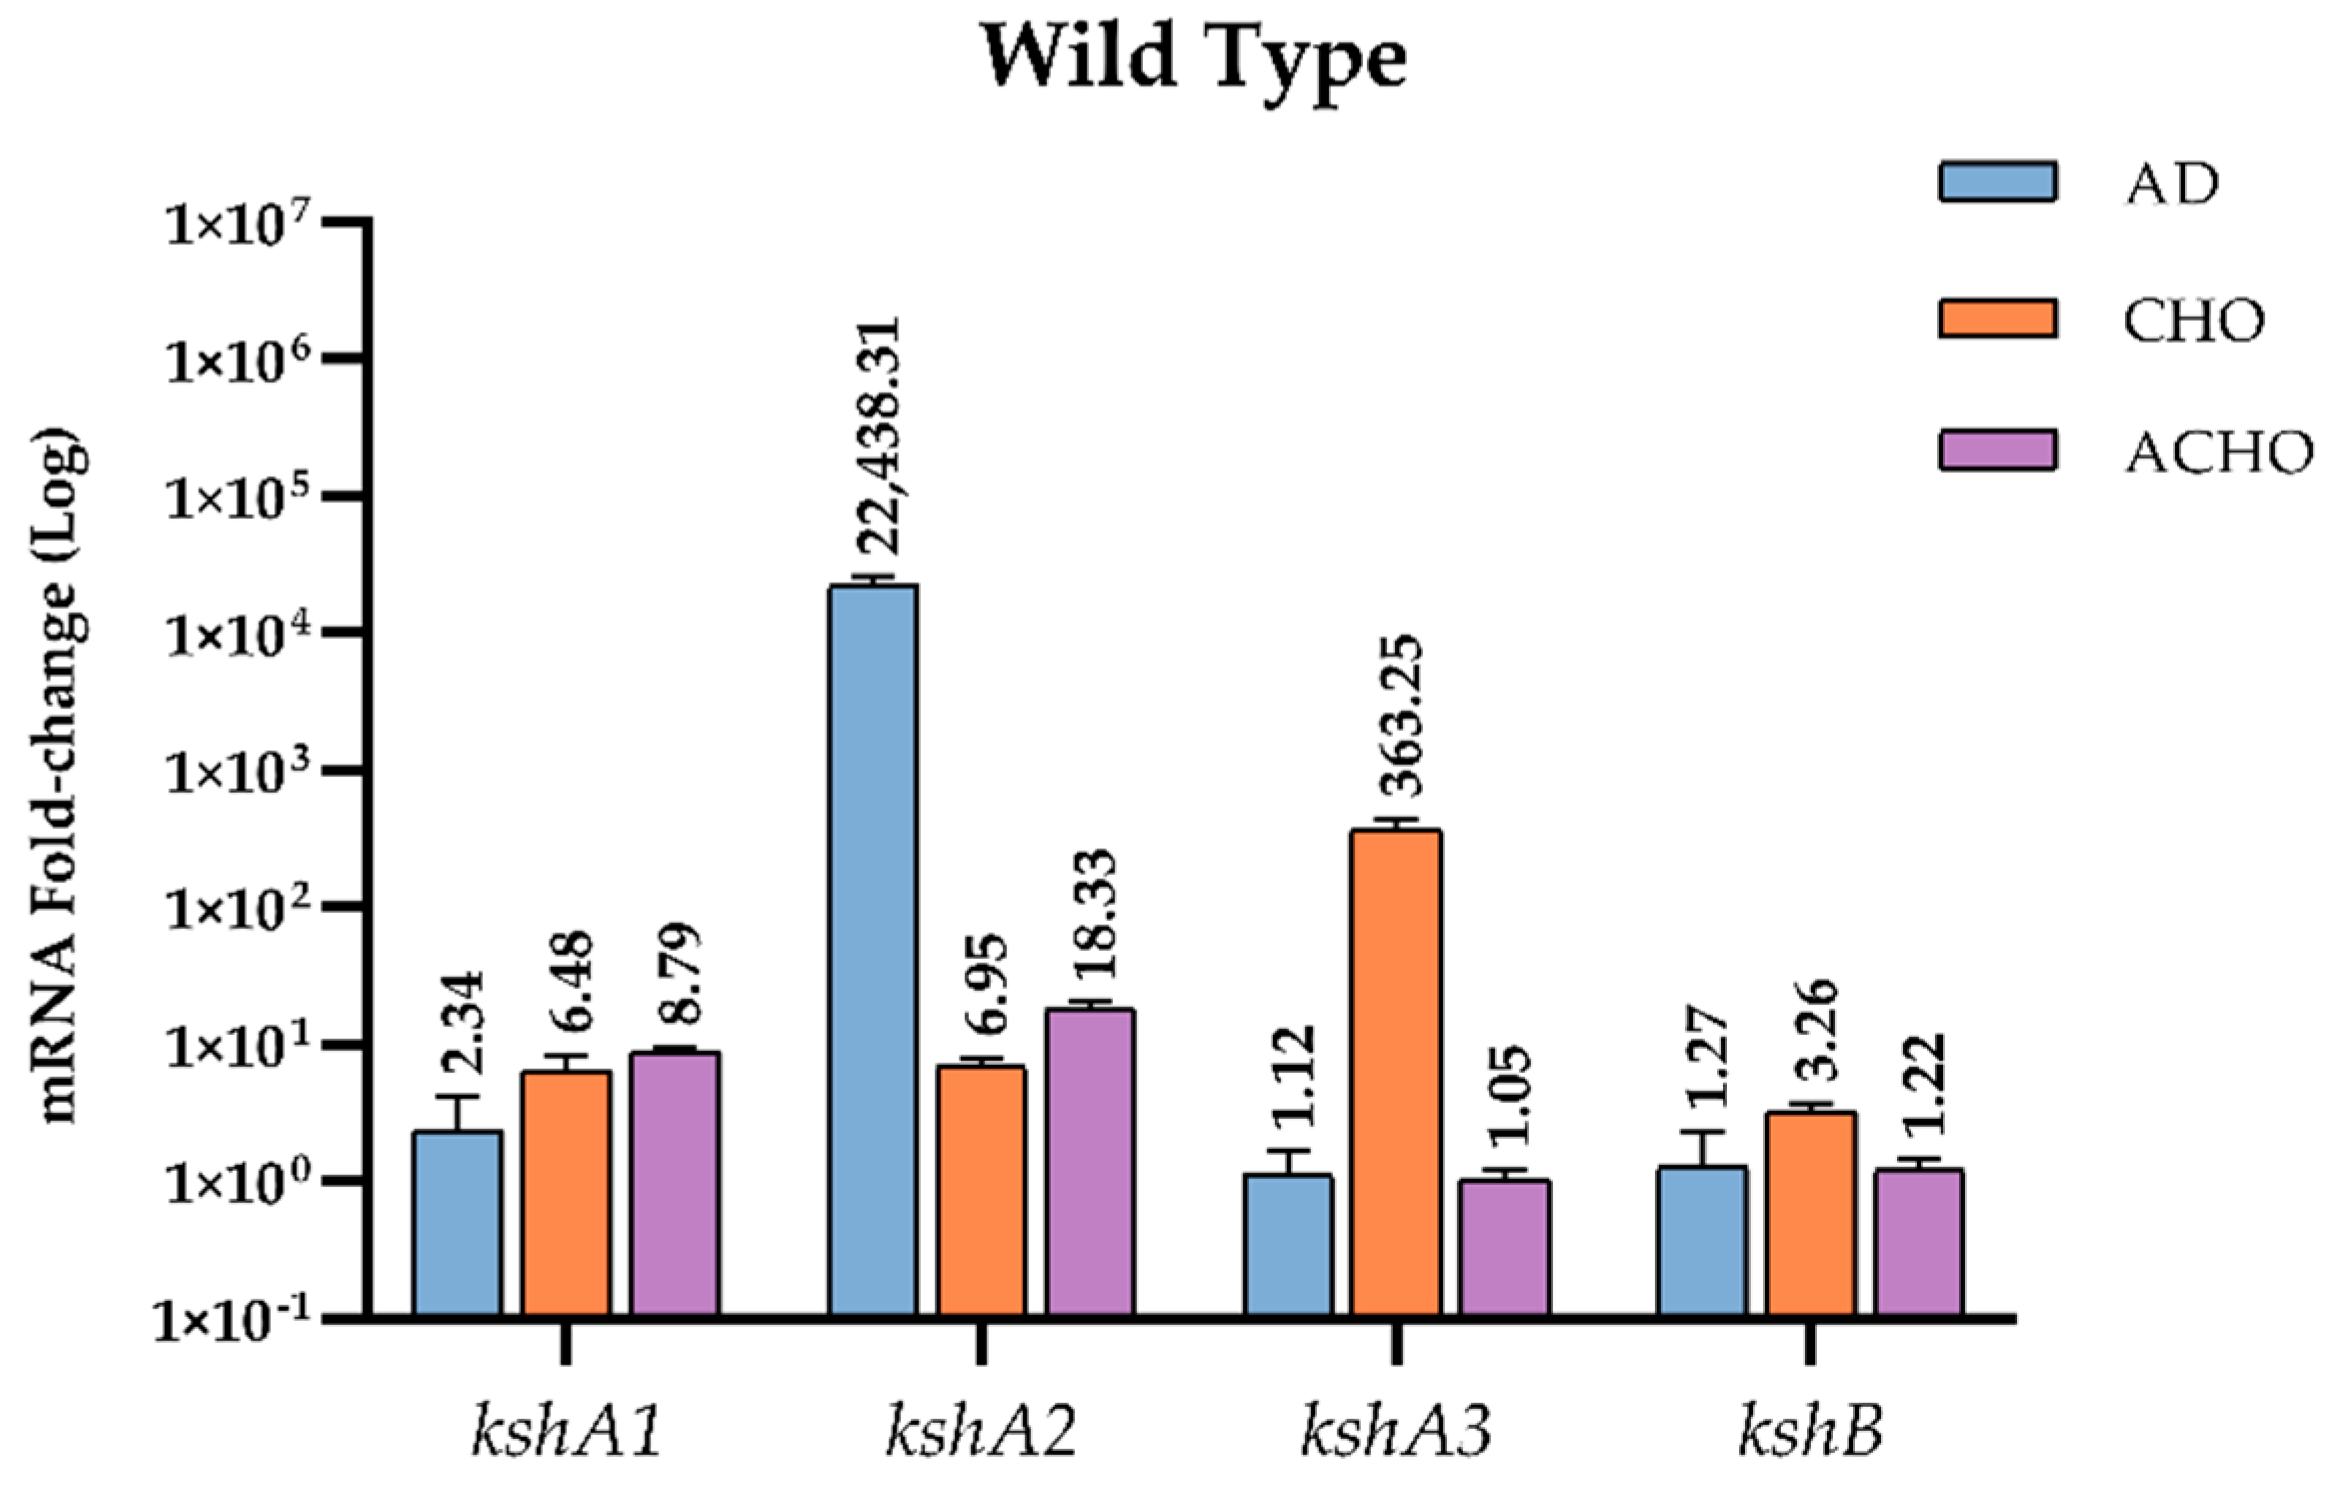
3.4.1. Transcriptional Studies in the WT Strain
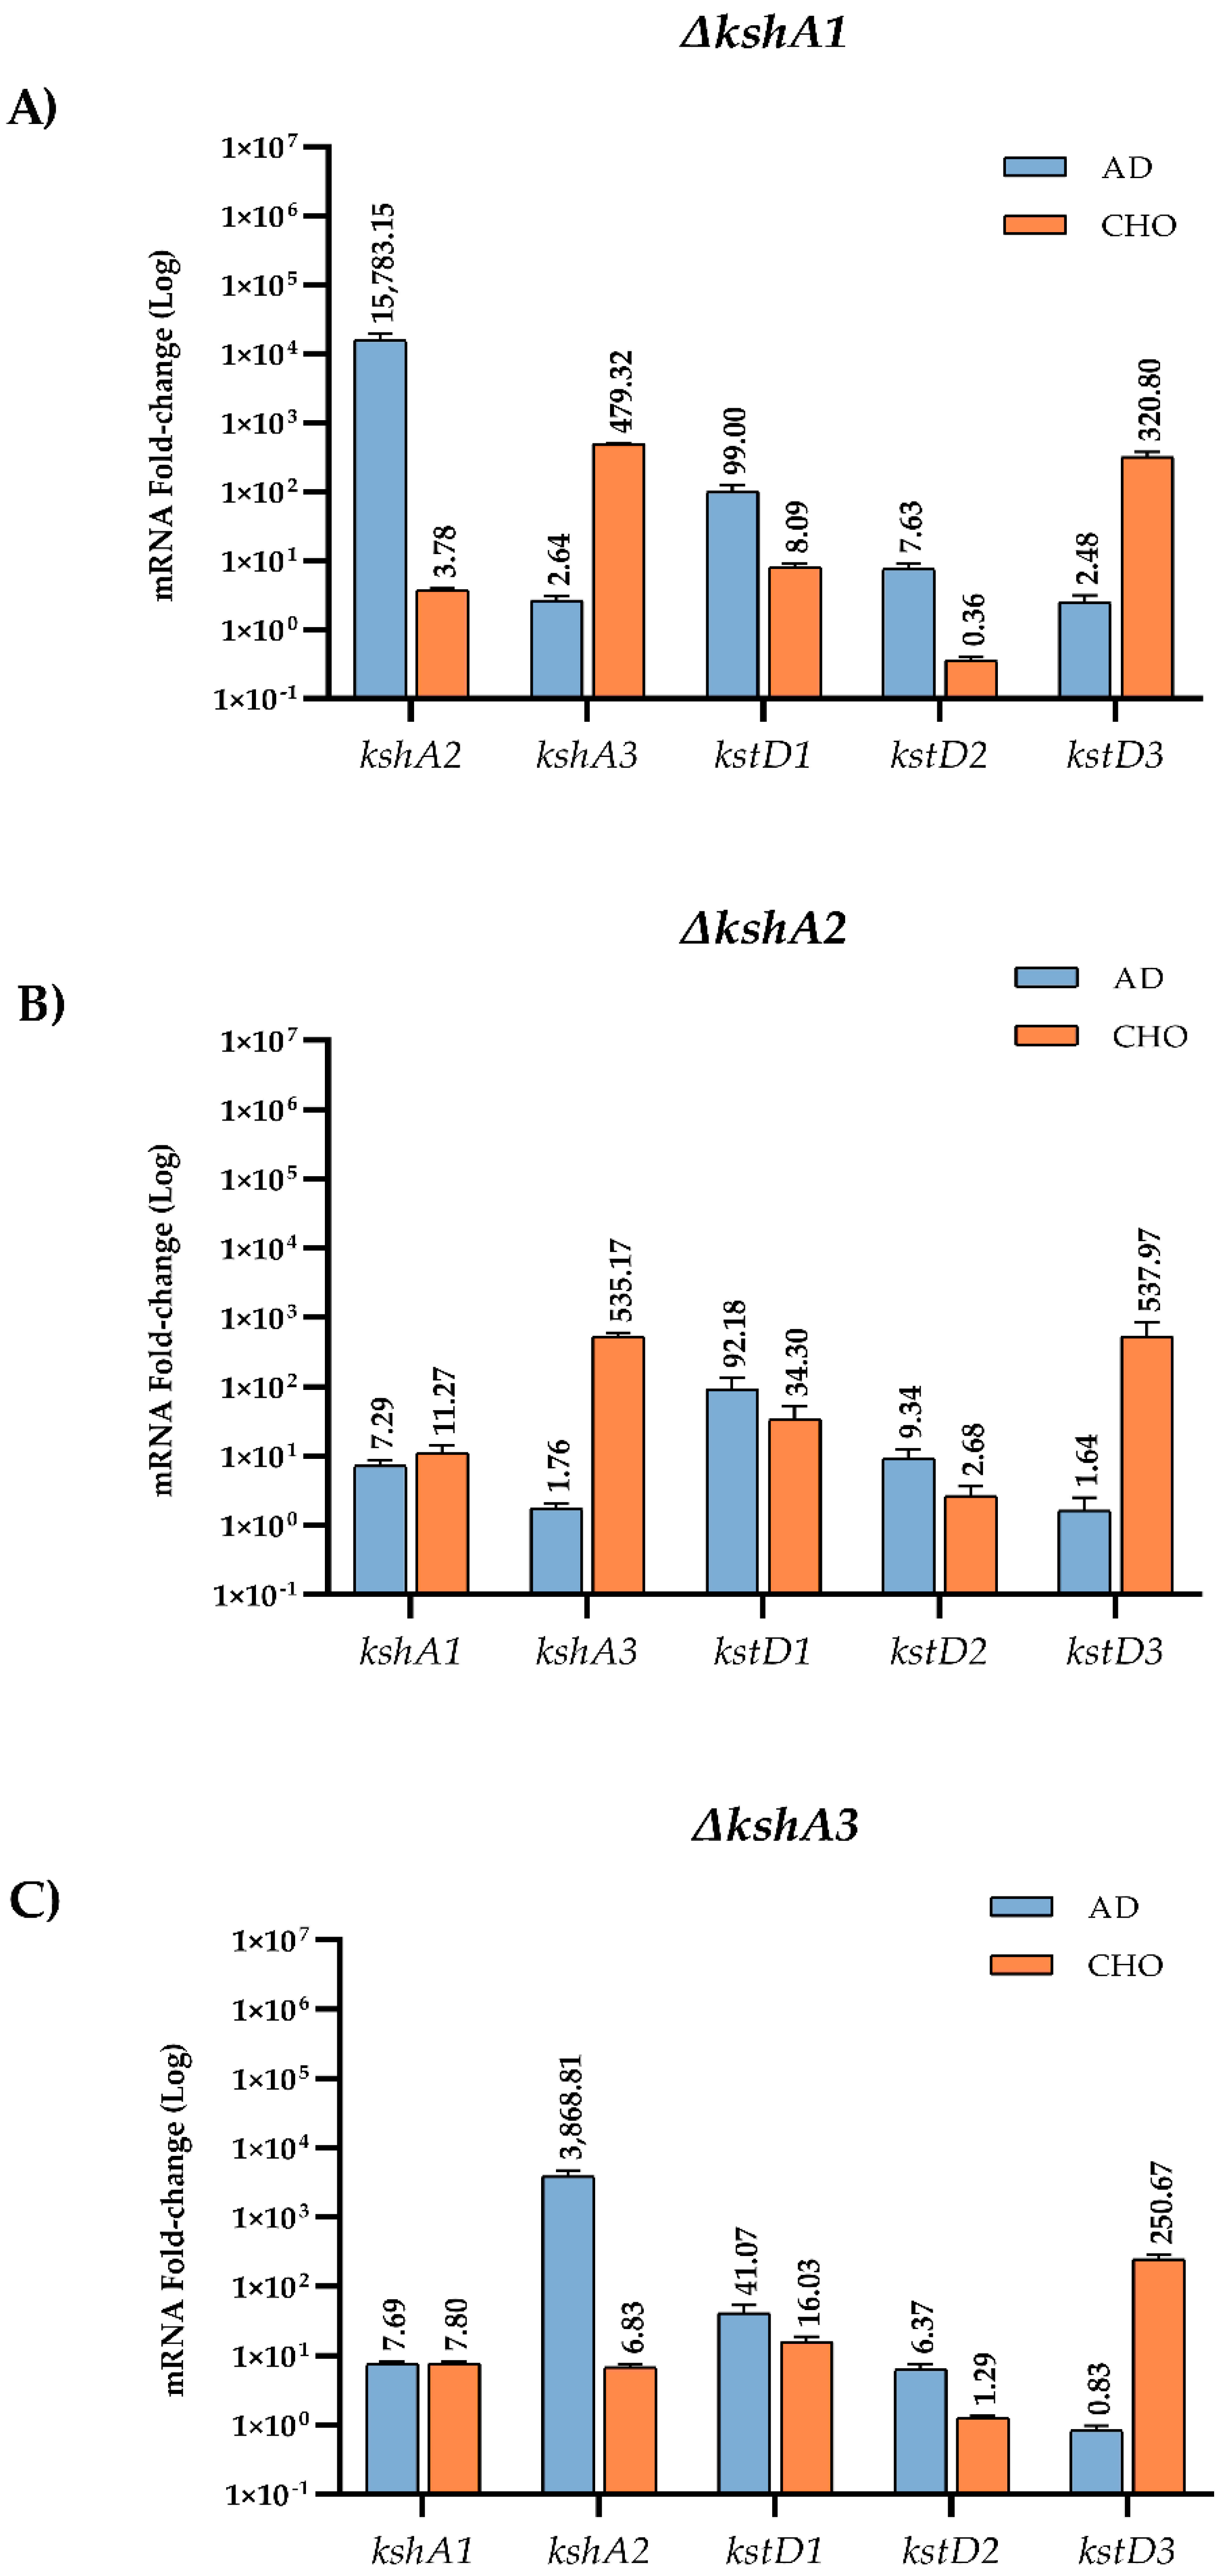
3.4.2. Transcriptional Studies in the Mutant Strains
4. Conclusions
Supplementary Materials
Author Contributions
Funding
Institutional Review Board Statement
Informed Consent Statement
Data Availability Statement
Acknowledgments
Conflicts of Interest
Abbreviations
| 3-HSA | 3-hydroxy-9,10-secoandrost-1,3,5(10)-triene-9,17-dione |
| 9OH-AD | 9α-hydroxy-4-androstene-3,17-dione |
| 9OH-ADD | 9α-hydroxy-1,4-androstadiene-3,17-dione |
| ACHO | cholic acid |
| ORF | open reading frame |
| AcNa | sodium acetate |
| AD | 4-androstene-3,17-dione |
| ADD | 1,4-androstadiene-3,17-dione |
| CHO | cholest-5-en-3β-ol (cholesterol) |
| KshAB | 3-ketosteroid 9α-hydroxylase |
| KstD | 3-ketosteroid-Δ1-dehydrogenase |
| LB | Luria–Bertani broth |
| Δ1,4-BNC | 3-oxo-23,24-bisnorchola-1,4-dien-22-oic acid |
References
- Galán, B.; García-Fernández, J.; Felpeto-Santero, C.; Fernández-Cabezón, L.; García, J.L. Bacterial Metabolism of Steroids. In Aerobic Utilization of Hydrocarbons, Oils and Lipids; Rojo, F., Ed.; Springer International Publishing: Cham, Switzerland, 2017; pp. 1–22. [Google Scholar]
- García, J.L.; Uhía, I.; Galán, B. Catabolism and biotechnological applications of cholesterol degrading bacteria. Microb. Biotechnol. 2012, 5, 679–699. [Google Scholar] [CrossRef]
- Donova, M.V. Steroid Bioconversions. Methods Mol. Biol. 2017, 1645, 1–13. [Google Scholar]
- Kreit, J. Aerobic catabolism of sterols by microorganisms: Key enzymes that open the 3-ketosteroid nucleus. FEMS Microbiol. Lett. 2019, 366, fnz173. [Google Scholar] [CrossRef]
- Rohman, A.; Dijkstra, B.W. The role and mechanism of microbial 3-ketosteroid Δ1-dehydrogenases in steroid breakdown. J. Steroid Biochem. Mol. Biol. 2019, 191, 105366. [Google Scholar] [CrossRef] [PubMed]
- Tian, K.; Meng, F.; Meng, Q.; Gao, Y.; Zhang, L.; Wang, L.; Wang, Y.; Li, X.; Huo, H. The Analysis of Estrogen-Degrading and Functional Metabolism Genes in Rhodococcus equi DSSKP-R-001. Int. J. Genom. 2020, 2020, 9369182. [Google Scholar] [CrossRef]
- Olivera, E.R.; Luengo, J.M. Steroids as Environmental Compounds Recalcitrant to Degradation: Genetic Mechanisms of Bacterial Biodegradation Pathways. Genes 2019, 10, 512. [Google Scholar] [CrossRef] [PubMed]
- Rohman, A.; Dijkstra, B.W. Application of microbial 3-ketosteroid Delta(1)-dehydrogenases in biotechnology. Biotechnol. Adv. 2021, 49, 107751. [Google Scholar] [CrossRef] [PubMed]
- Giorgi, V.; Menéndez, P.; García-Carnelli, C. Microbial transformation of cholesterol: Reactions and practical aspects—An update. World J. Microbiol. Biotechnol. 2019, 35, 131. [Google Scholar] [CrossRef] [PubMed]
- Yam, K.C.; van der Geize, R.; Eltis, L.D. Catabolism of Aromatic Compounds and Steroids by Rhodococcus. In Biology of Rhodococcus; Alvarez, H.M., Ed.; Springer: Berlin/Heidelberg, Germany, 2010; pp. 133–169. [Google Scholar]
- Fernández-Cabezón, L.; Galán, B.; García, J.L. Engineering Mycobacterium smegmatisfor testosterone production. Microb. Biotechnol. 2016, 10, 151–161. [Google Scholar] [CrossRef]
- Fernández-Cabezón, L.; Galán, B.; García, J.L. New Insights on Steroid Biotechnology. Front. Microbiol. 2018, 9, 958. [Google Scholar] [CrossRef]
- Giorgi, V.; Chaves, M.; Menéndez, P.; Carnelli, C.G. Bioprospecting of whole-cell biocatalysts for cholesterol biotransformation. World J. Microbiol. Biotechnol. 2019, 35, 12. [Google Scholar] [CrossRef]
- Faletrov, Y.; Brzostek, A.; Plocinska, R.; Dziadek, J.; Rudaya, E.; Edimecheva, I.; Shkumatov, V. Uptake and metabolism of fluorescent steroids by mycobacterial cells. Steroids 2017, 117, 29–37. [Google Scholar] [CrossRef]
- van der Geize, R.; Dijkhuizen, L. Harnessing the catabolic diversity of rhodococci for environmental and biotechnological applications. Curr. Opin. Microbiol. 2004, 7, 255–261. [Google Scholar] [CrossRef]
- Wang, H.; Song, S.; Peng, F.; Yang, F.; Chen, T.; Li, X.; Cheng, X.; He, Y.; Huang, Y.; Su, Z. Whole-genome and enzymatic analyses of an androstenedione-producing Mycobacterium strain with residual phytosterol-degrading pathways. Microb. Cell Fact. 2020, 19, 187. [Google Scholar] [CrossRef]
- Xiong, L.-B.; Liu, H.-H.; Xu, L.-Q.; Sun, W.-J.; Wang, F.-Q.; Wei, D.-Z. Improving the production of 22-hydroxy-23,24-bisnorchol-4-ene-3-one from sterols in Mycobacterium neoaurum by increasing cell permeability and modifying multiple genes. Microb. Cell Fact. 2017, 16, 89. [Google Scholar] [CrossRef]
- Shao, M.; Zhang, X.; Rao, Z.; Xu, M.; Yang, T.; Xu, Z.; Yang, S. Identification of steroid C27 monooxygenase isoenzymes involved in sterol catabolism and stepwise pathway engineering of Mycobacterium neoaurum for improved androst-1,4-diene-3,17-dione production. J. Ind. Microbiol. Biotechnol. 2019, 46, 635–647. [Google Scholar] [CrossRef] [PubMed]
- Yeh, C.-H.; Kuo, Y.-S.; Chang, C.-M.; Liu, W.-H.; Sheu, M.-L.; Meng, M. Deletion of the gene encoding the reductase component of 3-ketosteroid 9α-hydroxylase in Rhodococcus equi USA-18 disrupts sterol catabolism, leading to the accumulation of 3-oxo-23,24-bisnorchola-1,4-dien-22-oic acid and 1,4-androstadiene-3,17-dione. Microb. Cell Fact. 2014, 13, 130. [Google Scholar] [CrossRef] [PubMed][Green Version]
- Chiang, Y.; Wei, S.T.; Wang, P.; Wu, P.; Yu, C. Microbial degradation of steroid sex hormones: Implications for environmental and ecological studies. Microbiol. Biotechnol. 2019, 13, 926–949. [Google Scholar] [CrossRef] [PubMed]
- Hsiao, T.; Chen, Y.; Meng, M.; Chuang, M.; Horinouchi, M.; Hayashi, T.; Wang, P.; Chiang, Y. Mechanistic and phylogenetic insights into actinobacteria-mediated oestrogen biodegradation in urban estuarine sediments. Microb. Biotechnol. 2021, 14, 1212–1227. [Google Scholar] [CrossRef] [PubMed]
- Huang, L.; Nazarova, E.V.; Russell, D.G. Mycobacterium tuberculosis: Bacterial Fitness within the Host Macrophage. Bact. Intracell. 2019, 7, 127–138. [Google Scholar] [CrossRef]
- Ouellet, H.; Johnston, J.B.; De Montellano, P.R.O. Cholesterol catabolism as a therapeutic target in Mycobacterium tuberculosis. Trends Microbiol. 2011, 19, 530–539. [Google Scholar] [CrossRef] [PubMed]
- Kendall, S.L.; Burgess, P.; Balhana, R.; Withers, M.; Bokum, A.T.; Lott, J.S.; Gao, C.; Uhia-Castro, I.; Stoker, N. Cholesterol utilization in mycobacteria is controlled by two TetR-type transcriptional regulators: kstR and kstR2. Microbiology 2010, 156, 1362–1371. [Google Scholar] [CrossRef]
- Kendall, S.; Withers, M.; Soffair, C.N.; Moreland, N.J.; Gurcha, S.; Sidders, B.; Frita, R.; Bokum, A.T.; Besra, G.S.; Lott, J.S.; et al. A highly conserved transcriptional repressor controls a large regulon involved in lipid degradation in Mycobacterium smegmatis and Mycobacterium tuberculosis. Mol. Microbiol. 2007, 65, 684–699. [Google Scholar] [CrossRef]
- Uhía, I.; Galán, B.; Medrano, F.J.; García, J.L. Characterization of the KstR-dependent promoter of the gene for the first step of the cholesterol degradative pathway in Mycobacterium smegmatis. Microbiology 2011, 157, 2670–2680. [Google Scholar] [CrossRef] [PubMed]
- García-Fernández, E.; Medrano, F.J.; Galán, B.; García, J.L. Deciphering the Transcriptional Regulation of Cholesterol Catabolic Pathway in Mycobacteria. J. Biol. Chem. 2014, 289, 17576–17588. [Google Scholar] [CrossRef]
- Cappelletti, M.; Presentato, A.; Piacenza, E.; Firrincieli, A.; Turner, R.J.; Zannoni, D. Biotechnology of Rhodococcus for the production of valuable compounds. Appl. Microbiol. Biotechnol. 2020, 104, 8567–8594. [Google Scholar] [CrossRef] [PubMed]
- Cappelletti, M.; Zampolli, J.; Di Gennaro, P.; Zannoni, D. Genomics of Rhodococcus. In Biology of Rhodococcus; Alvarez, H.M., Ed.; Springer International Publishing: Cham, Switzerland, 2019; pp. 23–60. [Google Scholar]
- Heras, L.F.D.L.; Fernández, E.G.; Llorens, J.M.N.; Perera, J.; Drzyzga, O. Morphological, Physiological, and Molecular Characterization of a Newly Isolated Steroid-Degrading Actinomycete, Identified as Rhodococcus ruber Strain Chol-4. Curr. Microbiol. 2009, 59, 548–553. [Google Scholar] [CrossRef] [PubMed]
- Guevara, G.; Heras, L.F.D.L.; Perera, J.; Llorens, J.M.N. Functional characterization of 3-ketosteroid 9α-hydroxylases in Rhodococcus ruber strain chol-4. J. Steroid Biochem. Mol. Biol. 2017, 172, 176–187. [Google Scholar] [CrossRef]
- Guevara, G.; Heras, L.F.D.L.; Perera, J.; Llorens, J.M.N. Functional differentiation of 3-ketosteroid Delta(1)-dehydrogenase isozymes in Rhodococcus ruber strain Chol-4. Microb. Cell Fact. 2017, 16, 42. [Google Scholar] [CrossRef]
- Van Der Geize, R.; Hessels, G.I.; Nienhuis-Kuiper, M.; Dijkhuizen, L. Characterization of a Second Rhodococcus erythropolis SQ1 3-Ketosteroid 9α-Hydroxylase Activity Comprising a Terminal Oxygenase Homologue, KshA2, Active with Oxygenase-Reductase Component KshB. Appl. Environ. Microbiol. 2008, 74, 7197–7203. [Google Scholar] [CrossRef]
- Jiao, S.; Yu, H.; Shen, Z. Core element characterization of Rhodococcus promoters and development of a promoter-RBS mini-pool with different activity levels for efficient gene expression. New Biotechnol. 2018, 44, 41–49. [Google Scholar] [CrossRef]
- Shemyakina, A.O.; Grechishnikova, E.G.; Novikov, A.D.; Asachenko, A.F.; Kalinina, T.I.; Lavrov, K.V.; Yanenko, A.S. A Set of Active Promoters with Different Activity Profiles for Superexpressing Rhodococcus Strain. ACS Synth. Biol. 2021, 10, 515–530. [Google Scholar] [CrossRef] [PubMed]
- Heras, L.F.D.L.; Mascaraque, V.; Fernández, E.G.; Navarro-Llorens, J.M.; Perera, J.; Drzyzga, O. ChoG is the main inducible extracellular cholesterol oxidase of Rhodococcus sp. strain CECT3014. Microbiol. Res. 2011, 166, 403–418. [Google Scholar] [CrossRef] [PubMed]
- Heras, L.F.D.L.; Alonso, S.; León, A.D.L.V.D.; Xavier, D.; Perera, J.; Llorens, J.M.N. Draft Genome Sequence of the Steroid Degrader Rhodococcus ruber Strain Chol-4. Genome Announc. 2013, 1, 1. [Google Scholar] [CrossRef]
- Klucar, L.; Stano, M.; Hajduk, M. phiSITE: Database of gene regulation in bacteriophages. Nucleic Acids Res. 2009, 38, D366–D370. [Google Scholar] [CrossRef]
- Cappelletti, M.; Presentato, A.; Milazzo, G.; Turner, R.J.; Fedi, S.; Frascari, D.; Zannoni, D. Growth of Rhodococcus sp. strain BCP1 on gaseous n-alkanes: New metabolic insights and transcriptional analysis of two soluble di-iron monooxygenase genes. Front. Microbiol. 2015, 6, 393. [Google Scholar] [CrossRef]
- Livak, K.J.; Schmittgen, T.D. Analysis of relative gene expression data using real-time quantitative PCR and the 2(-Delta Delta C(T)) Method. Methods 2001, 25, 402–408. [Google Scholar] [CrossRef] [PubMed]
- Horinouchi, S.; Nishiyama, M.; Nakamura, A.; Beppu, T. Construction and characterization of multicopy expression-vectors in Streptomyces spp. Mol. Genet. Genom. 1987, 210, 468–475. [Google Scholar] [CrossRef] [PubMed]
- Horbal, L.; Siegl, T.; Luzhetskyy, A. A set of synthetic versatile genetic control elements for the efficient expression of genes in Actinobacteria. Sci. Rep. 2018, 8, 1–13. [Google Scholar] [CrossRef] [PubMed]
- Bashyam, M.D.; Kaushal, D.; Dasgupta, S.K.; Tyagi, A.K. A study of mycobacterial transcriptional apparatus: Identification of novel features in promoter elements. J. Bacteriol. 1996, 178, 4847–4853. [Google Scholar] [CrossRef]
- Strohl, W.R. Compilation and analysis of DNA sequences associated with apparent streptomycete promoters. Nucleic Acids Res. 1992, 20, 961–974. [Google Scholar] [CrossRef]
- Liang, Y.; Yu, H. Genetic toolkits for engineering Rhodococcus species with versatile applications. Biotechnol. Adv. 2021, 49, 107748. [Google Scholar] [CrossRef] [PubMed]
- Petrusma, M.; Hessels, G.; Dijkhuizen, L.; Van Der Geize, R. Multiplicity of 3-Ketosteroid-9-Hydroxylase Enzymes in Rhodococcus rhodochrous DSM43269 for Specific Degradation of Different Classes of Steroids. J. Bacteriol. 2011, 193, 3931–3940. [Google Scholar] [CrossRef] [PubMed]
- Petrusma, M.; Van Der Geize, R.; Dijkhuizen, L. 3-Ketosteroid 9α-hydroxylase enzymes: Rieske non-heme monooxygenases essential for bacterial steroid degradation. Antonie Leeuwenhoek 2014, 106, 157–172. [Google Scholar] [CrossRef]
- Mohn, W.W.; Wilbrink, M.H.; Casabon, I.; Stewart, G.R.; Liu, J.; Van Der Geize, R.; Eltis, L.D. Gene Cluster Encoding Cholate Catabolism in Rhodococcus spp. J. Bacteriol. 2012, 194, 6712–6719. [Google Scholar] [CrossRef]
- Szaleniec, M.; Wojtkiewicz, A.M.; Bernhardt, R.; Borowski, T.; Donova, M. Bacterial steroid hydroxylases: Enzyme classes, their functions and comparison of their catalytic mechanisms. Appl. Microbiol. Biotechnol. 2018, 102, 8153–8171. [Google Scholar] [CrossRef]
- Ho, N.A.T.; Dawes, S.S.; Crowe, A.M.; Casabon, I.; Gao, C.; Kendall, S.; Baker, E.N.; Eltis, L.D.; Lott, J.S. The Structure of the Transcriptional Repressor KstR in Complex with CoA Thioester Cholesterol Metabolites Sheds Light on the Regulation of Cholesterol Catabolism in Mycobacterium tuberculosis. J. Biol. Chem. 2016, 291, 7256–7266. [Google Scholar] [CrossRef] [PubMed]
- Fernández-Cabezón, L.; García-Fernández, E.; Galán, B.; García, J.L. Molecular characterization of a new gene cluster for steroid degradation in Mycobacterium smegmatis. Environ. Microbiol. 2017, 19, 2546–2563. [Google Scholar] [CrossRef] [PubMed]
- Ji, Y.; Yang, J.; Gao, L.; Xiong, G.; Yu, Y.; Zhang, Y. Characterization of a LuxR repressor for 3,17β-HSD in Comamonas testosteroni ATCC11996. Chem. Interact. 2021, 336, 109271. [Google Scholar] [CrossRef] [PubMed]
- Heras, L.F.D.L.; Van Der Geize, R.; Drzyzga, O.; Perera, J.; Llorens, J.M.N. Molecular characterization of three 3-ketosteroid-Delta(1)-dehydrogenase isoenzymes of Rhodococcus ruber strain Chol-4. J. Steroid Biochem. Mol. Biol. 2012, 132, 271–281. [Google Scholar] [CrossRef]


| Strain and Plasmids | Description | Reference |
|---|---|---|
| E. coli DH5α | F’ endA1 hsdR17 (rK− mK+) glnV44 thi-1 recA1 gyrA (NalR) relA1 Δ(lacIZYA-argF) U169 deoR (φ80dlacΔ(lacZ)M15). | Laboratory collection |
| Rhodococcus ruber strain Chol-4 | Wild type phenotype, NalR | [30] |
| ΔkshA1 R. ruber | Mutant in kshA1 gene, NalR. | [31] |
| ΔkshA2 R. ruber | Mutant in kshA2 gene, NalR. | [31] |
| ΔkshA3 R. ruber | Mutant in kshA3 gene, NalR. | [31] |
| ΔkshB R. ruber | Mutant in kshB gene, NalR. | [31] |
| pGem-T Easy | Cloning vector E. coli, ApR | Promega |
| pNVS | Nocardia-E. coli replicative shuttle vector pNV119 containing Terminator 1-mcs-terminator 0 from pSEVA351, KmR | [32] |
| pNVSP1-A | pNVS containing kstD1 promoter region and the sequence of the first seven amino acids in frame to Apramycin resistance gen (AmR). | [32] |
| pNVSPA1 | pNVS containing kshA1 promoter region and the sequence of the first seven amino acids in the mcs. (EcoRI-NruI, 0.285 kb) | This work |
| pNVSPA2 | pNVS containing kshA2 promoter region and the sequence of the first seven amino acids in the mcs. (EcoRI-NruI, 0.298 kb) | This work |
| pNVSPA3 | pNVS containing kshA3 promoter region and the sequence of the first seven amino acids in the mcs. (EcoRI-ScaI, 0.244 kb) | This work |
| pNVSPB | pNVS containing kshB promoter region and the sequence of the first seven amino acids in the mcs (EcoRI-NruI, 0.366 kb) | This work |
| pNVSPA1-A | pNVSPA1 in frame to AmR gene (NruI-HindIII, 0.8 kb) | This work |
| pNVSPA2-A | pNVSPA2 in frame to AmR gene (NruI-HindIII, 0.8 kb) | This work |
| pNVSPA3-A | pNVSPA3 in frame to AmR gene (NruI-HindIII, 0.8 kb) | This work |
| pNVSPB-A | pNVSPB in frame to AmR gene (NruI-HindIII, 0.8 kb) | This work |
| pNVS-A | A derivative of pNVSP1-A with the promoter P1 region deleted | [32] |
| pNVSPA1m | pNVS containing kshA1 minimum promoter region and the sequence of the first seven amino acids in the mcs (EcoRI-NruI, 0.155 kb) | This work |
| pNVSPA2m | pNVS containing kshA2 minimum promoter region and the sequence of the first seven amino acids in the mcs (EcoRI-NruI, 0.153 kb) | This work |
| pNVSPA3m | pNVS containing kshA3 minimum promoter region and the sequence of the first seven amino acids in the mcs (EcoRI-NruI, 0.142 kb) | This work |
| pNVSPA3m2 | pNVS containing kshA3 minimum promoter region and the sequence of the first seven amino acids in the mcs (EcoRI-NruI, 0.213 kb) | This work |
| pNVSPBm | pNVS containing kshB minimum promoter region and the sequence of the first seven amino acids in the mcs (EcoRI-NruI, 0.134 kb) | This work |
| pNVSPA1m-A | pNVSPA1m in frame to AmR gene (NruI-HindIII, 0.8 kb) | This work |
| pNVSPA2m-A | pNVSPA2m in frame to AmR gene (NruI-HindIII, 0.8 kb) | This work |
| pNVSPA3m-A | pNVSPA3m in frame to AmR gene (NruI-HindIII, 0.8 kb) | This work |
| pNVSPA3m2-A | pNVSPA3m2 in frame to AmR gene (NruI-HindIII, 0.8 kb) | This work |
| pNVSPBm-A | pNVSPBm in frame to AmR gene (NruI-HindIII, 0.8 kb) | This work |
| Primer | Sequence | PCR Conditions | Use |
|---|---|---|---|
| CH469 CH470 | TACGAGGGCTACGACATC TACATCAGGACGAACTTGTT | Tm 60 °C, 1 min, 30 cycles | kshA1 amplification in RT-qPCR, 52 bp |
| CH522 CH523 | AAGACGTTCGAGCAGACAT GTTGTCGATCTTGGCCTTGT | Tm 60 °C, 1 min, 30 cycles | kshA2 amplification in RT-qPCR, 50 bp |
| CH524 CH525 | ACGCTGGTACGAGCAGTTCT GTCGACCTCGTACTCGAAGC | Tm 60 °C, 1 min, 30 cycles | kshA3 amplification in RT-qPCR, 79 bp |
| CH581 CH582 | ACCACGACTTCCTGCTGTTC GTAGACCAGCACGACCTTCC | Tm 60 °C, 1 min, 30 cycles | kshB amplification in RT-qPCR, 104 bp |
| CH505 CH506 | GACATCGAGTTCACGGCCTA GGAGCCTTGCCGAAGTAGTC | Tm 60 °C, 1 min, 30 cycles | kstD1 amplification in RT-qPCR, 50 bp |
| CH507 CH508 | TCCTTCATCGTCGACCACAC CTGGCCGAACGACATGTAGT | Tm 60 °C, 1 min, 30 cycles | kstD2 amplification in RT-qPCR, 69 bp |
| CH509 CH510 | GCTACGACCACTACTACGGC CACCACCTTGATCGCGTAGA | Tm 60 °C, 1 min, 30 cycles | kstD3 amplification in RT-qPCR, 92 bp |
| CH575 CH576 | ATTAGTGGCGAAGGGTGAG CCCGAGGTCCTATCCGGTAT | Tm 60 °C, 1 min, 30 cycles | 16S gen in RT-qPCR, 95 bp [39] |
| CH388 | GGATCCTCTAGAGAATTCCGGCGTCACTCCTTCGTGACCGGG | Tm 56 °C, 30 seg, 30 cycles | Putative promoter of kshA1 and its first 21 nucleotides of coding sequence with EcoRI/NruI restriction sites, 285 bp |
| CH434 | TTTAAACTGCAGTCGCGAGGACTTGCTGGAGCTCACTGTCGT | ||
| CH583 | GGATCCTCTAGGAATTCGATCCCACAGGTCGCAGGCG | Tm 55 °C, 30 seg, 30 cycles | Together with CH434, amplification of the putative minimum promoter region of kshA1 and its first 21 nucleotides of coding sequence with EcoRI-NruI sites, 155 bp |
| CH390 | GGATCCTCTAGAGAATTCCGATCTGCTCCTTCACGTCGTTGCCG | Tm 56 °C, 30 seg, 30 cycles | Putative promoter of kshA2 and its first 21 nucleotides of coding sequence with EcoRI/NruI restriction sites, 298 bp |
| CH433 | TTTAAACTGCAGTCGCGAGGGTGCGCTCTGCGTCATCGTGTC | ||
| CH584 | GGATCCTCTAGAGAATTCCGCCCAGCGGGAGAACCCCTT | Tm 60 °C, 30 seg, 30 cycles | Together with CH433, amplification of the putative minimum promoter region of kshA2 and its first 21 nucleotides of coding sequence with EcoRI-NruI sites, 153 bp |
| CH392 | GGATCCTCTAGAGAATTCTGGACGCTCCCGTCTGTTCCGGAA | Tm 55 °C, 30 seg, 30 cycles | Putative promoter of kshA3 and its first 21 nucleotides of coding sequence with EcoRI/ScaI restriction sites, 244 bp |
| CH435 | TTTAAACTGCAGAGTACTCTCGCGAACCTGTGCCATCGTCCC | ||
| CH585 | GGATCCTCTAGAGAATTCCGTGGGACGAAAGTCCTC | Tm 55 °C, 30 seg, 30 cycles | Together with CH433, amplification of the putative minimum promoter region of kshA3 and its first 21 nucleotides of coding sequence with EcoRI-NruI sites, 142 bp |
| CH593 | GGATCCTCTAGAGAATTCCTTGATTCGAGACTAGAACACGT | Tm 55 °C, 30 seg, 30 cycles | Together with CH433, amplification of the putative minimum promoter region of kshA3 and its first 21 nucleotides of coding sequence with EcoRI-NruI sites, 213 bp |
| CH564 | GGATCCTCTAGAGAATTCCGCGTCTCTCCTGATGTGTCGG | Tm 56 °C, 30 seg, 30 cycles | Putative promoter of kshB and its first 21 nucleotides of coding sequence with EcoRI/NruI restriction sites, 366 bp |
| CH565 | CTGCAGTCGCGACACCTCGACTGTCGTCATGGCCAGGT | ||
| CH586 | GGATCCTCTAGAGAATTCTCCCGGTAGCGTCGTGTTGCTGAT | Tm 60 °C, 30 seg, 30 cycles | Together with CH565, amplification of the putative minimum promoter region of kshB and its first 21 nucleotides of coding sequence with EcoRI-NruI sites, 134 bp |
| AcNa 24 mM | CHO 1.6 mM | AD 2.2 mM | ||||
|---|---|---|---|---|---|---|
| Strain | Amax | DT (Hours) | Amax | DT (Hours) | Amax | DT (Hours) |
| WT | 1.81 ± 0.07 | 3.57 ± 0.17 | 1.94 ± 0.11 | 4.86 ± 0.18 | 2.20 ± 0.08 | 2.10 ± 0.10 |
| ΔkshA1 | 2.11 ± 0.05 | 3.02 ± 0.05 | 1.65 ± 0.01 | 4.22 ± 0.09 | 2.11 ± 0.03 | 2.64 ± 0.15 |
| ΔkshA2 | 1.72 ± 0.04 | 3.57 ± 0.03 | 1.96 ± 0.13 | 4.74 ± 0.20 | 2.03 ± 0.02 | 21.44 ± 1.73 |
| ΔkshA3 | 1.45 ± 0.04 | 3.73 ± 0.04 | 1.55 ± 0.03 | 4.10 ± 0.12 | 2.04 ± 0.06 | 2.27 ± 0.09 |
Publisher’s Note: MDPI stays neutral with regard to jurisdictional claims in published maps and institutional affiliations. |
© 2021 by the authors. Licensee MDPI, Basel, Switzerland. This article is an open access article distributed under the terms and conditions of the Creative Commons Attribution (CC BY) license (https://creativecommons.org/licenses/by/4.0/).
Share and Cite
Baldanta, S.; Navarro Llorens, J.M.; Guevara, G. Further Studies on the 3-Ketosteroid 9α-Hydroxylase of Rhodococcus ruber Chol-4, a Rieske Oxygenase of the Steroid Degradation Pathway. Microorganisms 2021, 9, 1171. https://doi.org/10.3390/microorganisms9061171
Baldanta S, Navarro Llorens JM, Guevara G. Further Studies on the 3-Ketosteroid 9α-Hydroxylase of Rhodococcus ruber Chol-4, a Rieske Oxygenase of the Steroid Degradation Pathway. Microorganisms. 2021; 9(6):1171. https://doi.org/10.3390/microorganisms9061171
Chicago/Turabian StyleBaldanta, Sara, Juana María Navarro Llorens, and Govinda Guevara. 2021. "Further Studies on the 3-Ketosteroid 9α-Hydroxylase of Rhodococcus ruber Chol-4, a Rieske Oxygenase of the Steroid Degradation Pathway" Microorganisms 9, no. 6: 1171. https://doi.org/10.3390/microorganisms9061171
APA StyleBaldanta, S., Navarro Llorens, J. M., & Guevara, G. (2021). Further Studies on the 3-Ketosteroid 9α-Hydroxylase of Rhodococcus ruber Chol-4, a Rieske Oxygenase of the Steroid Degradation Pathway. Microorganisms, 9(6), 1171. https://doi.org/10.3390/microorganisms9061171