Article

Critical Role of 3′-Downstream Region of pmrB in Polymyxin Resistance in Escherichia coli BL21(DE3)

1
Department of Animal Science, University of Tennessee, Knoxville, TN 37996, USA
2
Institute of Animal Husbandry and Veterinary Medicine, Beijing Academy of Agriculture and Forestry Sciences, Beijing 100097, China
3
Graduate School of Life and Environmental Sciences & Asian Health Science Institute, Osaka Prefecture University, Osaka 599-8531, Japan
4
College of Animal Science and Technology, Henan University of Science and Technology, Luoyang 471000, China
5
Department of Biochemistry, Duke University Medical Center, Durham, NC 27708, USA
*
Author to whom correspondence should be addressed.
F.Z., A.H. and X.Z. contributed equally to this work.
Microorganisms 2021, 9(3), 655; https://doi.org/10.3390/microorganisms9030655
Submission received: 19 February 2021 / Revised: 16 March 2021 / Accepted: 18 March 2021 / Published: 22 March 2021
(This article belongs to the Section Molecular Microbiology and Immunology)

Abstract

:
Polymyxins, such as colistin and polymyxin B, are the drugs used as a last resort to treat multidrug-resistant Gram-negative bacterial infections in humans. Increasing colistin resistance has posed a serious threat to human health, warranting in-depth mechanistic research. In this study, using a functional cloning approach, we examined the molecular basis of colistin resistance in Escherichia coli BL21(DE3). Five transformants with inserts ranging from 3.8 to 10.7 kb displayed significantly increased colistin resistance, three of which containing pmrB locus and two containing pmrD locus. Stepwise subcloning indicated that both the pmrB with a single G361A mutation and at least a 103 bp downstream region of pmrB are essential for conferring colistin resistance. Analysis of the mRNA level and stability showed that the length of the downstream region drastically affected the pmrB mRNA level but not its half-life. Lipid A analysis, by mass spectrometry, revealed that the constructs containing pmrB with a longer downstream region (103 or 126 bp) have charge-altering l-4-aminoarabinose (Ara4N) and phosphoethanolamine (pEtN) modifications in lipid A, which were not observed in both vector control and the construct containing pmrB with an 86 bp downstream region. Together, the findings from this study indicate that the 3′-downstream region of pmrB is critical for the PmrB-mediated lipid A modifications and colistin resistance in E. coli BL21(DE3), suggesting a novel regulatory mechanism of PmrB-mediated colistin resistance in E. coli.

1. Introduction

Polymyxins, such as colistin (also known as “polymyxin E”) and polymyxin B, are polycationic peptide antibiotics with broad-spectrum activity against Gram-negative bacterial pathogens (such as Escherichia coli, Pseudomonas aeruginosa, Acinetobacter baumannii and Klebsiella pneumoniae). Colistin was introduced into clinical usage in the 1960s but was replaced by other antibiotics due to concerns of nephrotoxicity and neurotoxicity [1]. Since the 1990s, with the advent of multidrug-resistant (MDR) Gram-negative bacteria, colistin has been re-introduced and considered as one of the drugs used as a last resort to treat MDR Gram-negative bacterial infections in humans [2]. However, colistin resistance has been arising in various significant Gram-negative bacteria, posing a serious threat to the clinical treatment of MDR pathogens [3].
Colistin acts on Gram-negative bacteria by disrupting the integrity of the outer membrane of Gram-negative bacteria. Cationic colistin can bind negatively charged lipopolysaccharide (LPS), which is anchored at the outer leaflet of the outer membrane through lipid A moiety. In normal conditions, divalent cations, such as Mg2+ and Ca2+, form ionic bridges between nearby lipid A to stabilize the outer membrane [4]. Cationic colistin can competitively displace Mg2+ and Ca2+ from the lipid A, because colistin displays several orders of magnitude higher affinities to lipid A than those divalent cation ions [5]. The displacement of divalent cation ions by colistin destabilizes the LPS molecules, therefore weakening the permeability barrier function of the outer membrane [1,6].
To date, several strategies used by bacteria to resist colistin have been observed and investigated [7,8]. A major and conserved resistance mechanism is LPS modification, such as modifications of lipid A with cationic l-4-aminoarabinose (Ara4N) and phosphoethanolamine (pEtN) via the two-component regulatory system PhoP-PhoQ (PhoPQ) and PmrA-PmrB (PmrAB) [8]. The modification of lipid A with specific cationic moiety (Ara4N or pEtN) decreases the negative charge of the lipid A, consequently leading to resistance to the cationic polymyxin antibiotics [8]. Specifically, the PmrAB system is considered as a major regulatory system in polymyxin resistance [9,10,11]. PmrB, a sensor kinase, responds to different signals, such as cationic antimicrobial peptides, mildly acidic pH and high Fe3+ concentration [10,12,13], and then promotes phosphorylation of the PmrA regulator. PmrD interacts with phosphorylated PmrA, protecting it from dephosphorylation [14]. Phosphorylated PmrA transcriptionally activates downstream effectors, such as two key enzymes, EptA (pEtN modification enzyme) and ArnT (Ara4N modification enzyme), which catalyze lipid A modification [9,15]. The PhoPQ system responds to the signals of low Mg2+ concentration and cationic antimicrobial peptides [16,17,18] and can indirectly affect PmrAB-activated genes via the PhoP-activated connector protein PmrD [19,20].
Escherichia coli BL21 (DE3) (designated as “BL21” hereinafter) is a model organism for research as well as a workhorse for biotechnology, such as the production of recombinant proteins. During our recent colistin research [21], we were surprised to observe that BL21 displayed clinical resistance to colistin (MIC = 16 µg/mL), which was confirmed in two BL21 strains purchased from different suppliers, Stratagene (La Jolla, CA, USA) and Novagen (Madison, WI, USA). In this study, the colistin resistance mechanism of BL21 was further investigated using a functional cloning approach in conjunction with genetic manipulations and lipid A species analysis. Our findings indicate that the 3′-downsstream region of pmrB plays a critical role in the expression and functionality of pmrB in BL21.

2. Materials and Methods

2.1. Bacterial Strains, Plasmids and Culture Conditions

The major bacterial strains and plasmids used in this study are listed in Table 1. E. coli strains were grown in Luria-Bertani (LB) broth or Mueller Hinton (MH) broth (Becton, Dickinson and Company, Franklin Lakes, NJ, USA) with shaking (250 rpm) or on agar at 37 or 32 °C overnight. When needed, culture media were supplemented with ampicillin (100 μg/mL, Fisher Scientific, Pittsburgh, PA, USA), kanamycin (30 μg/mL, Fisher Scientific, Pittsburgh, PA, USA) and/or colistin sulfate (2 μg/mL, ACROS, Geel, Belgium).

2.2. Transformation of TOP10 with Putative Colistin-Resistant Genes and Different Lengths of pmrB from BL21

Genes of eptA, eptB, cptA, opgE, pmrD, pmrAB [6,25] and different lengths of pmrB, were cloned into the cloning vector pZE21 [22] and introduced to colistin-susceptible host strain TOP10. Briefly, the selected genes were PCR amplified with corresponding primers (listed in Table 2) and PfuUltra DNA polymerase (Stratagene) using genomic DNA of BL21 as the template. The blunt-ended PCR products were digested with BamHI and ligated into the BamHI/EcoRV double digested pZE21. Different lengths of pmrB PCR products were digested with corresponding restriction enzymes (as indicated in Table 2) and ligated into the same enzyme digested pZE21. These ligation mixes were transformed into E. coli TOP10. Plasmids were extracted from transformants and validated by Sanger sequencing with primer pZE-F and pZE-R (Table 2). Those transformants were streaked onto the LB plates containing 50 μg/mL of kanamycin and 2 μg/mL of colistin to test colistin susceptibility.

2.3. Functional Cloning of Colistin-Resistant Elements from BL21

The colistin-resistant BL21 strain was used as the genomic DNA donor for functional cloning as previously described [26]. Total bacterial genomic DNA of BL21 was extracted using the Wizard® Genomic DNA Purification Kit (Promega, Madison, WI, USA). Approximately 20 µg of bacterial genomic DNA was sheared using a Covaris M220 Focused ultrasonicator (Covaris Inc., Woburn, MA, USA). The fragment size was determined on 0.8% agarose gels (with 0.4 µg/mL ethidium bromide). The gel slices with sizes ranging from 1 to 4 kb were excised, and the DNA was extracted using QIAquick® Gel extraction kit (Qiagen, Valencia, CA, USA). Extracted fragments were then blunt-ended using the End-it® end repair kit (Epicentre, Middleton, WI, USA). End-repaired fragments were purified from the reaction mix by using QIAquick PCR purification kit (Qiagen) and ligated to an EcoRV-digested, dephosphorylated pZE21-MCS cloning vector [22] using the Fast-Link® ligation kit (Lucigen, Middleton, WI, USA) in a reaction mix containing 4 μL of vector DNA (200 ng), 12 μL of sheared DNA (600 ng), 2 μL of 10× Fast-Link buffer, 1 μL of 10 mM ATP and 1 μL of T4 ligase (2 U/µL). The ligation mix was incubated overnight at room temperature (22 °C). A total 2 μL of the ligation mix was electroporated into 50 μL of ONE-SHOT® TOP10 electrocompetent cells (Invitrogen). Electroporation was conducted using the MicroPulser Electroporation system (Bio-Rad, Hercules, CA, USA) with the pre-programmed setting Ec1 (for E. coli in 0.1 cm cuvette, 1.8 kV, 1 pulse). Cells were immediately recovered in 1 mL of SOC medium by shaking at 250 rpm for 1 h at 37 °C. After recovery, 10 μL of the recovered cells was used for determining the library size. Cells were serially diluted in LB broth and plated on LB agar plates containing 50 μg/mL of kanamycin for determination of total colony-forming units (CFUs) of the 1 mL recovered cells. The size of the library was then estimated by multiplying the total CFU of recovered cells and the average size (3 kb) of the inserted fragments. The rest of the transformation mixes were inoculated into 10 mL LB broth supplemented with 50 μg/mL of kanamycin and grown overnight at 37 °C. The overnight cultures were spread onto the LB agar plates (100 μL/each) containing 50 μg/mL of kanamycin and 2 μg/mL of colistin for screening. Colonies was streaked again onto LB agar plates containing 50 μg/mL of kanamycin and 2 μg/mL of colistin to confirm the colistin resistance. Real positive colonies were grown in LB broth containing 50 μg/mL of kanamycin and subsequently subjected to plasmid extraction. Plasmids were sequenced using Sanger sequencing.

2.4. Site-Directed Mutagenesis of the Genes in BL21

Lambda-red-based homologous recombination technology using a pSIM6 vector (supplied by Dr. Donald Court) [24] was used to knockout target genes in BL21. Mutational fragments encompassing an FRT-kan-FRT cassette in pKD13 template plasmid [23] with 50 nt homologous arms immediately flanking each targeted region (primers in Table 2) were electroporated into 50 µL of heat-shock-induced electrocompetent cells using MicroPulser Electroporation Apparatus (Bio-Rad) and a 0.1 cm gapped electroporation cuvette (Bio-Rad) with the EC1 program (1.8 kV). Recombinants were selected for kanamycin (kan) resistance (30 µg/mL) at 32 °C for 1–2 days, and then streaked onto LB plates and incubated at elevated temperature (37 °C) to remove pSIM6. The mutation was further verified by PCR using flanking primers (Table 2) and k1 [23].

2.5. Antimicrobial Susceptibility Test

The susceptibilities of E. coli strains to colistin sulfate were determined by a standard microtiter broth dilution method with an inoculum of 106 CFU/mL as previously described [27,28]. Minimum inhibitory concentration (MIC) for colistin was determined by the lowest concentration of the antimicrobial showing complete inhibition of bacterial growth after 18 h incubation at 37 °C.

2.6. Quantitative Real-Time RT-PCR (qRT-PCR) Analysis of pmrB mRNA Level at Steady Phase

The TOP10 derivative strains JL1088, JL1381, JL1507 and JL1509 were used to determine the pmrB mRNA level at steady phase. These four strains contain parent pZE21 vector, pPmrB, pUS150-PmrB-DS86 and pUS150-PmrB-DS126 (Figure 1), respectively. The primer pair, RT-PmrB-BL21SNP-F3 and RT-PmrB-BL21SNP-R3 (Table 2), which was designed by targeting the G361A mutation region in pmrBBL21 using the method as previously described [29], can specifically detect the pmrB from BL21 while barely amplifying the pmrB in TOP10 chromosome. To prepare RNA, E. coli was cultured to logarithm phase (OD600nm = 0.5–1.0), and 500 µL of the E. coli culture was taken and mixed with 1 mL RNAprotect bacterial reagent (Qiagen). Total RNA from each sample was extracted using an RNeasy mini kit (Qiagen). Genomic DNA was removed with DNase I (Qiagen) digestion, and RNA was re-purified using an RNeasy mini kit (Qiagen). Subsequent qRT-PCR analysis was carried out as previously described [28,30]. 16S rRNA gene was targeted as an internal control using primers 16S-F and 16S-R (Table 2). The relative changes (expressed as −ΔΔCt) of pmrB mRNA levels between JL1088 and other strains were calculated as described before [28]. Each sample was measured in triplicate, and three independent experiments were performed.

2.7. Determination of Decay Rate of pmrB mRNA

TOP10 derivative strains JL1507 and JL1509, which contain pUS150-PmrB-DS86 and pUS150-PmrB-DS126, respectively, were used to determine the pmrB mRNA decay rate (half-life) using the rifampin arrest method as previously described [30] with some modifications. Briefly, E. coli overnight cultures were inoculated into fresh medium containing kanamycin (30 μg/mL), and grew to logarithm phase (OD600nm = 0.5–1.0) in an orbital shaker (250 rpm) at 37°C. Rifampin (500 μg/mL) was then added to the cultures and mixed well. At different time points (0, 1, 2, 5, 10, 20, 40 and 70 min) after the addition of rifampin, 500 µL of the E. coli culture was taken and added to 1 mL RNAprotect bacterial reagent (Qiagen). Total RNA from each sample was extracted, digested with DNase I and re-purified as described above. The primer pair, RT-PmrB-BL21SNP-F3/RT-PmrB-BL21SNP-R3 and 16S-F/16S-R (Table 2), was used in qRT-PCR to determine the mRNA abundance as described previously [31]. Each sample was measured in triplicate, and three independent experiments were performed.

2.8. Lipid A Profile Analysis

Lipid A was extracted from bacterial pellets using the Bligh–Dyer method [32,33]. Approximately 200 mL of logarithmic phase (OD600nm = 0.8–1) cell culture of each strain was used for lipid A extraction. Once extracted, lipid A samples were subjected to liquid chromatography/electrospray ionization-mass spectrometry (LC/ESI-MS) analysis at Duke Medical Center as previously described [34,35]. Briefly, normal phase LC-ESI MS of the lipid extracts was performed using an Agilent 1200 Quaternary LC system coupled to a high resolution TripleTOF5600 mass spectrometer (Sciex, Framingham, MA, USA). Chromatographic separation was performed on a Unison UK-Amino column (3 μm, 25 cm × 2 mm) (Imtakt USA, Portland, OR, USA). Lipids were eluted with mobile phase A, consisting of chloroform/methanol/aqueous ammonium hydroxide (800:195:5, v/v/v); mobile phase B, consisting of chloroform/methanol/water/aqueous ammonium hydroxide (600:340:50:5, v/v/v/v); and mobile phase C, consisting of chloroform/methanol/water/aqueous ammonium hydroxide (450:450:95:5, v/v/v/v), over a 40 min run, performed as follows: 100% mobile phase A was held isocratically for 2 min and then linearly increased to 100% mobile phase B over 14 min and held at 100% B for 11 min. The mobile phase composition was then changed to 100% mobile phase Cover 3 min and held at 100% C for 3 min, and finally returned to 100% A over 0.5 min and held at 100% A for 5 min. The LC eluent (with a total flow rate of 300 µL/min) was introduced into the ESI source of the high resolution TF5600 mass spectrometer. MS and MS/MS were performed in negative ion mode, with the full-scan spectra being collected in the m/z 300-2000 range. The MS settings are as follows: ion spray voltage (IS) = −4500 V, curtain gas (CUR) = 20 psi, ion source gas 1 (GS1) = 20 psi, de-clustering potential (DP) = −55 V, and focusing potential (FP) = −150 V. Nitrogen was used as the collision gas for tandem mass spectrometry (MS/MS) experiments. Data analysis was performed using Analyst TF1.5 software (Sciex, Framingham, MA, USA).

2.9. Statistical Analysis

Real-Time PCR results for analysis of the pmrB mRNA level at steady phase were tested by analysis of variance (ANOVA) using SAS software (v. 9.03). Two-way ANOVA followed by a least significant difference (LSD) test was used to assess the significance of differences among relative changes (expressed as −ΔΔCt) of pmrB mRNA levels. The qRT-PCR data used to calculate the pmrB mRNA half-life were analyzed using GraphPad Prism software (GraphPad, San Diego, CA, USA). The mRNA half-life was determined by one-phase decay using a nonlinear regression model, and the Kolmogorov–Smirnov statistic was used to determine if differences in distributions were significant, as previously described [30]. Levels of significance for p value are 5% (0.05).

3. Results

3.1. The Genes from BL21 Implicated in Polymyxin Resistance Failed to Confer Colistin Resistance in TOP10

Initially, we examined a panel of genes potentially involved in polymyxin resistance by using the same functional rescuing approach previously described [21]. The open reading frames (ORFs) of selected genes (eptA, eptB, cptA, opgE, pmrD and pmrA-pmrB) were cloned from BL21 into a pZE21 expression vector, respectively; the expression of the cloned gene was driven by the strong promoter PLtetO-1 [22]. None of these genes could lead to increased MIC of colistin in the TOP 10 strain (data not shown). In particular, based on the examination of the BL21 genome sequence (GenBank Accession #: AM946981.2), we observed a single nucleotide mutation in pmrB gene (G361A) that led to Glu-121-Lys aa substitution in PmrB. However, the plasmid bearing pmrBBL21 failed to confer colistin resistance in TOP10. This preliminary study led us speculate that a new polymyxin resistance mechanism may exist in BL21 and prompted us to systematically identify relevant genetic loci using a functional cloning approach, which was successfully used in our previous study [26].

3.2. Discovery of Colistin-Resistant Determinants Using Functional Cloning

A total of five transformants (JL1365-1369; Table 1 and Table 3) were identified and confirmed to grow on LB agar plates supplemented with 2 µg/mL of colistin. Plasmid from each transformant was extracted, and the insert region was sequenced. The features of the inserted region are summarized in Table 3. Of note, the majority of the constructs (except JL1366) contained chimeric segments from distant regions in BL21, which was due to the ligation issue (Table 3). Gene annotation revealed a panel of genes that are known to involve polymyxin resistance (red text in Table 3). For example, two major loci, pmrD and pmrB, were commonly observed in these transformants. The pmrD and its adjacent regions (800 bp upstream and downstream of pmrD) were identical between BL21 and E. coli K12 (MG1655), a colistin susceptible strain. This evidence together with the inability of BL21-derived PmrD to confer colistin resistance in TOP10 suggests that other distant genetic elements (e.g., arnF) in those plasmids may contribute to colistin resistance.
It was intriguing that the pmrBBL21 gene that was ruled out in our initial preliminary screening was shown in three resistant constructs (JL1366, JL1367 and JL1369) (Table 3). Comparison of the sequenced pmrBBL21 in these constructs to those from colistin susceptible E. coli K12 strains (e.g., MG1655, TOP10 and DH5α) further confirmed the existence of a single G361A mutation in the ORF of pmrBBL21. This finding suggests that PmrB is indeed a key player for the acquired colistin resistance in BL21, and prompted us to continue to examine the role of pmrBBL21 gene and its 3′-downstream region in colistin resistance in BL21.

3.3. PmrB but Not PhoQ Is Required for Colistin Resistance in BL21

To accurately define the critical role of pmrB in the colistin resistance of BL21, different approaches were used to create isogenic pmrB mutant of BL21. We first used pKD46 as a lambda red recombinase provider [23], which was induced by adding L-arabinose and has been reported to work successfully in E. coli K-12 strains. However, we did not obtain desired mutants, although we tested multiple conditions (concentration and timing of L-arabinose inducer, and different length of homologous arms). Given that BL21 is araBAD+ and can metabolize l-arabinose [36], lambda red recombinase may not be efficiently induced by the supplementation of L-arabinose to generate the desired mutant. To address this technical challenge uniquely associated with BL21, pSIM6 plasmid (a generous gift from Dr. Donald L. Court at National Cancer Institute), which produces lambda red recombinase upon heat induction [24], was subsequently used in this study. Using pSIM6 plasmid, we obtained isogenic pmrB mutant successfully. As shown in Table 4, the inactivation of pmrB in BL21 drastically reduced colistin MIC to 0.5 μg/mL when compared to parent BL21 (colistin MIC = 16 μg/mL). Since a PhoPQ two-component regulatory system can indirectly activate PmrAB-regulated genes via the connector protein PmrD [9,10,37], an isogenic phoQ mutant of BL21 (JL1435; Table 1) was also generated using the same mutagenesis strategy. As shown in Table 4, the phoQ mutant still displayed colistin resistance at a level comparable to that of its parent BL21 (MIC = 16 μg/mL). Thus, the PmrB rather than PhoQ plays a critical role in colistin resistance in BL21.

3.4. Identification of Critical 3′-Downstream Region of pmrB Required for Colistin Resistance

The insert in the plasmid carried by JL1369 contains a 2369 bp fragment (annotated as purT-eda-edd) and a 2900 bp fragment (annotated as proP-pmrB-pmrA) (Table 3). Since the abovementioned site-directed mutagenesis study demonstrated that pmrB is critical for colistin resistance, we then performed stepwise subcloning focusing on pmrB locus. The 2897 bp fragment (Figure 1A), which contains partial proP, full length pmrB and partial pmrA, was PCR amplified and cloned into pZE21; the resulting recombinant plasmid pPmrA-PmrB-ProP (Table 1) conferred colistin resistance in E. coli TOP10 (MIC = 16 µg/mL). Further subcloning produced a much smaller fragment that could still confer the same level of colistin resistance in TOP10 (JL1431, MIC = 16 µg/mL), which includes 150 bp upstream and 176 bp downstream regions of pmrB (Figure 1A and Table 4). Notably, the corresponding fragment derived from E. coli MG1655, which does not have the G361A single nucleotide mutation observed in BL21, failed to confer colistin resistance in TOP10 (Table 4). This finding demonstrated that the G361A single nucleotide mutation in BL21 caused a functionality change in PmrB, leading to acquired colistin resistance in BL21.
Given that the TOP10 derivatives, JL1371 and JL1381, which carry pmrB-pmrA ORF and pmrB ORF, respectively, displayed the same susceptibility to colistin (MIC = 0.5 µg/mL), the 176 bp downstream sequence of pmrB clearly played a critical role in PmrB-mediated colistin resistance in BL21. It was reported that the 3′-untranslated region (UTR) of a specific gene may form secondary structures, consequently affecting the expression and function of the preceding genes [30,38]. Analysis of 3′-UTR of pmrB using RNAfold WebServer [39] revealed multiple stem-loop structures (Figure 1B). Therefore, multiple sites, which represent transition points between stems and loops within the 3′-downstream +176 bp region (such as +34, +86, +103, +126, +134 bp; Figure 1A,B), were chosen for further subcloning, leading to a panel of constructs (Figure 1A). As shown in Table 4, up to 34 or 86 bp of the pmrB downstream region still failed to confer colistin resistance in TOP10. However, up to 103 bp of the downstream region of pmrB conferred a significantly increased colistin resistance (MIC = 4 µg/mL), while the longer regions (+126 or +134 region) could confer colistin resistance to the same level as that observed for the +176 bp region (MIC = 16 µg/mL; Table 4). These results clearly indicate that 3′-UTR of pmrB plays an important role in colistin resistance in E. coli.

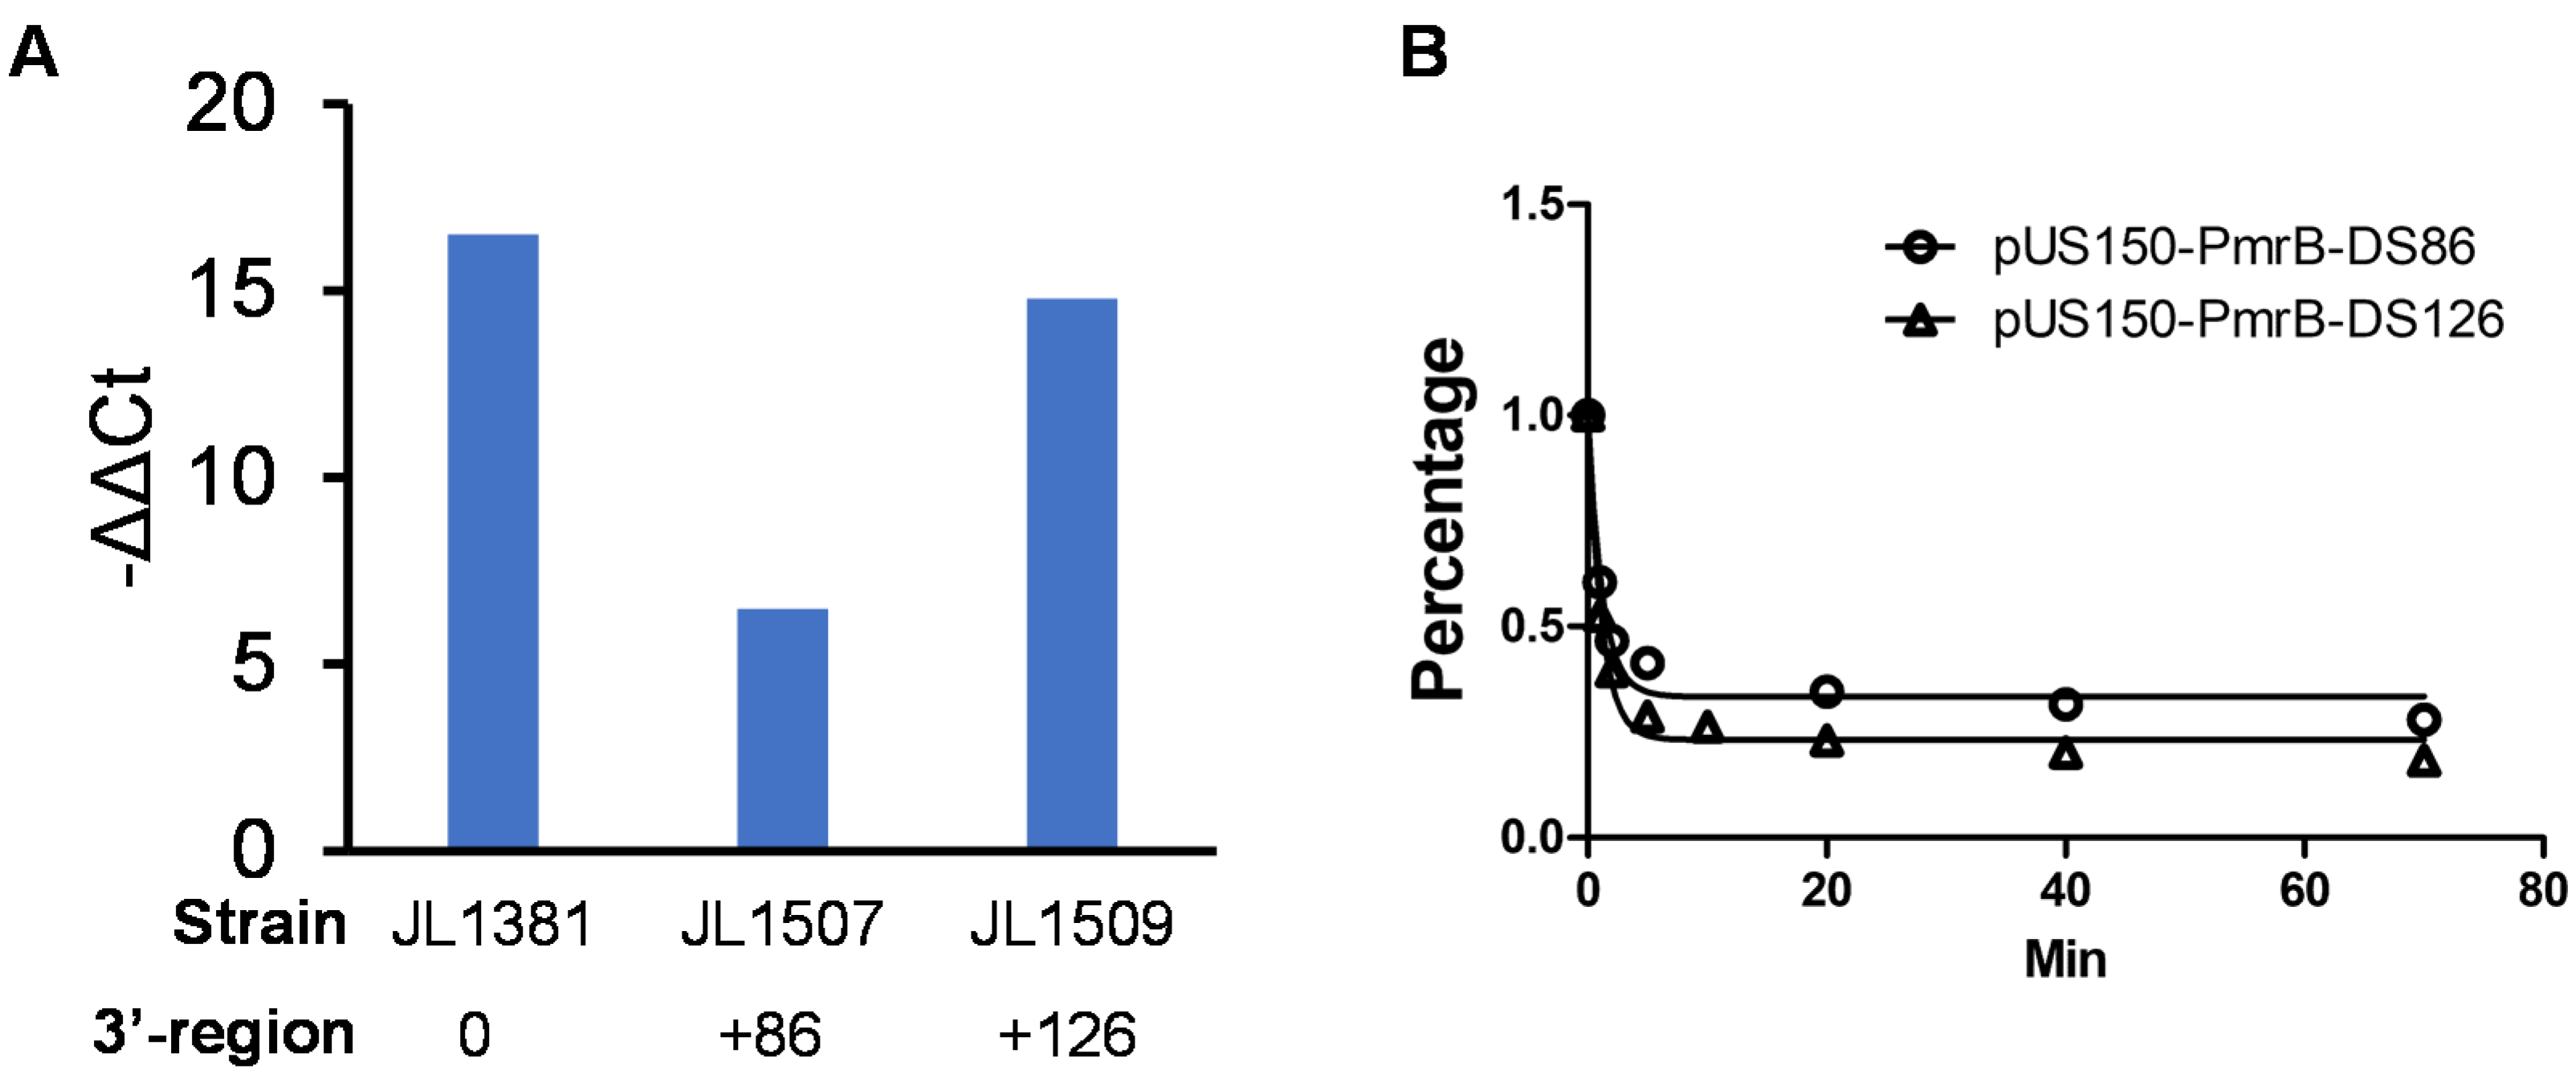
3.5. 3′-Downstream Region of pmrB Modulates the Expression Level of pmrB

The findings from the abovementioned stepwise subcloning showed that the function of pmrBBL21 was affected by the length of the 3′-downstream region. It is likely that this phenotypic response was caused by the difference in the expression levels of pmrB in different constructs. To test this, the mRNA level of pmrB was assessed in selected representative strains using qRT-PCR with a pair of PCR primers (RT-PmrB-BL21SNP-F3 and RT-PmrB-BL21SNP-R3; Table 2) that specifically target the pmrBBL21 containing a single G361A mutation. Initial RT-PCR using TOP10 and BL21 genomic DNA as templates demonstrated that this pair of specific primers could efficiently distinguish the pmrBBL21 and the TOP10 chromosomal pmrB with only a single nucleotide difference. Specifically, using the primer pair together with a similar amount of genomic DNA (4 ng/µL) as a template, the Ct value for the amplicon from BL21 was 15.1, while the Ct value for the amplicon from TOP10 was 32.0. In addition, endogenous pmrB in JL1088 the control strain (Table 1; TOP10/pZE21) was also barely detected by this pair of primers; therefore, JL1088 was used as the baseline for the comparison of the level of pmrBBL21 in the three selected TOP10 derivative strains (Figure 2A). The JL1381 (TOP10/pPmrB), which only contains pmrB ORF, displayed the highest level of pmrBBL21 (−ΔΔCt = 16.5) (Figure 2A). The mRNA level of pmrBBL21 in JL1507 (−ΔΔCt = 6.5) that carries 86 bp of 3′-UTR was significantly lower (approximately 315-fold lower, P < 0.05) than the mRNA level of pmrBBL21 in JL1509 (−ΔΔCt = 14.8) that carries longer 3′-UTR (+126) (Figure 2A).

3.6. 3′-Downstream Region Did Not Affect mRNA Stability of pmrB

Since a significantly low level of pmrBBL21 mRNA was observed in JL1507 when compared to that in JL1509 (Figure 2A), the 3′-UTR length may modulate and determine the stability of pmrBBL21 mRNA, as observed in the regulation of other genes [30,38]. To test this hypothesis, the half-life of pmrB in JL1507 and JL1509 was further measured by rifampin arrest treatment followed by qRT-PCR. As shown in Figure 2B, after adding rifampin to stop new mRNA synthesis, the mRNA level of in both strains started to decrease rapidly at a similar rate. For JL1507 that carries plasmid pUS150-PmrB-DS86, the half-life of pmrB was 1.0 min (goodness-of-fit R2: 0.9786), while the pmrB mRNA half-life in JL1509 was 0.83 min (goodness-of-fit R2: 0.9572). The difference in mRNA in the half-life between JL1507 and JL1509 was not statistically significant (p > 0.05), indicating that the mRNA decay rate in the two strains is similar.

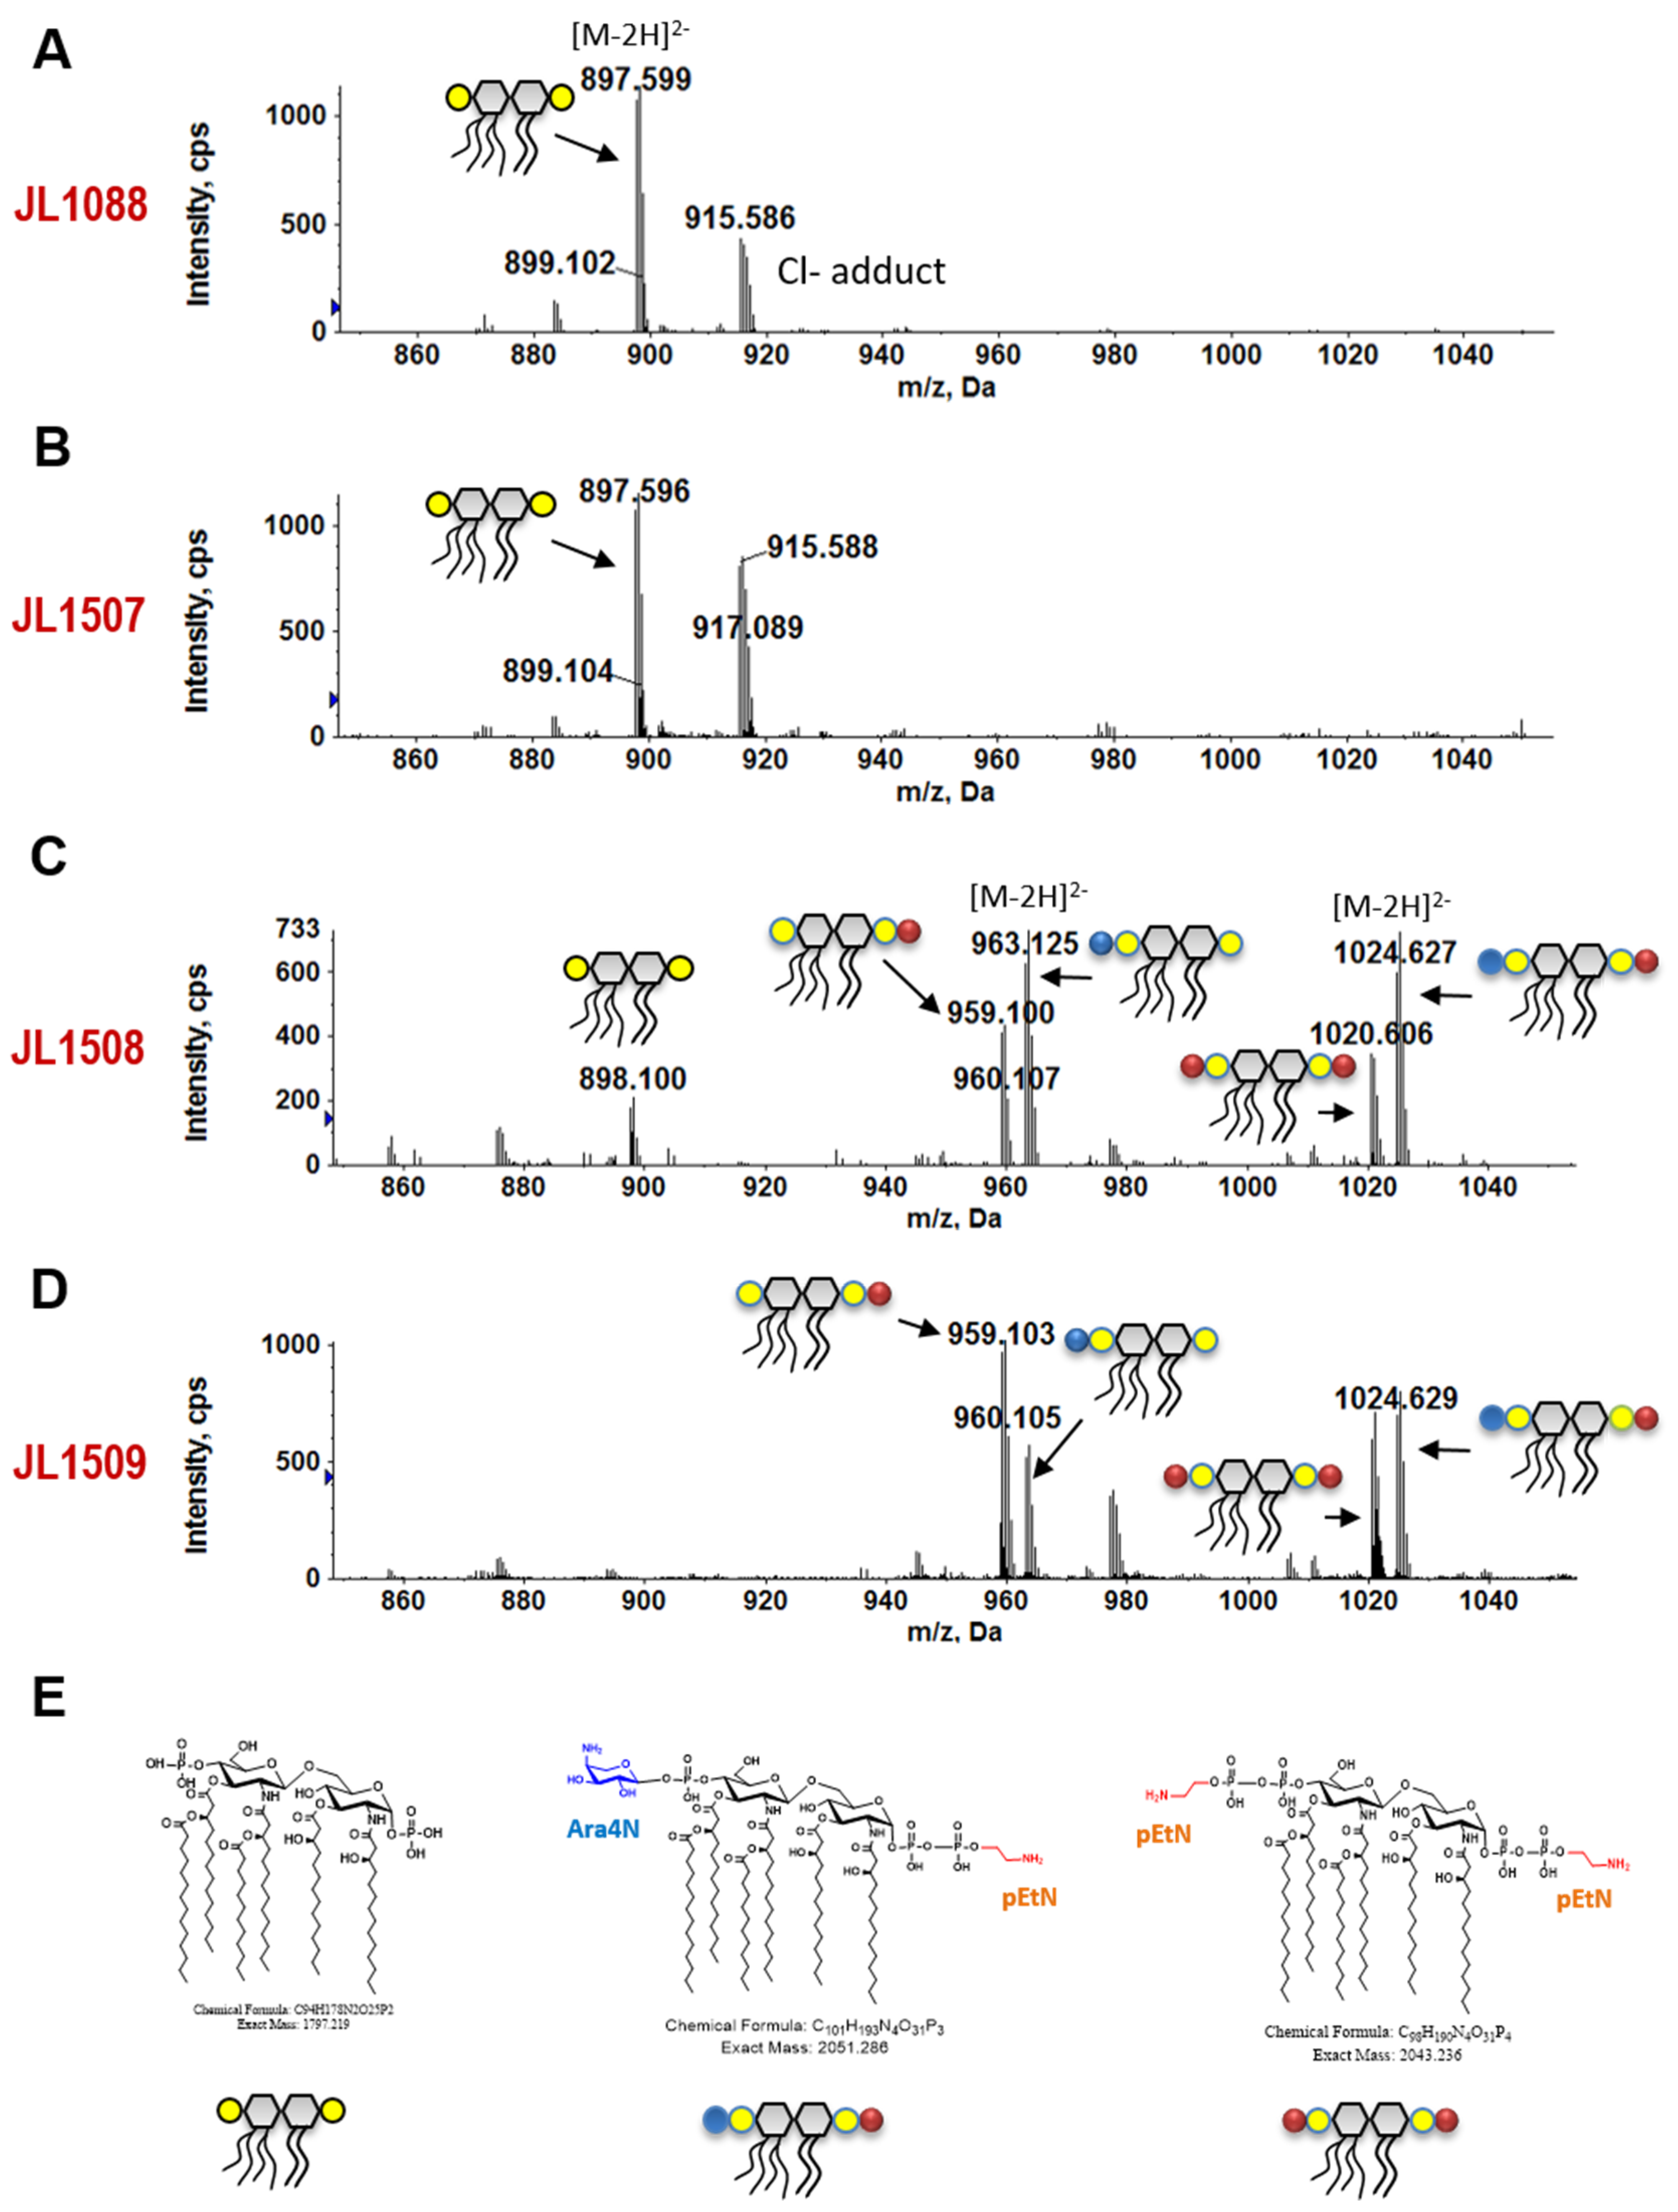
3.7. 3′-Downstream Region of pmrB Modulates Lipid A Modification

Lipid A profiles of selected strains carrying different lengths of the 3′-downstream region of pmrBBL21 were analyzed using LC/ESI-MS. As predicted, there were no pEtN and Ara4N modifications in the JL1088 vector control strain (Figure 3A) and JL1507 that carries 86 bp of 3′-UTR (Figure 3B), consistent with their susceptibility to colistin (Table 4). In contrast, JL1508 and JL1509, which contain 103 and 126 bp of the pmrB downstream region, respectively, displayed charge-altering modifications in their lipid A, including a single modification with Ara4N or pEtN, double modifications with the same moiety pEtN and double modifications with different moieties (Ara4N and pEtN) (Figure 3C,D). These positively charged moieties reduced the negative charges of lipid A and limited its interaction with colistin, which is cationic. A close comparison of the lipid A profiles of JL1508 and JL1509 showed their modification differences. Specifically, JL1508 appeared to have more Ara4N (or less pEtN) modification than JL1509, suggesting that ArnT (responsible for the Ara4N modification) is more active in JL1508, while EptA (responsible for the pEtN modification) is more active in JL1509.

4. Discussion

In this study, the colistin resistance mechanism of E. coli BL21, a bacterial strain widely used for research and commercial biotechnology, was explored using a functional cloning approach. A total of five colistin-resistant clones were identified, and two major loci, pmrB and pmrD (Table 3), were found to be potentially responsible for the colistin resistance in BL21. In this study, the role of pmrBBL21 in colistin resistance was further investigated. The findings from a panel of molecular manipulations (site-directed mutagenesis and complementation) provide compelling evidence that the G361A single nucleotide mutation in pmrBBL21 caused a functionality change in PmrB, leading to acquired colistin resistance in BL21; this is consistent with other studies showing that a single point mutation in PmrAB and/or PhoPQ could result in sustained polymyxin resistance [7,8]. However, for the first time, we also demonstrated the critical role of the 3′-downstream region of pmrB in colistin resistance in E. coli BL21 using delicate molecular manipulation in conjunction with comprehensive characterizations, such as the MIC test, the mRNA level and stability analyses, and LC/ESI-MS analysis of the lipid A profile. Up to 126 bp of pmrBBL21 3′-UTR was needed to confer full colistin resistance (MIC = 16 μL/mL), while the pmrBBL21 with 86 bp or less 3′-UTR failed to confer any colistin resistance in susceptible TOP10 host strain (Table 4). Different lengths of 3′-UTR caused significant difference in the expression level of pmrBBL21 (Figure 2A) but did not affect mRNA stability (Figure 2B). Consistent with MIC data, as expected, the pmrBBL21 with long 3′-UTR is not only required for acquired colistin resistance but also extensive modifications of lipid A (Table 4 and Figure 3).
It is interesting that the strain bearing pmrBBL21 ORF only (JL1381) displayed an exceptionally high level of pmrBBL21 mRNA (Figure 2A) but was still susceptible to colistin (MIC = 0.5 μg/mL; Table 4). PmrB, despite its annotation as a kinase, also has phosphatase activity to remove the phosphoryl group. In particular, it has been reported that E. coli PmrB displays higher phosphatase activity towards phosphor-PmrA than the Salmonella PmrB [40]. Therefore, the excessive production of PmrBBL21 by pPmrB in E. coli TOP10 may also dephosphorylate the activated phosphor-PmrA more quickly [14], leading to a lack of colistin resistance-related lipid A modification due to the dramatically decreased expression of the PmrA-activated lipid A modification enzymes, such as EptA and ArnT. This hypothesis will be examined in future studies.
PmrD, a PhoP-activated small protein that connects PhoPQ and PmrAB, two component regulatory systems [14], can also shift the equilibrium between the phosphorylated-PmrA and dephosphorylated-PmrA and determine the final level of phosphor-PmrA [14]. PmrD can specifically interact with phosphorylated PmrA, protecting it from PmrB-promoted dephosphorylation [14]. However, the BL21-derived PmrD itself does not seem to be a contributor to the acquired colistin resistance in two transformants (JL1365 and JL1368; Table 3) that contain pmrD locus. In particular, we demonstrated that the overexpression of pmrDBL21 did not confer colistin resistance in TOP10. The components other than PmrD in the two pmrD-carrying recombinant plasmids, such as the alternative PmrD regulatory element [41], may contribute to colistin resistance. To test this hypothesis, in the future, the same subcloning approach will be used to identify specific component(s) in the two recombinant plasmids that are required for colistin resistance.
With respect to the 3′-UTR region, we were specifically focused on the role of the secondary structure on pmrB expression and functionality in this study. It is important to mention that other genetic elements in the 3′-UTR region may also play a role in modulating the expression and function of pmrB. It was reported that one-third of mRNAs of Staphylococcus aureus carry 3′-UTRs longer than 100 nt [42]. In the mRNA of icaR, there is a base pairing between the 3′-UTR and the 5′ Shine-Dalgarno (SD) regions, which interferes with the formation of the translation initiation complex and generates a double-stranded hairpin substrate for RNase III [42]. In a different scenario, the 3′-UTR can also serve as a target of bacterial sRNAs [43] or a docking platform for RNA chaperone binding, consequently protecting mRNA from RNase II degradation [44]. Interestingly, the RNA chaperone ProQ, which binds to sRNAs and mRNA 3′-UTRs, was originally reported as an important modulator of proP, which is immediate downstream of pmrB (Figure 1A). Notably, the intergenic region between E. coli pmrB and proP is the 3′-downstream region of both genes. Further investigation is highly warranted to unveil possible roles of sRNA or RNA chaperones in PmrB-mediated polymyxin resistance in Gram-negative bacteria.
In addition to the RNA-related cis-elements discussed above, a small ORF (90 bp) that is transcribed in an opposite direction of pmrB with 25 bp overlapping region may contribute to the PmrB-mediated colistin resistance in BL21. Annotation analysis indicated that this gene encodes a small protein homologous to PmrR, which has only been reported in limited Salmonella studies [13,45]. In Salmonella, PmrR was observed to inhibit the activity of LpxT, an enzyme responsible for generating diphosphorylated lipid A at the 1-position and, therefore, increasing surface negative charge. The inhibition of LpxT by PmrR could prevent the increasing surface negative charge, leading to decreased affinity for Fe3+, the inducing signal of PmrAB systems. Thus, PmrR in Salmonella was proposed to participate in the negative feedback loop to the PmrAB pathway by reducing the binding affinity of inducing Fe3+ to sensor PmrB and consequently downregulating the transcription of PmrA-activated genes [13,45]. However, in this E. coli study, we observed that the long 3′-downstream region (such as in JL1508 and JL1509) where pmrR resides is required for the enhanced expression of PmrB, leading to lipid A modifications and increased resistance to colistin, which does not fit into the reciprocal control model of PmrR and PmrB [45]. We speculate that PmrR may behave differently in E. coli and Salmonella to modulate PmrAB-mediated polymyxin resistance, as we observed for PmrD [40,46]. This hypothesis will be examined in the future.

Author Contributions

Conceptualization, J.L., A.H. and X.Z.; methodology, F.X., A.H., X.Z., and Z.G. and J.L.; investigation, F.X., A.H., X.Z., X.-P.L. and Z.G. and J.L.; resources, F.X., Z.G. and J.L.; data curation, F.X., A.H., X.Z., Z.G. and J.L.; writing—original draft preparation, F.X., X.Z. and J.L.; writing—review and editing, F.X., A.H., X.Z., X.-P.L., Z.G. and J.L.; visualization, A.H., X.Z., F.X., Z.G. and J.L.; project administration, J.L.; and funding acquisition, F.X., A.H., Z.G. and J.L. All authors have read and agreed to the published version of the manuscript.

Funding

Fuzhou Xu was awarded the travel grant from the China Scholarship Council (201709110035). Atsushi Hinenoya was awarded the travel grant of the Overseas Research Scholar Program at Osaka Prefecture University. This work was supported by The University of Tennessee AgResearch, and NIH R56AI139105 and R01AI148366 (to ZG).

Institutional Review Board Statement

Not applicable.

Informed Consent Statement

Not applicable.

Data Availability Statement

No new data were created or analyzed in this study. Data sharing is not applicable to this article.

Acknowledgments

We thank Donald Court (National Cancer Institute, USA) for providing pSIM6 plasmid, and Barbara Gillespie and Abigail Sallee for providing technical support.

Conflicts of Interest

The authors declare that the research was conducted in the absence of any commercial or financial relationships that could be construed as a potential conflict of interest.

References

  1. Li, J.; Nation, R.L.; Milne, R.W.; Turnidge, J.D.; Coulthard, K. Evaluation of colistin as an agent against multi-resistant Gram-negative bacteria. Int. J. Antimicrob. Agents 2005, 25, 11–25. [Google Scholar] [CrossRef]
  2. Li, J.; Nation, R.L.; Turnidge, J.D.; Milne, R.W.; Coulthard, K.; Rayner, C.R.; Paterson, D.L. Colistin: The re-emerging antibiotic for multidrug-resistant Gram-negative bacterial infections. Lancet Infect. Dis. 2006, 6, 589–601. [Google Scholar] [CrossRef]
  3. Srinivas, P.; Rivard, K. Polymyxin Resistance in Gram-negative Pathogens. Curr. Infect. Dis. Rep. 2017, 19, 38. [Google Scholar] [CrossRef] [PubMed]
  4. Nikaido, H. Molecular Basis of Bacterial Outer Membrane Permeability Revisited. Microbiol. Mol. Biol. Rev. 2003, 67, 593–656. [Google Scholar] [CrossRef] [PubMed] [Green Version]
  5. Hancock, R.E. Peptide antibiotics. Lancet 1997, 349, 418–422. [Google Scholar] [CrossRef]
  6. Ahmed, M.A.E.E.-S.; Zhong, L.-L.; Shen, C.; Yang, Y.; Doi, Y.; Tian, G.-B. Colistin and its role in the Era of antibiotic resistance: An extended review (2000–2019). Emerg. Microbes Infect. 2020, 9, 868–885. [Google Scholar] [CrossRef] [Green Version]
  7. Poirel, L.; Jayol, A.; Nordmann, P. Polymyxins: Antibacterial Activity, Susceptibility Testing, and Resistance Mechanisms Encoded by Plasmids or Chromosomes. Clin. Microbiol. Rev. 2017, 30, 557–596. [Google Scholar] [CrossRef] [Green Version]
  8. Olaitan, A.O.; Morand, S.; Rolain, J.-M. Mechanisms of polymyxin resistance: Acquired and intrinsic resistance in bacteria. Front. Microbiol. 2014, 5, 643. [Google Scholar] [CrossRef] [PubMed] [Green Version]
  9. Gunn, J.S.; Lim, K.B.; Krueger, J.; Kim, K.; Guo, L.; Hackett, M.; Miller, S.I. PmrA-PmrB-regulated genes necessary for 4-aminoarabinose lipid A modification and polymyxin resistance. Mol. Microbiol. 1998, 27, 1171–1182. [Google Scholar] [CrossRef]
  10. Wösten, M.M.; Kox, L.F.; Chamnongpol, S.; Soncini, F.C.; Groisman, E.A. A Signal Transduction System that Responds to Extracellular Iron. Cell 2000, 103, 113–125. [Google Scholar] [CrossRef] [Green Version]
  11. Phan, M.-D.; Nhu, N.T.K.; Achard, M.E.S.; Forde, B.M.; Hong, K.W.; Chong, T.M.; Yin, W.-F.; Chan, K.-G.; West, N.P.; Walker, M.J.; et al. Modifications in the pmrB gene are the primary mechanism for the development of chromosomally encoded resistance to polymyxins in uropathogenic Escherichia coli. J. Antimicrob. Chemother. 2017, 72, 2729–2736. [Google Scholar] [CrossRef] [PubMed] [Green Version]
  12. Perez, J.C.; Groisman, E.A. Acid pH activation of the PmrA/PmrB two-component regulatory system of Salmonella enterica. Mol. Microbiol. 2007, 63, 283–293. [Google Scholar] [CrossRef] [PubMed] [Green Version]
  13. Herrera, C.M.; Hankins, J.V.; Trent, M.S. Activation of PmrA inhibits LpxT-dependent phosphorylation of lipid A promoting resistance to antimicrobial peptides. Mol. Microbiol. 2010, 76, 1444–1460. [Google Scholar] [CrossRef]
  14. Kato, A. Connecting two-component regulatory systems by a protein that protects a response regulator from dephosphorylation by its cognate sensor. Genes Dev. 2004, 18, 2302–2313. [Google Scholar] [CrossRef] [Green Version]
  15. Lee, H.; Hsu, F.-F.; Turk, J.; Groisman, E.A. The PmrA-Regulated pmrC Gene Mediates Phosphoethanolamine Modification of Lipid A and Polymyxin Resistance in Salmonella enterica. J. Bacteriol. 2004, 186, 4124–4133. [Google Scholar] [CrossRef] [Green Version]
  16. Véscovi, E.G.; Soncini, F.C.; Groisman, E.A. Mg2+ as an Extracellular Signal: Environmental Regulation of Salmonella Virulence. Cell 1996, 84, 165–174. [Google Scholar] [CrossRef] [Green Version]
  17. Bader, M.W.; Sanowar, S.; Daley, M.E.; Schneider, A.R.; Cho, U.; Xu, W.; Klevit, R.E.; Le Moual, H.; Miller, S.I. Recognition of Antimicrobial Peptides by a Bacterial Sensor Kinase. Cell 2005, 122, 461–472. [Google Scholar] [CrossRef] [Green Version]
  18. Gunn, J.S.; Richards, S.M. Recognition and Integration of Multiple Environmental Signals by the Bacterial Sensor Kinase PhoQ. Cell Host Microbe 2007, 1, 163–165. [Google Scholar] [CrossRef] [Green Version]
  19. Gunn, J.S.; Ryan, S.S.; Van Velkinburgh, J.C.; Ernst, R.K.; Miller, S.I. Genetic and Functional Analysis of a PmrA-PmrB-Regulated Locus Necessary for Lipopolysaccharide Modification, Antimicrobial Peptide Resistance, and Oral Virulence of Salmonella entericaSerovar Typhimurium. Infect. Immun. 2000, 68, 6139–6146. [Google Scholar] [CrossRef]
  20. Kox, L.F.; Wösten, M.M.; Groisman, E.A. A small protein that mediates the activation of a two-component system by another two-component system. EMBO J. 2000, 19, 1861–1872. [Google Scholar] [CrossRef] [Green Version]
  21. Xu, F.; Zeng, X.; Hinenoya, A.; Lin, J. MCR-1 Confers Cross-Resistance to Bacitracin, a Widely Used In-Feed Antibiotic. mSphere 2018, 3, e00411-18. [Google Scholar] [CrossRef] [Green Version]
  22. Lutz, R. Independent and tight regulation of transcriptional units in Escherichia coli via the LacR/O, the TetR/O and AraC/I1-I2 regulatory elements. Nucleic Acids Res. 1997, 25, 1203–1210. [Google Scholar] [CrossRef] [PubMed]
  23. Datsenko, K.A.; Wanner, B.L. One-step inactivation of chromosomal genes in Escherichia coli K-12 using PCR products. Proc. Natl. Acad. Sci. USA 2000, 97, 6640–6645. [Google Scholar] [CrossRef] [Green Version]
  24. Datta, S.; Costantino, N.; Court, D.L. A set of recombineering plasmids for gram-negative bacteria. Gene 2006, 379, 109–115. [Google Scholar] [CrossRef] [PubMed]
  25. Aghapour, Z.; Gholizadeh, P.; Ganbarov, K.; Bialvaei, A.Z.; Mahmood, S.S.; Tanomand, A.; Yousefi, M.; Asgharzadeh, M.; Yousefi, B.; Kafil, H.S. Molecular mechanisms related to colistin resistance in Enterobacteriaceae. Infect. Drug Resist. 2019, 12, 965–975. [Google Scholar] [CrossRef] [PubMed] [Green Version]
  26. Zhou, W.; Wang, Y.; Lin, J. Functional Cloning and Characterization of Antibiotic Resistance Genes from the Chicken Gut Microbiome. Appl. Environ. Microbiol. 2012, 78, 3028–3032. [Google Scholar] [CrossRef] [PubMed] [Green Version]
  27. Lin, J.; Michel, L.O.; Zhang, Q. CmeABC Functions as a Multidrug Efflux System in Campylobacter jejuni. Antimicrob. Agents Chemother. 2002, 46, 2124–2131. [Google Scholar] [CrossRef] [Green Version]
  28. Zeng, X.; Brown, S.; Gillespie, B.; Lin, J. A single nucleotide in the promoter region modulates the expression of the -lactamase OXA-61 in Campylobacter jejuni. J. Antimicrob. Chemother. 2014, 69, 1215–1223. [Google Scholar] [CrossRef] [Green Version]
  29. Ye, S.; Dhillon, S.; Ke, X.; Collins, A.R.; Day, I.N.M. An efficient procedure for genotyping single nucleotide polymorphisms. Nucleic Acids Res. 2001, 29, e88. [Google Scholar] [CrossRef] [PubMed] [Green Version]
  30. Dai, L.; Wu, Z.; Xu, C.; Sahin, O.; Yaeger, M.; Plummer, P.J.; Zhang, Q. The Rho-Independent Transcription Terminator for theporAGene Enhances Expression of the Major Outer Membrane Protein andCampylobacter jejuniVirulence in Abortion Induction. Infect. Immun. 2019, 87. [Google Scholar] [CrossRef] [Green Version]
  31. Pfaffl, M.W. A new mathematical model for relative quantification in real-time RT-PCR. Nucleic Acids Res. 2001, 29, e45. [Google Scholar] [CrossRef]
  32. Bligh, E.G.; Dyer, W.J. A rapid method of total lipid extraction and purification. Can. J. Biochem. Physiol. 1959, 37, 911–917. [Google Scholar] [CrossRef] [Green Version]
  33. Henderson, J.C.; O’Brien, J.P.; Brodbelt, J.S.; Trent, M.S. Isolation and Chemical Characterization of Lipid A from Gram-negative Bacteria. J. Vis. Exp. 2013, 10, e50623. [Google Scholar] [CrossRef] [PubMed]
  34. Joyce, L.R.; Guan, Z.; Palmer, K.L. Phosphatidylcholine Biosynthesis in Mitis Group Streptococci via Host Metabolite Scavenging. J. Bacteriol. 2019, 201. [Google Scholar] [CrossRef] [PubMed] [Green Version]
  35. Tan, B.K.; Bogdanov, M.; Zhao, J.; Dowhan, W.; Raetz, C.R.H.; Guan, Z. Discovery of a cardiolipin synthase utilizing phosphatidylethanolamine and phosphatidylglycerol as substrates. Proc. Natl. Acad. Sci. USA 2012, 109, 16504–16509. [Google Scholar] [CrossRef] [Green Version]
  36. Pinske, C.; Bönn, M.; Krüger, S.; Lindenstrauß, U.; Sawers, R.G. Metabolic Deficiences Revealed in the Biotechnologically Important Model Bacterium Escherichia coli BL21(DE3). PLoS ONE 2011, 6, e22830. [Google Scholar] [CrossRef] [PubMed] [Green Version]
  37. Cannatelli, A.; D’Andrea, M.M.; Giani, T.; Di Pilato, V.; Arena, F.; Ambretti, S.; Gaibani, P.; Rossolini, G.M. In VivoEmergence of Colistin Resistance in Klebsiella pneumoniae Producing KPC-Type Carbapenemases Mediated by Insertional Inactivation of the PhoQ/PhoPmgrBRegulator. Antimicrob. Agents Chemother. 2013, 57, 5521–5526. [Google Scholar] [CrossRef] [PubMed] [Green Version]
  38. Loh, J.T.; Lin, A.S.; Beckett, A.C.; McClain, M.S.; Cover, T.L. Role of a Stem-Loop Structure in Helicobacter pylori cagA Transcript Stability. Infect. Immun. 2019, 87. [Google Scholar] [CrossRef] [PubMed] [Green Version]
  39. Gruber, A.R.; Lorenz, R.; Bernhart, S.H.F.; Neuböck, R.; Hofacker, I.L. The Vienna RNA Websuite. Nucleic Acids Res. 2008, 36, W70–W74. [Google Scholar] [CrossRef] [PubMed] [Green Version]
  40. Chen, H.D.; Jewett, M.W.; Groisman, E.A. Ancestral Genes Can Control the Ability of Horizontally Acquired Loci to Confer New Traits. PLoS Genet. 2011, 7, e1002184. [Google Scholar] [CrossRef] [Green Version]
  41. Rubin, E.J.; Herrera, C.M.; Crofts, A.A.; Trent, M.S. PmrD Is Required for Modifications to Escherichia coli Endotoxin That Promote Antimicrobial Resistance. Antimicrob. Agents Chemother. 2015, 59, 2051–2061. [Google Scholar] [CrossRef] [PubMed] [Green Version]
  42. De Los Mozos, I.R.; Vergara-Irigaray, M.; Segura, V.; Villanueva, M.; Bitarte, N.; Saramago, M.; Domingues, S.; Arraiano, C.M.; Fechter, P.; Romby, P.; et al. Base Pairing Interaction between 5′- and 3′-UTRs Controls icaR mRNA Translation in Staphylococcus aureus. PLoS Genet. 2013, 9, e1004001. [Google Scholar] [CrossRef] [PubMed]
  43. Miyakoshi, M.; Chao, Y.; Vogel, J. Regulatory small RNAs from the 3′ regions of bacterial mRNAs. Curr. Opin. Microbiol. 2015, 24, 132–139. [Google Scholar] [CrossRef] [PubMed]
  44. Holmqvist, E.; Li, L.; Bischler, T.; Barquist, L.; Vogel, J. Global Maps of ProQ Binding In Vivo Reveal Target Recognition via RNA Structure and Stability Control at mRNA 3′ Ends. Mol. Cell 2018, 70, 971–982. [Google Scholar] [CrossRef] [Green Version]
  45. Kato, A.; Chen, H.D.; Latifi, T.; Groisman, E.A. Reciprocal Control between a Bacterium’s Regulatory System and the Modification Status of Its Lipopolysaccharide. Mol. Cell 2012, 47, 897–908. [Google Scholar] [CrossRef] [PubMed] [Green Version]
  46. Winfield, M.D.; Groisman, E.A. Phenotypic differences between Salmonella and Escherichia coli resulting from the disparate regulation of homologous genes. Proc. Natl. Acad. Sci. USA 2004, 101, 17162–17167. [Google Scholar] [CrossRef] [PubMed] [Green Version]
Figure 1. Diagram of subcloning strategy and the predicted stem-loop structure of 3′-downstream region of pmrB. (A) Stepwise subcloning and corresponding plasmid constructs (plasmid name in blue). Vertical dash lines cover the cloned major regions selected for subcloning. −150 bp, 150 bp upstream of pmrB ORF. The length of region downstream of pmrB ORF in different constructs was indicated by the number with “+” prefix. (B) Stem-loop structure prediction of 3′-downstream region of pmrB. The starting (+1) and ending (+176) of the 3′-downstream region of pmrB are indicated with black arrows. The transition sites between some stems and loops are indicated with arrows followed by the distance from the pmrB stop codon (in red); these sites were also selected for creating subcloning plasmids (detailed in A panel). The blue dash box indicates predicted Rho-independent terminator.
Microorganisms 09 00655 g001
Figure 2. The effects of pmrB downstream region on the transcription and stability of pmrB. (A) The effect of pmrB downstream region on pmrB mRNA levels. The cloned pmrB of BL21 origin in JL1381, JL1507 and JL1509 includes 0, 86 and 126 bp downstream regions, respectively (indicated below strain name). Quantitative RT-PCR was performed to assess transcription level of pmrB. The JL1088 strain that carries parent plasmid pZE21 was used as a control. The pmrB mRNA levels in JL1381, JL1507 and JL1509 were compared with that in JL1088 (expressed as −ΔΔCt). (B) Decay curves of pmrB mRNA in JL1507 (TOP10/pUS150-PmrB-DS86) and JL1509 (TOP10/pUS150-PmrB-DS126) after transcriptional arrest by rifampicin. The mRNA level was measured by quantitative RT-PCR (detailed in Materials and Methods). The Y axis represents the ratio (percentage) of quantities of pmrB mRNA at each time point relative to that at the 0 min time point. Three independent experiments were performed. Data points are the mean value from measurements of triplicate cultures in one representative experiment, and fit with one-phase decay curves to calculate the mRNA half-life.
Microorganisms 09 00655 g002
Figure 3. MS analysis of lipid A in the E. coli TOP10 strains bearing pmrBBL21 with different lengths of downstream regions. The doubly charged [M-2H]2− ions of lipid A species are shown. (A) Unmodified lipid A in JL1088, the control strain containing pZE21 vector only; (B) Unmodified lipid A in JL1507, which contains plasmid pUS150-PmrB-DS86; (C) Extensive modifications of lipid A by Ara4N and pEtN in JL1508, which contains plasmid pUS150-PmrB-DS103; (D) Extensive modifications of lipid A by Ara4N and pEtN in JL1509, which contains plasmid pUS150-PmrB-DS126. The pmrB carried in three recombinant plasmids are diagramed in Figure 1A. (E) Representative chemical structures and the corresponding cartoons of hexa-acylated lipid A and its Ara4N and pEtN modifications.
Microorganisms 09 00655 g003
Table 1. Key bacterial plasmids and strains used in this study.
Plasmids or StrainsDescriptionSource or Reference
Plasmids
pZE21Cloning and expression vector; kanamycin resistant (Kanr) [22]
pUC19Clone vector, ampicillin resistant (Ampr)Invitrogen
pKD13Template plasmid of kanamycin resistant cassette for gene disruption. [23]
pSIM6Ampicillin resistant. Heat inducible red recombinase expression plasmid, with a temperature-sensitive origin of replication[24]
pZE21-EptApZE21 derivative containing eptA ORFThis study
pZE21-EptBpZE21 derivative containing eptB ORFThis study
pZE21-CptApZE21 derivative containing cptA ORFThis study
pZE21-OpgEApZE21 derivative containing opgE ORFThis study
pZE21-PmrABpZE21 derivative containing pmrA and pmrB ORFsThis study
pZE21-PmrBpZE21 derivative containing pmrB ORFThis study
pZE21-PmrDpZE21 derivative containing pmrD ORFThis study
pPmrA-PmrB-ProPpZE21 derivative containing PmrA(partial)-PmrB-ProP(partial)This study
pUS150-PmrB-DS34pZE21 derivative containing pmrB region from upstream 150 bp to downstream 34 bpThis study
pUS150-PmrB-DS86pZE21 derivative containing pmrB region from upstream 150 bp to downstream 86 bpThis study
pUS150-PmrB-DS103pZE21 derivative containing pmrB region from upstream 150 bp to downstream 103 bpThis study
pUS150-PmrB-DS126pZE21 derivative containing pmrB region from upstream 150 bp to downstream 126 bpThis study
pUS150-PmrB-DS134pZE21 derivative containing pmrB region from upstream 150 bp to downstream 134 bpThis study
pUS150-PmrB-DS176pZE21 derivative containing pmrB region from upstream 150 bp to downstream 176 bpThis study
pUS150-PmrBMG1655-DS176pZE21 derivative containing pmrBMG1655 region from upstream 150 bp to downstream 176 bpThis study
Strains
BL21(DE3)F ompT hsdSB (rB, mB) gal dcm (DE3)Stratagene/Novagen
TOP10F mcrA Δ(mrr-hsdRMS-mcrBC) ϕ80lacZΔM15 ΔlacX74 recA1 araD139 Δ(ara leu)7697 galU galK rpsL (Strr) endA1 nupGInvitrogen
JL1374TOP10/pZE21-EptAThis study
JL1375TOP10/pZE21-EptBThis study
JL1376TOP10/pZE21-CptAThis study
JL1377TOP10/pZE21-OpgEThis study
JL1371TOP10/pZE21-PmrABThis study
JL1373TOP10/pZE21-PmrDThis study
JL1365Transformant #1 from functional cloning, ColRThis study
JL1366Transformant #2 from functional cloning, ColRThis study
JL1367Transformant #3 from functional cloning, ColRThis study
JL1368Transformant #4 from functional cloning, ColRThis study
JL1369Transformant #5 from functional cloning, ColRThis study
JL1397TOP10/pPmrA-PmrB-ProPThis study
JL1088TOP10/pZE21This study
JL1381TOP10/pPmrB, containing pmrB ORF onlyThis study
JL1431TOP10/pUS150-PmrB-DS176This study
JL1432TOP10/pUS150-PmrBMG1655-DS176This study
JL1611TOP10/pUS150-PmrB-DS34This study
JL1507TOP10/pUS150-PmrB-DS86This study
JL1508TOP10/pUS150-PmrB-DS103This study
JL1509TOP10/pUS150-PmrB-DS126This study
JL1444TOP10/pUS150-PmrB-DS134This study
JL1435BL21(DE3), phoQ::kanThis study
JL1436BL21(DE3), pmrB::kanThis study
Table 2. Major primers used in this study.
PrimerDNA Sequence (5′-3′) aProduct Size (bp) bTarget Gene/Region and Function
EptA_FATGTTGAAGCGCCTACTAAAAAGAC1644eptA ORF
EptA_RCGCGGATCCTCATTCACTCACTCTCCT (BamHI)
EptB_FATGAGATACATCAAATCGATTACAC1692eptB ORF
EptB_RCGCGGATCCTTAGTTAGCCGCTGCCTC (BamHI)
CptA_FATGCATTCCACAGAAGTCCAGGCT1734cptA ORF
CptA_RCGCGGATCCTTACTGATTACCCACCTG (BamHI)
OpgE_FATGAATTTAACCCTCAAAGAATCGC1584opgE ORF
OpgE_RCGCGGATCCTTAAGGTTTCGGGTCG (BamHI)
Prbas_FAAATTCTGATTGTTGAAGACGATAC1766pmrA-pmrB ORF
PrEAbas_RCGCGGATCCTTATATCTGGTTTGCCAC (BamHI)
PmrB-F1ATG CAT TTT CTG CGC CGA CCA ATA1092pmrB ORF
PmrB-RATATGGATCCTTATATCTGGTTTGCCACGT (BamHI)
p5Up-KpnI-F3ATATGGTACCGACGCTGAATATGGGTCGCC (KpnI)2897pmrA(partial)-pmrB-proP(partial)
p5Up-SalI-R3ATATGTCGACAAGTTTTTTTCCCGGGGGCTGA (SalI)
US150-PmrB-SalI-F1ATATGTCGACGACATCTATAACTGGGACAA (SalI)
DS34-PmrB-BamHI-R1ATATGGATCCCCGTGTTCAGCGTGCTGGTG (BamHI)1271pmrB ORF, with 150 bp upstream and 34 bp downstream
DS86-PmrB-BamHI-R1ATATGGATCCCAGGTTAACGGAGGAGAGTG (BamHI)1328pmrB ORF, with 150 bp upstream and 86 bp downstream
DS103-PmrB-BamHI-R1ATATGGATCCACGCGCATACTCTCCTCCAG (BamHI)1345pmrB ORF, with 150 bp upstream and 103 bp downstream
DS126-PmrB-BamHI-R1ATATGGATCCCTTAAGGTTCACTTAATCTC (BamHI)1368pmrB ORF, with 150 bp upstream and 126 bp downstream
DS134-PmrB-BamHI-R1ATATGGATCCATTGAACTCTTAAGGTTCACT (BamHI)1376pmrB ORF, with 150 bp upstream and 134 bp downstream
DS176-PmrB-BamHI-R1ATATGGATCCGCTGAAACGGATGGCCTGAT (BamHI)1418pmrB ORF, with 150 bp upstream and 176 bp downstream
pZE_FGAATTCATTAAAGAGGAGAAAGGTN/AForward sequencing primers for pZE21 derivatives
pZE_RTTTCGTTTTATTTGATGCCTCTAGN/AReverse sequencing primers for pZE21 derivatives
PmrB(BL21DE3)_pKD13_F3GCTTTGGCTATATGCTGGTCGCGAATGAGGAAAACTAATTGAATCTGATGTGTAGGCTGGAGCTGCTTCG1403Site-directed mutation of pmrB
PmrB(BL21DE3)_pKD13_R3TTCAGCGTGCTGGTGGTCAGCAGCTTTCTTTATATCTGGTTTGCCACGTAATTCCGGGGATCCGTCGACC
PmrB_FAATGAACCCTCGACCAACAC1376Detect site-directed mutation of pmrB with k1
PmrB_RCGCTGTCTTATCAGGCCAAT
PhoQ(BL21DE3)_pKD13_F3GTGATTACCACCGTTCGCGGCCAGGGCTATCTGTTCGAATTGCGCTGATGTGTAGGCTGGAGCTGCTTCG1403Site-directed mutation of phoQ
PhoQ(BL21DE3)_pKD13_R3TTAACGTAATGCGTGAAGTATGGACATATTTATTCATCTTTCGGCGTAGAATTCCGGGGATCCGTCGACC
PhoQ_FTAATGGCAAAGTGGTGAGCA1772Detect site-directed mutation of phoQ with K1
PhoQ_RTTCTGCCAGTGACGTTCAAG
K1CAGTCATAGCCGAATAGCCT Common primer for detecting site-directed mutation
RT-PmrB-BL21SNP-F3CATTGCCATTCACAGCGCCACCCGCA180RT-PCR detection of pmrBBL21(DE3)
RT-PmrB-BL21SNP-R3TGCGTTTTCGCCAGCAGTTCCAGATGCA
16S-FAAGTTAATACCTTTGCTCATTGAC11816S rRNA internal control for RT-PCR
16S-RGCTTTACGCCCAGTAATTCC
a Restriction sites are underlined in the primer sequence, and the names are identified in parentheses. b The amplicon size using wild type genomic DNA of BL21(DE3) or pKD13 as templates.
Table 3. Functional cloning of colistin resistance determinants from E. coli BL21(DE3).
StrainInsert Size (bp)Genome Location in BL21Annotated Genes and Organization a
JL136510,660210,471–208,308dnaE
3,818,298–3,821,491viaA-ravA-kup
1,144,385–1,147,209rne-yceQ
2,263,105–2,265,581arnF-pmrD-menE-menC
JL136639264,242,936–4,239,011proP-pmrB-pmrA-EptA-adiC
JL136769894,239,038–4,243,091proP-pmrB-pmrA-EptA-adiC
1,256,348–1,259,815kdsA-ldrA-ldrB-ldrC-chaA
JL136838132,263,769–2,261,742arnT-arnE-arnF-pmrD
2,759,470–2,757,690syd-queF-ygdH
JL136952691,879,745–1,877,377purT-eda-edd
4,237,732–4,240,628proP-pmrB-pmrA
a The highlighted genes (red text) are those known to involve polymyxin resistance. The genes encoding two-component regulatory system PmrAB (red bold face) are the focus of this manuscript.
Table 4. Colistin MIC and lipid A modification of the E. coli TOP10 constructs carrying pmrBBL21 with different lengths of 3′-downstream region.
StrainColistin MIC (µg/mL)Lipid A Modification
pEtNAra4N
TOP10/pZE210.5- a-
TOP10/pPmrB0.5ND bND
TOP10/pUS150-PmrB-DS340.5NDND
TOP10/pUS150-PmrB-DS860.5--
TOP10/pUS150-PmrB-DS1034++
TOP10/pUS150-PmrB-DS12616++
TOP10/pUS150-PmrB-DS13416NDND
TOP10/pUS150-PmrB-DS17616NDND
TOP10/pUS150-PmrBMG1655-DS1760.5NDND
BL21, wild type16++
JL1435 (BL21, phoQ::kan)16NDND
JL1436 (BL21, pmrB::kan)0.5NDND
a -/+: there isn’t/is a lipid A modification in the corresponding strain. b ND: not determined.
Publisher’s Note: MDPI stays neutral with regard to jurisdictional claims in published maps and institutional affiliations.

