
Evaluation of the Estimation Capability of Response Surface Methodology and Artificial Neural Network for the Optimization of Bacteriocin-Like Inhibitory Substances Production by Lactococcus lactis Gh1


 ,
,  and
and
Abstract
1. Introduction
2. Materials and Methods
2.1. Microorganisms and Fermentation
2.2. One-Factor-at-a-Time (OFAT)
2.3. Response Surface Methodology Modelling (RSM)
2.4. Artificial Neural Network Modelling
2.5. Verification of Predicted Data
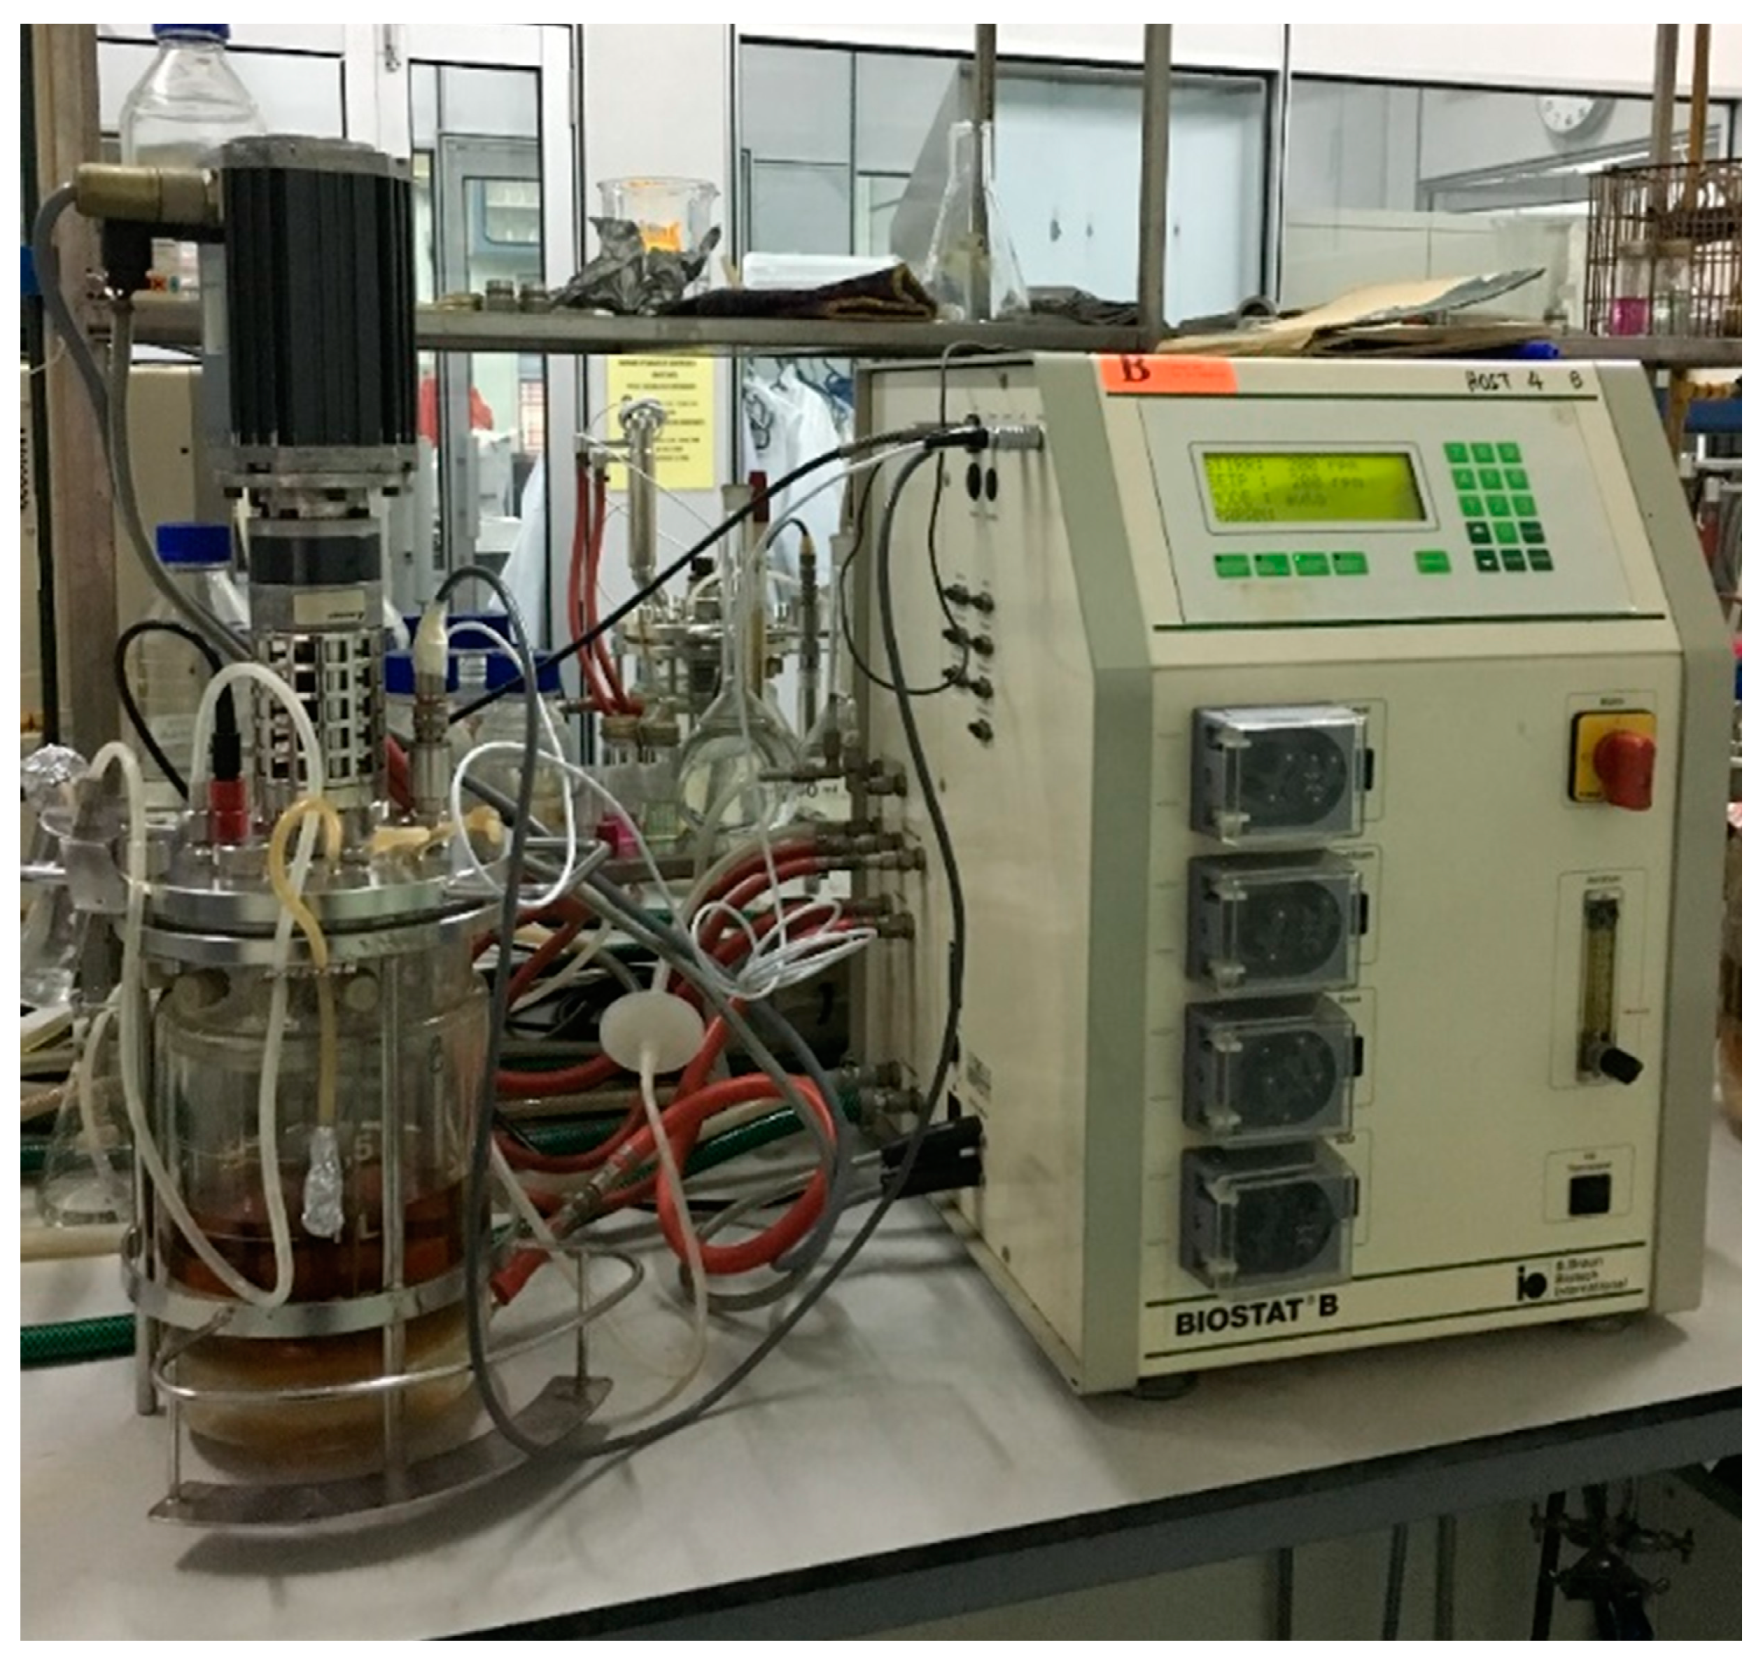
2.6. Bioreactor Set up and Fermentation
2.7. Models
2.8. Analytical Procedures
3. Results
3.1. Effect of Modified Media Components on BLIS Production
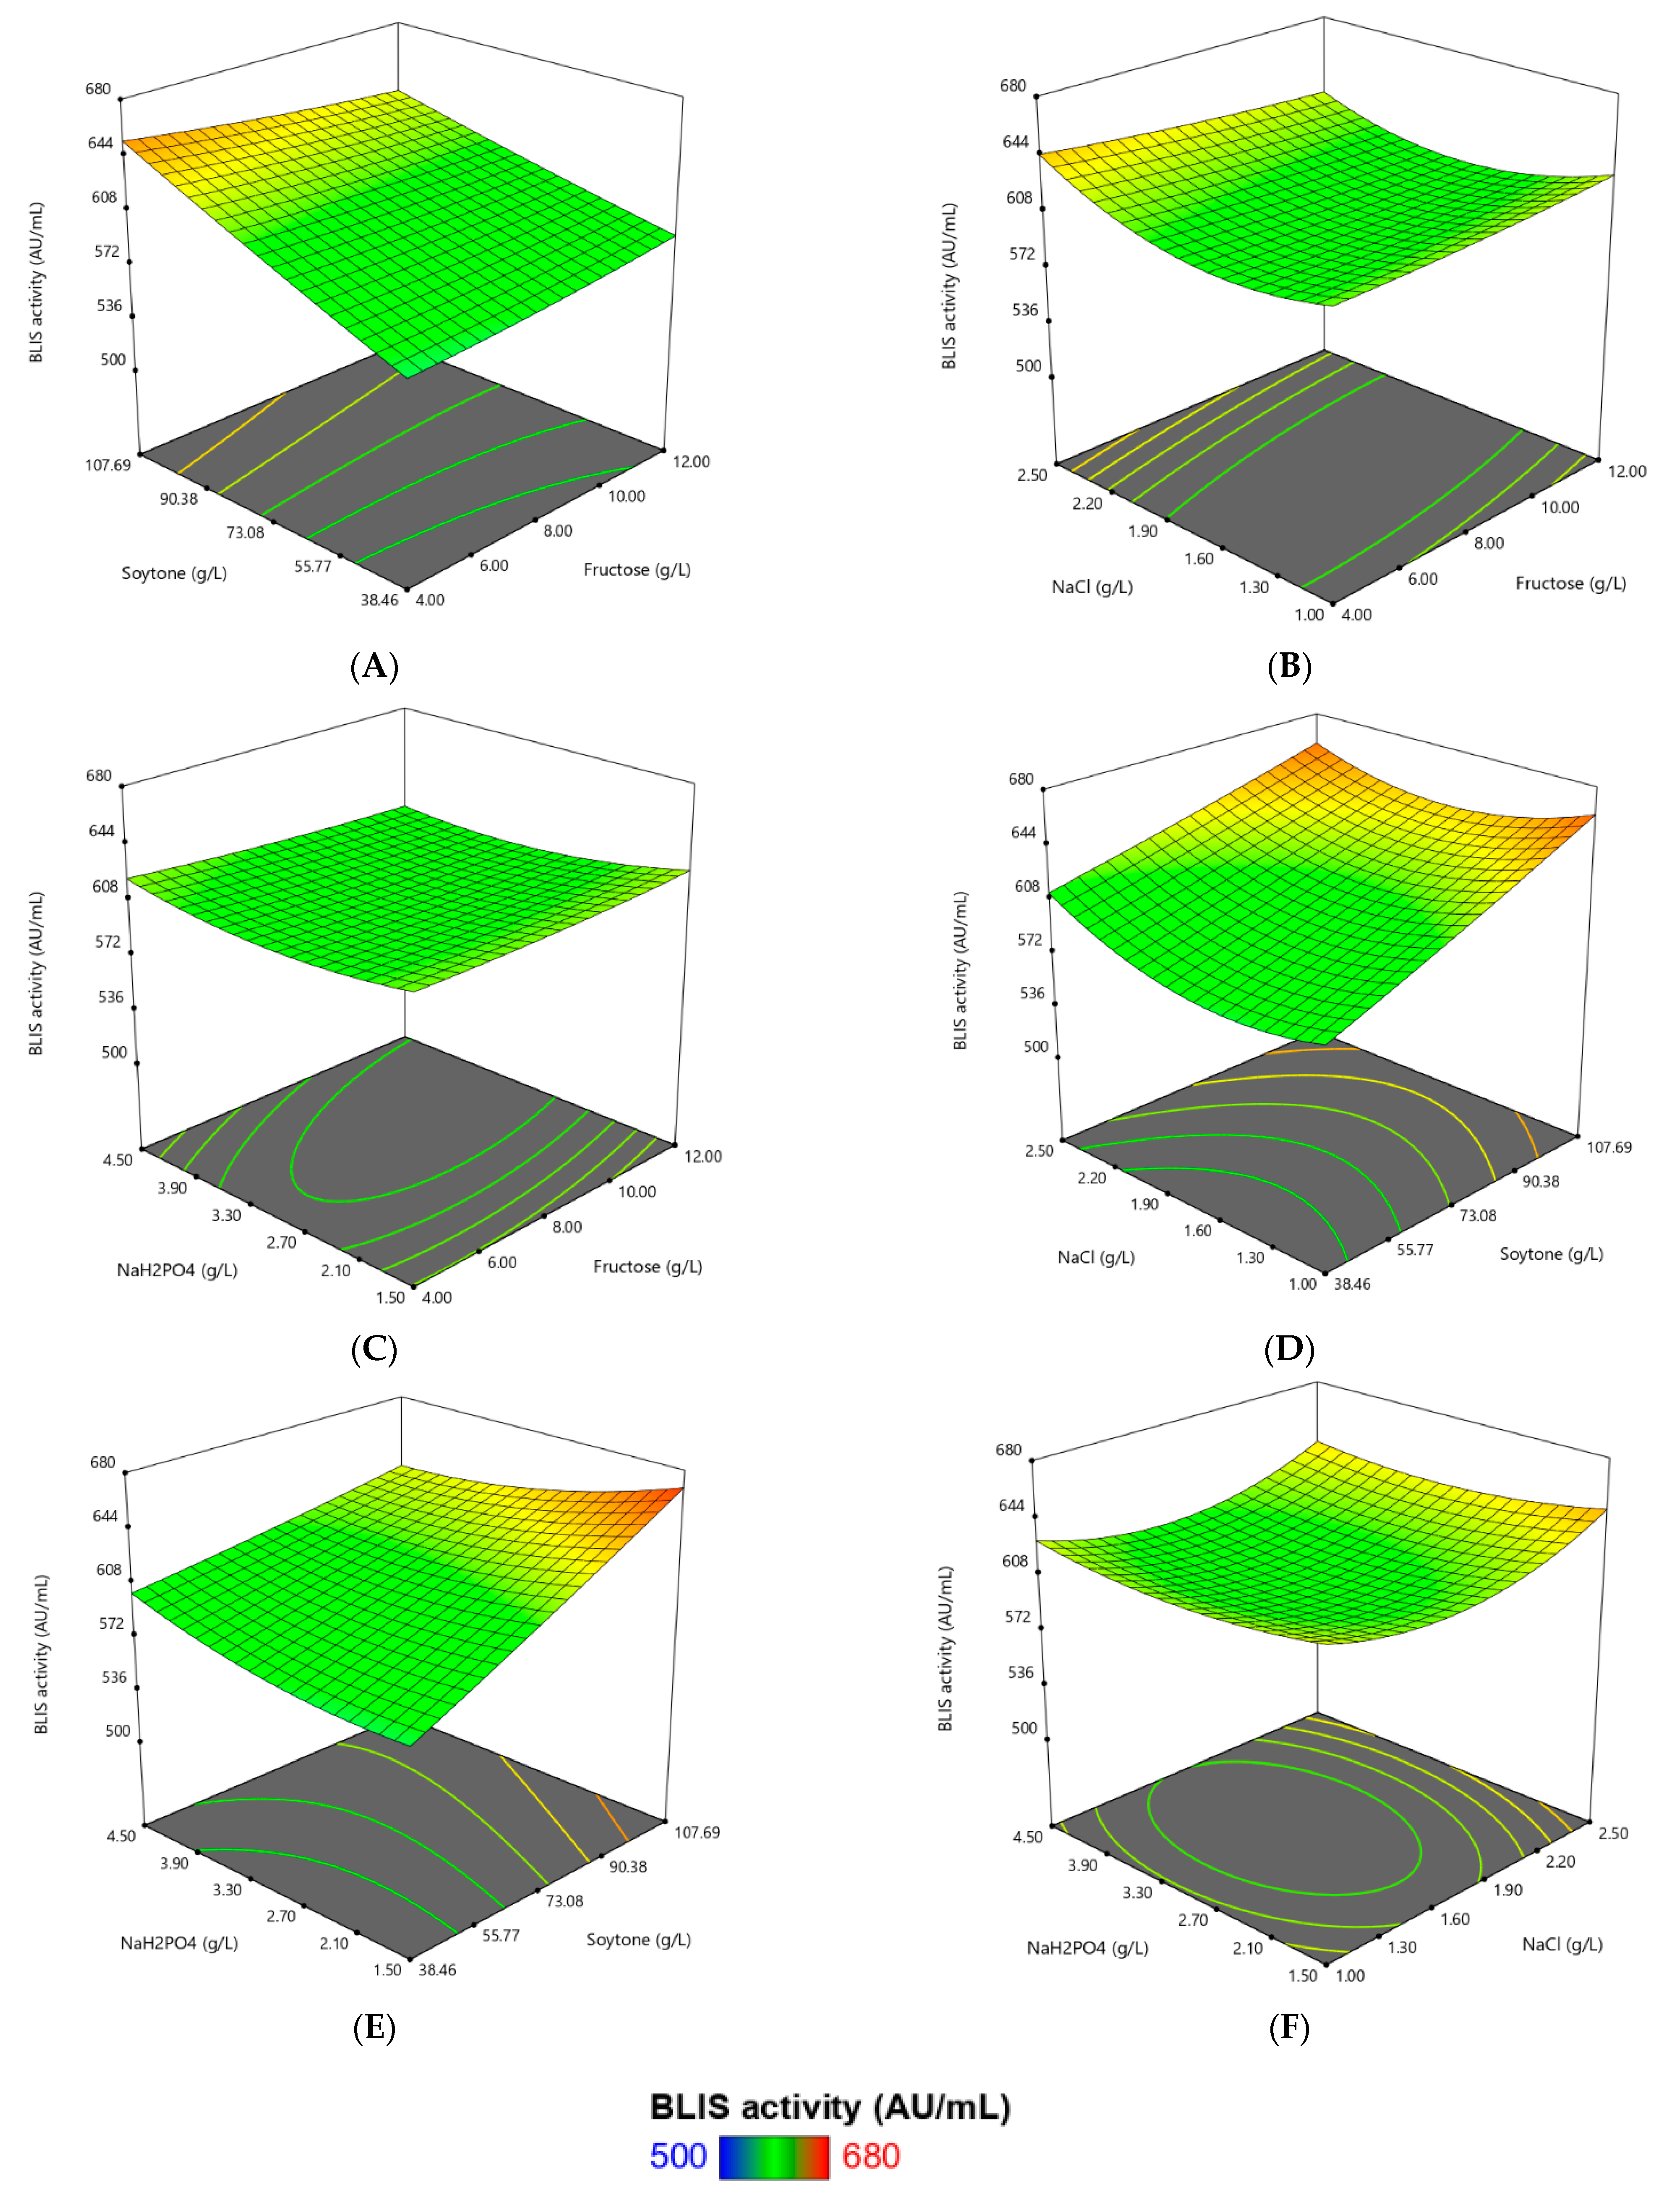
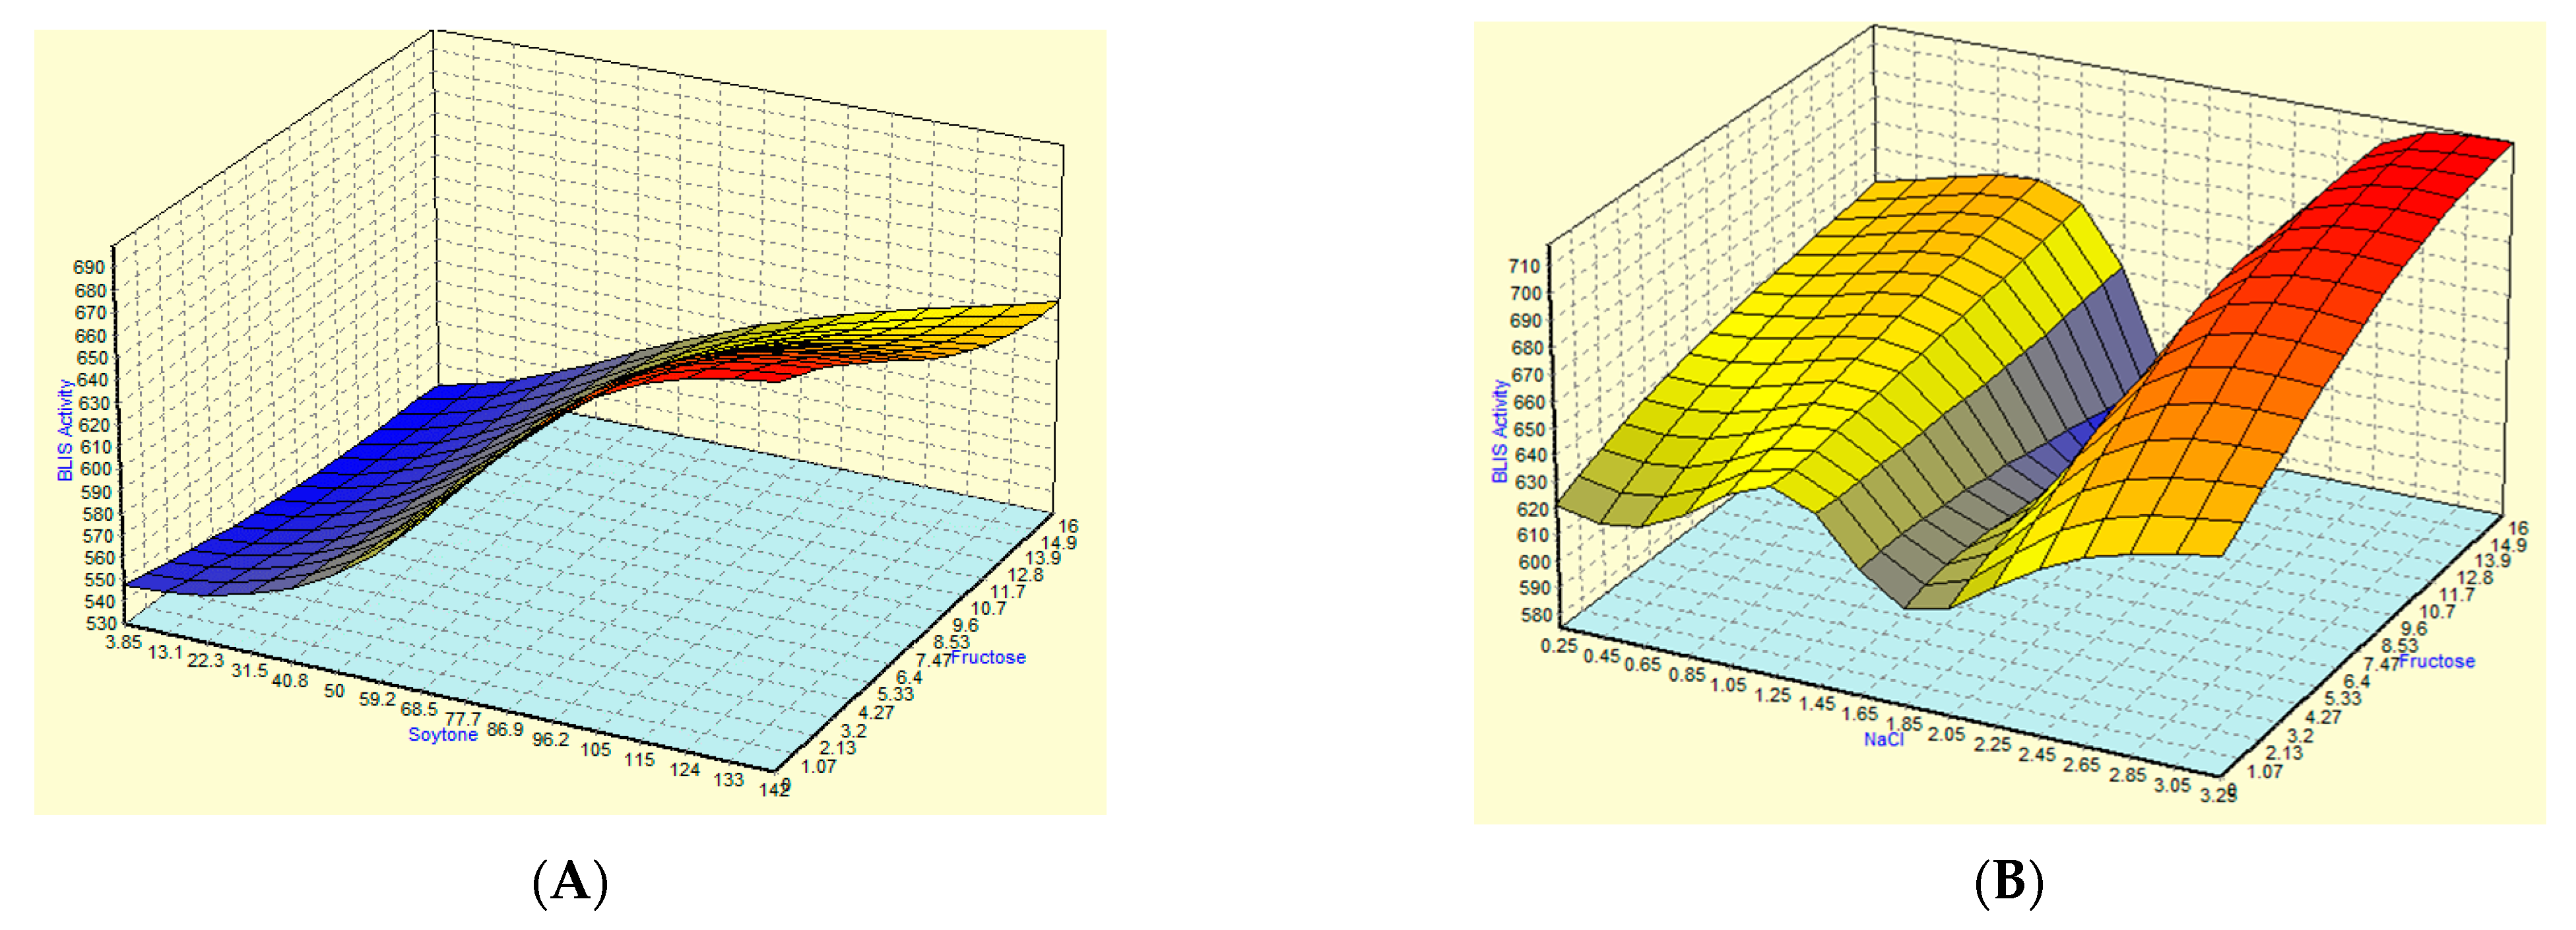
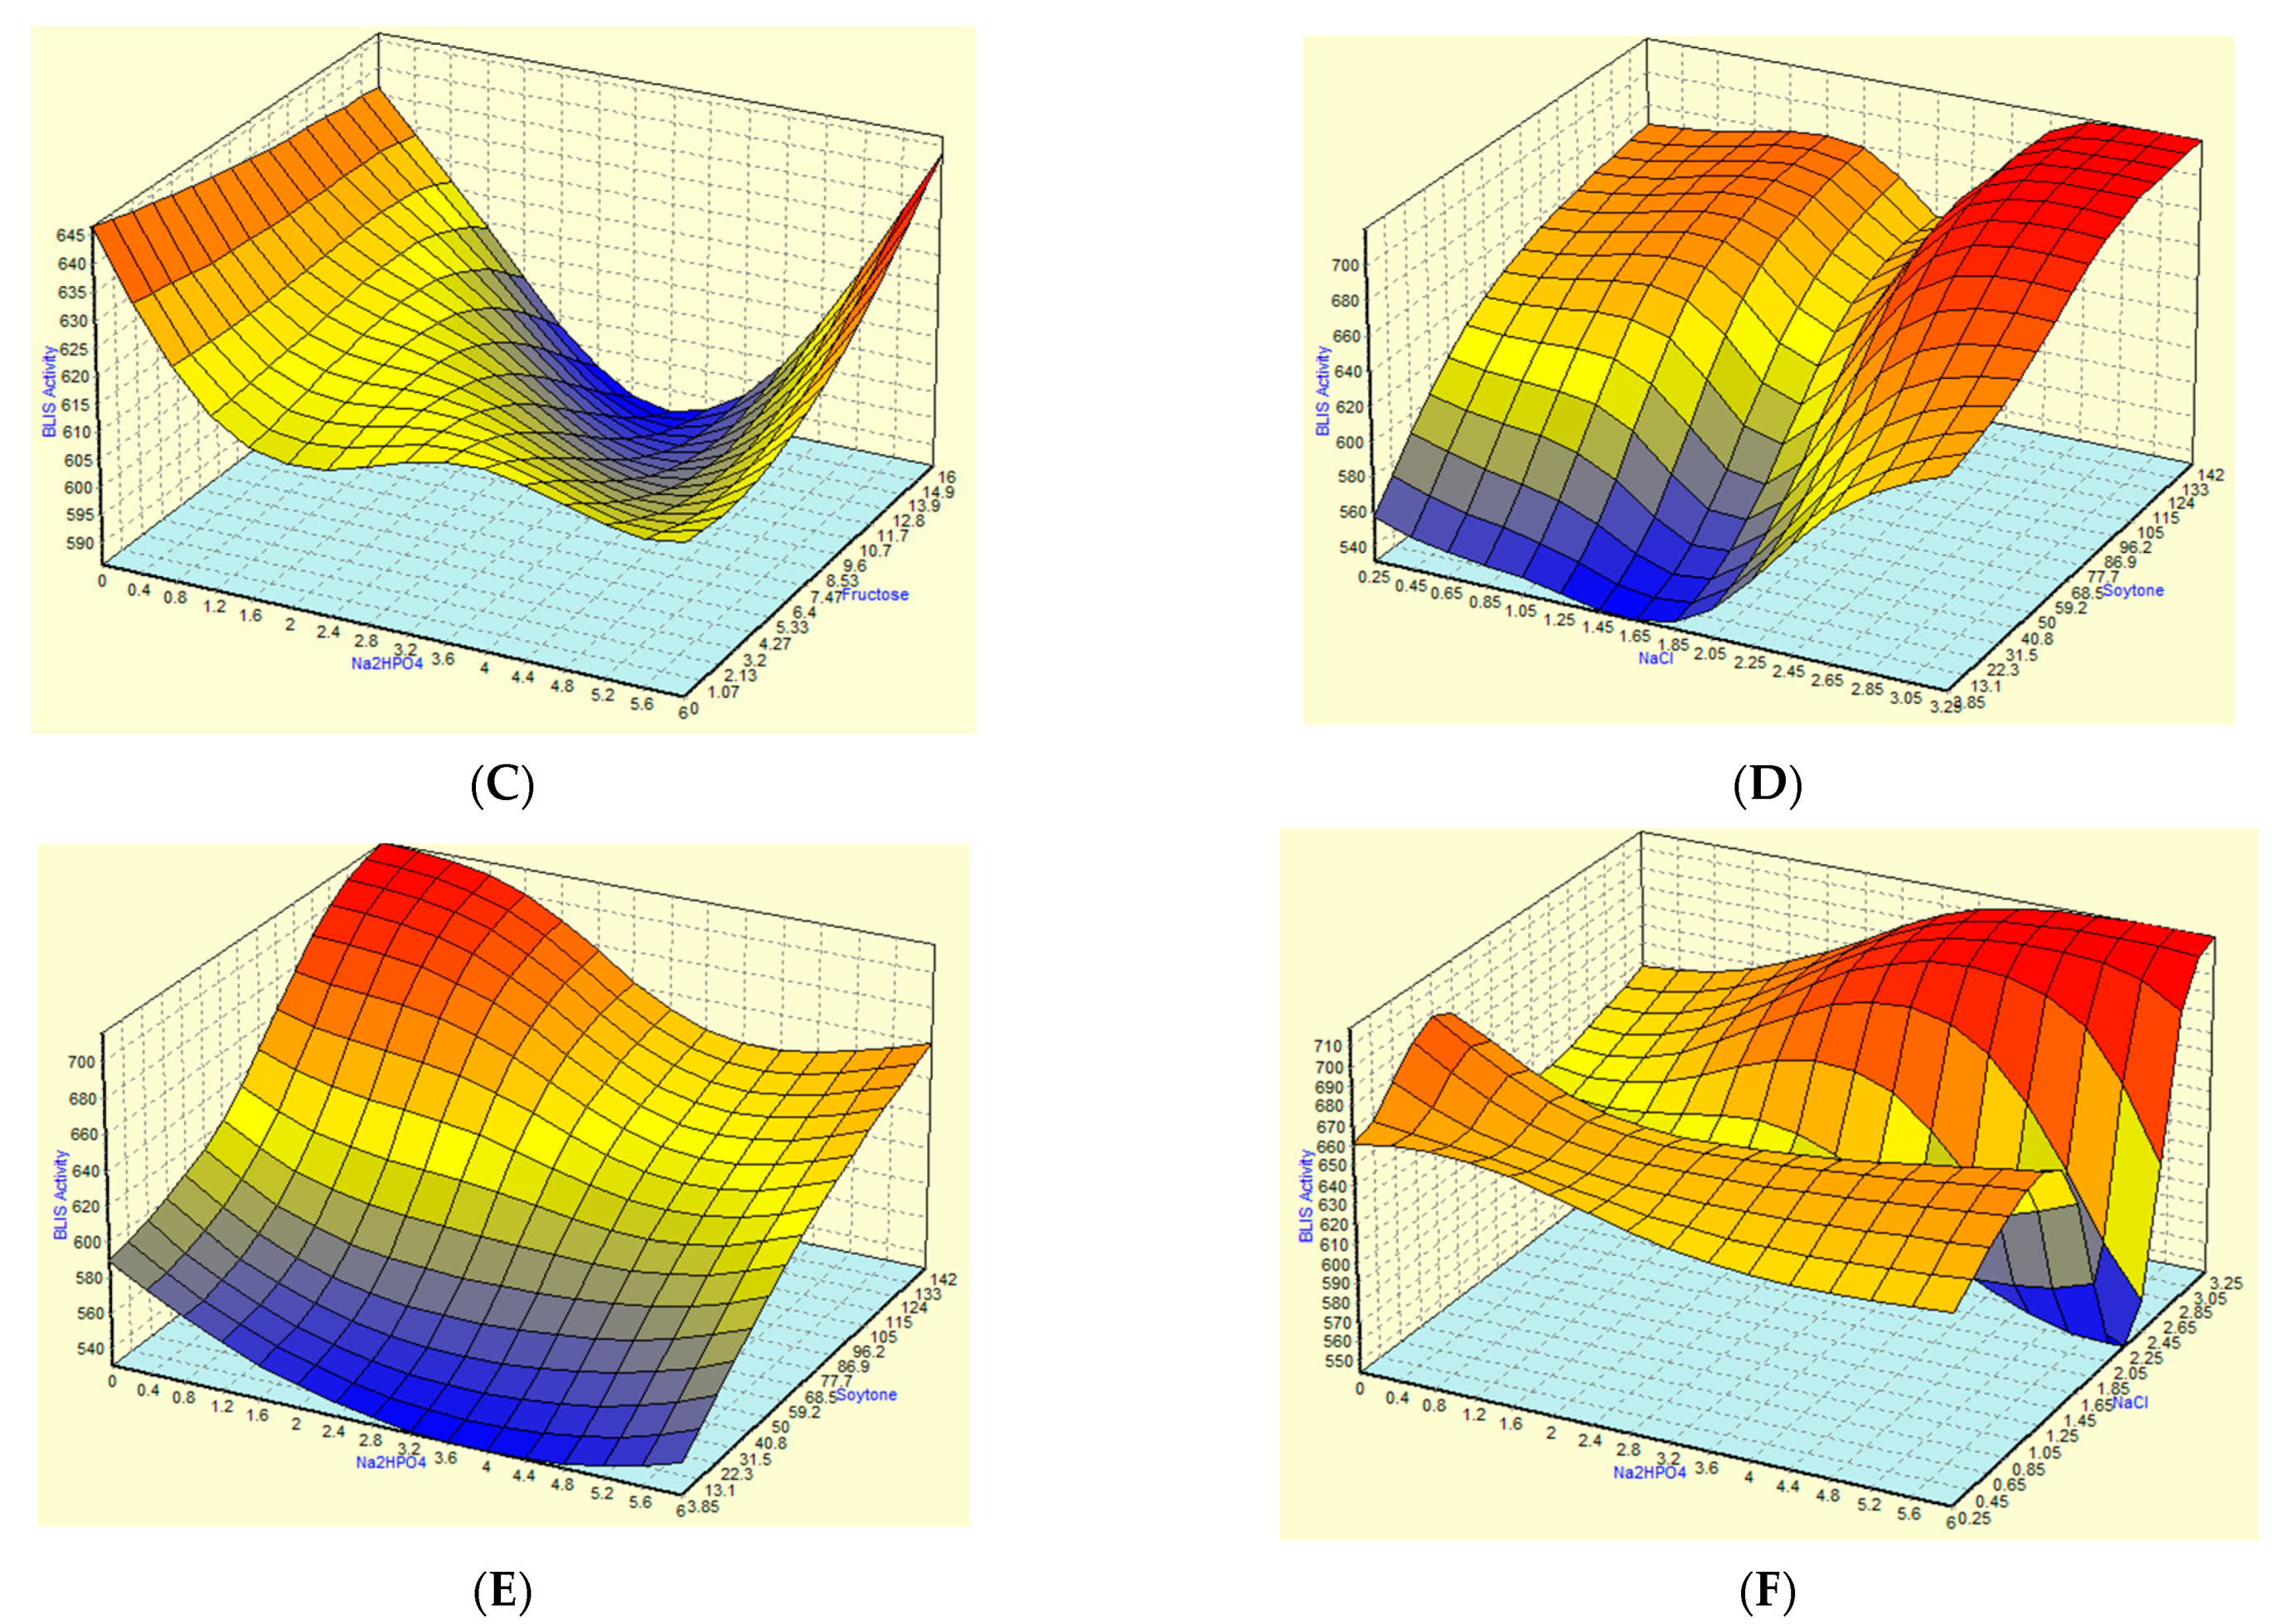
3.2. Optimization of Fermentation Parameters Using RSM
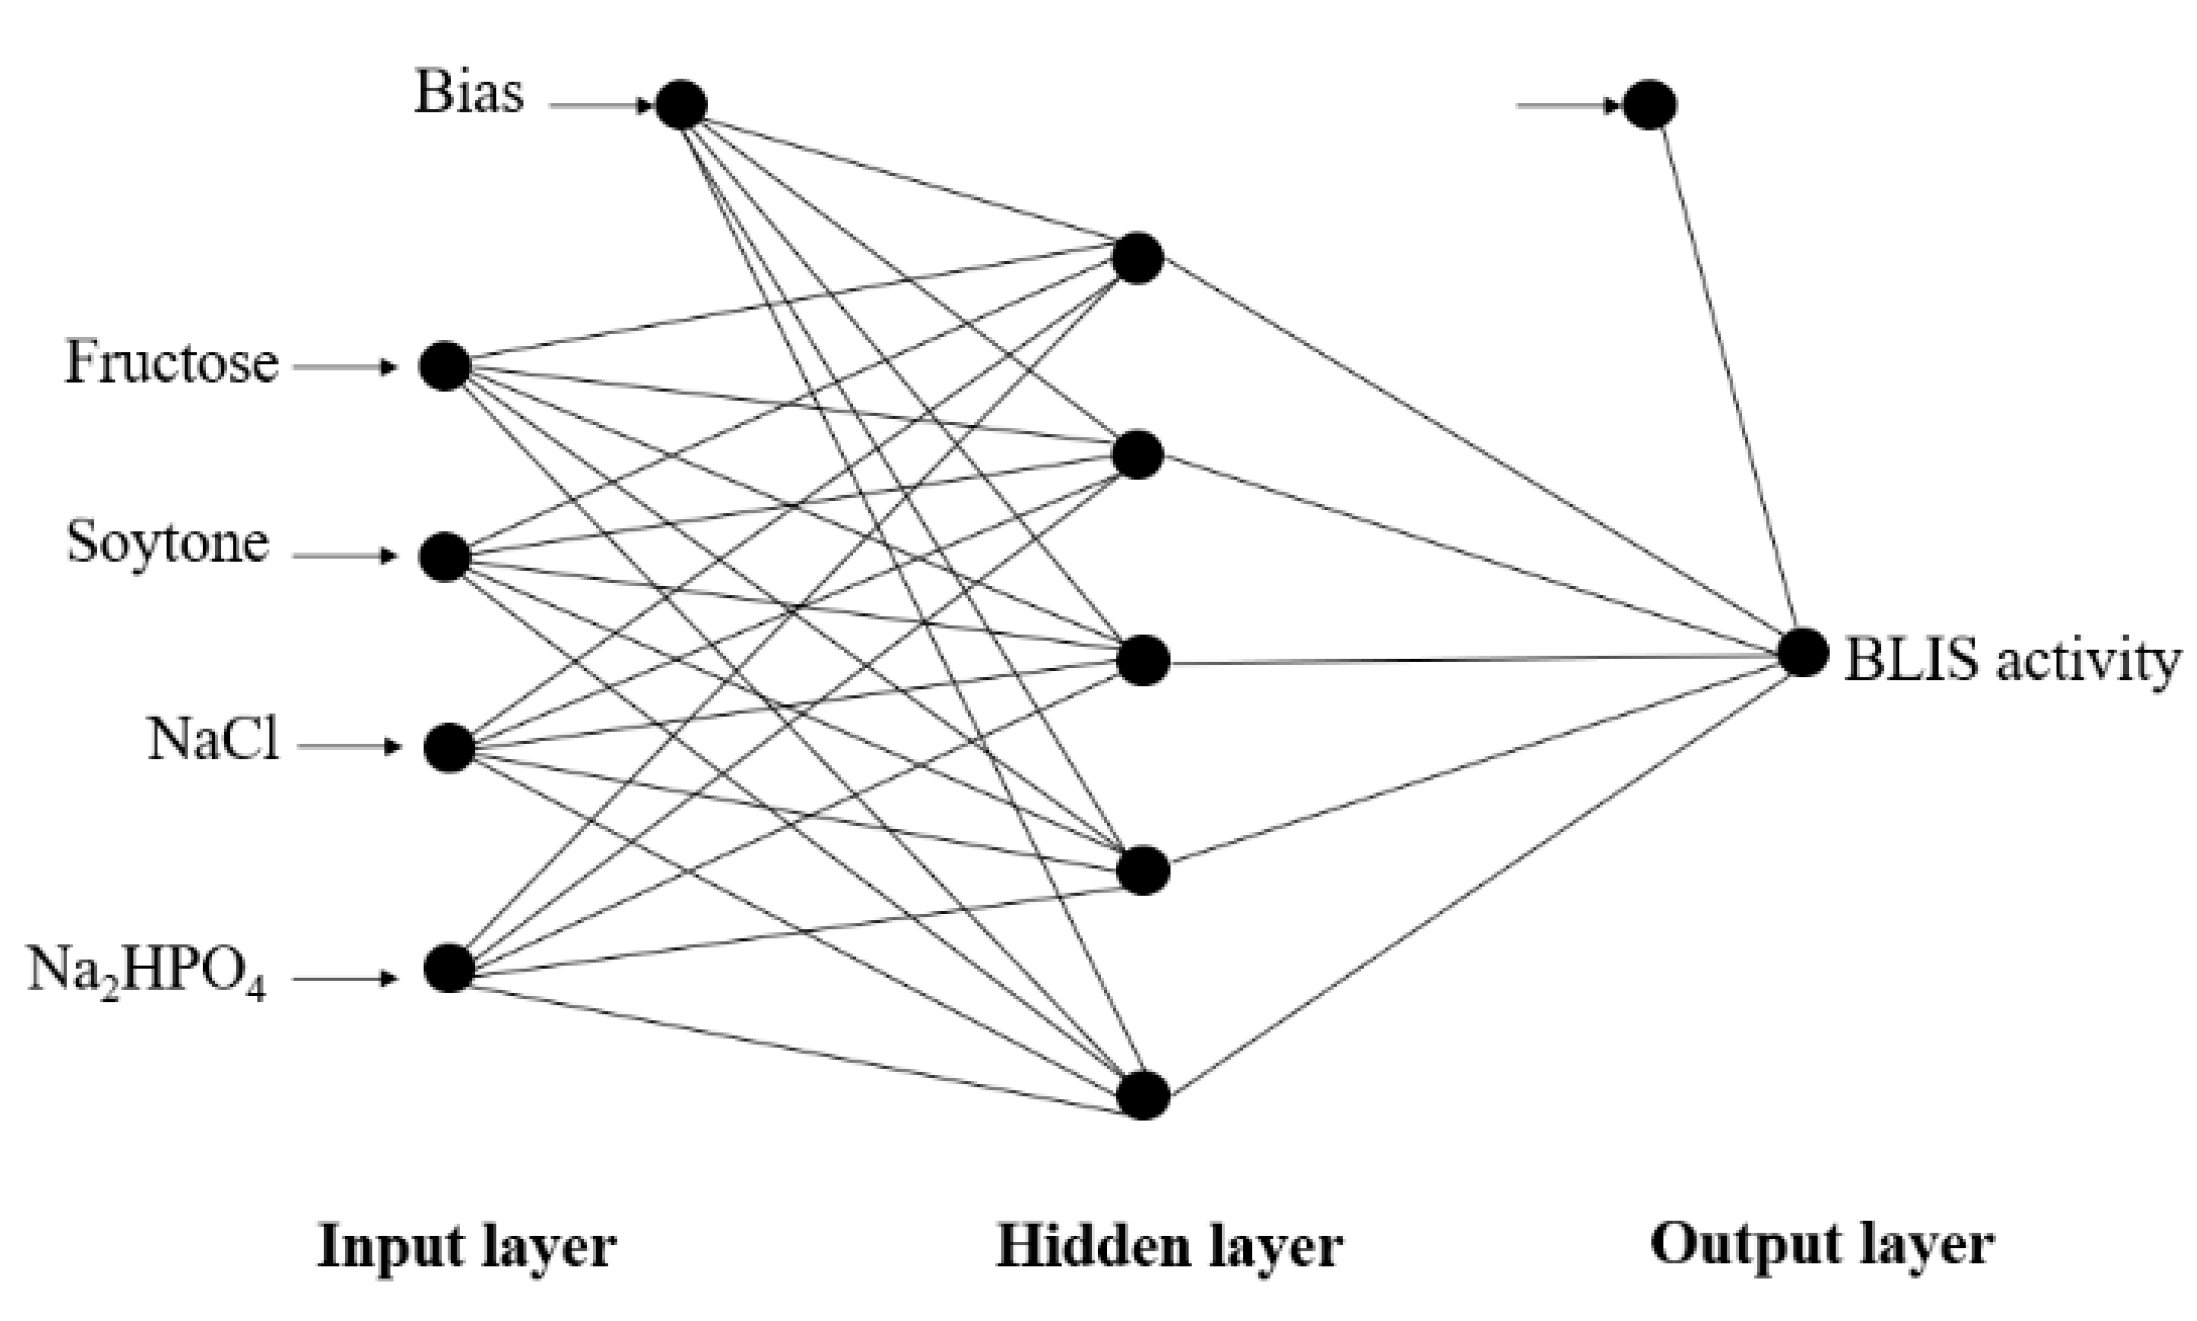
3.3. Optimization of Fermentation Parameters Using ANN
3.4. Optimization and Comparison of the Predictive Capability of RSM and ANN Models
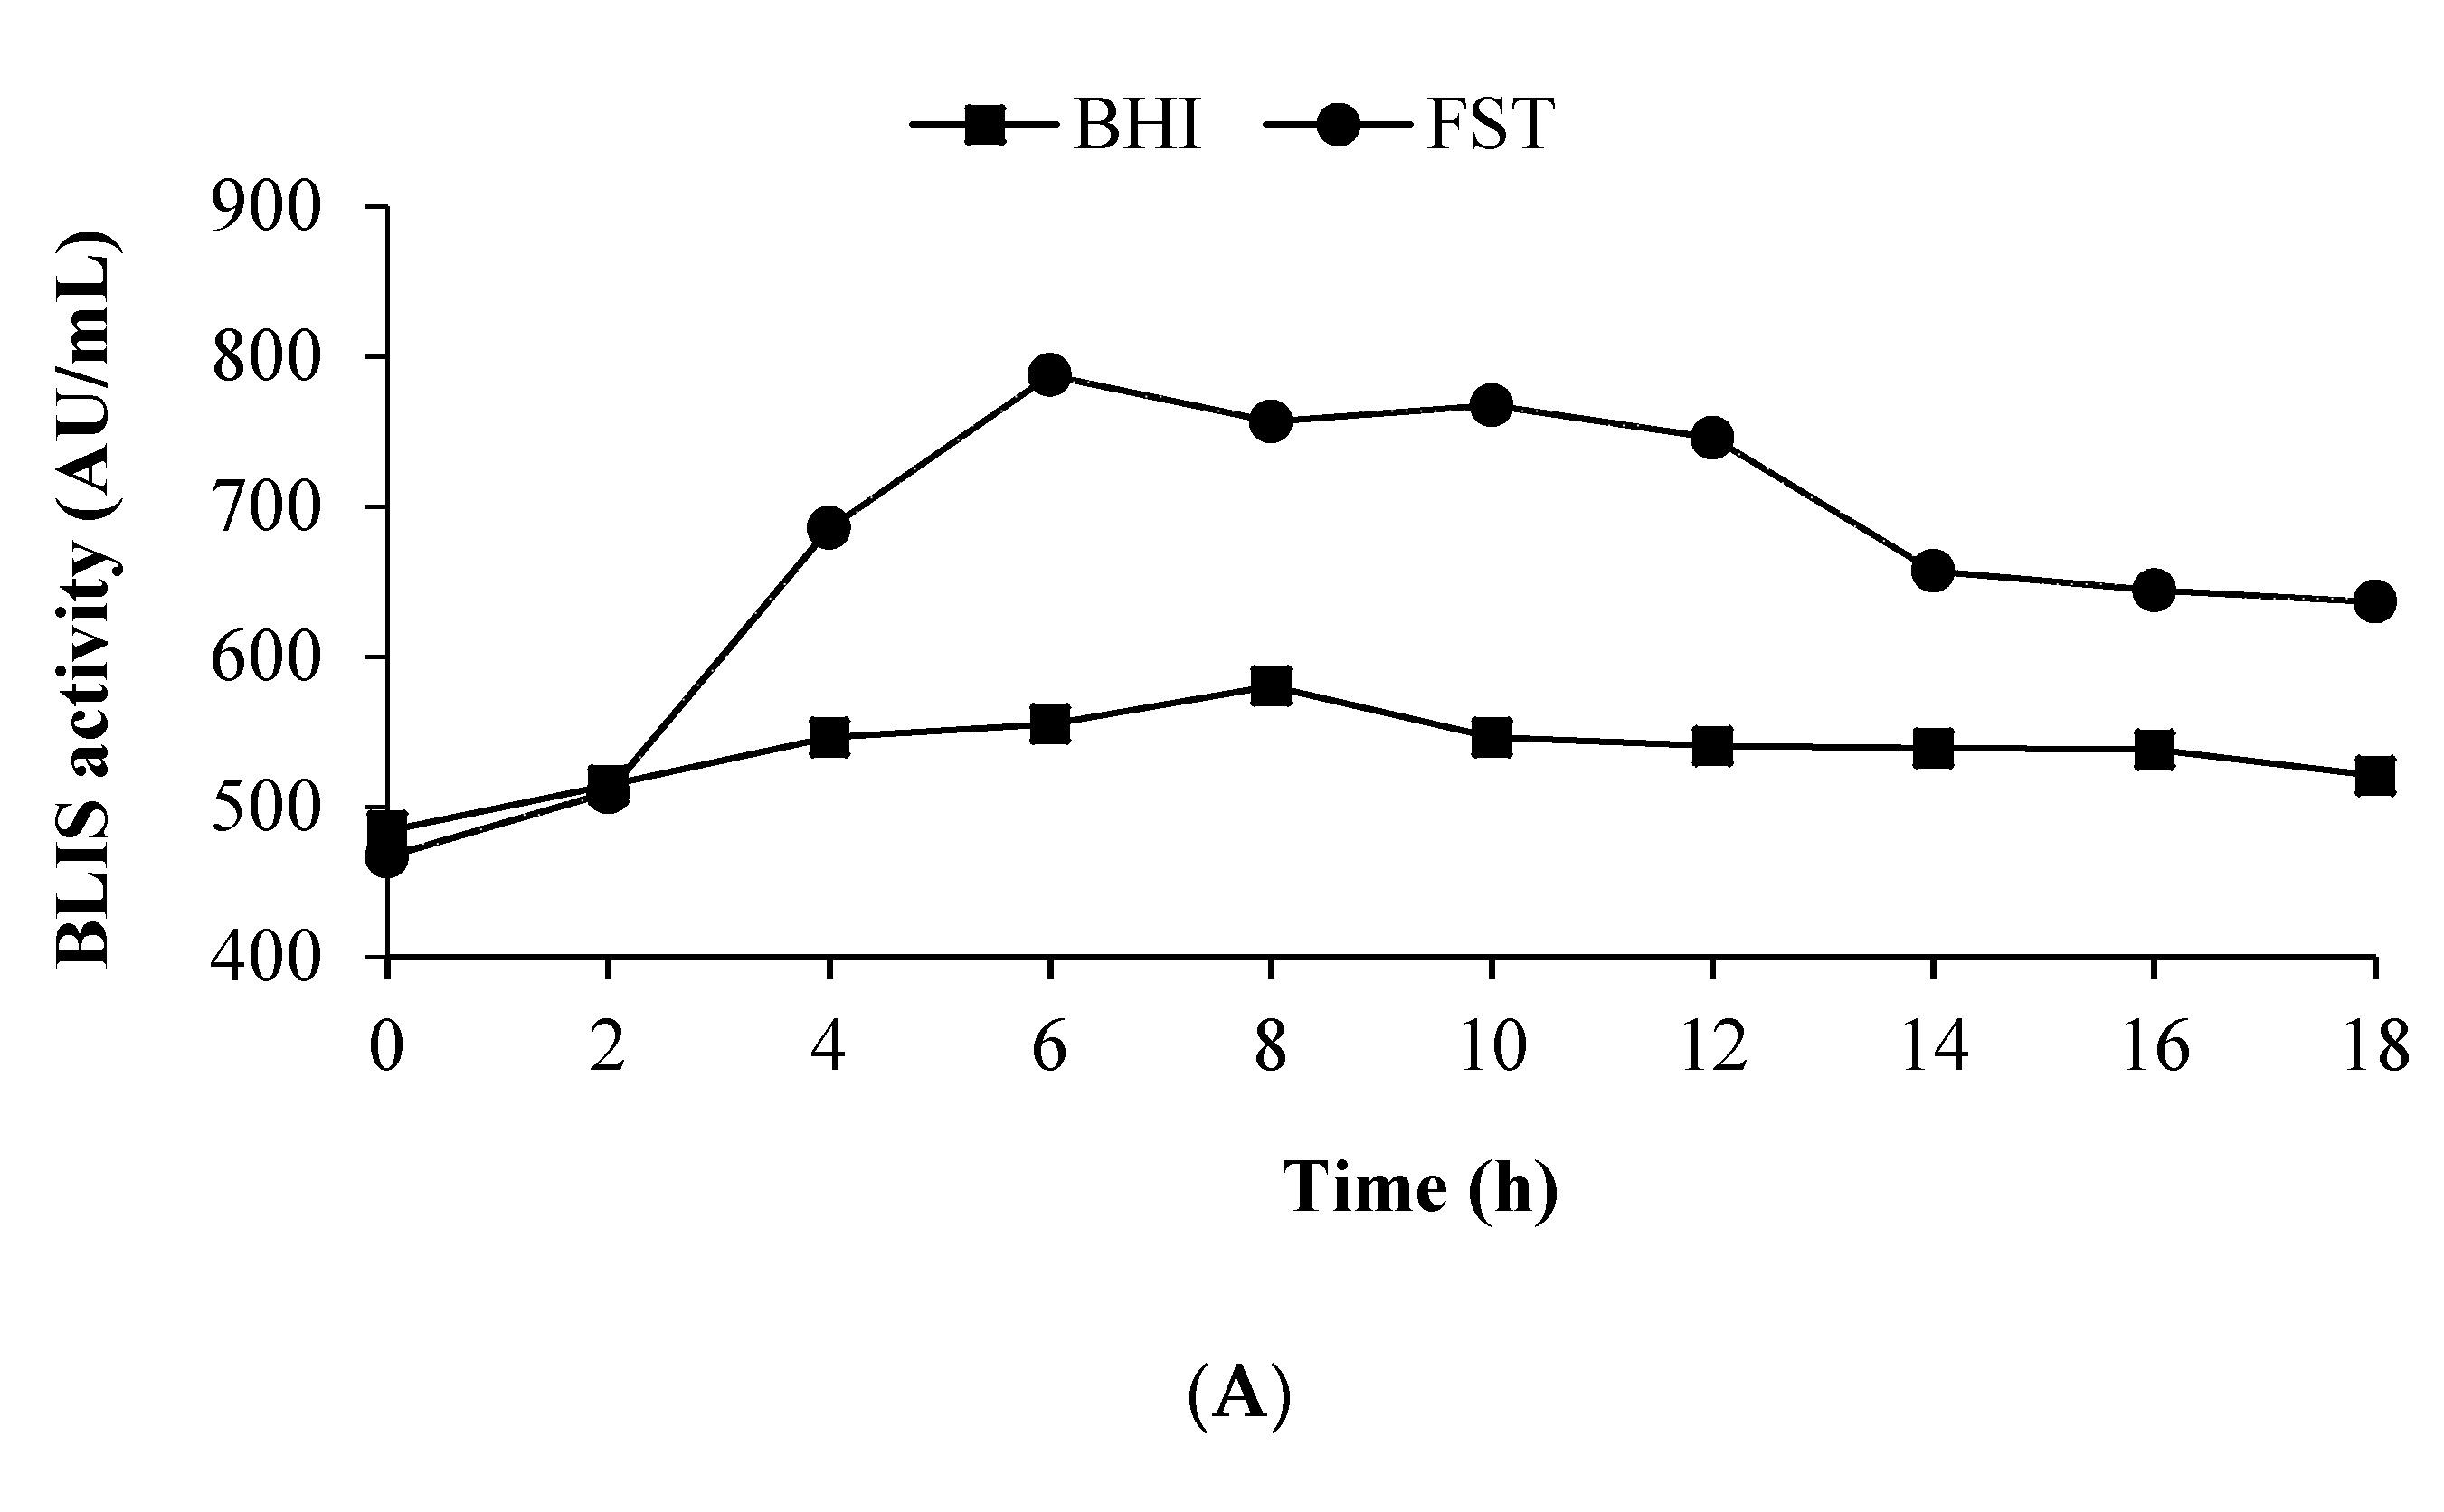
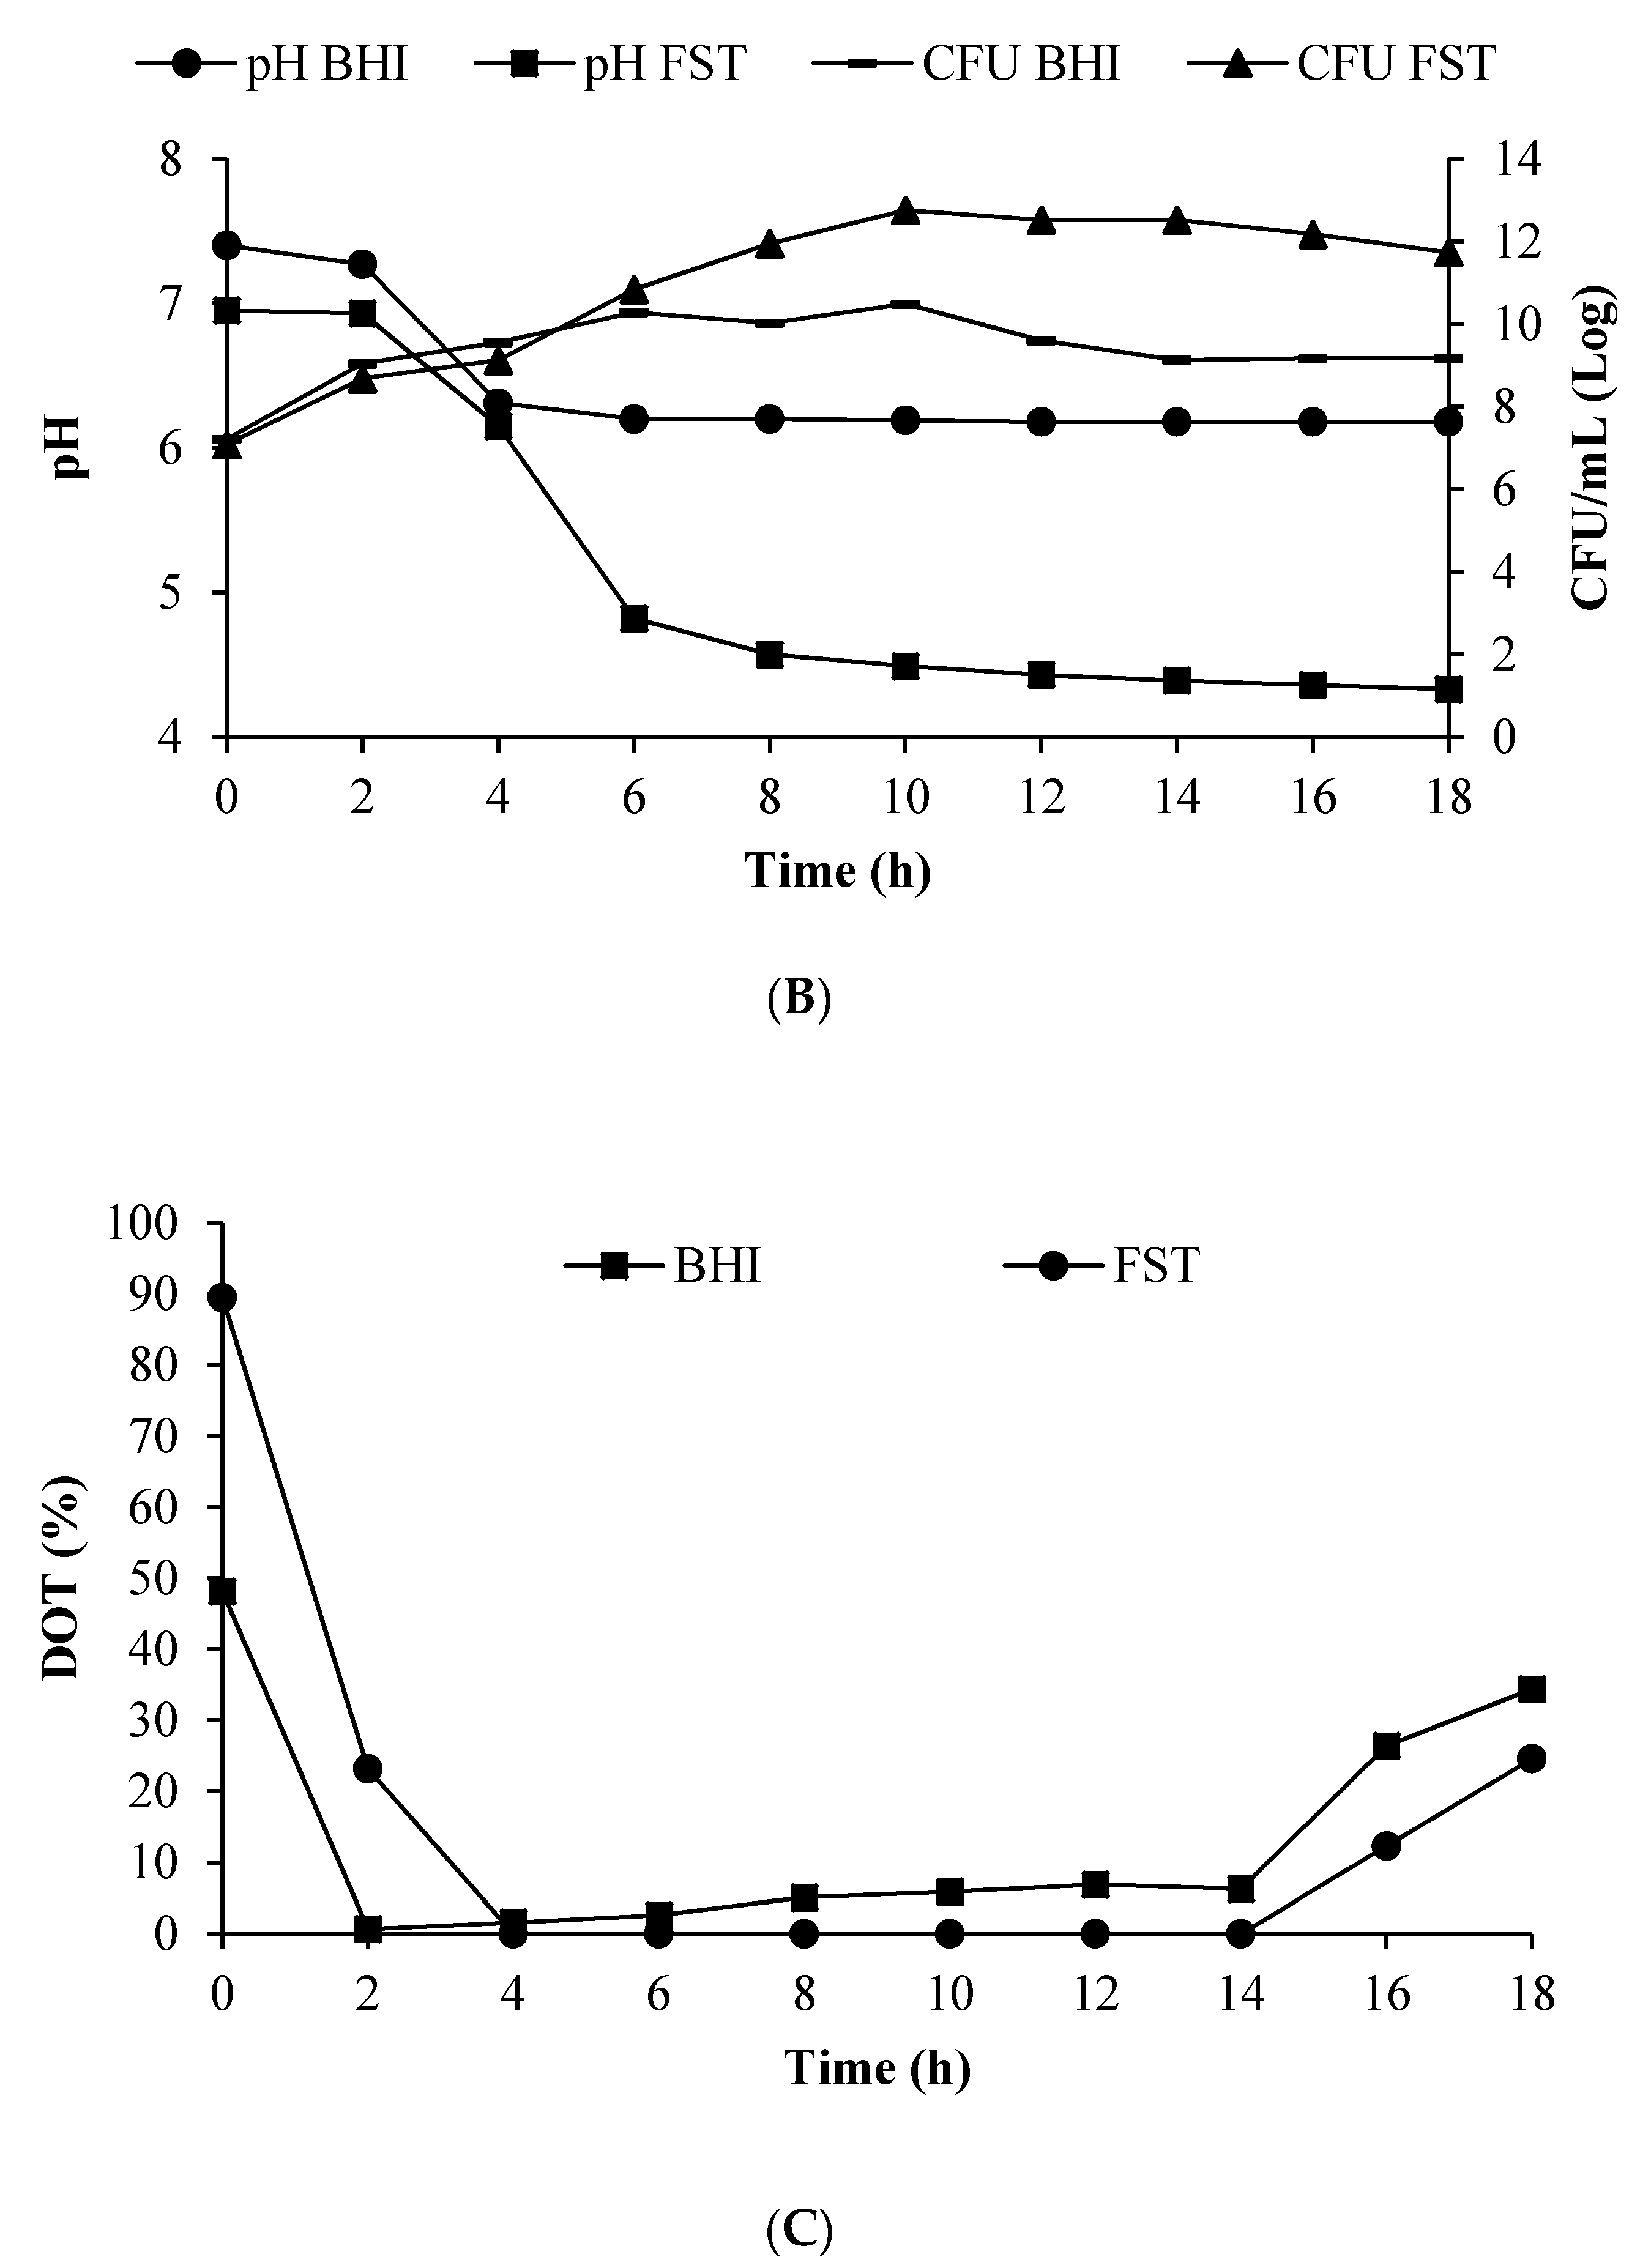
3.5. Growth of L. lactis Gh1 and BLIS Production in the Optimized Medium Using 2 L Stirred Tank Bioreactor
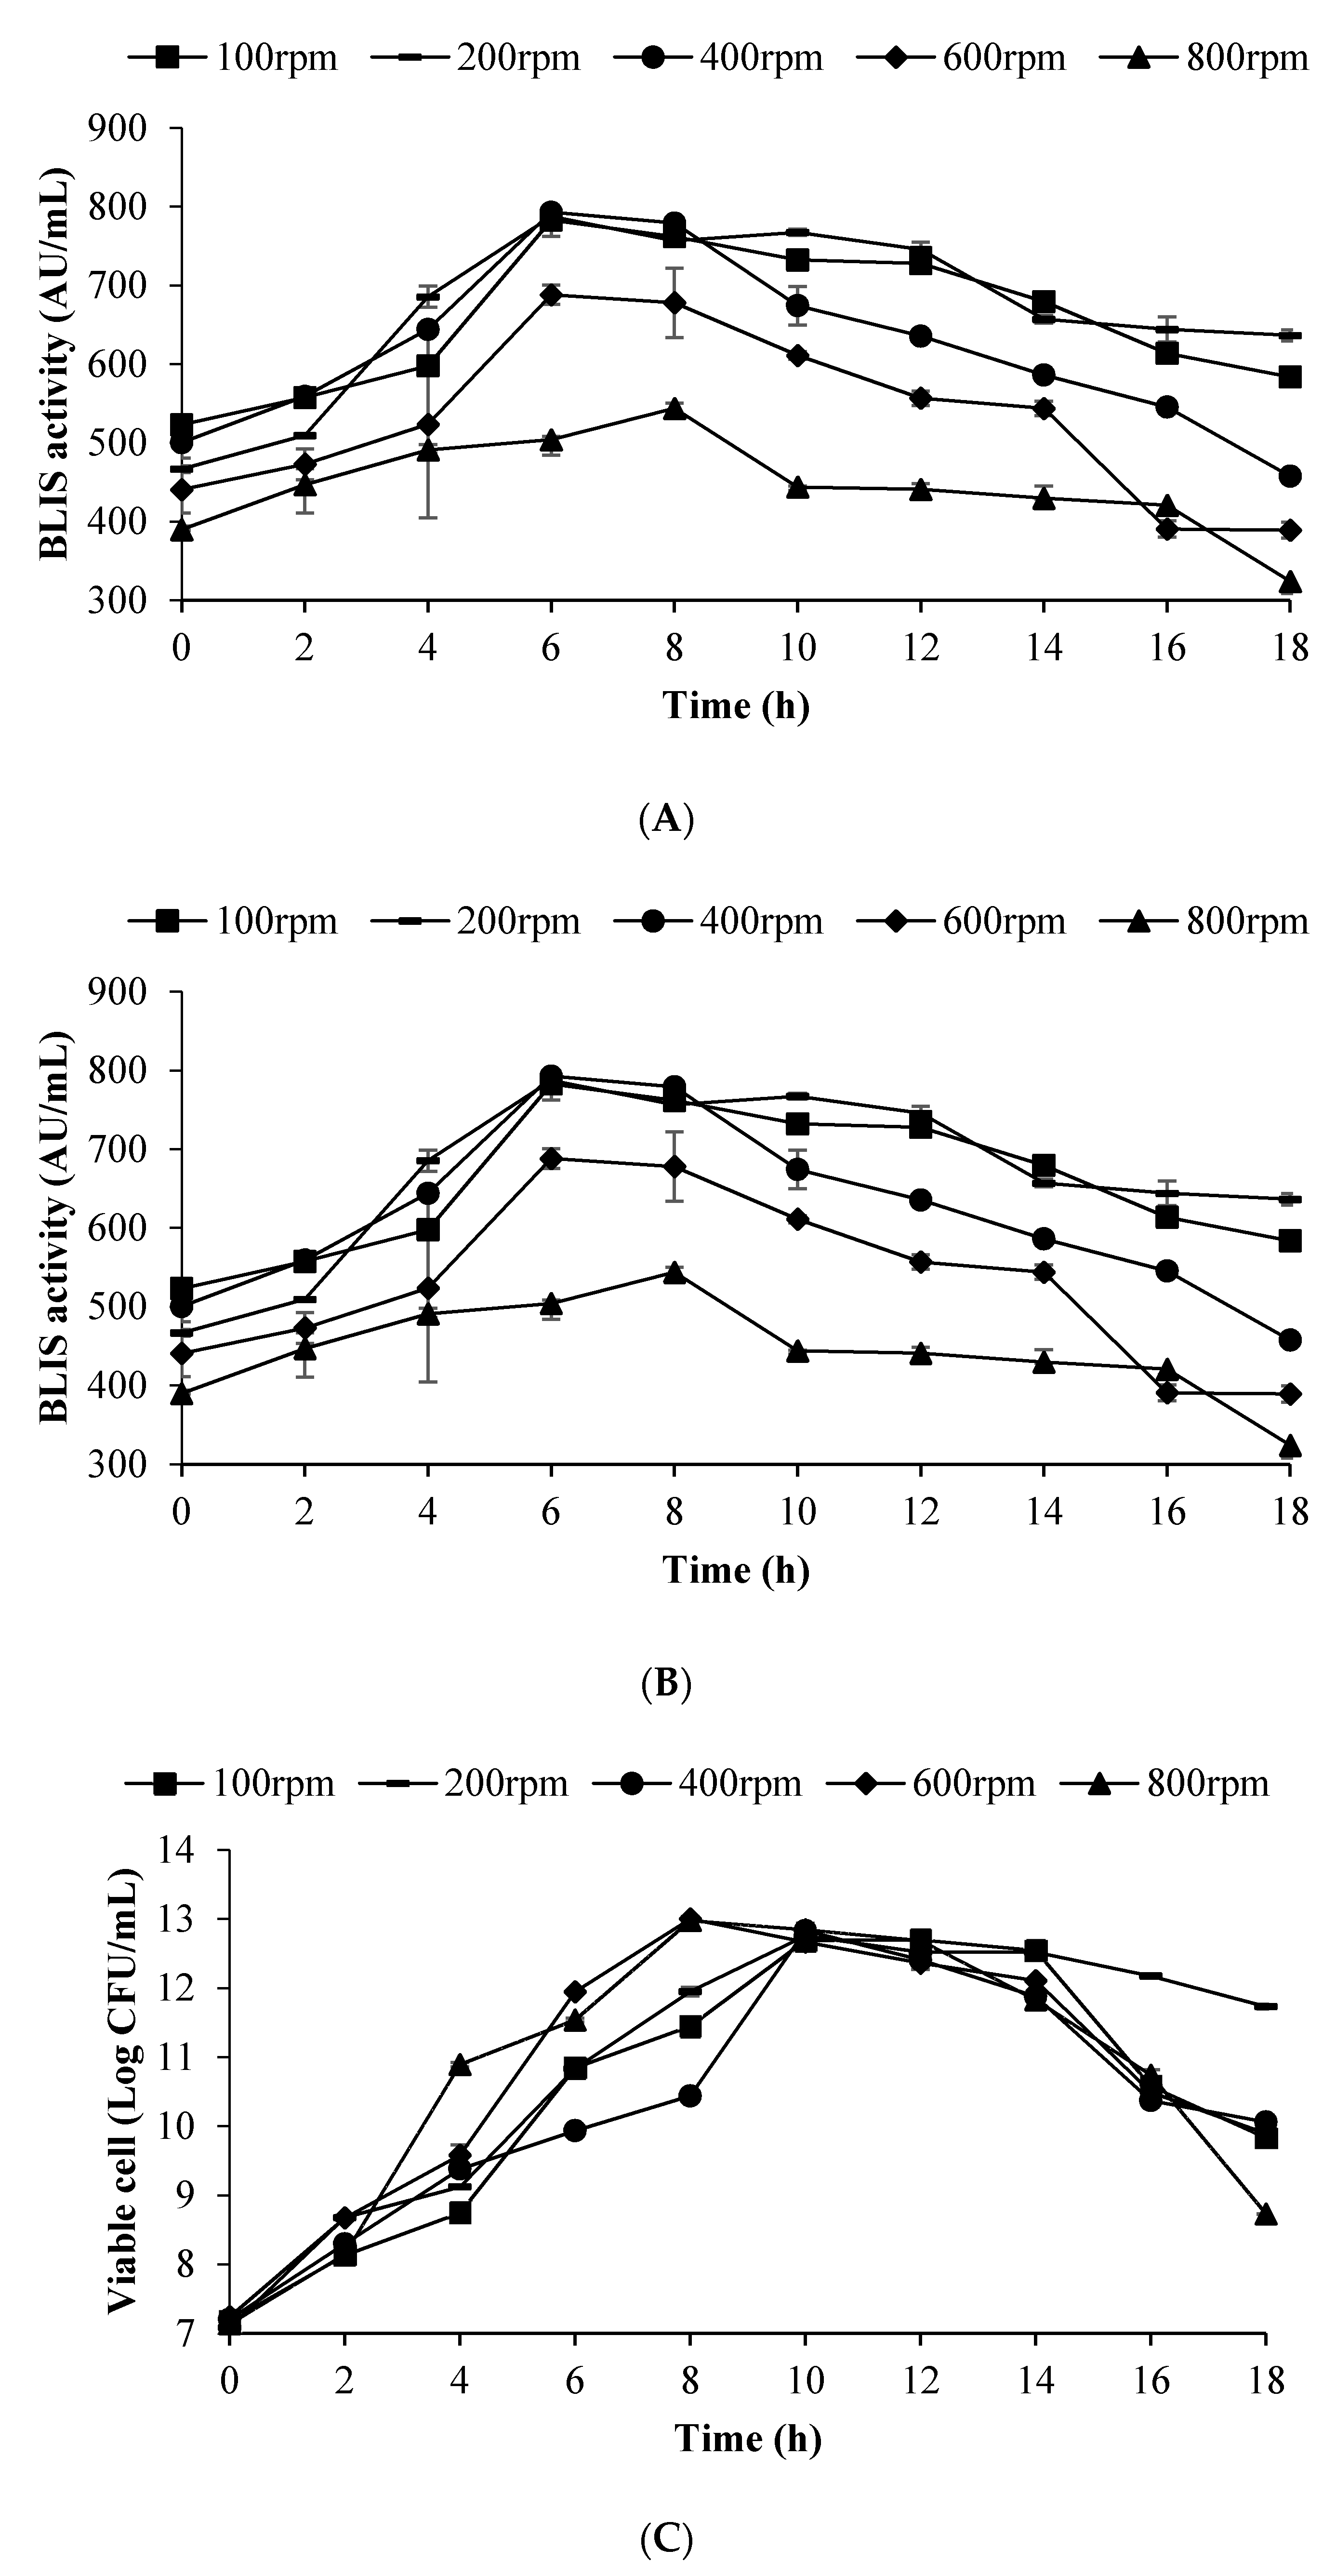
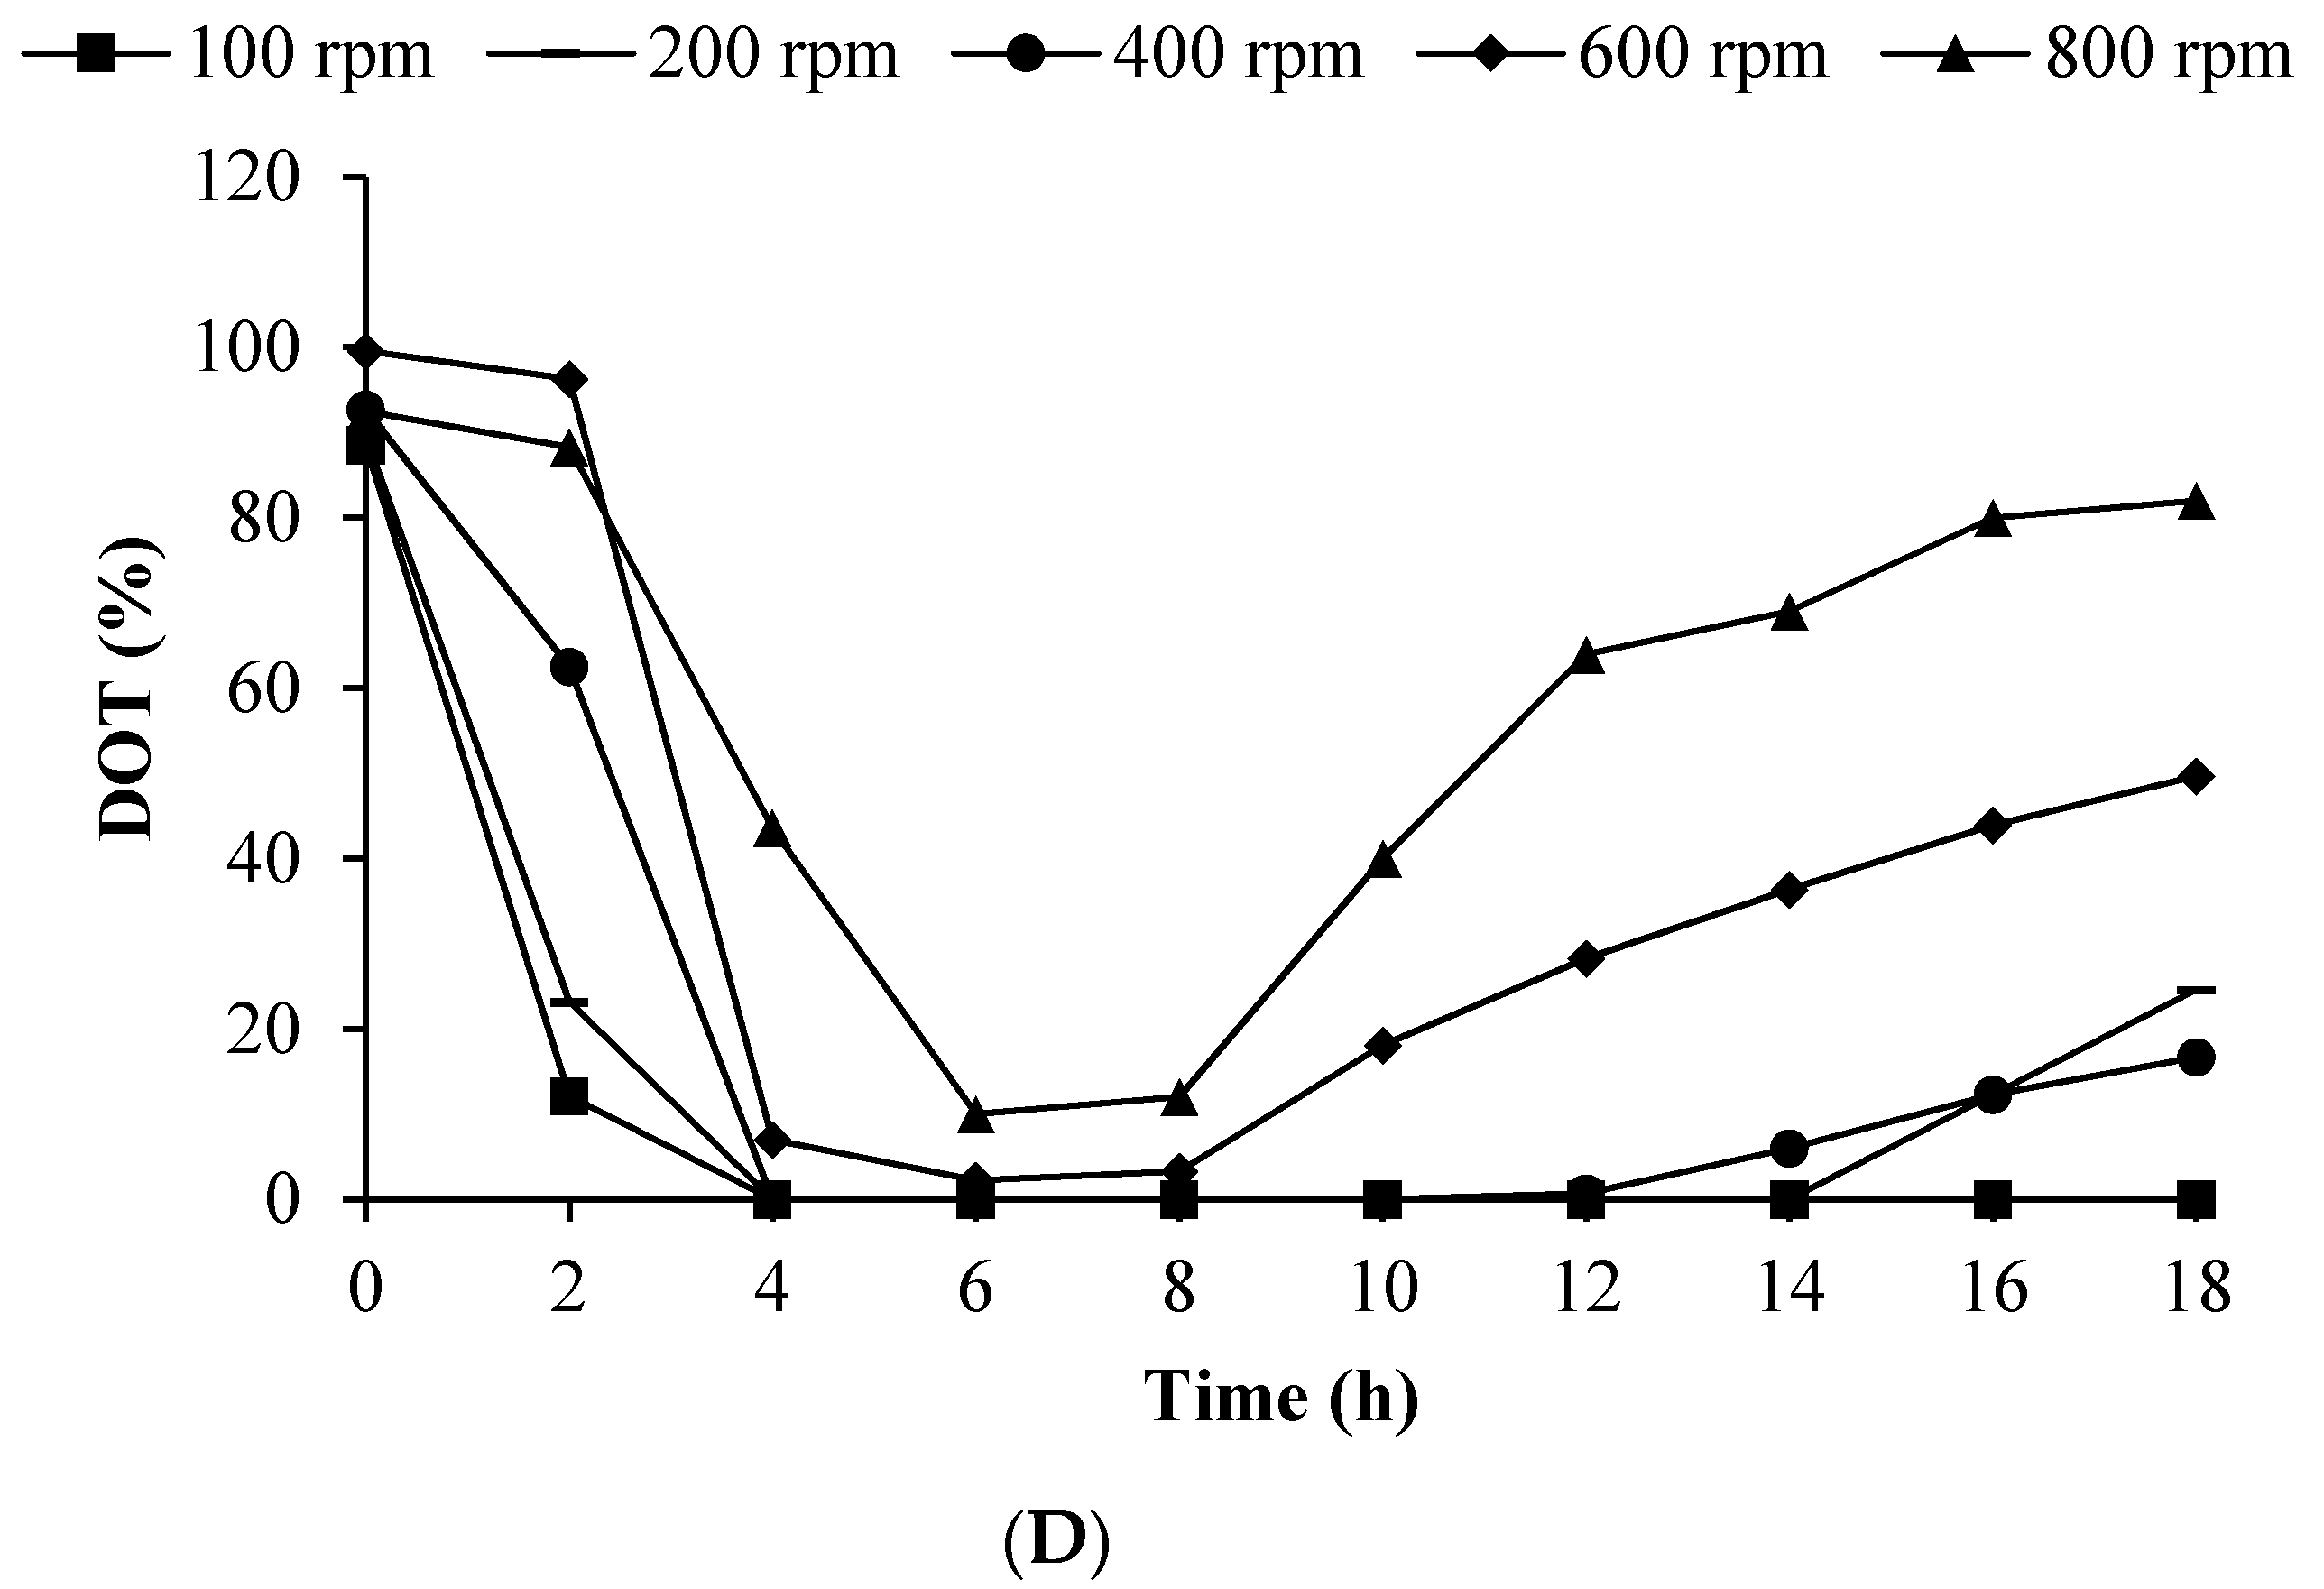
3.6. Effect of Impeller Speed on BLIS Production by L. lactis Gh1 in Optimised Medium Using 2 L Stirred Tank Bioreactor
4. Discussion
5. Conclusions
Author Contributions
Funding
Institutional Review Board Statement
Informed Consent Statement
Data Availability Statement
Conflicts of Interest
References
- Cotter, P.D.; Hill, C.; Ross, R.P. Bacteriocins: Developing innate immunity for food. Nat. Rev. Microbiol. 2005, 3, 777–788. [Google Scholar] [CrossRef]
- Leroy, F.; De Vuyst, L. Lactic acid bacteria as functional starter cultures for the food fermentation industry. Trends Food Sci. Technol. 2004, 15, 67–78. [Google Scholar] [CrossRef]
- Mills, S.; Serrano, L.; Griffin, C.; O’connor, P.M.; Schaad, G.; Bruining, C.; Hill, C.; Ross, R.P.; Meijer, W.C. Inhibitory activity of Lactobacillus plantarum LMG P-26358 against Listeria innocua when used as an adjunct starter in the manufacture of cheese. Microb. Cell Fact. 2011, 10. [Google Scholar] [CrossRef] [PubMed]
- Egan, K.; Field, D.; Rea, M.C.; Ross, R.P.; Hill, C.; Cotter, P.D. Bacteriocins: Novel solutions to age old spore-related problems? Front. Microbiol. 2016, 7, 461. [Google Scholar] [CrossRef]
- Abbasiliasi, S.; Tan, J.S.; Tengku Ibrahim, T.A.; Bashokouh, F.; Ramakrishnan, N.R.; Mustafa, S.; Ariff, A. Fermentation factors influencing the production of bacteriocins by lactic acid bacteria: A review. RSC Adv. 2017, 7, 29395–29420. [Google Scholar] [CrossRef]
- Heng, N.C.K.; Wescombe, P.A.; Burton, J.P.; Jack, R.W.; Tagg, J.R. The diversity of bacteriocins in Gram positive bacteria. In Bacteriocins: Ecology and Evolution; Riley, M.A., Chavan, M.A., Eds.; Springer: New York, NY, USA, 2007; pp. 45–92. [Google Scholar]
- Md Sidek, N.L.; Halim, M.; Tan, J.S.; Abbasiliasi, S.; Mustafa, S.; Ariff, A.B. Stability of bacteriocin-like inhibitory substance (BLIS) produced by Pediococcus acidilactici Kp10 at different extreme conditions. Biomed. Res. Int. 2018, 5973484. [Google Scholar] [CrossRef]
- Abbasiliasi, S.; Ramanan, R.N.; Tengku ibrahim, T.A.; Mustafa, S.; Mohamad, R.; Mohd Daud, H.; Ariff, A.B. Effect of medium composition and culture condition on the production of bacteriocin-like inhibitory substances (BLIS) by Lactobacillus Paracasei LA07, a Strain Isolated from Budu. Biotechnol. Biotechnol. Equip. 2011, 25, 2652–2657. [Google Scholar] [CrossRef]
- Chen, H.; Hoover, D. Bacteriocins and their food applications. Compr. Rev. Food Sci. Food Saf. 2003, 2, 82–100. [Google Scholar]
- Chikindas, M.L.; Montville, T.J. Perspectives for application of bacteriocins as food preservatives. In Control of Food-Borne Microorganisms; Juneja, V.K., Sofos, J.N., Eds.; Marcel Dekker: New York, NY, USA, 2002; pp. 303–321. [Google Scholar]
- Drider, D.; Fimland, G.; Hechard, Y.; McMullen, L.M.; Prevost, H. The continuing story of class IIa bacteriocins. Microbiol. Mol. Biol. Rev. 2006, 70, 564–582. [Google Scholar] [CrossRef] [PubMed]
- Singh, V.; Haque, S.; Niwas, R.; Srivastava, A.; Pasupuleti, M.; Tripathi, C.K.M. Strategies for fermentation medium optimization: An in-depth review. Front. Microbiol. 2017, 7, 2087. [Google Scholar] [CrossRef]
- Todorov, S.D.; Dicks, L.M.T. Effect of medium components on bacteriocin production by Lactobacillus pentosus St151br, a strain isolated from beer produced by the fermentation of maize, barley and soy flour. World J. Microbiol. Biotechnol. 2004, 20, 643–650. [Google Scholar] [CrossRef]
- Venigalla, S.; Sindhuja, Y.N.; Srujuna, K.; Swathi, S.; Naidu, Y.; Rao, G.H. Optimized production of bacteriocin from cheaper carbon and nitrogen sources using response surface methodology. Res. J. Microbiol. 2017, 12, 42–49. [Google Scholar] [CrossRef]
- Abdel-Rahman, M.A.; Hassan, S.E.D.; El-Din, M.N.; Azab, M.S.; El-Belely, E.F.; Alrefaey, H.M.A.; Elsakhawy, T. One-factor-at-a-time and response surface statistical designs for improved lactic acid production from beet molasses by Enterococcus hirae ds10. SN Appl. Sci. 2020, 24, 1–14. [Google Scholar] [CrossRef]
- Singh, V.; Khan, M.; Khan, S.; Tripathi, C.K.M. Optimization of actinomycin V production by Streptomyces triostinicus using artificial neural network and genetic algorithm. Appl. Microbiol. Biotechnol. 2009, 82, 379–385. [Google Scholar] [CrossRef]
- Anacarso, I.; Bondi, M.; Mura, C.; Niederhäusern, S.R.; Messi, P.; Sabia, C.; Condò, C. Culture compounds which are able to increase the growth and the production of bacteriocins by two different LABS. J. Plant. Pathol. Microbiol. 2014, 5, 234. [Google Scholar] [CrossRef]
- Abbasiliasi, S.; Tan, J.S.; Kadkhodaei, S.; Nelofer, R.; Tengku Ibrahim, T.A.; S, M.; Ariff, A.B. Enhancement of BLIS production by Pediococcus acidilactici kp10 in optimized fermentation conditions using an artificial neural network. RSC Adv. 2016, 6, 6342–6349. [Google Scholar] [CrossRef]
- Von Mollendorff, J.W.; Todorov, S.D.; Dicks, L.M.T. Optimization of growth medium for production of bacteriocins produced by Lactobacillus plantarum Jw3Bz and Jw6Bz, and Lactobacillus fermentum Jw11Bz and Jw15Bz isolated from Boza. Trakia J. Sci. 2009, 7, 22–33. [Google Scholar]
- Chatterjee, M.; Jana, S.C. Raychaudhuri, Optimization of media and culture conditions for improved production of bacteriocin by using conventional one-factor-at-a-time (OFAT) method. EC Microbiol. 2019, 15, 251–258. [Google Scholar]
- Panda, B.P.; Ali, M.; Javed, S. Fermentation process optimisation. Res. J. Microbiol. 2007, 2, 201–208. [Google Scholar]
- Nor, N.M.; Mohamed, M.S.; Loh, T.C.; Foo, H.L.; Rahim, R.A.; Tan, J.S.; Mohamad, R. Comparative analyses on medium optimization using one-factor-at-a-time, response surface methodology, and artificial neural network for lysine–methionine biosynthesis by Pediococcus pentosaceus RF-1. Biotechnol. Biotechnol. Equip. 2017, 31, 935–947. [Google Scholar] [CrossRef]
- Jawan, R.; Abbasiliasi, S.; Mustafa, S.; Kapri, M.R.; Halim, M.; Ariff, A.B. In vitro evaluation of potential probiotic strain Lactococcus lactis Gh1 and its bacteriocin-like inhibitory substances for potential use in the food industry. Probiotics Antimicrob. Proteins 2020, 1–19. [Google Scholar] [CrossRef]
- Jawan, R.; Abbasiliasi, S.; Tan, J.S.; Mustafa, S.; Halim, M.; Ariff, A.B. Influence of culture conditions and medium compositions on the production of bacteriocin-like inhibitory substances by Lactococcus lactis Gh1. Microorganisms 2020, 8, 1454. [Google Scholar] [CrossRef] [PubMed]
- AOAC. Official Methods of Analysis, 16th ed.; Association of Official Analytical Chemists: Rockville, MD, USA, 1995. [Google Scholar]
- Gonzalez, R.; Slas, L.; Obregon, A.-M.; Escalante, L.; Sanchez, S. Gentamicin formation in Micromonospora purpurea: Stimulatory effect of ammonium. J. Antibiot. 1995, 48, 479–483. [Google Scholar] [CrossRef] [PubMed]
- Souza, E.C.; de Souza de Azevedo, P.O.; Domínguez, J.M.; Converti, A.; de Souza Oliveira, R.P. Influence of temperature and pH on the production of biosurfactant, bacteriocin and lactic acid by Lactococcus lactis CECT-4434. CyTA—J. Food 2017, 15, 525–530. [Google Scholar] [CrossRef]
- Yang, E.; Fan, L.; Yan, J.; Jiang, Y.; Doucette, C.; Fillmore, S.; Walker, B. Influence of culture media, pH and temperature on growth and bacteriocin production of bacteriocinogenic lactic acid bacteria. Amb Express 2018, 8, 10. [Google Scholar] [CrossRef]
- Mataragas, M.; Drosinos, E.H.; Tsakalidou, E.; Metaxopoulos, J. Influence of nutrients on growth and bacteriocin production by Leuconostoc mesenteroides L124 and Lactobacillus curvatus L442. Antonie van Leeuwenhoek. Int. J. Gen. Mol. Microbiol. 2004, 85, 191–198. [Google Scholar]
- BD Biosciences. BD Bionutrients™ Technical Manual; DIALOG: Hong Kong, 2015. [Google Scholar]
- Atlas, R.M. Handbook of Microbiology Media, 3rd ed.; CRC Press: Boca Raton, FL, USA, 2004. [Google Scholar]
- Aller, K.; Adamberg, K.; Timarova, V.; Seiman, A.; Feštšenko, D.; Vilu, R. Nutritional requirements and media development for Lactococcus lactis IL1403. Appl. Microbiol. Biotechnol. 2014, 98, 5871–5881. [Google Scholar] [CrossRef]
- Ooi, M.F.; Mazlan, N.; Foo, H.L.; Loh, T.C.; Rosfarizan, M.; Rahim, R.A.; Ariff, A. Effects of carbon and nitrogen sources on bacteriocin-inhibitory activity of postbiotic metabolites produced by Lactobacillus plantarum I-UL4. Malays. J. Microbiol. 2015, 11, 176–184. [Google Scholar]
- Aasen, I.M.; Moreto, T.; Katla, T.; Axelsson, L.; Storro, I. Influence of complex nutrients, temperature and pH on bacteriocin production by Lactobacillus sakei CCUG 42687. Appl. Microbiol. Biotechnol. 2000, 53, 159–166. [Google Scholar] [CrossRef]
- Khay, E.Q.; Ouhsassi, M.; Harsal, A.E.; Idaomar, M.; Abrini, J. Optimisation of bacteriocin like production by Enterococcus durans E204 isolated from camel milk of Morocco. Curr. Res. Microbiol. Biotechnol. 2013, 1, 155–159. [Google Scholar]
- Han, B.; Yu, Z.; Liu, B.; Ma, Q.; Zhang, R. Optimization of bacteriocin production by Lactobacillus plantarum YJG, isolated from the mucosa of the gut of healthy chickens Afr. J. Microbiol. Res. 2011, 5, 1147–1155. [Google Scholar]
- Kennedy, M.; Krouse, D. Strategies for improving fermentation medium performance: A review. J. Ind. Microbiol. Biotechnol. 1999, 23, 456–475. [Google Scholar] [CrossRef]
- Guo, W.; Zhang, Y.; Lu, J.; Jiang, L.; Teng, L.; Wang, Y. Optimization of fermentation medium for nisin production from Lactococcus lactis subsp. lactis using response surface methodology (RSM) combined with artificial neural network-genetic algorithm (ANN-GA). Afr. J. Biotechnol. 2010, 9, 6264–6272. [Google Scholar]
- Abbasiliasi, S.; Tan, J.S.; Ibrahim, T.A.T.; Ramanan, R.N.; Kadkhodaei, S.; Mustafa, S.; Ariff, A.B. Kinetic modeling of bacteriocin-like inhibitory substance secretion by Pediococcus acidilactici Kp10 and its stability in food manufacturing conditions. J. Food Sci. Technol. 2018, 55, 1270–1284. [Google Scholar] [CrossRef] [PubMed]
- Poirazi, P.; Leroy, F.; Georgalaki, M.D.; Aktypis, A.; De Vuyst, L.; Tsakalidou, E. Use of artificial neural networks and a gamma-concept-based approach to model growth of and bacteriocin production by Streptococcus macedonicus ACA-DC 198 under simulated conditions of Kasseri cheese production. Appl. Environ. Microbiol. 2007, 73, 768–776. [Google Scholar] [CrossRef] [PubMed]
- Yi, H.; Han, X.; Yang, Y.; Liu, W.; Liu, H.; Zhang, Y.; Sun, K.; Zhang, L.; Ma, F. Effect of exogenous factors on bacteriocin production from Lactobacillus paracasei J23 by using a resting cell system. Int. J. Mol. Sci. 2013, 14, 24355–24365. [Google Scholar] [CrossRef]
- Thirumurugan, A.; Ramachandran, S.; Gobikrishnan, S. Optimization of medium components for maximizing the bacteriocin production by Lactobacillus plantarum ATM11 using statistical design. Int. Food Res. J. 2015, 22, 1272–1279. [Google Scholar]
- Cazetta, M.L.; Celligoi, M.A.P.C.; Buzato, J.B.; Scarmino, I.S. Fermentation of molasses by Zymomonas mobilis: Effects of temperature and sugar concentration on ethanol production. Biores. Technol. 2007, 98, 2824–2828. [Google Scholar] [CrossRef]
- Moghaddam, M.G.; Ahmad, F.B.H.; Basri, M.; Rahman, M.B.A. Artificial neural network modeling studies to predict the yield of enzymatic synthesis of betulinic acid ester. Electron. J. Biotechnol. 2010, 12, 1–12. [Google Scholar] [CrossRef]
- Moghaddam, M.G.; Khajeh, M. Comparison of response surface methodology and artificial neural network in predicting the microwave-assisted extraction procedure to determine zinc in fish muscles. Food Nutr. Sci. 2011, 2, 803–808. [Google Scholar] [CrossRef]
- Baş, D.; Boyaci, I.H. Modeling and optimization II: Comparison of estimation capabilities of response surface methodology with artificial neural networks in a biochemical reaction. J. Food Eng. 2007, 78, 854. [Google Scholar] [CrossRef]
- Purwanto, L.A.; Ibrahim, D.; Sudrajat, H. Effect of agitation speed on morphological changes in Aspergillus niger hyphae during production of tannase. World J. Chem. 2009, 4, 34–38. [Google Scholar]
- Mortvedt-Abildgaard, C.I.; Nissen-Meyer, J.; Jelle, B.; Grenov, B.; Skaugen, M.; Nes, I.F. Production and pH-dependent bactericidal activity of lactocin S, a lantibiotic from Lactobacillus sake L45. Appl. Environ. Microbiol. 1995, 61, 175–179. [Google Scholar] [CrossRef]
- Chinachoti, N.; Matsusaki, H.; Sonomoto, K.; Ishizaki, A. Utilisation of xylose as an alternative carbon source for nisin Z production by Lactococcus lactis IO-1. J. Fac. Agric. Hokkaido Univ. 1997, 42, 171–181. [Google Scholar]
- Enan, G.; Amri, A.A.A. Novel plantaricin UG1 production by Lactobacillus plantarum UG1 in enriched whey permeate in batch fermentation processes. J. Food Agric. Enviton. 2006, 4, 85–88. [Google Scholar]
- Kim, W.S.; Hall, R.J.; Dunn, N.W. The effect of nisin concentration and nutrient depletion on nisin production of Lactococcus lactis. Appl. Microbiol. Biotechnol. 1997, 48, 449–453. [Google Scholar] [CrossRef]
- Bogovic-Matijasic, B.; Rogeli, I. Bacteriocin complex of Lactobacillus acidophilus LF221—production studies in MRS-media at different pH-values and effect against Lactobacillus heleticus ATCC 15009. Process. Biochem 1998, 33, 345–352. [Google Scholar] [CrossRef]
- Li, C.; Bai, J.; Cai, Z.; Ouyang, F. Optimization of a cultural medium for bacteriocin production by Lactococcus lactis using response surface methodology. J. Biotechnol. 2002, 93, 27–34. [Google Scholar] [CrossRef]
- Condon, S. Responses of lactic acid bacteria to oxygen. FEMS Microbiol. Rev. 1987, 46, 269–280. [Google Scholar] [CrossRef]
- Duwat, P.; Ehrlich, S.D.; Gruss, A. The recA gene of Lactococcus lactis: Characterisation and involvement in oxidative and thermal stress. Mol. Microbiol. 1995, 17, 1121–1131. [Google Scholar] [CrossRef] [PubMed]
- Anders, R.F.; Hogg, D.M.; Jago, G.R. Formation of hydrogen peroxide by group N streptococci and its effect on their growth and metabolism. Appl. Microbiol. 1970, 19, 608–612. [Google Scholar] [CrossRef]
- Bramsiepe, C.; Sieversa, S.; Seiferta, T.; Stefanidisb, G.D.; Vlachosc, D.G.; Schnitzerd, H.; Mustere, B.; Brunnere, C.; Sandersf, J.P.M.; Schembeckera, G.; et al. Low-cost small-scale processing technologies for production applications in various environments—Mass produced factories. Chem. Eng. Process. 2012, 51, 32–52. [Google Scholar] [CrossRef]
- Kaur, G.; Roy, I. Strategies for large-scale production of polyhydroxyalkanoates. Chem. Biochem. Eng. 2015, 29, 157–172. [Google Scholar] [CrossRef]
- Guerra, N.P.; Agrasar, A.T.; Macías, C.L.; Pastrana, L. Modelling the fed-batch production of pediocin using mussel processing wastes. Process. Biochem. 2005, 40, 1071–1083. [Google Scholar] [CrossRef]


| Commercial BHI Medium | Modified Medium | ||
|---|---|---|---|
| Component | Concentration (g/L) | Component | Concentration (g/L) |
| Nutrient substrate (Extract of brain and heart, and peptones) | 27.5 (4.6 g N) | Soytone | 17.69 (2.3 g N), 35.38 (4.6 g N), 53.07 (6.9 g N) |
| Sodium chloride | 5.0 | Sodium chloride | 2.5, 5.0, 7.5 |
| Di-sodium hydrogen phosphate | 2.5 | Di-sodium hydrogen phosphate | 1.5, 3.0, 4.5 |
| Glucose | 2.0 | Fructose | 1.0, 2.0, 4.0 |
| Exp No. | Fructose(X1) g/L | Soytone(X2) g/L | NaCl(X3) g/L | Na2HPO4(X4) g/L | Bacteriocins Activity (AU/mL) | Final pH | Dry Cell Weight g/L | ||
|---|---|---|---|---|---|---|---|---|---|
| Experimental | Predicted by RSM (% Difference) * | Predicted by ANN (% Difference) * | |||||||
| 1 | 4 | 38.46 | 1 | 1.5 | 598.16 | 562.90 (5.89) | 598.16 (0) | 4.43 | 0.51 |
| 2 | 12 | 38.46 | 1 | 1.5 | 593.93 | 600.48 (−1.10) | 593.93 (0) | 4.40 | 0.51 |
| 3 | 4 | 107.69 | 1 | 1.5 | 700.23 | 690.17 (1.44) | 700.23 (0) | 4.77 | 0.76 |
| 4 | 12 | 107.69 | 1 | 1.5 | 692.21 | 689.77 (0.35) | 692.21 (0) | 4.81 | 0.71 |
| 5 | 4 | 38.46 | 2.5 | 1.5 | 602.07 | 606.39 (−0.72) | 602.07 (0) | 4.39 | 0.50 |
| 6 | 12 | 38.46 | 2.5 | 1.5 | 626.86 | 617.78 (1.45) | 626.86 (0) | 4.38 | 0.51 |
| 7 | 4 | 107.69 | 2.5 | 1.5 | 676.64 | 703.61 (−3.99) | 676.64 (0) | 4.80 | 0.78 |
| 8 | 12 | 107.69 | 2.5 | 1.5 | 710.11 | 677.03 (4.66) | 710.11 (0) | 4.74 | 0.72 |
| 9 | 4 | 38.46 | 1 | 4.5 | 589.26 | 600.60 (−1.92) | 589.26 (0) | 4.90 | 0.62 |
| 10 | 12 | 38.46 | 1 | 4.5 | 658.06 | 622.02 (5.48) | 658.06 (0) | 4.46 | 0.62 |
| 11 | 4 | 107.69 | 1 | 4.5 | 663.64 | 663.65 (0) | 663.64 (0) | 5.02 | 0.92 |
| 12 | 12 | 107.69 | 1 | 4.5 | 673.15 | 647.09 (3.87) | 673.15 (0) | 4.72 | 0.87 |
| 13 | 4 | 38.46 | 2.5 | 4.5 | 644.18 | 637.54 (1.03) | 644.18 (0) | 4.84 | 0.63 |
| 14 | 12 | 38.46 | 2.5 | 4.5 | 644.44 | 632.76 (1.81) | 644.44 (0) | 4.44 | 0.63 |
| 15 | 4 | 107.69 | 2.5 | 4.5 | 698.83 | 670.54 (4.05) | 698.83 (0) | 4.96 | 0.91 |
| 16 | 12 | 107.69 | 2.5 | 4.5 | 601.61 | 627.79 (−4.35) | 601.61 (0) | 4.70 | 1.37 |
| 17 | 0 | 73.08 | 1.75 | 3 | 615.52 | 618.92 (−0.55) | 615.52 (0) | 5.41 | 0.74 |
| 18 | 16 | 73.08 | 1.75 | 3 | 586.34 | 613.75 (−4.67) | 586.34 (0) | 4.58 | 1.07 |
| 19 | 8 | 3.85 | 1.75 | 3 | 530.23 | 553.07 (−4.31) | 530.23 (0) | 5.53 | 0.08 |
| 20 | 8 | 142.31 | 1.75 | 3 | 667.38 | 675.36 (−1.20) | 667.38 (0) | 4.90 | 1.45 |
| 21 | 8 | 73.08 | 0.25 | 3 | 644.84 | 675.40 (−4.74) | 644.84 (0) | 4.60 | 1.15 |
| 22 | 8 | 73.08 | 3.25 | 3 | 699.34 | 699.59 (−0.04) | 699.34 (0) | 4.52 | 1.12 |
| 23 | 8 | 73.08 | 1.75 | 0 | 639.61 | 650.25 (−1.66) | 639.61 (0) | 4.56 | 1.00 |
| 24 | 8 | 73.08 | 1.75 | 6 | 618.54 | 638.71 (−3.26) | 618.54 (0) | 4.64 | 1.22 |
| 25 | 8 | 73.08 | 1.75 | 3 | 611.25 | 608.99 (0.37) | 608.99 (0.37) | 4.58 | 1.11 |
| 26 | 8 | 73.08 | 1.75 | 3 | 585.35 | 608.99 (−4.04) | 608.99 (−4.04) | 4.63 | 1.18 |
| 27 | 8 | 73.08 | 1.75 | 3 | 599.66 | 608.99 (−1.56) | 608.99 (−1.56) | 4.61 | 1.14 |
| 28 | 8 | 73.08 | 1.75 | 3 | 624.06 | 608.99 (2.41) | 608.99 (2.41) | 4.56 | 1.12 |
| 29 | 8 | 73.08 | 1.75 | 3 | 609.59 | 608.99 (0.10) | 608.99 (0.10) | 4.62 | 1.20 |
| 30 | 8 | 73.08 | 1.75 | 3 | 624.01 | 608.99 (2.41) | 608.99 (2.41) | 4.57 | 1.10 |
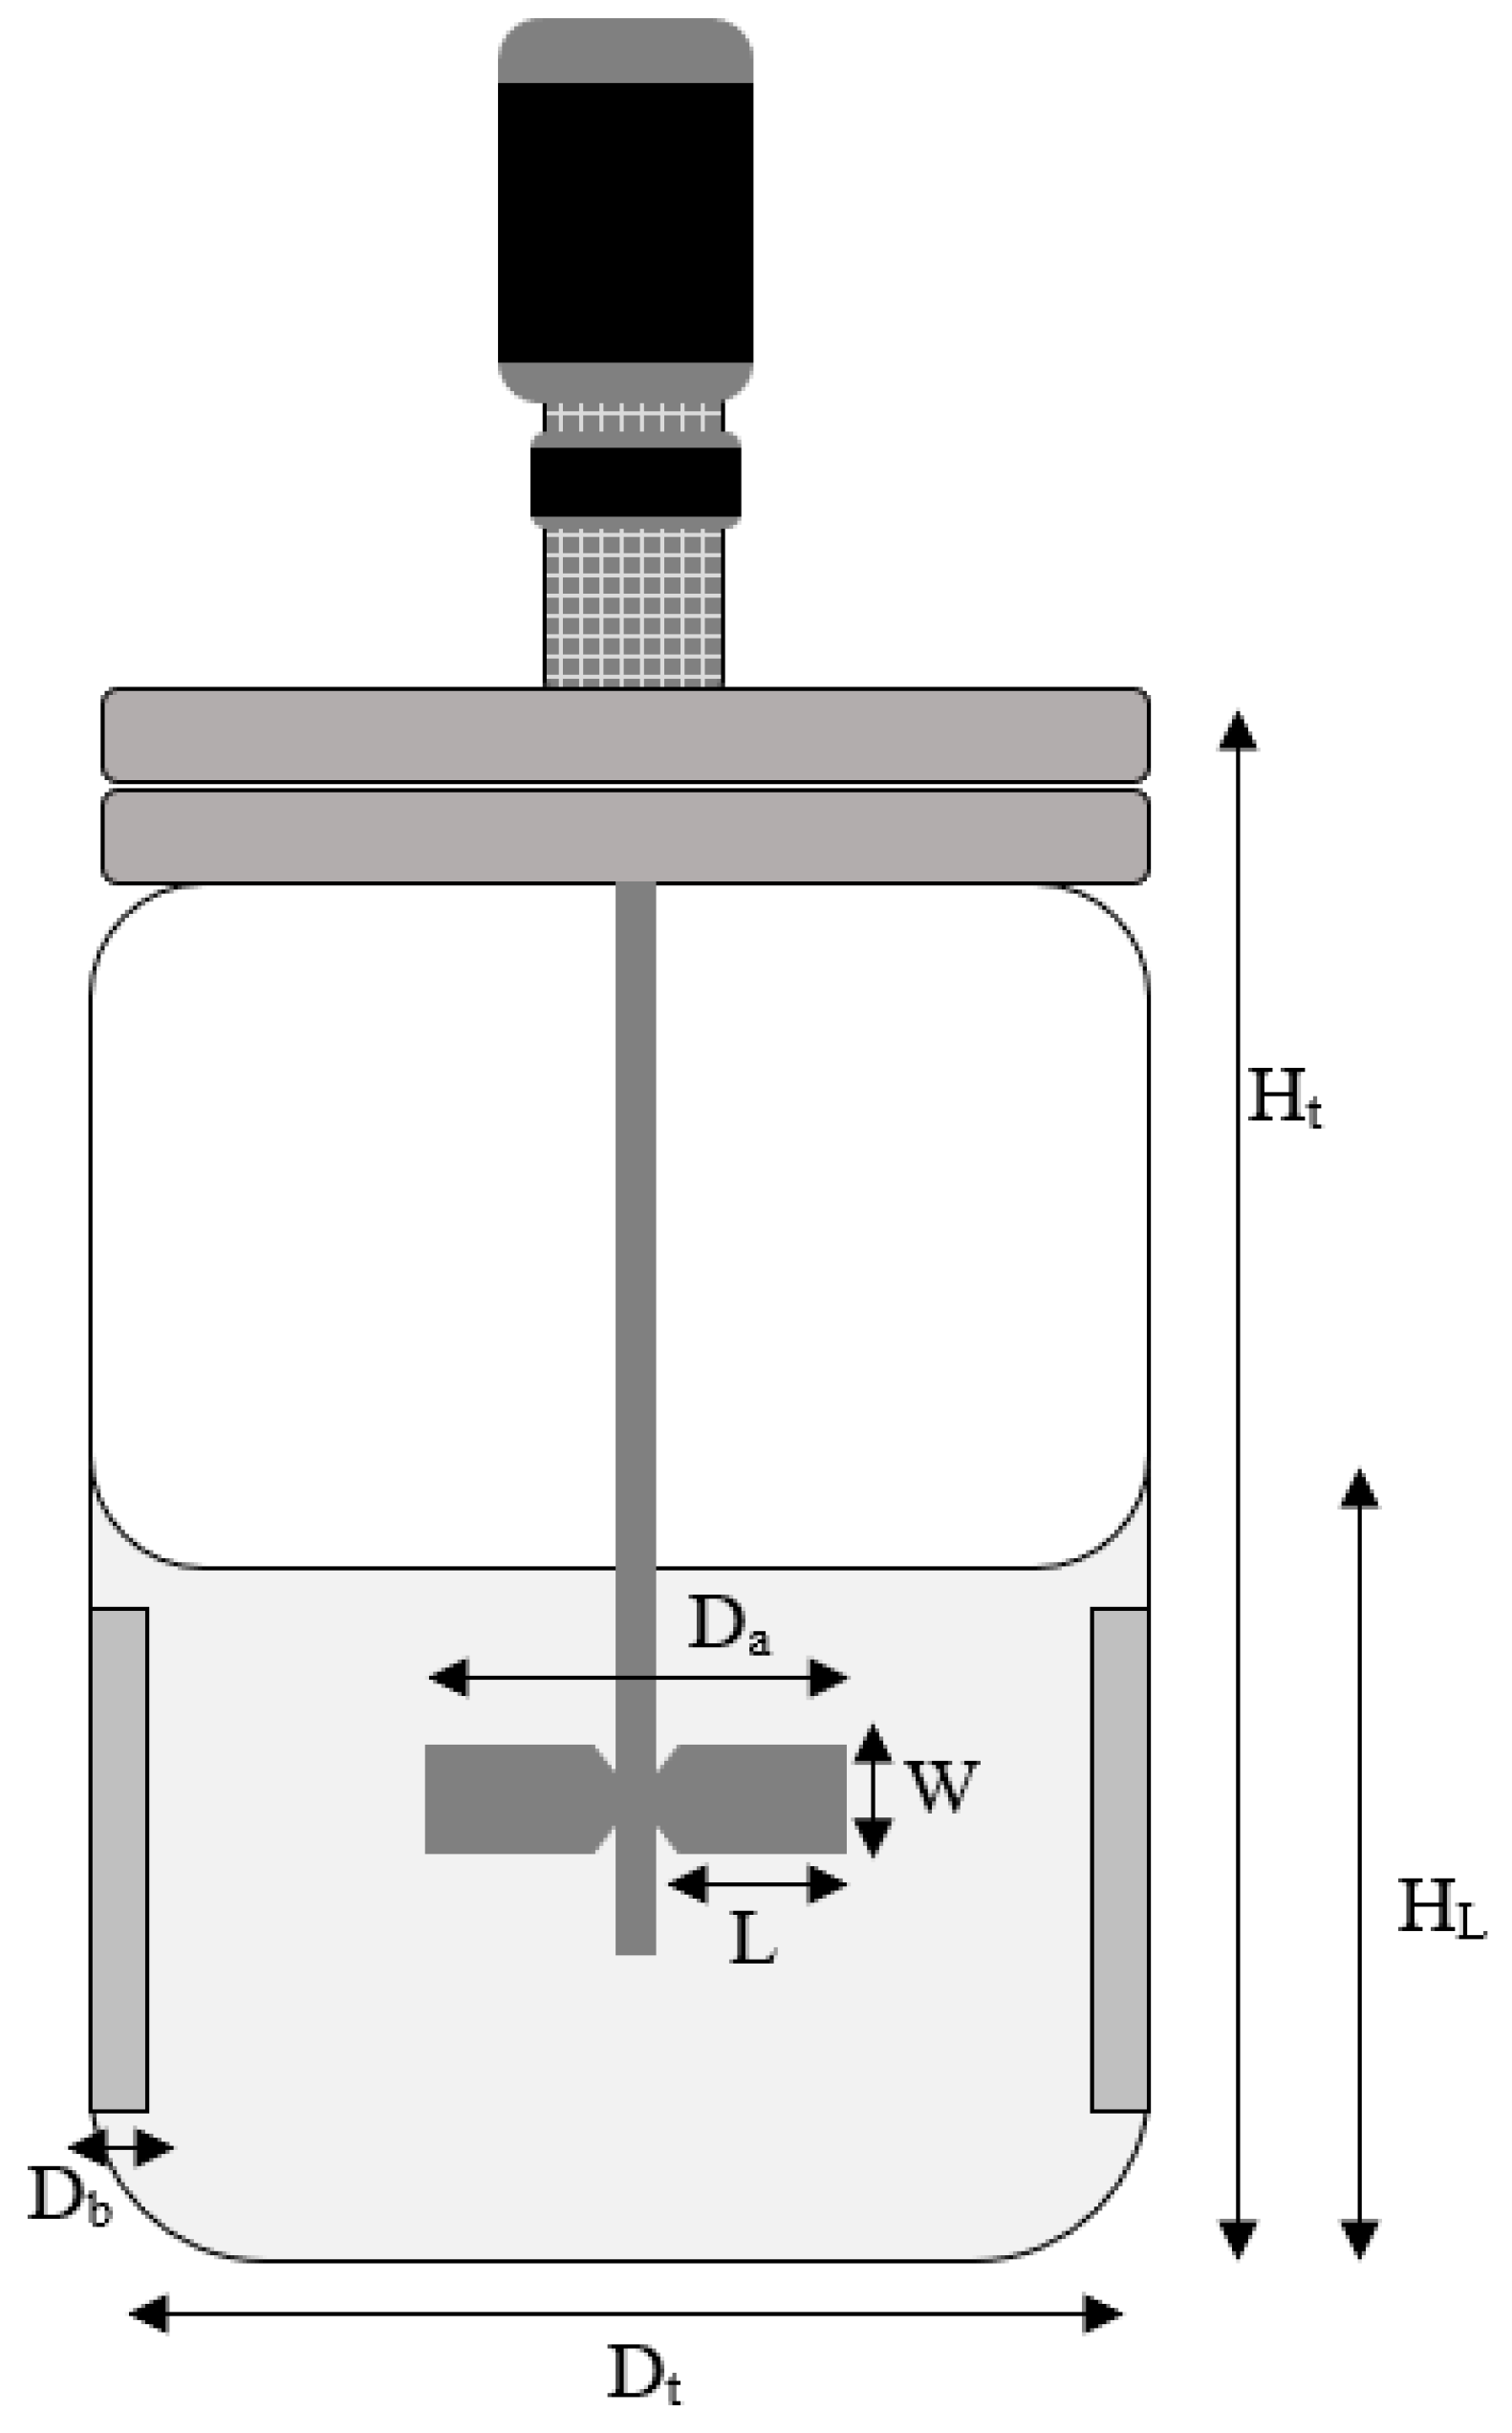
| Parameters | Measurement |
|---|---|
| High of liquid (HL) | 8.5 cm (for 1 L volume) |
| High of bioreactor (Ht) | 27.4 cm |
| Diameter of tank (Dt) | 13 cm |
| Diameter of impeller (Da) | 52.96 mm |
| Diameter of baffles (Db) | 9.94 m |
| Impeller blade height (W) | 10.55 mm |
| Impeller blade width (L) | 13.90 mm |
| Number of impellers | 2 |
| Impeller type | Ruston turbine |
| Ingredients (g/L) | Time PmX (h) | pH | Maximum BLIS Activity PmX (AU/mL) | Maximum Cell XmX (g/L) | Specific Growth Rate μmax (h−1) | ||
|---|---|---|---|---|---|---|---|
| Initial | Final | ||||||
| BHI | 2 | 7.10 | 6.28 | 462.88 ± 1.08 f | 0.28 ± 0.004 f | 0.07 ± 0.001 j | |
| Fructose | 1 | 6 | 6.71 | 5.29 | 542.95 ± 1.14 e | 0.50 ± 0.002 d | 0.12 ± 0.000 f |
| 2 | 6 | 6.72 | 4.94 | 567.28 ± 5.78 d | 0.52 ± 0.004 cd | 0.11 ± 0.002 g | |
| 4 | 8 | 6.70 | 4.45 | 595.70 ± 6.75 b | 0.54 ± 0.004 bc | 0.13 ± 0.001 e | |
| Soytone | 17.69 | 8 | 6.85 | 4.86 | 542.16 ± 2.76 e | 0.32 ± 0.002 e | 0.09 ± 0.000 h |
| 35.38 | 6 | 6.77 | 4.89 | 583.69 ± 5.83 c | 0.53 ± 0.047 cd | 0.15 ± 0.002 c | |
| 53.07 | 6 | 6.69 | 4.94 | 620.35 ± 1.19 a | 0.69 ± 0.005 a | 0.16 ± 0.005 b | |
| NaCl | 2.5 | 6 | 6.83 | 4.97 | 603.62 ± 5.41 b | 0.56 ± 0.005 b | 0.08 ± 0.002 i |
| 5.0 | 8 | 6.77 | 4.89 | 557.50 ± 5.74 d | 0.56 ± 0.002 b | 0.12 ± 0.003 f | |
| 7.5 | 8 | 6.72 | 4.87 | 541.42 ± 4.40 e | 0.54 ± 0.002 bc | 0.14 ± 0.001 d | |
| Na2HPO4 | 1.5 | 8 | 6.67 | 4.67 | 559.13 ± 3.45 d | 0.52 ± 0.002 cd | 0.09 ± 0.000 h |
| 3.0 | 8 | 6.79 | 5.04 | 560.75 ± 3.45 d | 0.56 ± 0.002 b | 0.12 ± 0.002 f | |
| 4.5 | 8 | 6.87 | 5.46 | 540.54 ± 6.82 d | 0.56 ± 0.004 b | 0.20 ± 0.001 a | |
| Ingredients | F = 0.380 (NS) | F = 0.156 (NS) | F = 0.713 (NS) | ||||
| Concentrations | F = 0.147 (NS) | F = 1.457 (NS) | F = 6.82 (S *) | ||||
| Interaction: Ingredients x concentrations | F = 94.12 (S **) | F = 81.84 (S **) | F = 273.46 (S **) | ||||
| Source | Sum of Squares | DF | Mean Square | F Value | Prob > F | |
|---|---|---|---|---|---|---|
| Model | 42,814.01 | 14 | 3058.14 | 4.17 | 0.0047 | Significant |
| A (Fructose) | 40.04 | 1 | 40.04 | 0.055 | 0.8184 | |
| B (Soytone) | 22,433.05 | 1 | 22,433.05 | 30.60 | <0.0001 | Significant |
| C (NaCl) | 877.33 | 1 | 877.33 | 1.20 | 0.2912 | |
| D (Na2HPO4) | 199.48 | 1 | 199.48 | 0.27 | 0.6096 | |
| A2 | 92.63 | 1 | 92.63 | 0.13 | 0.7272 | |
| B2 | 46.85 | 1 | 46.85 | 0.064 | 0.8039 | |
| C2 | 10,566.63 | 1 | 10,566.63 | 14.41 | 0.0018 | Significant |
| D2 | 2159.60 | 1 | 2159.60 | 2.95 | 0.1067 | |
| AB | 1441.91 | 1 | 1441.91 | 1.97 | 0.1812 | |
| AC | 685.88 | 1 | 685.88 | 0.94 | 0.3488 | |
| AD | 261.35 | 1 | 261.35 | 0.36 | 0.5594 | |
| BC | 902.62 | 1 | 902.62 | 1.23 | 0.2847 | |
| BD | 4124.02 | 1 | 4124.02 | 5.63 | 0.0315 | Significant |
| CD | 42.94 | 1 | 42.94 | 0.059 | 0.8120 | |
| Residual | 10,997.36 | 15 | 733.16 | |||
| Lack of Fit | 9893.29 | 10 | 989.33 | 4.48 | 0.0558 | Not significant |
| Pure Error | 1104.07 | 5 | 220.81 | |||
| Cor Total | 53,811.37 | 29 |
| Fermentation Performance | Optimal Media Formulation (g/L) | Commercial BHI Medium (g/L) | |
|---|---|---|---|
| RSM | ANN | ||
| Soytone | 107.63 | 35.38 | 27.5 |
| Fructose | 4.0 | 16.0 | 2.0 |
| NaCl | 2.50 | 3.25 | 5.0 |
| Na2HPO4 | 1.50 | 5.40 | 2.5 |
| Predicted BLIS activity (AU/mL) | 711.14 | 717.91 | - |
| Actual BLIS activity (AU/mL) Verification experiment (% diff) | 695.96 ± 2.48 (2.13) | 717.13 ± 0.76 (0.1) | 520.56 ± 3.37 |
| MAE | 15.44 | 2.20 | |
| RMSE | 27.08 | 26.02 | |
| R2 | 0.79 | 0.98 | |
| Scale/Media | TimePmX (h) | Maximum BLIS Activity PmX (AU/mL) | Maximum Cell Concentration XmX (g/L) | Specific Growth Rate μmX (h−1) |
|---|---|---|---|---|
| Stirred tank bioreactor/Optimised (FST medium) | 6 | 787.40 ± 1.30 | 0.87 ± 0.00 | 0.17 |
| Stirred tank bioreactor/Unoptimized (BHI medium) | 8 | 580.45 ± 19.79 | 0.43 ± 0.05 | 1.09 |
| Shake flask/Optimised (FST medium) | 12 | 665.28 ± 14.22 | 1.22 ± 0.061 | 0.10 |
| Kinetic Parameter Value | Impeller Speed (rpm) | ||||
|---|---|---|---|---|---|
| 100 | 200 | 400 | 600 | 800 | |
| BLIS production: | |||||
| PmX (AU/mL); maximum BLIS activity | 772.87 ± 6.55 b | 787.40 ± 1.30 ab | 792.91 ± 3.90 a | 688.11 ± 12.34 c | 543.76 ± 6.83 d |
| YBLIS/X (AU/g cells); cells productivity | 790.53 ± 6.70 c | 966.21 ± 1.59 a | 837.58 ± 4.12 b | 694.65 ± 12.46 d | 523.02 ± 6.57 e |
| qp (AU/g/h); BLIS production rate | 287.24 ± 7.98 a | 95.76 ± 7.43 ab | 200.76 ± 3.76 ab | 214.49 ± 65.72 ab | 17.74 ± 13.42 b |
| Cells: | |||||
| XmX (g/L); maximum dry cell weight | 1.01 ± 0.004 b | 0.87 ± 0.002 d | 0.96 ± 0.005 c | 1.01 ± 0.002 b | 1.12 ± 0.002 a |
| Substrate consumption: | |||||
| 1. Fructose: | |||||
| SmX (g/L); total fructose consumed | 9.00 ± 0.14 b | 7.53 ± 0.04 e | 8.69 ± 0.13 c | 11.95 ± 0.07 a | 7.99 ± 0.01 d |
| YBLISS/S (AU/g fructose); BLIS yield | 87.12 ± 8.55 a | 72.60 ± 14.33 b | 87.54 ± 7.42 a | 70.17 ± 14.91 c | 59.38 ± 0.75 d |
| YX/S (g cells/g fructose); cells mass yield | 0.12 ± 0.00 b | 0.10 ± 0.00 e | 0.13 ± 0.00 a | 0.11 ± 0.00 d | 0.11 ± 0.00 c |
| qs (g/g/h); fructose consumption rate | 0.34 ± 0.00 b | 0.23 ± 0.01 c | 0.09 ± 0.05 d | 0.58 ± 0.05 a | 0.33 ± 0.02 b |
| 2. Nitrogen | |||||
| SmX (g/L); total nitrogen consumed | 0.25 ± 0.07 ab | 0.15 ± 0.07 bc | 0.13 ± 0.04 bc | 0.08 ± 0.04 c | 0.35 ± 0.07 a |
| YBLISS/S (AU/g nitrogen); BLIS yield | 230.88 ± 1.94 b | 222.49 ± 0.38 bc | 251.34 ± 0.83 a | 208.58 ± 13.60 c | 178.28 ± 2.24 d |
| YX/S (g cells/g nitrogen); cells mass yield | 0.29 ± 0.00 c | 0.24 ± 0.00 d | 0.31 ± 0.00 b | 0.30 ± 0.00 b | 0.36 ± 0.00 a |
| qs (g/g/h); nitrogen consumption rate | 0.03 ± 0.04 a | 0.03 ± 0.04 a | 0.03 ± 0.04 a | 0.03 ± 0.04 a | 0.02 ± 0.03 a |
| Production of lactic acid | |||||
| LAmX (g/L); lactic acid formed | 2.44 ± 0.02 ab | 2.13 ± 0.11 c | 2.30 ± 0.07 bc | 2.49 ± 0.02 ab | 2.59 ± 0.15 a |
| Growth | |||||
| µmX (h−1) | 0.34 ± 0.008 a | 0.17 ± 0.002 d | 0.29 ± 0.002 c | 0.30 ± 0.001 b | 0.29 ± 0.001 c |
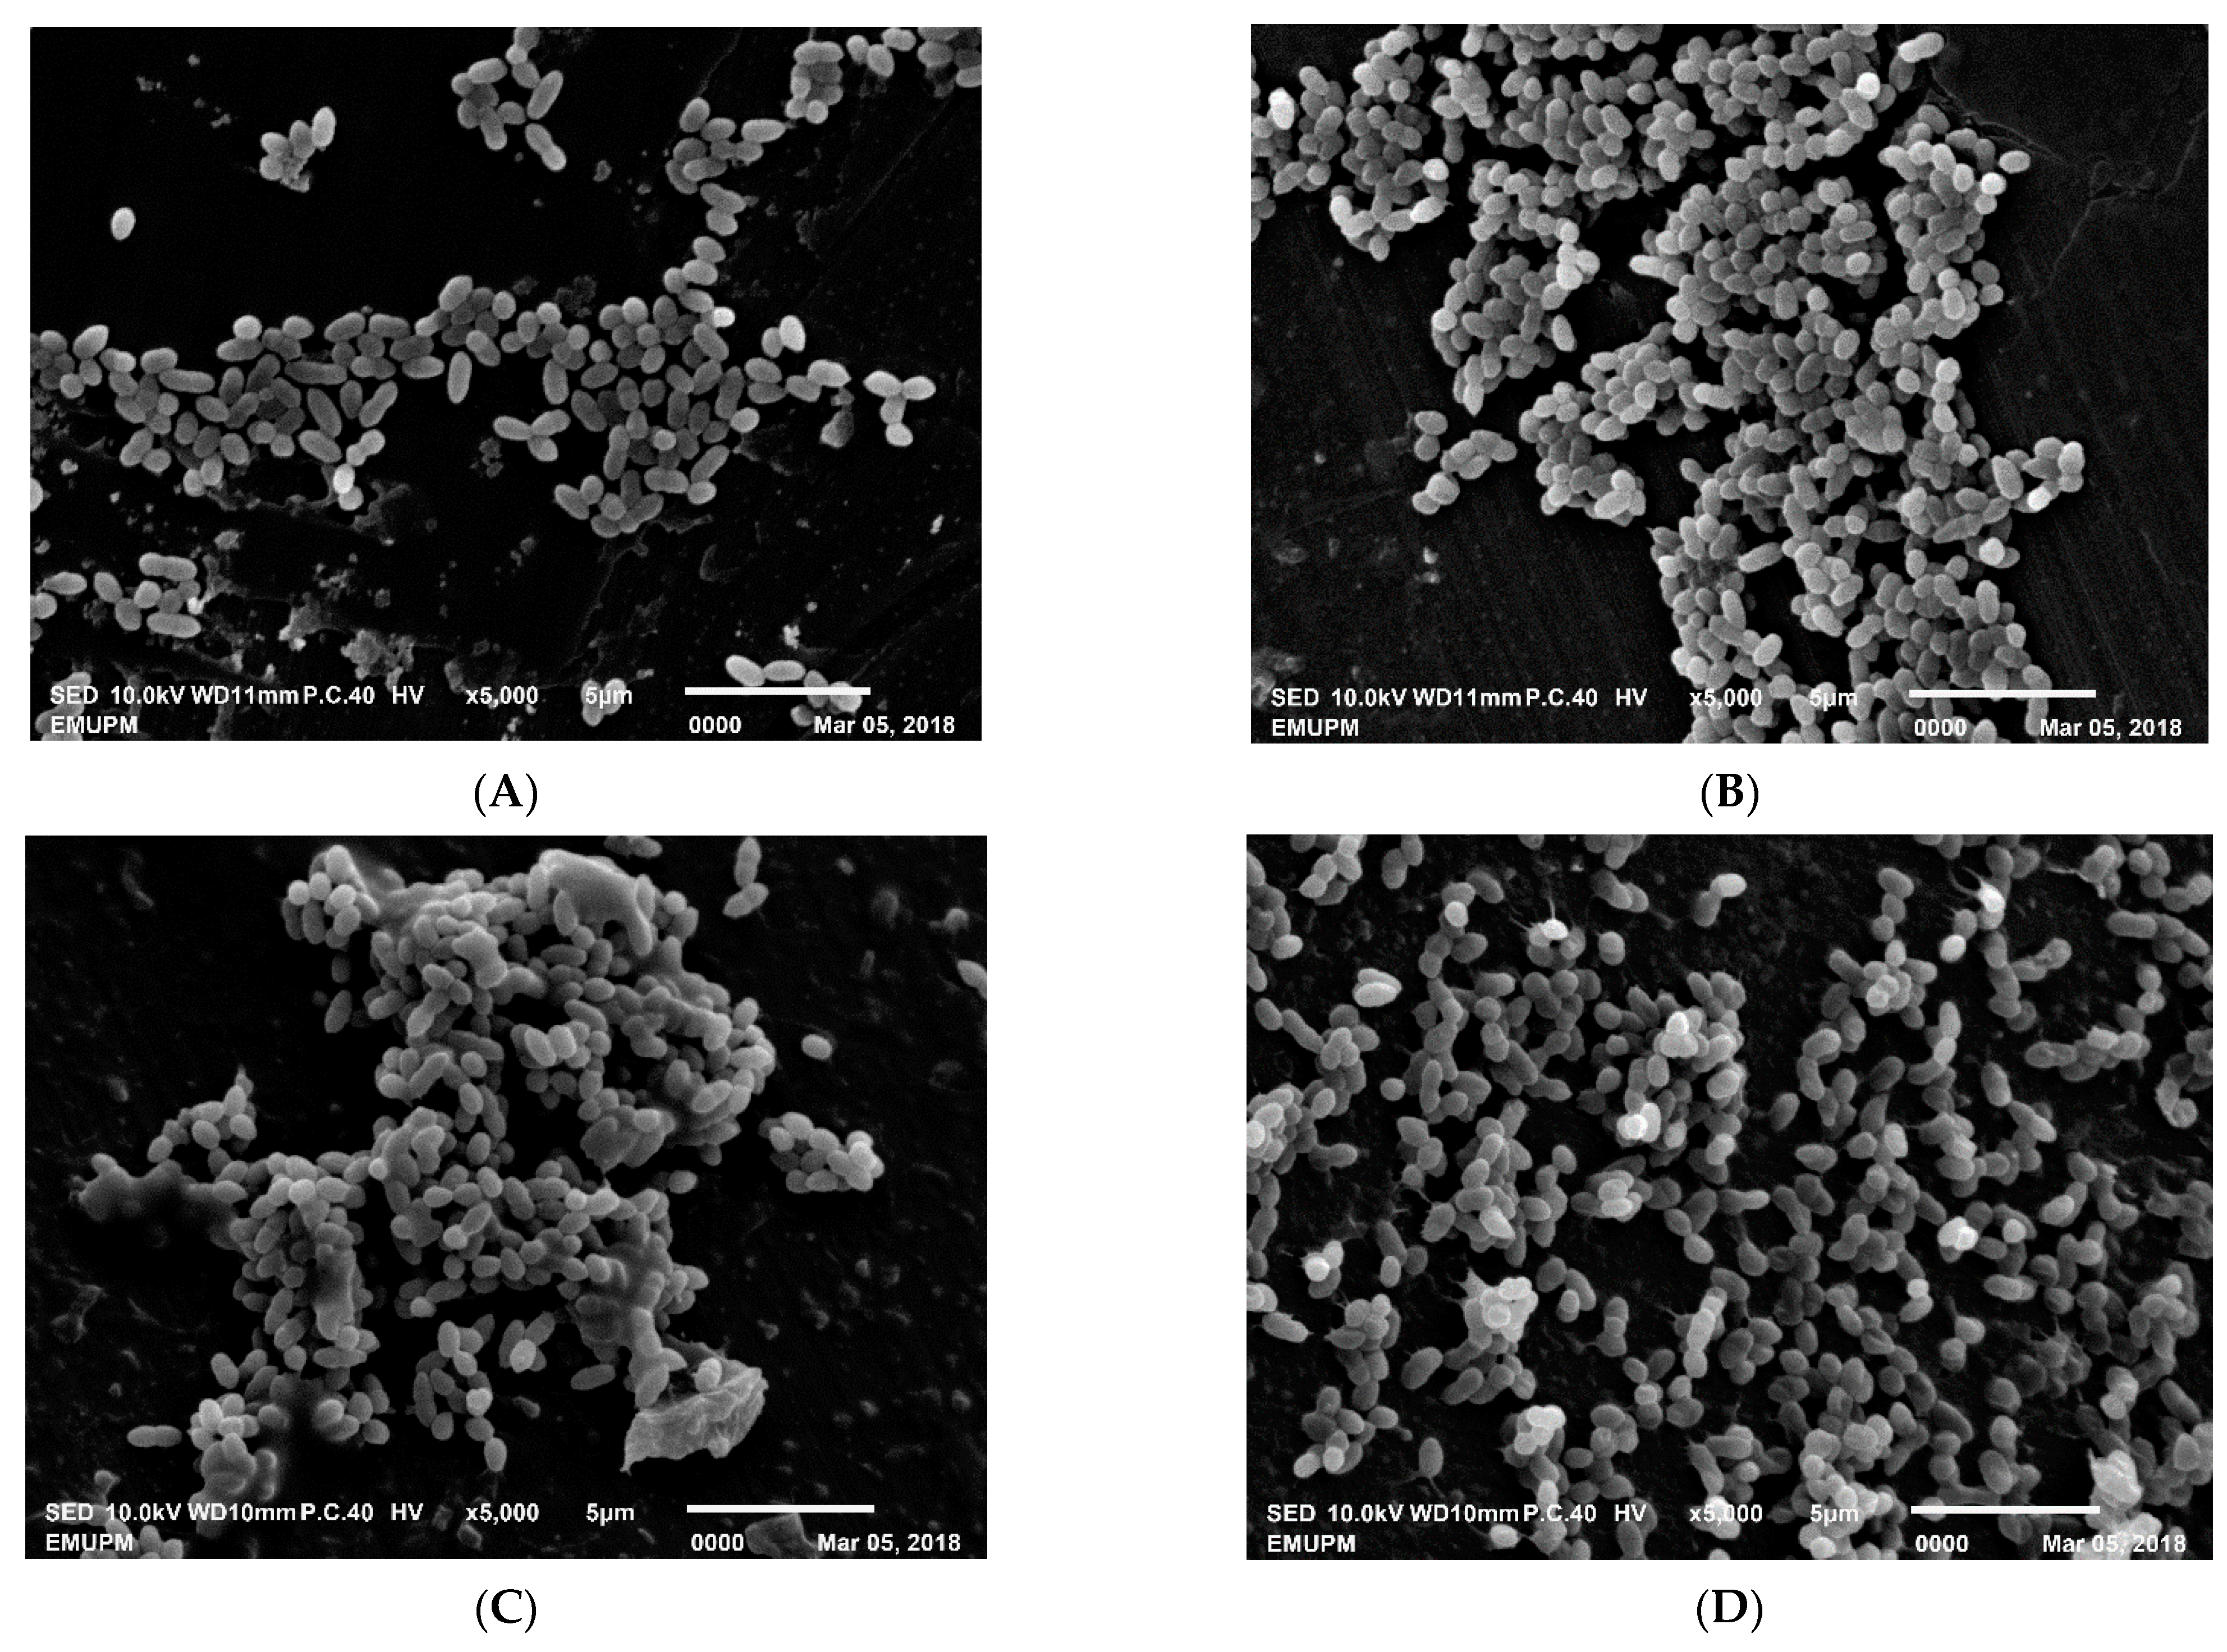
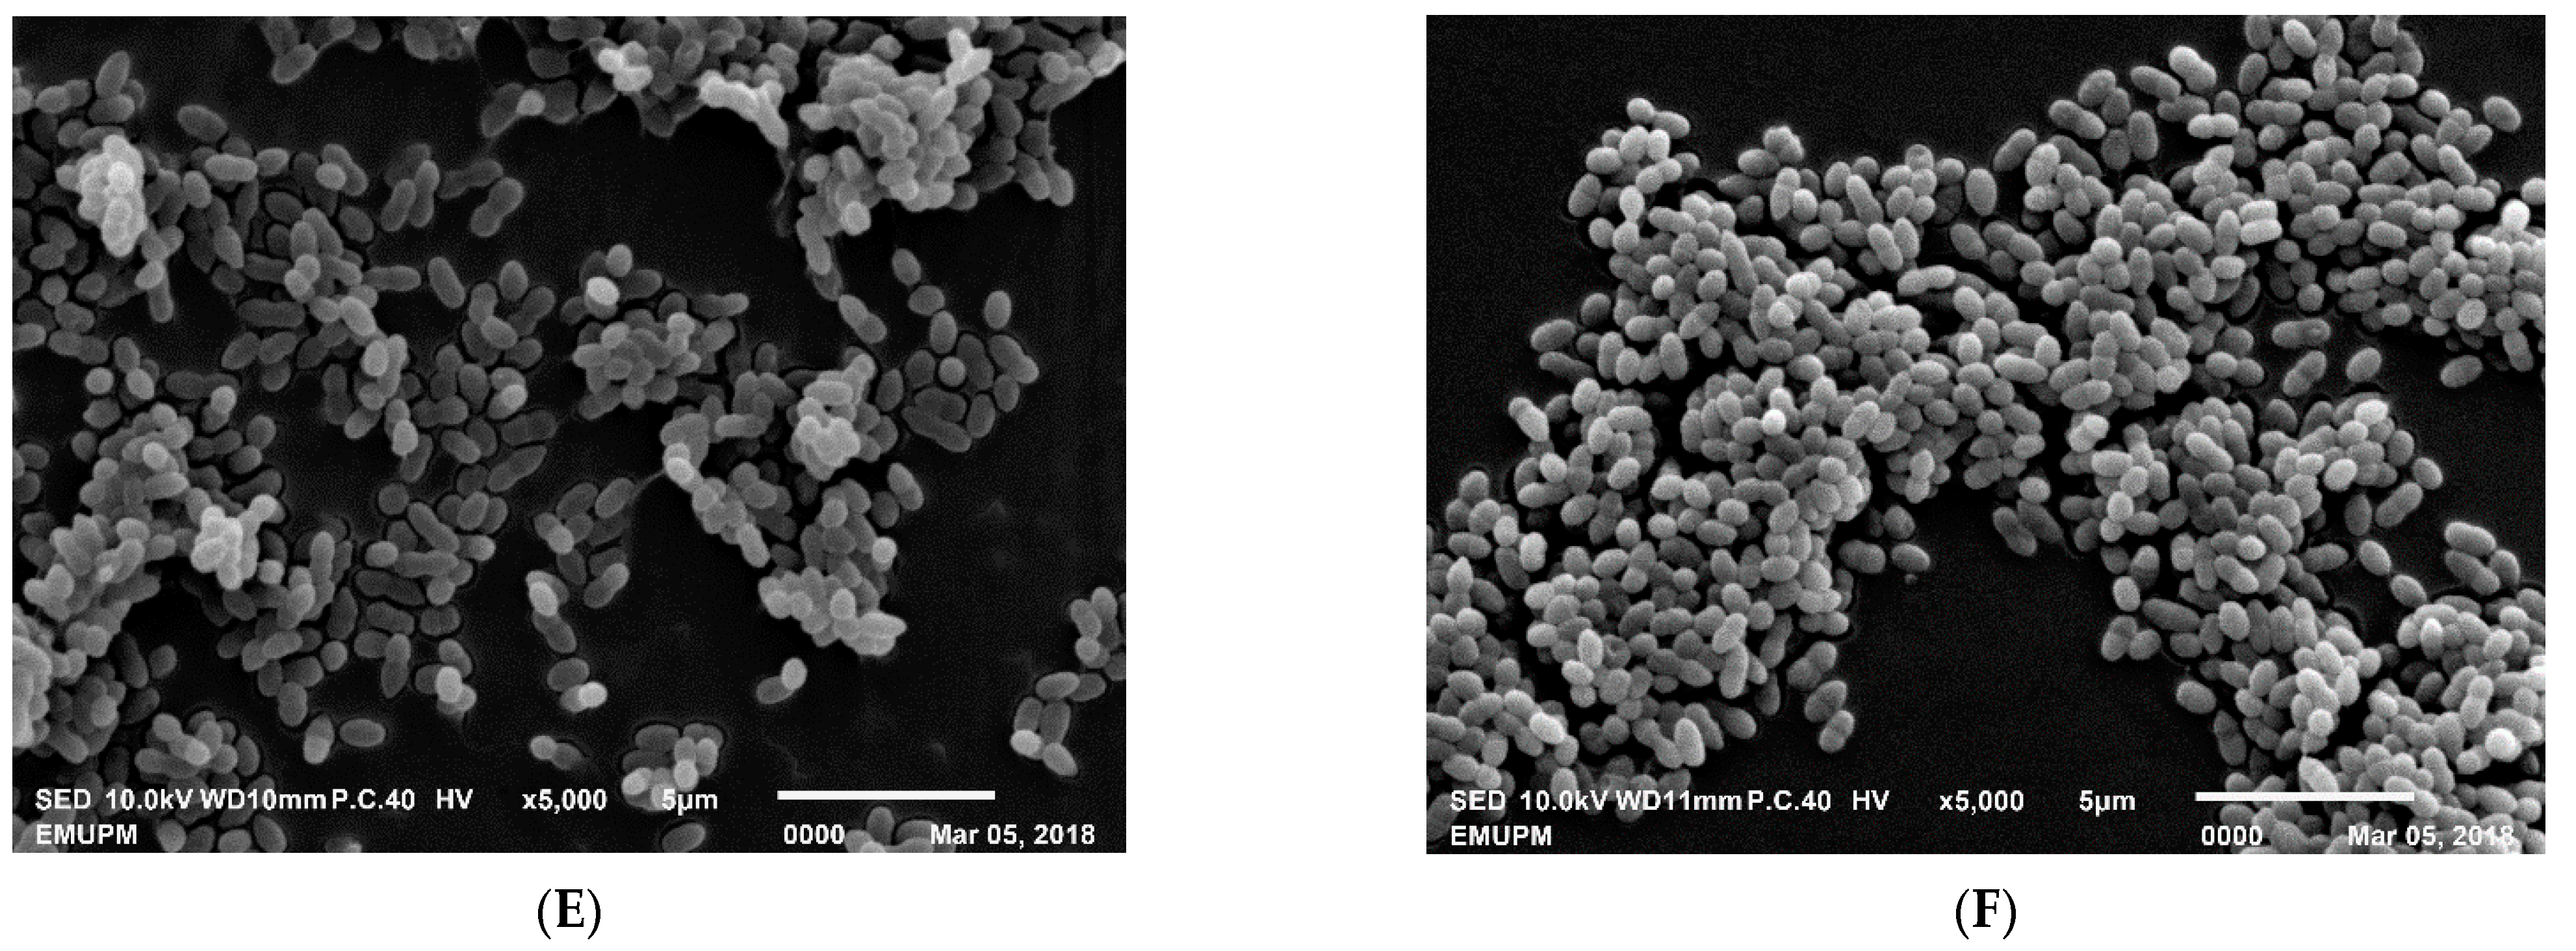
| Agitation Speed (rpm) | Size (µm) | |
|---|---|---|
| Length (±SD) | Width (±SD) | |
| Control (fresh cells) | 1.10 ± 0.09 ab | 0.66 ± 0.04 a |
| 100 | 0.91 ± 0.07 c | 0.54 ± 0.06 bc |
| 200 | 1.06 ± 0.10 bc | 0.58 ± 0.03 b |
| 400 | 1.08 ± 0.20 bc | 0.51 ± 0.01 c |
| 600 | 1.26 ± 0.05 a | 0.53 ± 0.02 bc |
| 800 | 1.09 ± 0.06 ab | 0.53 ± 0.01 bc |
Publisher’s Note: MDPI stays neutral with regard to jurisdictional claims in published maps and institutional affiliations. |
© 2021 by the authors. Licensee MDPI, Basel, Switzerland. This article is an open access article distributed under the terms and conditions of the Creative Commons Attribution (CC BY) license (http://creativecommons.org/licenses/by/4.0/).
Share and Cite
Jawan, R.; Abbasiliasi, S.; Tan, J.S.; Kapri, M.R.; Mustafa, S.; Halim, M.; Ariff, A.B. Evaluation of the Estimation Capability of Response Surface Methodology and Artificial Neural Network for the Optimization of Bacteriocin-Like Inhibitory Substances Production by Lactococcus lactis Gh1. Microorganisms 2021, 9, 579. https://doi.org/10.3390/microorganisms9030579
Jawan R, Abbasiliasi S, Tan JS, Kapri MR, Mustafa S, Halim M, Ariff AB. Evaluation of the Estimation Capability of Response Surface Methodology and Artificial Neural Network for the Optimization of Bacteriocin-Like Inhibitory Substances Production by Lactococcus lactis Gh1. Microorganisms. 2021; 9(3):579. https://doi.org/10.3390/microorganisms9030579
Chicago/Turabian StyleJawan, Roslina, Sahar Abbasiliasi, Joo Shun Tan, Mohd Rizal Kapri, Shuhaimi Mustafa, Murni Halim, and Arbakariya B. Ariff. 2021. "Evaluation of the Estimation Capability of Response Surface Methodology and Artificial Neural Network for the Optimization of Bacteriocin-Like Inhibitory Substances Production by Lactococcus lactis Gh1" Microorganisms 9, no. 3: 579. https://doi.org/10.3390/microorganisms9030579
APA StyleJawan, R., Abbasiliasi, S., Tan, J. S., Kapri, M. R., Mustafa, S., Halim, M., & Ariff, A. B. (2021). Evaluation of the Estimation Capability of Response Surface Methodology and Artificial Neural Network for the Optimization of Bacteriocin-Like Inhibitory Substances Production by Lactococcus lactis Gh1. Microorganisms, 9(3), 579. https://doi.org/10.3390/microorganisms9030579