Article

Lowering pO2 Interacts with Photoperiod to Alter Physiological Performance of the Coastal Diatom Thalassiosira pseudonana

1
Institute of Marine Science and Technology, Shandong University, Qingdao 266237, China
2
Joint Laboratory for Ocean Research and Education of Dalhousie University, Shandong University and Xiamen University, Qingdao 266237, China
3
Marine Environmental Monitoring Centre of Ningbo, East China Sea Bureau of Ministry of Natural Resources, Ningbo 315016, China
4
Key Laboratory of Tropical Marine Bio-Resources and Ecology, South China Sea Institute of Oceanology, Chinese Academy of Sciences, Guangzhou 510530, China
*
Author to whom correspondence should be addressed.
Microorganisms 2021, 9(12), 2541; https://doi.org/10.3390/microorganisms9122541
Submission received: 10 November 2021 / Revised: 30 November 2021 / Accepted: 3 December 2021 / Published: 9 December 2021

Abstract

:
Exacerbating deoxygenation is extensively affecting marine organisms, with no exception for phytoplankton. To probe these effects, we comparably explored the growth, cell compositions, photosynthesis, and transcriptome of a diatom Thalassiosira pseudonana under a matrix of pO2 levels and Light:Dark cycles at an optimal growth light. The growth rate (μ) of T. pseudonana under a 8:16 L:D cycle was enhanced by 34% by low pO2 but reduced by 22% by hypoxia. Under a 16:8 L:D cycle, however, the μ decreased with decreasing pO2 level. The cellular Chl a content decreased with decreasing pO2 under a 8:16 L:D cycle, whereas the protein content decreased under a 16:8 L:D cycle. The prolonged photoperiod reduced the Chl a but enhanced the protein contents. The lowered pO2 reduced the maximal PSII photochemical quantum yield (FV/FM), photosynthetic oxygen evolution rate (Pn), and respiration rate (Rd) under the 8:16 or 16:8 L:D cycles. Cellular malondialdehyde (MDA) content and superoxide dismutase (SOD) activity were higher under low pO2 than ambient pO2 or hypoxia. Moreover, the prolonged photoperiod reduced the FV/FM and Pn among all three pO2 levels but enhanced the Rd, MDA, and SOD activity. Transcriptome data showed that most of 26 differentially expressed genes (DEGs) that mainly relate to photosynthesis, respiration, and metabolism were down-regulated by hypoxia, with varying expression degrees between the 8:16 and 16:8 L:D cycles. In addition, our results demonstrated that the positive or negative effect of lowering pO2 upon the growth of diatoms depends on the pO2 level and is mediated by the photoperiod.

1. Introduction

Anthropogenic marine eutrophication and warming are exacerbating the deoxygenation in the water column through, for example, unbalancing O2 production and consumption, lowering O2 solubility, and hindering the exchange with atmospheric O2 [1,2]. Over the past five decades, the global oceans have had an estimated loss of ~2% of their oxygen [3]; the degree and area of O2-deficiency or O2-limitation have extended quickly [1,4]. At present, the number of hypoxia zones (dissolved oxygen, DO < 2.5 mg L−1, ~25% saturation) have exceeded 500 worldwide, with the hypoxic area reaching over 1,000,000 km2 [4]. Dissolved O2 in seawater is important in marine ecosystems as the water must contain sufficient O2 to maintain aquatic biota. The reduced available O2 is known to threaten the health and lives of marine aerobic organisms that dwell in water or sediments, such as fish, shrimp, and shellfish, etc. [4,5]. Apart from affecting these aerobic organisms, the lowered available O2 also influences the photosynthetically O2 producing organisms [6,7,8], as these O2 producers, including phytoplankton, need surrounding O2 to maintain mitochondrial respiration under the limited-light or dark conditions, which can supply energy for cell growth and division [6] and even for survival [9]. Under sufficient light status, the produced O2 can compete with CO2 for the binding site of ribulose-1,5-bisphosphate carboxylase/oxygenase (RubisCO), which can bidirectionally catalyze the CO2 carboxylation in photosynthesis and O2 oxygenation in photorespiration [10]. The energy-costly CO2-concentrating mechanisms (CCMs) that are maintained in diatoms may improve the binding efficiency of CO2 over O2, through elevating the CO2 level around the binding site and tempering the unbalance between photosynthesis and photorespiration [11,12]. The decreased O2 may thus mechanically push the RubisCO-catalyzed biochemical reaction towards photosynthesis and increase the net primary production through suppressing photorespiration [13], although a case study showed that the lowered O2 reduced the growth of the diatom Skeletonema costatum [6].
In nature, phytoplankton live as deep as 200 m (euphotic zone) of the water column in the oceans and evolve various strategies to exist therein through, e.g., chain-forming and setae-own [14]. They can also be exposed occasionally or constantly to low O2 and even hypoxia that often vertically expands from thousands of meters to a few meters of seawater column [15]. The low O2/hypoxia phenomena even expands to shallower than 5 m in the Pearl River estuary [16] or less than 30 m in the Changjiang River estuary [17]. In these areas, phytoplankton cells usually vertically live from surface to deeper than 50 m depth [16,17]; they even live as deep as 150 m in the Arabia Sea, where the O2-deficient zone can expand to shallower than 50 m [15]. This means that most of phytoplankton cells in hypoxic areas experience a low O2/hypoxia status. Previous studies showed that lowered pO2 positively enhanced the growth of diatom Thalassiosira pseudonana [18] or Chlorophyta Chlorella spp. [19] and Chlamydomonas reinhardtii [20], while other studies showed that the lowered pO2 insignificantly affected the growth of C. reinhardtii [21] and even decreased the growth of diatom S. costatum [6], indicating the effects of lowering pO2 are still unclear. Other studies also referred to the survival of diatoms in anoxic conditions through using nitrate as an electron acceptor [22], as well as the contribution or function of the bloomed phytoplankton to the formation of hypoxic zones [23,24].
Dissolved O2 in seawater is one of the net products of phytoplankton if photosynthesis is over respiration under light status; while in the dark, this dissolved O2 is inversely consumed [25]. So, the duration of Light:Dark cycle (i.e., photoperiod), which often naturally varies with seasons or vertical mixings, may affect the physiological responses of phytoplankton to the surrounding O2 changes. Previously, the L:D cycle has been extensively observed to modulate cell growth and division, e.g., [26,27], as well as repair of photoinactivated PSII [28]. The L:D cycle interacting with light intensity or temperature has also been detected to alter cell compositions and antioxidant abilities in monospecies diatoms Phaeodactylum tricornutum [29], T. pseudonan, and T. punctigera [30,31], dinoflagellates Alexnadrium minutum and A. catenella [32,33], and Chlorella vulgaris [34], as well as in cell assemblies [35]. Nevertheless, it is unclear whether and, if so, how the L:D cycle interacts with reduced O2 to affect the physiology of phytoplankton.
Diatoms are important in marine ecosystems considering they account for ~20% of marine primary production [36] and sequester more carbon to the ocean’s interior with a fast sinking rate [14]. Diatoms are believed to dominate in global oceans, especially in estuarine or coastal waters where the lowered O2/hypoxia often occurs [2,4,16,23]. The genus Thalassiosira that appears in fresh-water, brackish, coastal, and oceanic environments are particular representatives [37]. Therefore, to explore the coupling effects of reduced O2 and photoperiod, we cultured a model diatom species T. pseudonana [38] under a matrix of pO2 level (ambient, 21% v/v; low pO2, 10%; and hypoxia, 3%) and Light:Dark cycle (L:D, 8:16 and L:D, 16:8) under an expected optimal growth instantaneous light intensity (150 μmol photons m−2 s−1) [30] and measured the growth, cell compositions, physiological performance, and transcriptome, which enabled us to answer how the lowered O2 interacts with the photoperiod to affect the coupling of growth and physiology of diatoms.

2. Materials and Methods

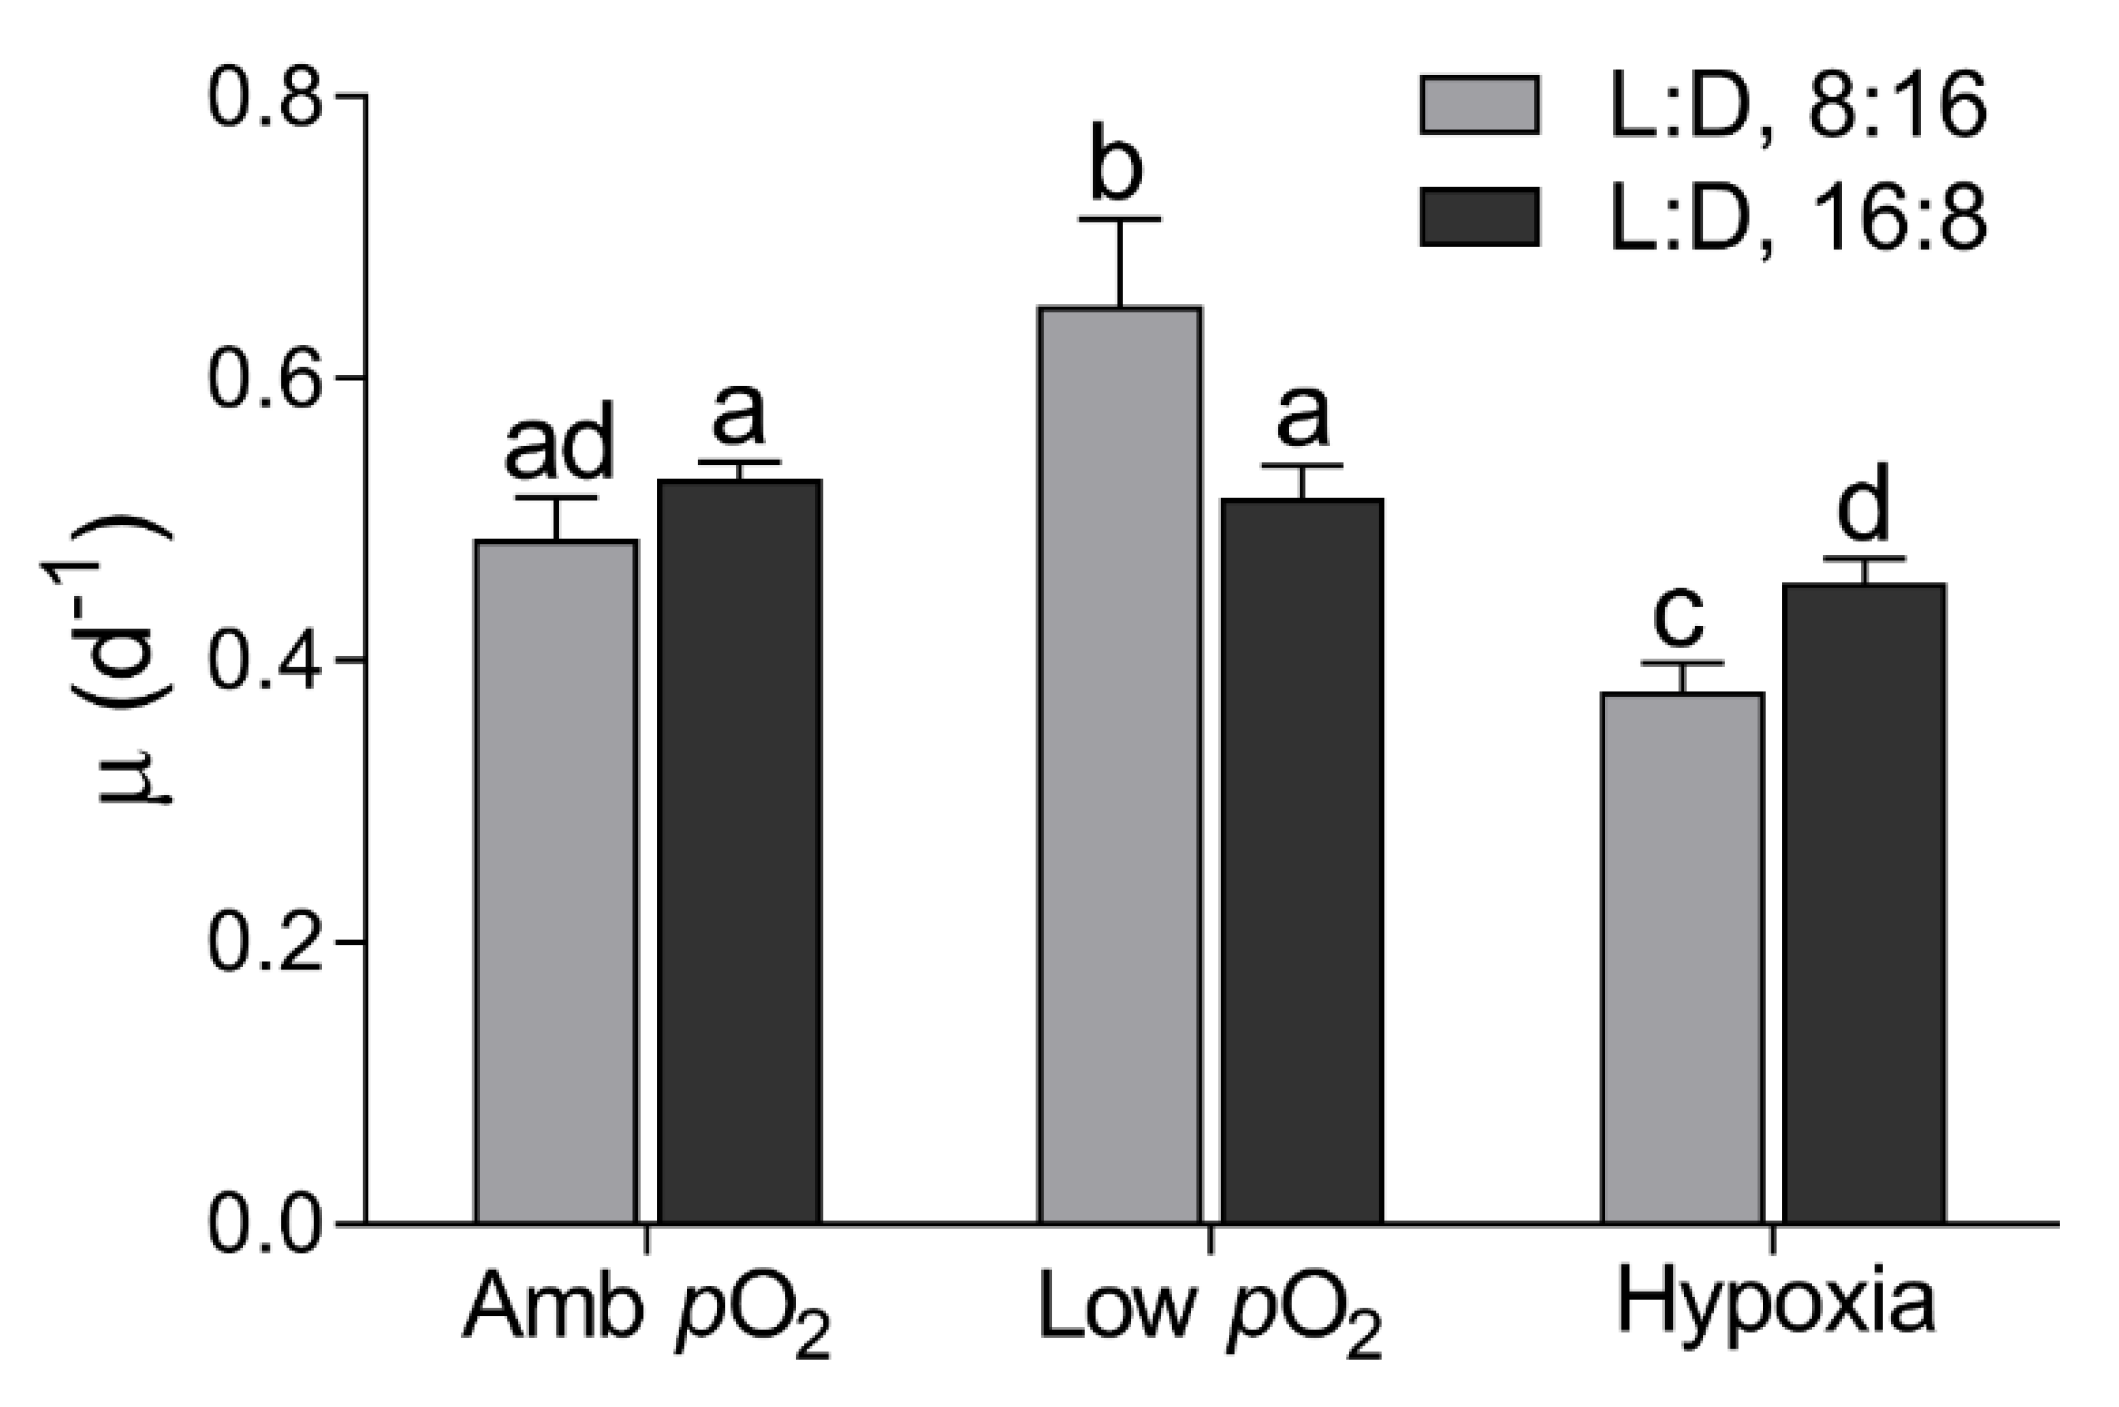
2.1. Culture Protocol and Growth Rate

A temperate marine centric diatom T. pseudonana (CCMP 1335), originally obtained from the Provasoli-Guillard National Center of Marine Phytoplankton (NCMP), was semi-continuously cultured with sterilized enriched artificial seawater (ESAW) in 500 mL conical flasks with 400 mL culture at 18 °C in an incubator (ZQZYCGF8, Shanghai, China). Light in the incubator was provided by a panel of LED (light-emitting diode) lamps and automatically turned on at 08:00 and turned off at 16:00 (8:16, Light:Dark cycle) or at 24:00 (16:8, L:D cycle). Light intensity was measured with a microspherical quantum sensor (QRT1, Hansatech, UK) in a culture flask filled with medium. Cultures were gently bubbled with the commercially prepared air (Qingdao Jinpeng Gas, China) with three pO2 levels [21% v/v (ambient pO2, Amb pO2), 10% v/v (Low pO2), and 3% v/v (Hypoxia)], which maintained the dissolved O2 (DO) in cultures at 310 ± 25, 150 ± 10, and 40 ± 7.5 μM, respectively. The DO concentration was monitored with an optode sensor controlled through Oxygen Logger software (OXR230, PyroScience Tech, Aachen, Germany). Before bubbling into cultures, the air streams filtered through a 0.2 µm microfilter were bubbled through another medium that was kept in the incubator, to eliminate the shock effects of varied pO2 and temperature during the medium replacement. No notable disruption of growth of T. pseudonana was detected by this bubbling when compared to no bubbling. In total, 18 separate semicontinuous cultures were grown under the combination (three replicates for each) of 3 pO2 levels and 2 photoperiods. Considering the seasonal photoperiod changes in temperate regions, we set the photoperiods at 8:16 and 16:8 L:D cycles, and we set the growth light at the approximately optimal intensity of 150 μmol photons m−2 s−1, according to [30,31].
The growth of T. pseudonana was estimated using chlorophyll a (Chl a) fluorescence with excitation of 440 nm and emission at 680 nm measured with a molecular device spectrofluorometer (CYT5M, BioTech, CA, USA) every morning (10:00 a.m., 2 h after lights on), before and after the dilutions with fresh medium. The Chl a in cultures was maintained at 0.86 ± 0.10 μg mL−1 during the cultivation period, and the specific growth rate (μ, d−1) was calculated as:
μ = [ln(N1) − ln(N0)]/(t1 − t0)
where N1 and N0 denote the OD680 value at time t1 and t0, respectively.
After the cultures went through over 9 generations, duplicate 5 mL cultures were taken at 10:00 a.m. from each flask after gently shaking and fixed with glutaraldehyde to a final concentration of 1%, for cell counting with an Accuri C6 flow cytometer (Becton-Dickinson, AZ, USA). After this, the aliquots of samples were taken for determination of cell compositions, physiological performance, and transcriptome as described below.

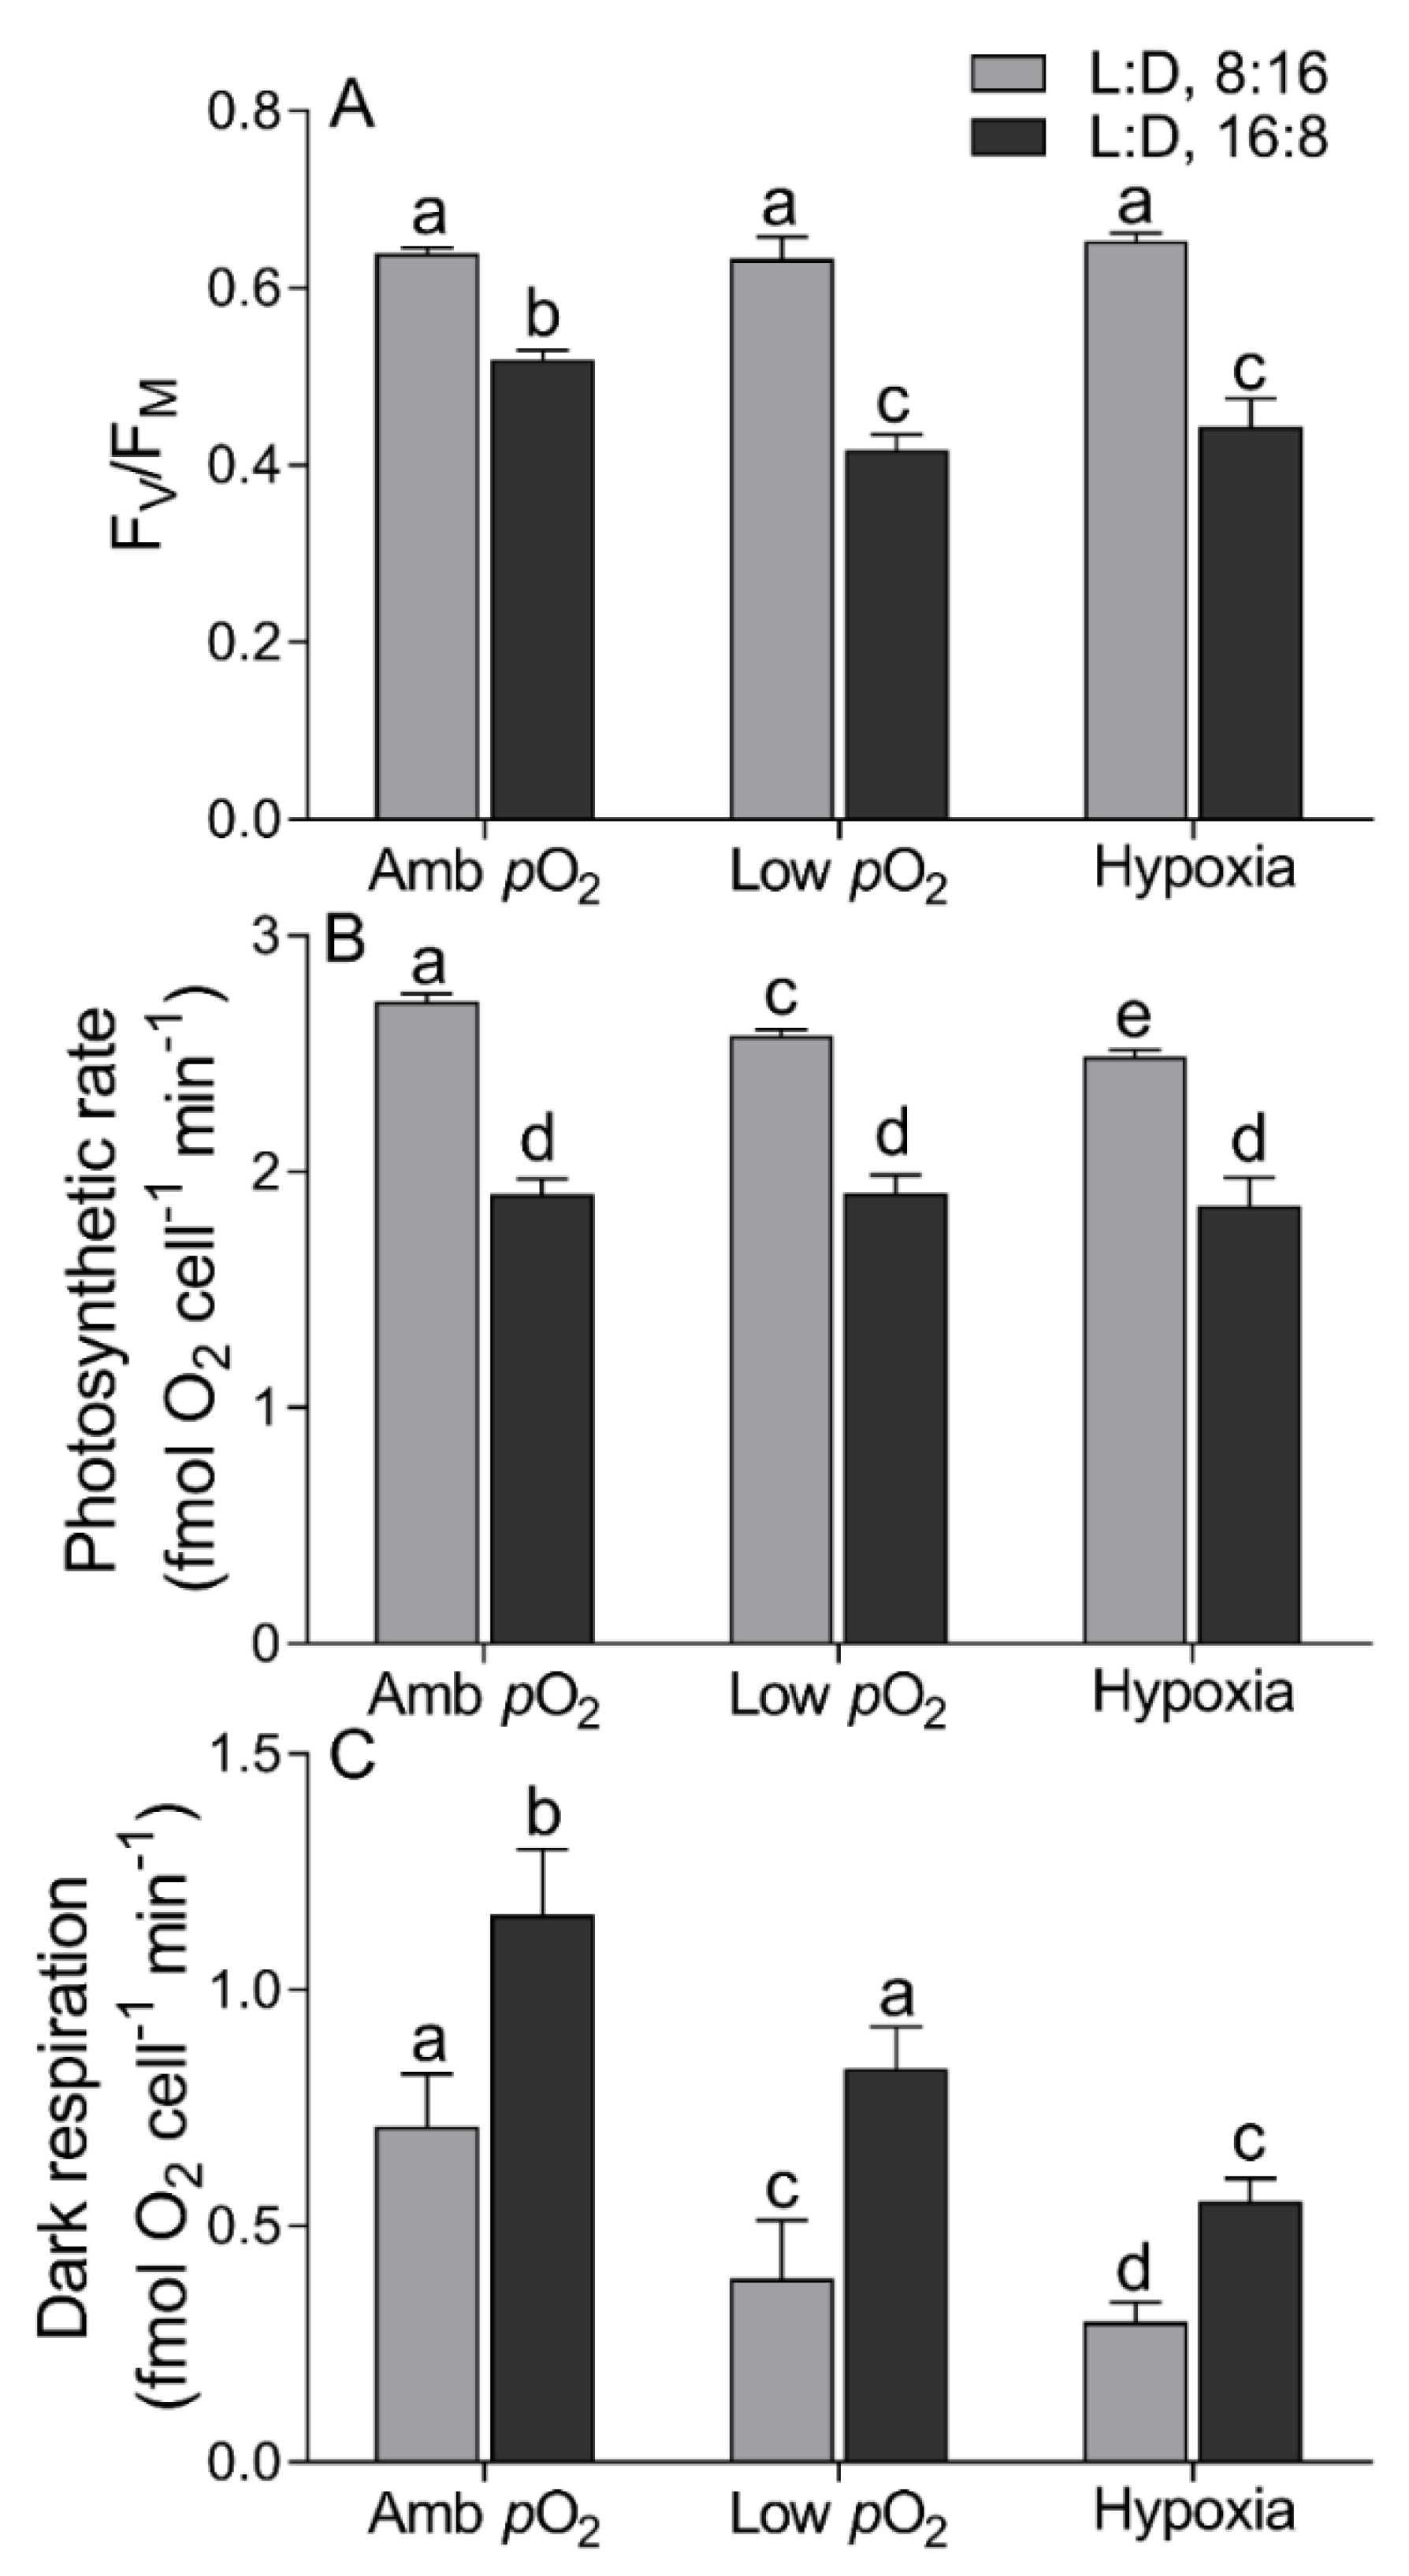
2.2. Chlorophyll Fluorescence

To measure the maximum photochemical quantum yield (FV/FM) of Photosystem II (PS II), 5 mL culture was taken from each flask and dark-acclimated for 15 min at growth temperature (18 °C). After this, the maximal (FM) chlorophyll fluorescence was measured with a fluorometer (AquaPen-C 100, Photon Systems Instruments, Prague, Czech Republic) under saturating blue-light pulse (3000 μmol photons m−2 s−1, 1 s), and the minimal fluorescence (FO) was measured in the presence of a weak modulated measuring light. The FV/FM was calculated [39] as:
FV/FM = (FM − FO)/FM
Meanwhile, the relative electron transport rate (rETR) was measured 0, 10, 20, 50, 100, 300, and 500 μmol photon m−2 s−1 actinic lights, to obtain the rapid light curve (RLC) [40] as:
rETR = (FM’ − Ft)/FM’ × 0.5 × PAR
where FM’ and Ft are maximal and instantaneous fluorescence under each of 7 actinic lights (PAR, μmol photons m−2 s−1). The RLC-derived photosynthetic parameters, i.e., light utilization efficiency (α), maximal rETR (rETRmax), and saturation irradiance (EK, μmol photons m−2 s−1) were obtained [41] as:
rETR = PAR/(a × PAR2 + b × PAR + c)
α = 1/c, rETRmax = 1/[b + 2 × (a × c)1/2], EK = c/[b + 2 × (a × c)1/2]
where a, b, and c are adjusted parameters.

2.3. Photosynthetic and Respiratory Rate

To measure the photosynthetic rate and dark respiratory rate of T. pseudonana, 300 mL cultures were collected from each of the combined pO2 and photoperiod treatments at the end of cultivation, followed by a 5-min dark-acclimation in a photosynthetic chamber where the temperature was maintained at 18 °C with a thermal cooler. Then, the increase in dissolved O2 concentration in the chamber under growth light and the decline in the dark were tracked with the optode oxygen sensor. The photosynthetic oxygen evolution rate (Pn) and respiratory rate (Rd, fmol O2 cell−1 min−1) were obtained by dividing the oxygen increase and decline rate by {cells mL−1 × measuring time}, respectively [31]. Each measurement lasted for ~15 min. After measuring the photosynthetic and respiratory rate, the culture was used for the following cell composition and transcriptome measurements.

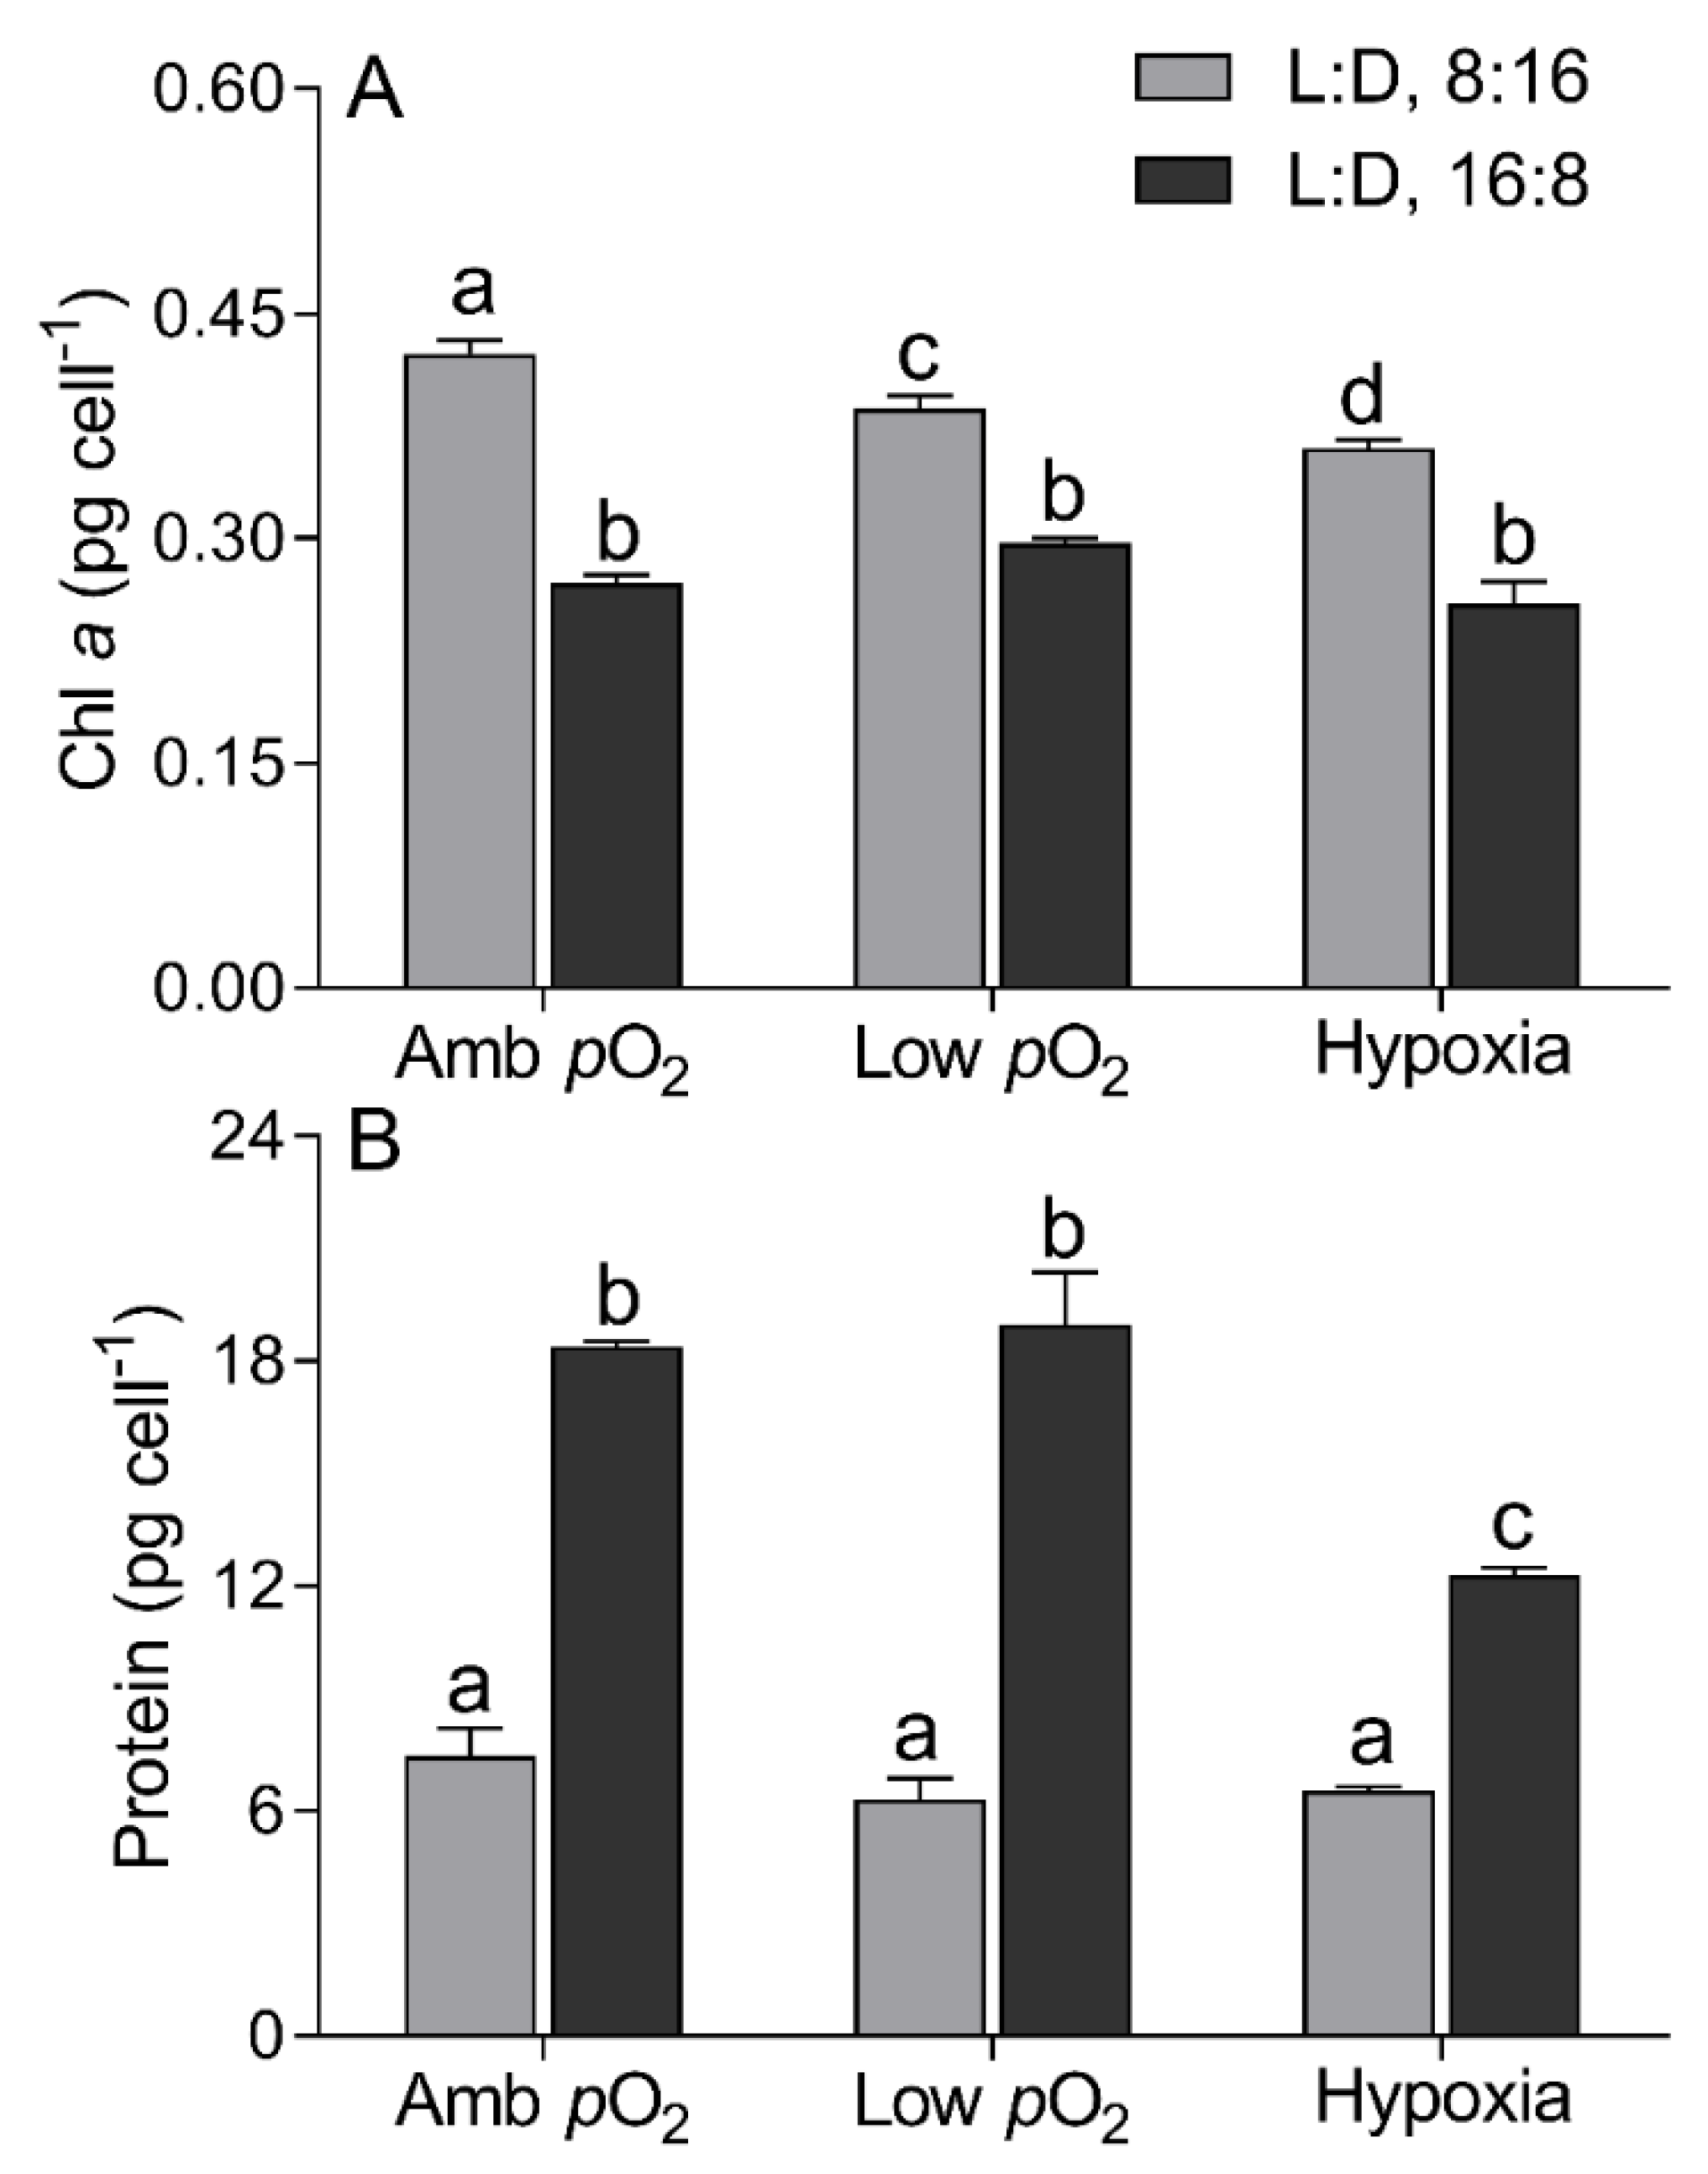
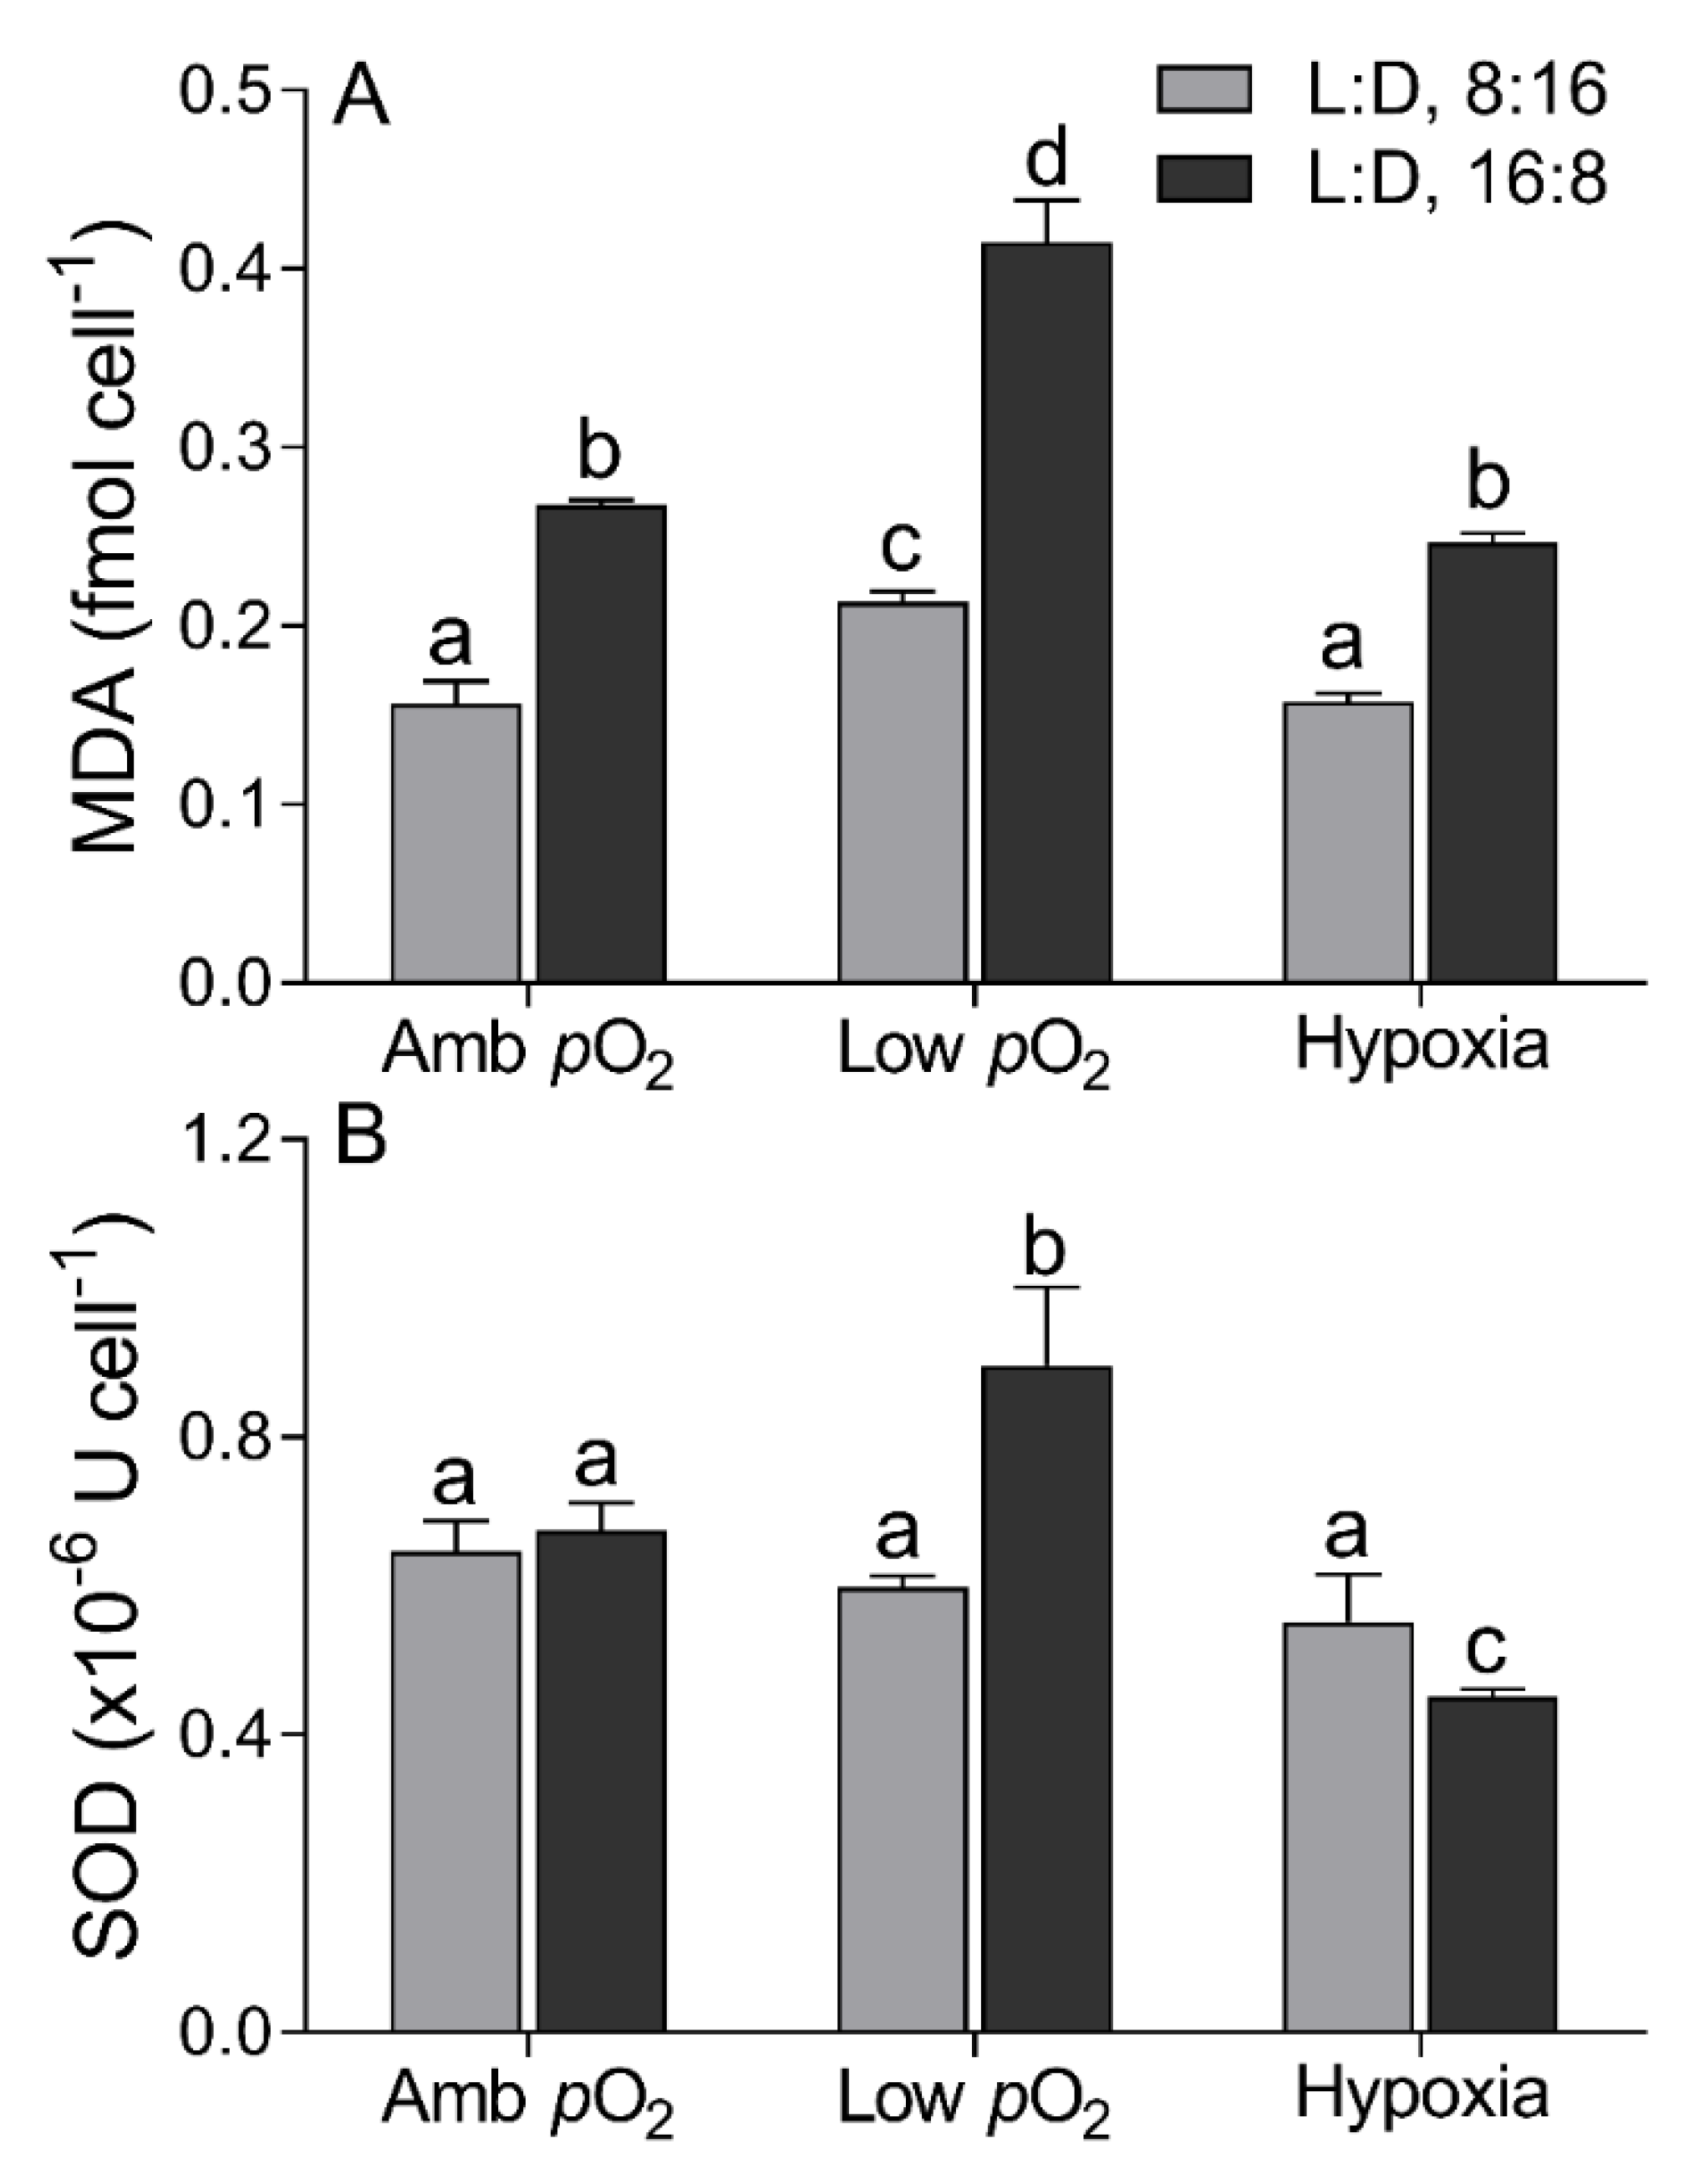
2.4. Cell Compositions

To measure cellular Chl a concentration, a 50 mL culture from each treatment was vacuum filtered onto a Whatman GF/F glass fiber filter (25 mm in diameter), extracted in 4 mL 90% acetone (v/v) saturated with magnesium carbonate overnight at 4 °C in the dark. After 10 min centrifugation (10,000× g) at 4 °C, the optical absorption of the extraction was scanned with a spectrophotometer (Shimadzu model UV 1800-PC, Kyoto, Japan). Chl a concentration (μg mL−1) was calculated according to [42].
To measure protein concentration, a 50 mL culture was vacuum filtered onto a GF/F glass fiber filter and extracted in 1.0 mL pre-cooling buffer (pH 8.0, 20 mM Tris, 1 mM EDTA, 10 mM MgCl2, 50 mM NaHCO3, and 5 mM β-mercaptoethanol). The cells on filters were then broken through oscillating for 20 min with grinding beads at 4 °C using a vortex mixer (G560E, Scientific Industries, New York, NY, USA). After centrifugation (10,000× g, 10 min, 4 °C), the supernatant was used to quantify the protein using a protein assay kit (A045-2, Nanjing Jiancheng Biological Engineering Co., Nanjing, China) following the manufacturer’s protocol with the bicinchoninic acid (BCA) method [31,32]. The malondialdehyde (MDA) in the protein solution, a product of membrane lipid peroxidation, was determined using an assay kit (A003-1, Nanjing Jiancheng Biological Engineering Co., Nanjing, China) [32], as well as the superoxide dismutase (SOD) activity with an assay kit (A001-3, Nanjing Jiancheng Biological Engineering Co., Nanjing, China) [43] following the protocol of the manufacturer.

2.5. Transcriptome Sequencing and Analysis

At the end of cultivation, 80 mL cultures from each flask of each pO2 and photoperiod treatment were collected for transcriptome analysis. The total RNA of T. pseudonana was extracted with Trizol (Takara Bio. Inc., Shiga, Japan), and the degradation and purity of RNA were assessed by 1% agarose gels using a NanoPhotometer® spectrophotometer (IMPLEN, Westlake Village, CA, USA) and an Agilent Bioanalyzer 2100 system (Agilent Tech., Santa Clara, CA, USA). Sequencing libraries were generated using NEBNext® Ultra™ RNA Library Prep Kit for Illumina® (NEB, BioLabs Inc., Ipswich, MA, USA). The library preparations were sequenced using the Illumina HiSeq platform to produce clean reads.
Transcriptome assembly was accomplished with the protocols of Trinity [44] and Corset [45]. Gene function was annotated on the base of following databases: Nr (NCBI non-redundant protein sequences), Nt (NCBI non-redundant nucleotide sequences), Pfam (Protein family), KOG/COG (Clusters of Orthologous Groups of proteins), Swiss-Prot (A manually annotated and reviewed protein sequence database), KO (KEGG Ortholog database), and GO (Gene Ontology). The RSEM (RNA-Seq by Expectation Maximization) was used to estimate the gene transcription levels [46]. Differential transcription analysis among the different pO2 and photoperiod treatments was performed with DEGseq package [47], and the p value was adjusted using the q-value, with the q-value of <0.005 and |log2(foldchange)| of >1 as significant threshold [48]. Metabolic pathway analysis of differentially expressed genes (DEGs) was conducted according to KEGG pathway database (http://www.genome.jp/kegg/, accessed on 10 November 2021), and functional enrichment analysis was performed using KOBAS (corrected p < 0.05) [49]. All the detailed information was supplied in supplemental materials.

2.6. Data Analysis

Data were shown as mean and standard deviations (mean ± sd). Paired t-test, one-way ANOVA with Tukey post-tests (Prism 5, Graphpad Software, San Diego, CA, USA), and comparisons of linear curve fits were used to detect the significant difference among cultures of each pO2 and photoperiod treatment. Two-way ANOVA with Tukey post-tests were used to detect the interactions of the pO2 level and photoperiod. The confidence level for the statistical tests was set at 0.05.

3. Results

The growth of T. pseudonana under the light intensity of 150 μmol photonsm−2 s−1 differed greatly among different pO2 and photoperiod treatments (Figure 1). The specific growth rate (μ) was 0.49 ± 0.05 d−1 at ambient pO2, with no significant effect of photoperiod. The μ was enhanced by ~34% by low pO2 under the 8:16 L:D cycle but decreased by ~22% with further decreased pO2. Under the 16:8 L:D cycle, however, the μ decreased from 0.53 ± 0.02 to 0.46 ± 0.03 d−1 with decreasing pO2. Prolonged light duration did not affect the μ at ambient pO2 but enhanced it by ~21% at low pO2 and reduced it by ~20% at the hypoxia condition.
Cellular Chl a content of T. pseudonana under the 8:16 L:D cycle decreased from 0.42 ± 0.02 to 0.36 ± 0.01 pg cell−1 from ambient pO2 to hypoxia conditions (Figure 2A). The prolonged light duration reduced the Chl a by ~36% at ambient pO2 and 23% and 29% at low pO2 and hypoxia, respectively. The protein content (6.78 ± 0.97 pg cell−1) under the 8:16 L:D cycle showed no significant difference among the three pO2 levels but decreased from 18.4 ± 0.25 to 12.3 ± 0.35 pg cell−1 from ambient pO2 to hypoxia (Figure 2B). The prolonged light duration enhanced the protein by ~150% at ambient pO2 and ~200% and ~87% at low pO2 or hypoxia, respectively.
The maximum PSII photochemical quantum yield (FV/FM) of T. pseudonana was 0.64 ± 0.02 under the 8:16 L:D cycle, with no significant effect of lowered pO2 (Figure 3A). Under the 16:8 L:D cycle, however, the FV/FM decreased from 0.52 ± 0.02 to 0.42 ± 0.03 from ambient pO2 to hypoxia. The prolonged photoperiod reduced the FV/FM by ~19% at ambient pO2 and by ~33% at low pO2 or hypoxia. In parallel, the RLC-derived light utilization efficiency (α) and maximal rETR (rETRmax) exhibited no significant difference among all three pO2 levels under both L:D 8:16 and 16:8 cycles; while the saturation irradiance (EK) was enhanced by low pO2 at the L:D 8:16 cycle (Table 1). The prolonged photoperiod significantly reduced the α, EK, and rETRmax among all pO2 treatments (p < 0.05) (Table 1). The photosynthetic oxygen evolution rate (Pn) under the 8:16 L:D cycle decreased from 2.72 ± 0.06 to 2.49 ± 0.05 fmol O2 cell−1 min−1 from ambient pO2 to hypoxia, while such a decreasing trend did not occur under the 16:8 L:D cycle (Figure 3B). The dark respiration rate (Rd) decreased from 0.71 ± 0.19 to 0.30 ± 0.07 fmol O2 cell−1 min−1 with decreasing pO2 under the 8:16 L:D cycle and from 1.16 ± 0.24 to 0.55 ± 0.08 fmol O2 cell−1 min−1 under the 16:8 L:D cycle (Figure 3C). The prolonged photoperiod significantly reduced the photosynthetic rate (p < 0.01) but enhanced the respiratory rate (p < 0.01) among all three pO2 treatments.
The cellular MDA content was 0.21 ± 0.01 fmol cell−1 at ambient pO2 under 8:16 L:D cycle, ~25% lower than that at low pO2 but similar to hypoxia (Figure 4A). The prolonged photoperiod enhanced the MDA by ~71%, ~95%, and ~56% at ambient pO2, low pO2, and hypoxia, respectively. The SOD activity was (0.60 ± 0.08) × 10−6 U cell−1 under 8:16 L:D cycle, with no significant effect of pO2 levels (Figure 4B). The prolonged photoperiod did not affect the SOD activity at ambient pO2 but enhanced it by ~50% at low pO2 and reduced it by ~18% at hypoxia.
Transcriptome analysis showed that a total of 26 differentially expressed genes (DEGs) (|log2(foldchange)| > 8) that relate to photosynthesis, respiration, and metabolism were more sensitive to varying pO2 levels and photoperiods, based on the KEGG pathway enrichment (Table S1). Most of these identified DEGs were downregulated by lowered pO2 or hypoxia to varying degrees under the 8:16 and 16:8 L:D cycles, as compared to ambient pO2 (Figure 5). Of these DEGs, 11 and 7 transcripts were, respectively, related to the functions of metabolism (citrate cycle and fatty acid metabolism) and oxidation (oxidative phosphorylation), and 1 transcript was related to photosynthesis (light reaction). The transcriptional pattern seemed to be more sensitive to low pO2 in the citrate cycle, with 7 key nodal enzymes in four comparable strategies being downregulated (6.7-fold [avg.]) (Figure 6). Under the 16:8 L:D cycle, 7 DEGs of oxidative phosphorylation were downregulated by 6.3-fold [avg.] by low pO2 and by 4.5-fold [avg.] by hypoxia. Moreover, under the 8:16 L:D cycle, the expression of the ATP-targeted enzyme gene ATP1 was upregulated by 9.6-fold and 8.1-fold by low pO2 or hypoxia, respectively, as compared to ambient pO2 (Figure S1, Table S1). The prolonged photoperiod mainly downregulated the expression of the photosynthesis-related genes, as well as the DEGs of the citrate cycle (Figure S1, Table S2). The downregulation of the RubisCO gene expression (1.47-fold [avg.]) by prolonged photoperiod was similar among all three pO2 treatments but different for that of C4 metabolism.

4. Discussion

Most previous studies reported the individual effect upon phytoplankton physiology by lowering pO2 levels [6,7,18] or varying photoperiods [30,31,32,33,34]. In this study, we showed the coupling effects of lowered pO2 and photoperiods on the physiological performance of the diatom T. pseudonana. Lowering pO2 interacted with longer photoperiod to reduce the light-harvesting pigments and photosynthetic rate through downregulating the genes related to photosynthesis and metabolism and, consequently, reduced the growth of T. pseudonana (F(2,12) = 6.46, p < 0.05). Moreover, at lowered pO2, the reduction in respiration and photosynthesis occurred under both the 8:16 and 16:8 L:D cycles, as compared to ambient pO2; while the enhancement of the growth rate was present under the former but reduced under the latter L:D cycle, which indicated the alteration of light duration on the balance of the lowered pO2-induced savings of consumption and the reduction in photosynthetic production.
Longer light duration reduced the cellular pigment content of T. pseudonana (Figure 2A). Similar to previous studies [30,31], the light intensity of 150 µmol photons m−2 s−1 was expected to saturate the cell growth under a shorter photoperiod and may have oversaturated under the longer photoperiod, as indicated by an insignificant difference of the µ between the 8:16 and 16:8 L:D cycles (Figure 1). It is easily understood that phytoplankton cells usually lower the synthesis and accumulation of Chl a in oversaturated light, to lessen the excessive energy harvesting [43] and thus to alleviate the excessive light energy-caused photodamage or photoinhibition [30,50]. Moreover, the decreased pO2 interacted with the prolonged photoperiod to aggravate the decrease in Chl a (F(2,12) = 7.53, p < 0.01), as also supported by the transcriptome results (Figure 6). This can be explained by the fact that the decreased pO2 has pulled the RubisCO-catalyzed biochemical reaction towards the photosynthetic process [13] thus saving the energy derived from the light-harvesting complex. Such energy savings may feedback to adaptively cause cells to lower the capacity for light harvesting through lowering the Chl a containing photosystems. If considering the function of CCM for concentrating CO2 in diatoms [10,11,12], however, the positive effect of reduced pO2 may be tempered as indicated by the reduction in growth in the diatom T. pseudonana at hypoxia condition (Figure 1) or in Skeletonema costatum [6] and C. reinhardtii [21]. Furthermore, an increase in cellular proteins occurred under the combined hypoxia and longer photoperiod status (Figure 2B), which may help to further save energy; more cellular proteins usually indicate more enzymes and, thus, more activity of biochemical reactions within cells [10,13,51].
The longer photoperiod suppressed the photosynthetic efficiency of T. pseudonana but enhanced the respiration (Figure 3), indicating the growth light here was oversaturated under the 18:6 photoperiod. Such an adverse effect was aggravated by the extremely low pO2 (FV/FM, F(2,12) = 4.14, p < 0.05; and Pn, F(2,12) = 3.65, p < 0.05), consistent with more products of membrane lipid peroxidation, i.e., higher cellular MDA content at hypoxia status (Figure 4A). Under such an adverse circumstance, phytoplankton cells often adaptively promote the ROS-scavenged ability, including enhancing cellular SOD activity to protect themselves against oxidative damage [52]. Our findings supported this with higher SOD activity at low pO2 (Figure 4B); at hypoxia, however, the SOD activity was depressed, suggesting the cellular O2 level was too low to maintain the ROS-scavenging capacity, thus, leading to the enhancement of MDA content, although the lowered pO2 circumstance theoretically goes against the ROS production and MDA accumulation [53]. Supporting the decrease in photosynthetic capacity, the transcriptome results indicated the downregulation of most DEGs, including those related to the photosynthetic process (Figure 6). Compared to photosynthesis, the lowered pO2 reduced the respiration even more, leading to an even lower respiration rate at hypoxia (Figure 3C), supported by the severe downregulation of DEGs related to the key enzymes in the citric acid cycle (Figure 5 and Figure 6). Such downregulation also occurred in Chlorella vulgaris that had overcome the metabolic constraint through lowering respiration and allocating more fixed C to maintain growth [54], as well as in T. pseudonana at a low pO2 state (Figure 1 and Figure 3C). Mechanically, the dissolved O2 most likely affects the ATP synthesis in mitochondria [55] and RubisCO-catalyzed photorespiration in plastid [56]. It is the case in this study, as the decreased pO2 downregulated a total of 25 genes that relate to ATP synthesis (Figure 6), which may have lowered the biochemical activities within cells through inhibiting, e.g., PPDK [57] and, thus, reduced the respiration rate (Figure 3C). Moreover, the expression of C4 genes such as PEPC, PPDK, and PEPCK, showed no linear correlation with decreasing pO2 (Figure S1), consistent with previous results [11,12]. Finally, the expressions of GAP, GDC, and GLY genes that relate to photorespiration were also downregulated by lowering pO2 (Figure 6), as well as the decreased photosynthetic efficiency, the mechanical contradiction of which needs to be studied further.

5. Conclusions

In this study, we found the hypoxia and longer light period interactively reduced the growth of diatom T. pseudonana through reducing the photosynthetic capacity by downregulating the related genes’ expression. Growing under lowered pO2 condition, both cellular Chl a and protein contents were lower, but the MDA content and SOD activity were higher and the lowered pO2-induced effect was mediated by the light duration. Moreover, our results demonstrated that whether there is a reduction in respiration by the lowered pO2 over that of photosynthesis or not determines the positive and negative effects of lowering pO2 on the growth of diatoms, which depends on the pO2 level and is mediated by the photoperiod.

Supplementary Materials

The following are available online at https://www.mdpi.com/article/10.3390/microorganisms9122541/s1, Figure S1: Heatmap of the photoperiod-caused changes (|log2(Fold Change)| > 2) in the DEGs related to metabolism, photosystem, oxidation, and carbon fixation of T. pseudonana under ambient pO2, low pO2, and hypoxia; Table S1: The log-2-fold value of the DEGs of T. pseudonana regulated by lowered pO2 under 8:16 and 16:8 L:D cycles, relevant to respiration, photosynthesis, carbon fixation, and metabolism.

Author Contributions

Conceptualization, G.L., B.C. and J.L.; Data collection and analysis, B.C., G.X. and G.L.; writing—original draft preparation, J.L., B.C. and G.L.; writing—review and editing, J.L.; visualization, J.L., G.L. and B.C.; supervision, G.L.; funding acquisition, J.L. All authors have read and agreed to the published version of the manuscript.

Funding

This research was funded by the National Key Research and Development Program of China, grant number 2019YFA0606704; the Key Research and Development Program of Shandong Province, grant number 2020ZLYS04; and the Innovation Group Project of the Southern Marine Science and Engineering Guangdong Laboratory (Zhuhai), grant number 311,021,006; and the National Natural Science Foundation, grant number, 41,676,156.

Data Availability Statement

The data presented in this study are available within the article.

Acknowledgments

We thank Guangming Mai from the South China Sea Institute of Oceanology, Chinese Academic Sciences for help with the statistical analysis.

Conflicts of Interest

The authors declare no conflict of interest.

References

  1. Gilbert, D.; Rabalais, N.N.; Díaz, R.J.; Zhang, J. Evidence for greater oxygen decline rates in the coastal ocean than in the open ocean. Biogeosciences 2010, 7, 2283–2296. [Google Scholar] [CrossRef] [Green Version]
  2. Diaz, R.J.; Rosenberg, R. Spreading dead zones and consequences for marine ecosystems. Science 2008, 321, 926–929. [Google Scholar] [CrossRef]
  3. Schmidtko, S.; Stramma, L.; Visbeck, M. Decline in global oceanic oxygen content during the past five decades. Nature 2017, 542, 335–339. [Google Scholar] [CrossRef]
  4. Breitburg, D.; Levin, L.A.; Oschlies, A.; Grégoire, M.; Chavez, F.P.; Conley, D.J.; Garçon, V.; Gilbert, D.; Gutiérrez, D.; Isensee, K.; et al. Declining oxygen in the global ocean and coastal waters. Science 2018, 359, eaam7240. [Google Scholar] [CrossRef] [Green Version]
  5. Thomas, P.; Rahman, M.S.; Picha, M.E.; Tan, W. Impaired gamete production and viability in Atlantic croaker collected throughout the 20,000 km2 hypoxic region in the northern Gulf of Mexico. Mar. Pollut. Bull. 2015, 101, 182–192. [Google Scholar] [CrossRef]
  6. Wu, R.; Wo, K.T.; Chiu, J. Effects of hypoxia on growth of the diatom Skeletonema costatum. J. Exp. Mar. Biol. Ecol. 2012, 420–421, 65–68. [Google Scholar] [CrossRef]
  7. Haas, A.F.; Smith, J.E.; Thompson, M.; Deheyn, D.D. Effects of reduced dissolved oxygen concentrations on physiology and fluorescence of hermatypic corals and benthic algae. PeerJ 2014, 2, e235. [Google Scholar] [CrossRef]
  8. Kim, M.; Brodersen, K.E.; Szabó, M.; Larkum, A.W.D.; Raven, J.A.; Ralph, P.J.; Pernice, M. Low oxygen affects photophysiology and the level of expression of two-carbon metabolism genes in the seagrass Zostera muelleri. Photosynth. Res. 2018, 136, 147–160. [Google Scholar] [CrossRef]
  9. Garcia-Robledo, E.; Padilla, C.C.; Aldunate, M.; Stewart, F.J.; Ulloa, O.; Paulmier, A.; Gregori, G.; Revsbech, N.P. Cryptic oxygen cycling in anoxic marine zones. Proc. Natl. Acad. Sci. USA 2017, 114, 8319–8324. [Google Scholar] [CrossRef] [PubMed] [Green Version]
  10. Giordano, M.; Beardall, J.; Raven, J.A. CO2 concentrating mechanisms in algae: Mechanisms, environmental modulation, and evolution. Ann. Rev. Plant Biol. 2005, 56, 99–131. [Google Scholar] [CrossRef] [Green Version]
  11. Clement, R.; Dimnet, L.; Maberly, S.C.; Gontero, B. The nature of the CO2-concentrating mechanisms in a marine diatom, Thalassiosira pseudonana. New Phytol. 2016, 209, 1417–1427. [Google Scholar] [CrossRef] [Green Version]
  12. Clement, R.; Lignon, S.; Mansuelle, P.; Jensen, E.; Pophillat, M.; Lebrun, R.; Denis, Y.; Puppo, C.; Maberly, S.C.; Gontero, B. Responses of the marine diatom Thalassiosira pseudonana to changes in CO2 concentration: A proteomic approach. Sci. Rep. 2017, 7, 42333. [Google Scholar] [CrossRef] [PubMed] [Green Version]
  13. Gao, K.; Campbell, D.A. Photophysiological responses of marine diatom to elevated CO2 and decreased pH: A review. Funct. Plant Biol. 2014, 41, 449–459. [Google Scholar] [CrossRef] [PubMed]
  14. Sarthou, G.; Timmermans, K.R.; Blain, S.; Tréguer, P. Growth physiology and fate of diatoms in the ocean: A review. J. Sea Res. 2005, 53, 25–42. [Google Scholar] [CrossRef]
  15. Xiang, C.; Tan, Y.; Zhang, H.; Liu, J.; Ke, Z.; Li, G. The key to dinoflagellate (Noctiluca scintillans) blooming and outcompeting diatoms in winter off Pakistan, northern Arabian Sea. Sci. Total Environ. 2019, 694, 133396. [Google Scholar] [CrossRef] [PubMed]
  16. Li, G.; Liu, J.; Diao, Z.; Jiang, X.; Li, J.; Ke, Z.; Shen, P.; Ren, L.; Huang, L.; Tan, Y. Subsurface low dissolved oxygen occurred at fresh- and saline-water intersection of the Pearl River estuary during the summer period. Mar. Pollut. Bull. 2018, 126, 585–591. [Google Scholar] [CrossRef]
  17. Li, X.; Bianchi, T.S.; Yang, Z.; Osterman, L.E.; Allison, M.A.; Dimarco, S.F.; Yang, G. Historical trends of hypoxia in Changjiang River estuary: Applications of chemical biomarkers and microfossils. J. Mar. Syst. 2011, 86, 57–68. [Google Scholar] [CrossRef]
  18. Pruder, G.D.; Bolton, E.T. Differences between cell division and carbon fixation rates associated with light intensity and oxygen concentration: Implications in the cultivation of an estuarine diatom. Mar. Biol. 1980, 59, 1–6. [Google Scholar] [CrossRef]
  19. Raven, J.A.; Larkum, A. Are there ecological implications for the proposed energetic restrictions on photosynthetic oxygen evolution at high oxygen concentrations? Photosynth. Res. 2007, 94, 31–42. [Google Scholar] [CrossRef]
  20. Kliphuis, A.M.; Martens, D.E.; Janssen, M.; Wijffels, R.H. Effect of O2:CO2 ratio on the primary metabolism of Chlamydomonas reinhardtii. Biotechnol. Bioeng. 2011, 108, 2390–2402. [Google Scholar] [CrossRef] [PubMed]
  21. Vance, P.; Spalding, M.H. Growth, photosynthesis, and gene expression in Chlamydomonas over a range of CO2 concentrations and CO2/O2 ratios: CO2 regulates multiple acclimation states. Can. J. Bot. 2005, 83, 796–809. [Google Scholar] [CrossRef]
  22. Kamp, A.; de Beer, D.; Nitsch, J.L.; Lavik, G.; Stief, P. Diatoms respire nitrate to survive dark and anoxic conditions. Proc. Natl. Acad. Sci. USA. 2011, 108, 5649–5654. [Google Scholar] [CrossRef] [Green Version]
  23. Zhou, F.; Chai, F.; Huang, D.; Wells, M.; Ma, X.; Meng, Q.; Xue, H.; Xuan, J.; Wang, P.; Ni, X.; et al. Coupling and decoupling of high biomass phytoplankton production and hypoxia in a highly dynamic coastal system: The Changjiang (Yangtze River) Estuary. Front. Mar. Sci. 2020, 7, 259. [Google Scholar] [CrossRef]
  24. Wang, B.; Chen, J.; Jin, H.; Li, H.; Huang, D.; Cai, W.-J. Diatom bloom-derived bottom water hypoxia off the Changjiang estuary, with and without typhoon influence. Limnol. Oceanogr. 2017, 62, 1552–1569. [Google Scholar] [CrossRef]
  25. Yamori, W. Photosynthesis and respiration. In Plant Factory, 2nd ed.; Takagaki, T.K.N., Ed.; Academic Press: San Diego, CA, USA, 2020; pp. 197–206. [Google Scholar]
  26. Brand, L.E.; Guillard, R.R.L. The effects of continuous light and light intensity on the reproduction rates of twenty-two species of marine phytoplankton. J. Exp. Mar. Biol. Ecol. 1981, 50, 119–132. [Google Scholar] [CrossRef]
  27. Tilzer, M.M.; Dubinsky, Z. Effects of temperature and day length on the mass balance of Antarctic phytoplankton. Polar Biol. 1987, 7, 35–42. [Google Scholar] [CrossRef]
  28. Li, G.; Woroch, A.; Donaher, N.; Cockshutt, A.M.; Campbell, D.A. A Hard Day’s Night: Diatoms continue recycling Photosystem II in the dark. Front. Mar. Sci. 2016, 3, 218. [Google Scholar] [CrossRef] [Green Version]
  29. Chauton, M.S.; Winge, P.; Brembu, T.; Olav Vadstein, O.; Bones, A.M. Gene regulation of carbon fixation, storage, and utilization in the diatom Phaeodactylum tricornutum acclimated to light/dark cycles. Plant Physiol. 2013, 161, 1034–1048. [Google Scholar] [CrossRef] [PubMed] [Green Version]
  30. Li, G.; Talmy, D.; Campbell, D.A. Diatom growth responses to photoperiod and light are predictable from diel reductant generation. J. Phycol. 2017, 53, 95–107. [Google Scholar] [CrossRef] [PubMed]
  31. Xu, G.; Liu, J.; Chen, B.; Li, G. Photoperiod mediates the differential physiological responses of smaller Thalassiosira pseudonana and larger Thalassiosira punctigera to temperature changes. J. Appl. Phycol. 2020, 32, 2863–2874. [Google Scholar] [CrossRef]
  32. Wang, H.; Zhang, B.; Song, X.; Jian, X.; Tang, C.; Campbell, D.A.; Li, G. High antioxidant capability interacts with respiration to mediate two Alexandrium species growth exploitation of photoperiods and light intensities. Harmful Algae 2019, 82, 26–34. [Google Scholar] [CrossRef] [PubMed]
  33. Li, P.; Ma, Q.; Xu, S.; Liu, W.; Ma, Z.; Ni, G. Opposite growth responses of Alexandrium minutum and Alexandrium catenella to photoperiods and temperatures. Plants 2021, 10, 1056. [Google Scholar] [CrossRef] [PubMed]
  34. Qian, H.; Li, J.; Pan, X.; Jiang, H.; Sun, L.; Fu, Z. Photoperiod and temperature influence cadmium’s effects on photosynthe-sis-related gene transcription in Chlorella vulgaris. Ecotoxicol. Environ. Saf. 2010, 73, 1202–1206. [Google Scholar] [CrossRef]
  35. Shatwell, T.; Nicklisch, A.; Köhler, J. Temperature and photoperiod effects on phytoplankton growing under simulated mixed layer light fluctuations. Limnol. Oceanogr. 2012, 57, 541–553. [Google Scholar] [CrossRef]
  36. Field, C.B.; Behrenfeld, M.J.; Randerson, J.T.; Falkowski, P. Primary production of the biosphere: Integrating terrestrial and oceanic components. Science 1998, 281, 237–240. [Google Scholar] [CrossRef] [Green Version]
  37. Hallegraeff, G.M. Species of the diatom genus Thalassiosira in Australian water. Bot. Mar. 1984, 27, 495–513. [Google Scholar] [CrossRef]
  38. Armbrust, E.V.; Berges, J.A.; Bowler, C.; Green, B.R.; Martinez, D.; Putnam, N.H.; Zhou, S.; Allen, A.E.; Apt, K.E.; Bechner, M.; et al. The genome of the diatom Thalassiosira pseudonana: Ecology, evolution, and metabolism. Science 2014, 306, 79–86. [Google Scholar] [CrossRef] [PubMed] [Green Version]
  39. van Kooten, O.; Snel, J.F.H. The use of chlorophyll fluorescence nomenclature in plant stress physiology. Photosynth. Res. 1990, 25, 147–150. [Google Scholar] [CrossRef] [PubMed]
  40. Genty, B.; Briantais, J.M.; Baker, N.R. The relationship between the quantum yield of photosynthetic electron transport and quenching of chlorophyll fluorescence. BBA-Gen. Subj. 1989, 990, 87–92. [Google Scholar] [CrossRef]
  41. Eilers, P.H.C.; Peeters, J.C.H. A model for the relationship between light intensity and the rate of photosynthesis in phytoplankton. Ecol. Model 1988, 42, 199–215. [Google Scholar] [CrossRef]
  42. Wellburn, A.R. The spectral determination of chlorophylls a and b, as well as total carotenoids, using various solvents with spectrophotometers of different resolution. J. Plant Physiol. 1994, 144, 307–313. [Google Scholar] [CrossRef]
  43. Qin, Z.; Xia, X.; Mai, G.; Tan, Y.; Li, G. Differential physiological responses of small Thalassiosira pseudonana and large Thalassiosira punctigera to the shifted-high light and nitrogen. J. Mar. Sci. Eng. 2021, 9, 450. [Google Scholar] [CrossRef]
  44. Grabherr, M.G.; Haas, B.J.; Yassour, M.; Levin, J.Z.; Thompson, D.A.; Amit, I.; Adiconis, X.; Fan, L.; Raychowdhury, R.; Zeng, Q.; et al. Full-length transcriptome assembly from RNA-Seq data without a reference genome. Nat. Biotech. 2011, 29, 644–652. [Google Scholar] [CrossRef] [Green Version]
  45. Davidson, N.M.; Oshlack, A. Corset: Enabling differential gene expression analysis for de novo assembled transcriptomes. Genome Biol. 2014, 15, 410. [Google Scholar] [PubMed] [Green Version]
  46. Dewey, C.N.; Li, B. RSEM: Accurate transcript quantification from RNA-Seq data with or without a reference genome. BMC Bioinform. 2011, 12, 323. [Google Scholar]
  47. Wang, L.; Feng, Z.; Wang, X.; Wang, X.; Zhang, X. DEGseq: An R package for identifying differentially expressed genes from RNA-seq data. Bioinformatics 2010, 26, 136–138. [Google Scholar] [CrossRef]
  48. Storey, J.D. The positive false discovery rate: A Bayesian interpretation and the q-value. Ann. Stat. 2003, 31, 2013–2035. [Google Scholar] [CrossRef]
  49. Mao, X.; Tao, C.; Olyarchuk, J.G.; Wei, L. Automated genome annotation and pathway identification using the KEGG Orthology (KO) as a controlled vocabulary. Bioinformatics 2005, 21, 3787–3793. [Google Scholar] [CrossRef] [PubMed]
  50. Li, G.; Campbell, D.A. Rising CO2 interacts with growth light and growth rate to alter Photosystem II photoinactivation of the coastal diatom Thalassiosira pseudonana. PLoS ONE 2013, 8, e55562. [Google Scholar] [CrossRef]
  51. Spreitzer, R.J.; Salvucci, M.E. Rubisco: Structure, regulatory interactions, and possibilities for a better enzyme. Ann. Rev. Plant Biol. 2002, 53, 449–475. [Google Scholar] [CrossRef] [Green Version]
  52. Carvalho, R.N.; Bopp, S.K.; Lettieri, T. Transcriptomics responses in marine diatom Thalassiosira pseudonana exposed to the polycyclic aromatic hydrocarbon benzo[a]pyrene. PLoS ONE 2011, 6, e26985. [Google Scholar] [CrossRef] [Green Version]
  53. Pfannschmidt, T. Chloroplast redox signals: How photosynthesis controls its own genes. Trends Plant Sci. 2003, 8, 33–41. [Google Scholar] [CrossRef] [Green Version]
  54. Padfield, D.; Yvon-Durocher, G.; Buckling, A.; Jennings, S.; Yvon-Durocher, G. Rapid evolution of metabolic traits explains thermal adaptation in phytoplankton. Ecol. Lett. 2015, 19, 133–142. [Google Scholar] [CrossRef] [Green Version]
  55. Thny-Meyer, L.; Beck, C.; Preisig, O.; Hennecke, H. The ccoNOQP gene cluster codes for a cb-type cytochrome oxidase that functions in aerobic respiration of Rhodobacter capsulatus. Mol. Microbiol. 2010, 14, 705–716. [Google Scholar] [CrossRef] [PubMed]
  56. Horken, K.M.; Tabita, F.R. Closely related form I ribulose bisphosphate carboxylase/oxygenase molecules that possess different CO2/O2 substrate specificities. Arch. Biochem. Biophys. 1999, 361, 183–194. [Google Scholar] [CrossRef]
  57. Papandreou, I.; Cairns, R.A.; Fontana, L.; Lim, A.L.; Denko, N.C. HIF-1 mediates adaptation to hypoxia by actively downregulating mitochondrial oxygen consumption. Cell Metab. 2006, 3, 187–197. [Google Scholar] [CrossRef] [PubMed] [Green Version]
Figure 1. Specific growth rate (μ, day−1) of T. pseudonana under 8:16 and 16:8 Light:Dark (L:D) cycles, under ambient pO2 (Amb pO2), low pO2 (Low pO2), and hypoxia (Hypoxia) conditions. The vertical bar shows the standard deviation (n = 3), and different letters on top of the bar indicate the significant differences (p < 0.05, one-way ANOVA).
Microorganisms 09 02541 g001
Figure 2. Chlorophyll a ((A), Chl a, pg cell−1) and protein contents ((B), pg cell−1) of T. pseudonana grown under 8:16 and 16:8 L:D cycles, under ambient pO2, low pO2, and hypoxia. The vertical bar shows the standard deviation (n = 3), and different letters on top of the bar indicate the significant differences (p < 0.05, one-way ANOVA).
Microorganisms 09 02541 g002
Figure 3. Maximal photochemical quantum yield of PSII ((A), FV/FM), photosynthetic oxygen evolution rate ((B), fmol O2 cell−1 min−1) and dark respiration rate ((C), fmol O2 cell−1 min−1) of T. pseudonana grown under 8:16 and 16:8 L:D cycles, under ambient pO2, low pO2, and hypoxia. The vertical bar shows the standard deviation (n = 3), and different letters on top of the bar indicate the significant differences (p < 0.05, one-way ANOVA).
Microorganisms 09 02541 g003
Figure 4. Cellular malondialdehyde concentration ((A), MDA, fmol cell−1) and superoxide dismutase activity ((B), SOD, ×10−6 U cell−1) of T. pseudonana grown under 8:16 and 16:8 L:D cycles, under ambient pO2, low pO2, and hypoxia. The vertical bar shows the standard deviation (n = 3), and different letters on top of the bar indicate the significant differences (p < 0.05, one-way ANOVA).
Microorganisms 09 02541 g004
Figure 5. Heatmap of the low pO2 or hypoxia-caused changes (|log2(Fold Change)| > 2) in the differential expressed genes (DEGs) that are related to metabolism, photosystem, oxidation, and carbon fixation of T. pseudonana grown under 8:16 and 16:8 L:D cycles. Red and green colors indicate the up- and downregulations of the DEGs, respectively. The complete gene names are shown in Table S1.
Microorganisms 09 02541 g005
Figure 6. Schematic diagram of changed metabolic pathways of T. pseudonana under the varied pO2 and photoperiods. Red and green colors indicate the up- and downregulation of the DEGs, respectively. The solid arrow indicates the direct metabolic steps in a pathway. The complete gene names are shown in Table S1.
Microorganisms 09 02541 g006
Table 1. The rapid light curve (RLC)-derived light utilization efficiency (α), saturation irradiance (EK, μmol photons m−2 s−1), and maximal relative electron transport rate (rETRmax) of T. pseudonana grown under 8:16 and 16:8 Light:Dark cycles, under ambient pO2 (Amb pO2), low pO2, and hypoxia.
Photosynthetic
Parameters
L:D 8:16L:D 8:16
Amb pO2Low pO2HypoxiaAmb pO2Low pO2Hypoxia
α0.32 ± 0.01 a0.31 ± 0.02 a0.31 ± 0.04 a0.25 ± 0.01 b0.19 ± 0.04 b0.25 ± 0.02 b
EK469 ± 52.5 a582 ± 63.6 b499 ± 46.1 a200 ± 52.3 c230 ± 43.8 c230 ± 42.0 c
rETRmax148 ± 14.2 a179 ± 39.4 a159 ± 46.4 a49.7 ± 15.3 b43.8 ± 11.8 b57.1 ± 14.3 b
Note: Numbers indicate the mean and standard deviation from measurements of 3 independent cultures (n = 3); and different letters at the top-right of the numbers indicate significant differences (p < 0.05, one-way ANOVA).
Publisher’s Note: MDPI stays neutral with regard to jurisdictional claims in published maps and institutional affiliations.

