1. Introduction
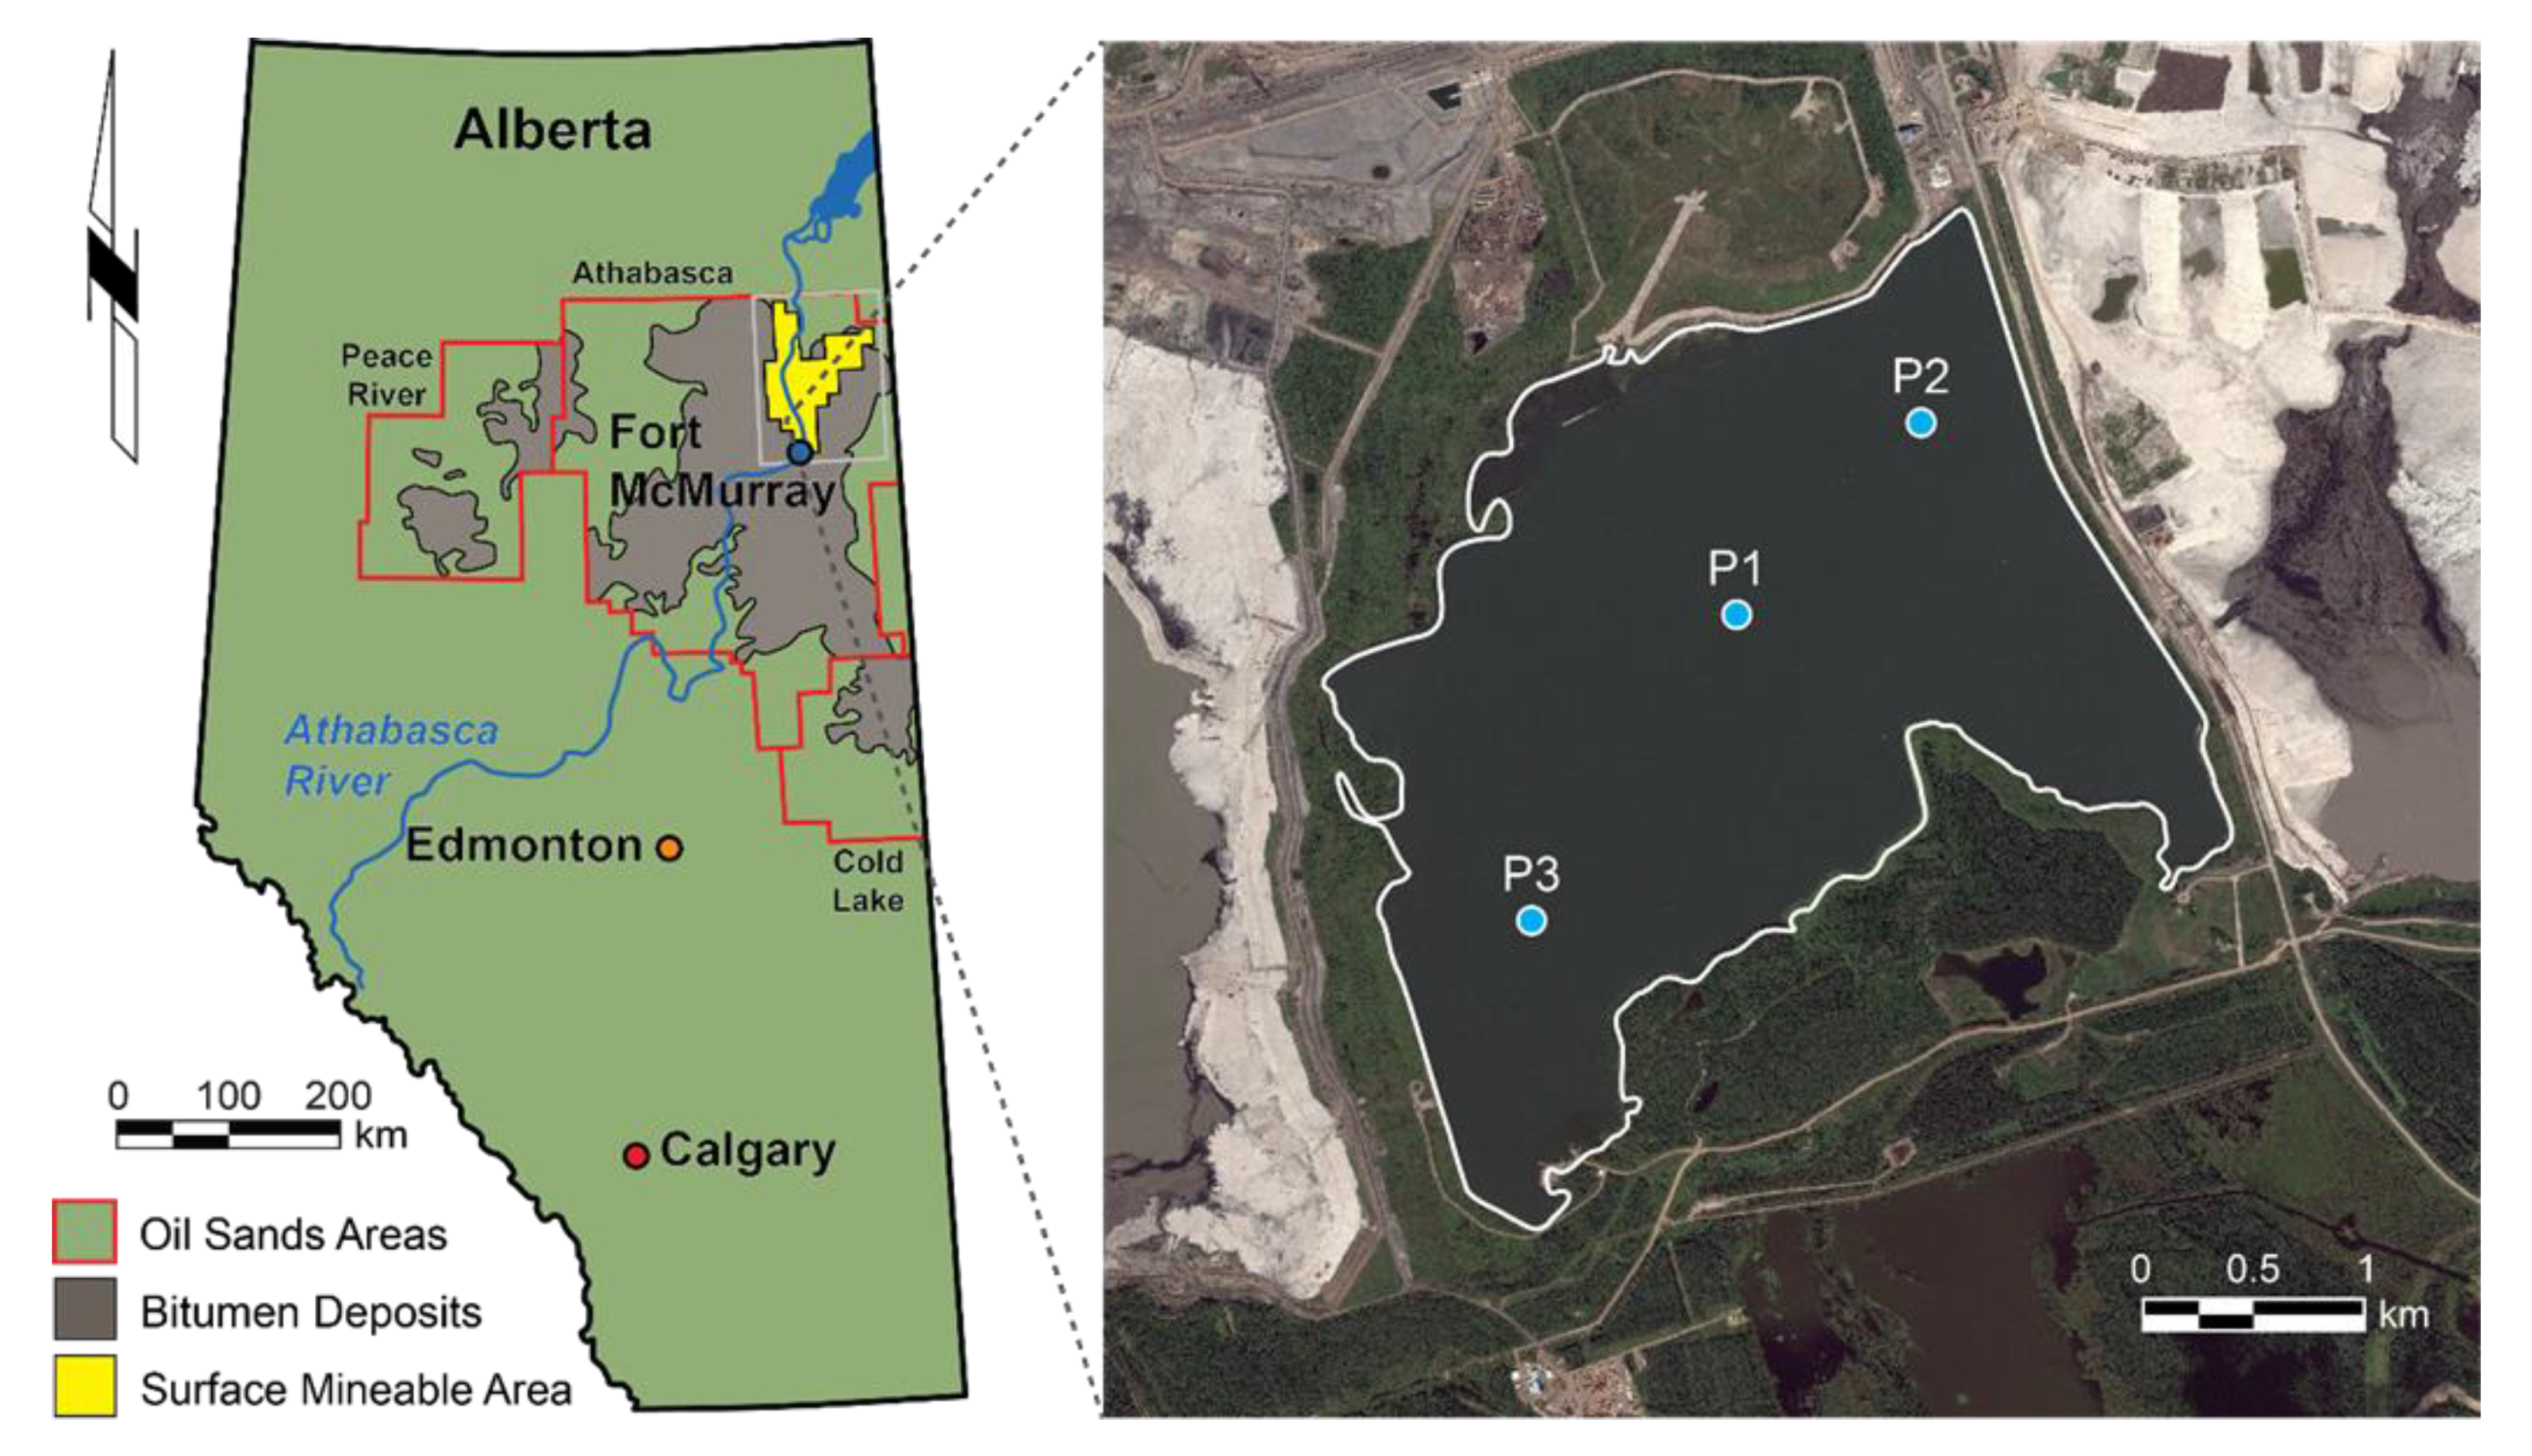
Bitumen extraction from mined oil sands in the Athabasca oil sands region (AOSR) of northeastern Alberta, Canada, generates large volumes of fluid fine tailings (FTT). Various approaches are being developed and implemented to divert FFT from tailings ponds to permanent reclamation landforms [
1]. Water-capped tailings technology (WCTT) involves the permanent storage of FFT under a shallow water column cap, creating pit lakes from exhausted mine pits [
2]. Commissioned in 2012 by Syncrude Canada Ltd., Base Mine Lake (BML) was the first full-scale demonstration of WCTT established in the AOSR. Approximately 23 of these aquatic reclamation landforms are currently planned for the AOSR, and 8 of these will contain tailings [
2]. Ultimately, the long-term success of pit lakes as reclamation landforms is contingent on the effective sequestration of tailings below the water cap, and on the development of conditions that support ecological function as part of a boreal forest ecosystem [
3].
Sustained dissolved oxygen concentrations within the water cap are critical to the long-term viability of pit lakes. Dissolved oxygen is also essential for aerobic respiration and, therefore, the development of a functioning aquatic ecosystem. In addition, oxygen supports the microbial degradation of potentially hazardous organic compounds, such as naphthenic acids (NAs), present in the oil sands' process-affected water and associated with fluid tailings [
4]. However, the oxygen supplied by physical and biological processes can be microbially depleted via reactions with methane and other oxygen-consuming constituents released from fluid tailings [
5,
6,
7]. On the basis of observations from tailing ponds and laboratory studies, microbial methanogenesis is presumed to be continuing to produce methane within the FFT underlying BML [
8,
9,
10,
11,
12,
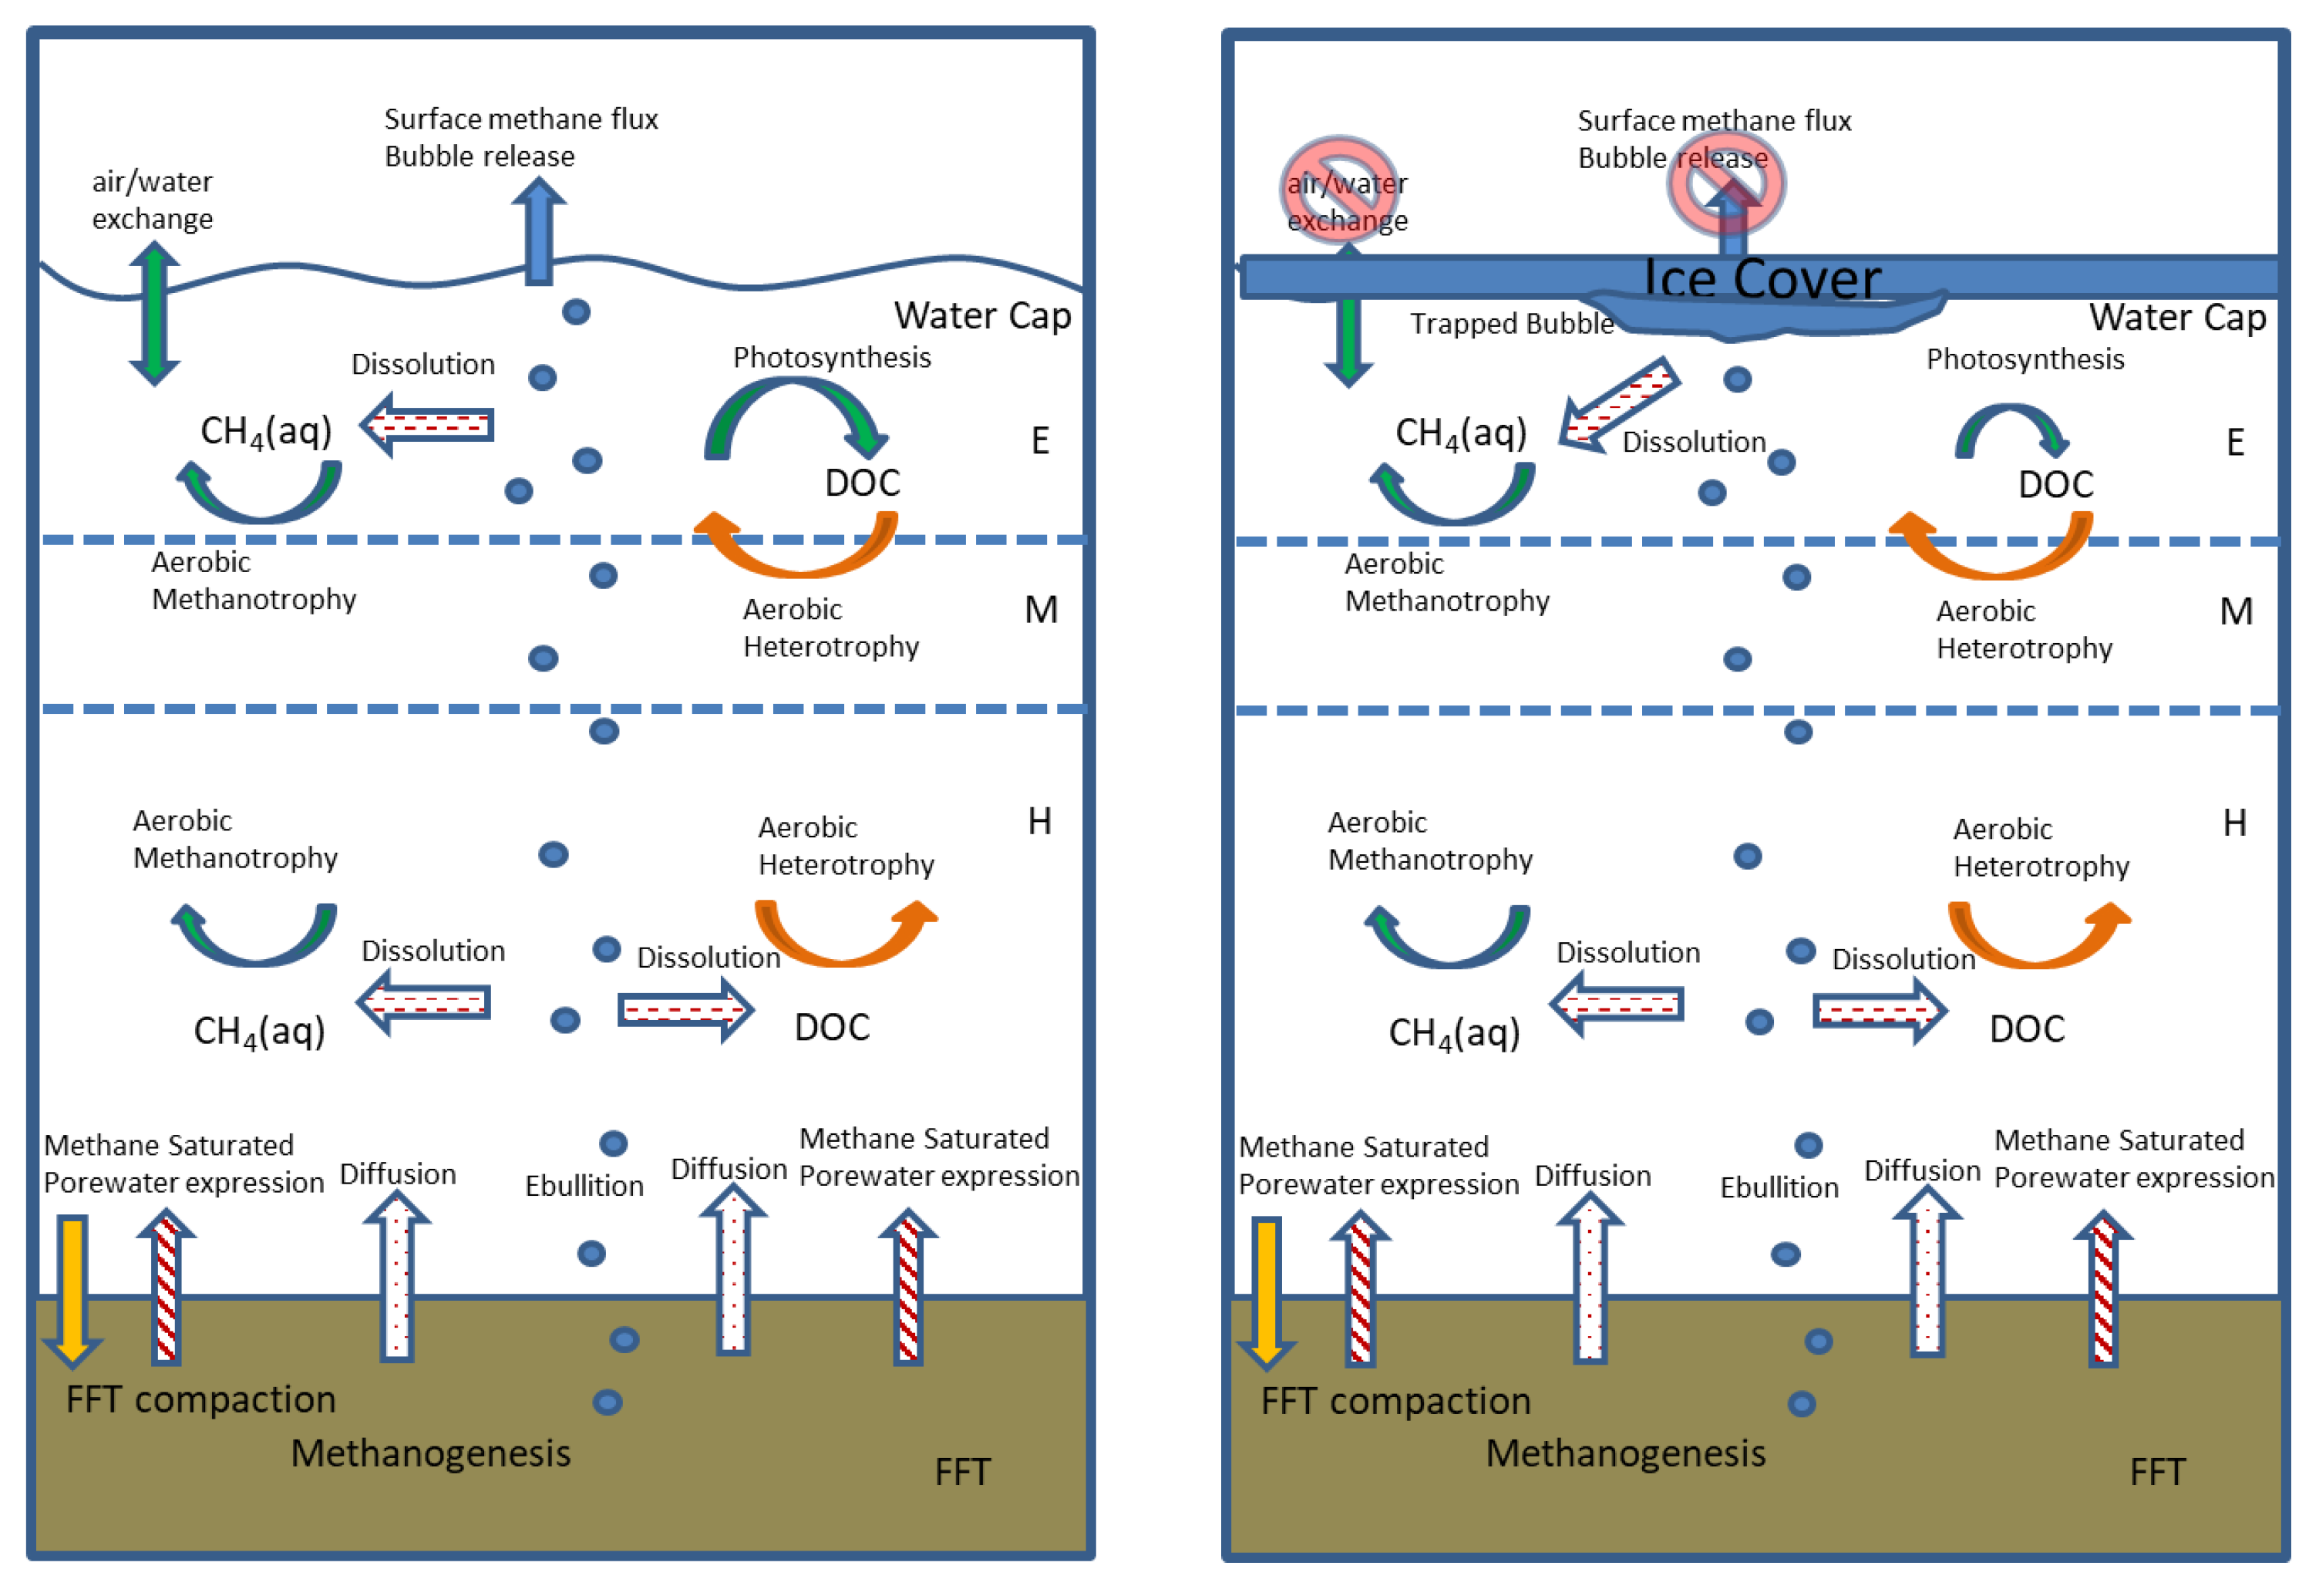
13] (
Figure 1). This methane can be transported to the overlying water cap through three main processes: (1) Advective transport during FFT settlement and dewatering; (2) Diffusive transport across concentration gradients; and (3) The dissolution of gaseous methane from bubbles migrating vertically from FFT through the water cap and released at the lake surface (
Figure 1). Once in the oxic water column, this methane can be consumed via the action of aerobic methanotrophic microbes, or, alternatively, it may partition out of the water column at the air–water interface. The same transport processes can also deliver organic carbon constituents (e.g., residual petroleum hydrocarbons) from the FFT to the water column that may be consumed by aerobic heterotrophic microbes, alongside the heterotrophic consumption of any photosynthetically produced dissolved organic carbon (DOC). Indeed, Risacher et al. (2018), and Arriaga et al. (2019) found that the oxygen concentrations and distribution in the BML water column, during early time points in lake development (2015–2016), were correlated with methane concentrations and the rates of the downward physical mixing of the oxygen supply and depth-dependent consumption. Their results imply that FFT-associated microbial methane production, the mobilization to, and the subsequent oxidation within the water cap, was playing an important role in influencing the oxygen concentrations.
These previous studies highlight the influence of methane on the BML oxygen concentrations and distribution and indicate the need for a greater understanding of the seasonal changes in dissolved methane concentrations, in the role of microbial methane oxidation relative to other carbon and energy sources available to the BML microbial community, and how these factors may have changed over the longer-term BML development trajectory. Such an understanding is important to enabling the assessment and prediction of the lake development, which will inform the sound design and management of future applications of WCTT in the AOSR.
This study used a combination of phospholipid fatty acid (PLFA) and a stable isotopic analysis of methane and PLFA to investigate the methane dynamics within BML. Analysis of the stable isotopic composition of methane, that is, the ratio of heavy-to-light isotopes of carbon (δ
13C) and hydrogen (δ
2H), is a well-established tool that can identify the sources and microbial oxidation of methane in environmental systems [
14]. The ranges of δ
13C and δ
2H can elucidate the methane production pathways [
14], while trends of the isotopic fractionation of methane to values more enriched in the heavier isotopes of carbon can identify the occurrence of methane oxidation [
15].
PLFA are the fatty acid components of membrane lipids produced by bacteria and eukarya [
16], but not by archaea, such as methanogens, which produce predominantly ether-bound membrane lipids [
17]. Total PLFA concentrations can be used, in conjunction with conversion factors, to estimate the abundances of the bacterial and eukaryotic components of environmental microbial communities [
18], while the distributions of individual PLFA can provide insight into the microbial community structure [
16,
19]. In some cases, individual PLFA can be indicative of specific types of organisms, for instance, C16:1ω5t is considered to be a biomarker for Type I and X methanotrophs [
20]. In addition, PLFA analysis can be combined with isotopic analysis such that the δ
13C of PLFA can be used to elucidate the microbial carbon sources and metabolic pathways [
21].
The objectives of this study were to investigate the methane dynamics within BML over four years (2015–2019), including data from under the ice and after the addition of alum (fall 2016) to increase water clarity. Phospholipid fatty acid (PLFA) abundances, biomarker distributions, and stable isotopic compositions were used to identify the occurrence and importance of methane oxidation to the microbial community within the epilimnion and hypolimnion of BML over time. Methane concentrations and isotopic compositions, in conjunction with mass balance modeling, were used to evaluate trends in the methane sources and the extent to which water-cap-associated microbial oxidation was removing the dissolved methane. The addition of alum to BML in the fall of 2016 allowed the study to include a characterization of the microbial community response to a large-scale management perturbation. The results of this study will inform not only the ongoing adaptive management of BML, but also development and management practices for future applications of WCTT.
3. Results and Discussion
3.1. Temporal and Spatial Distributions of Water Column [CH4(aq)] and δ13C-CH4(aq)
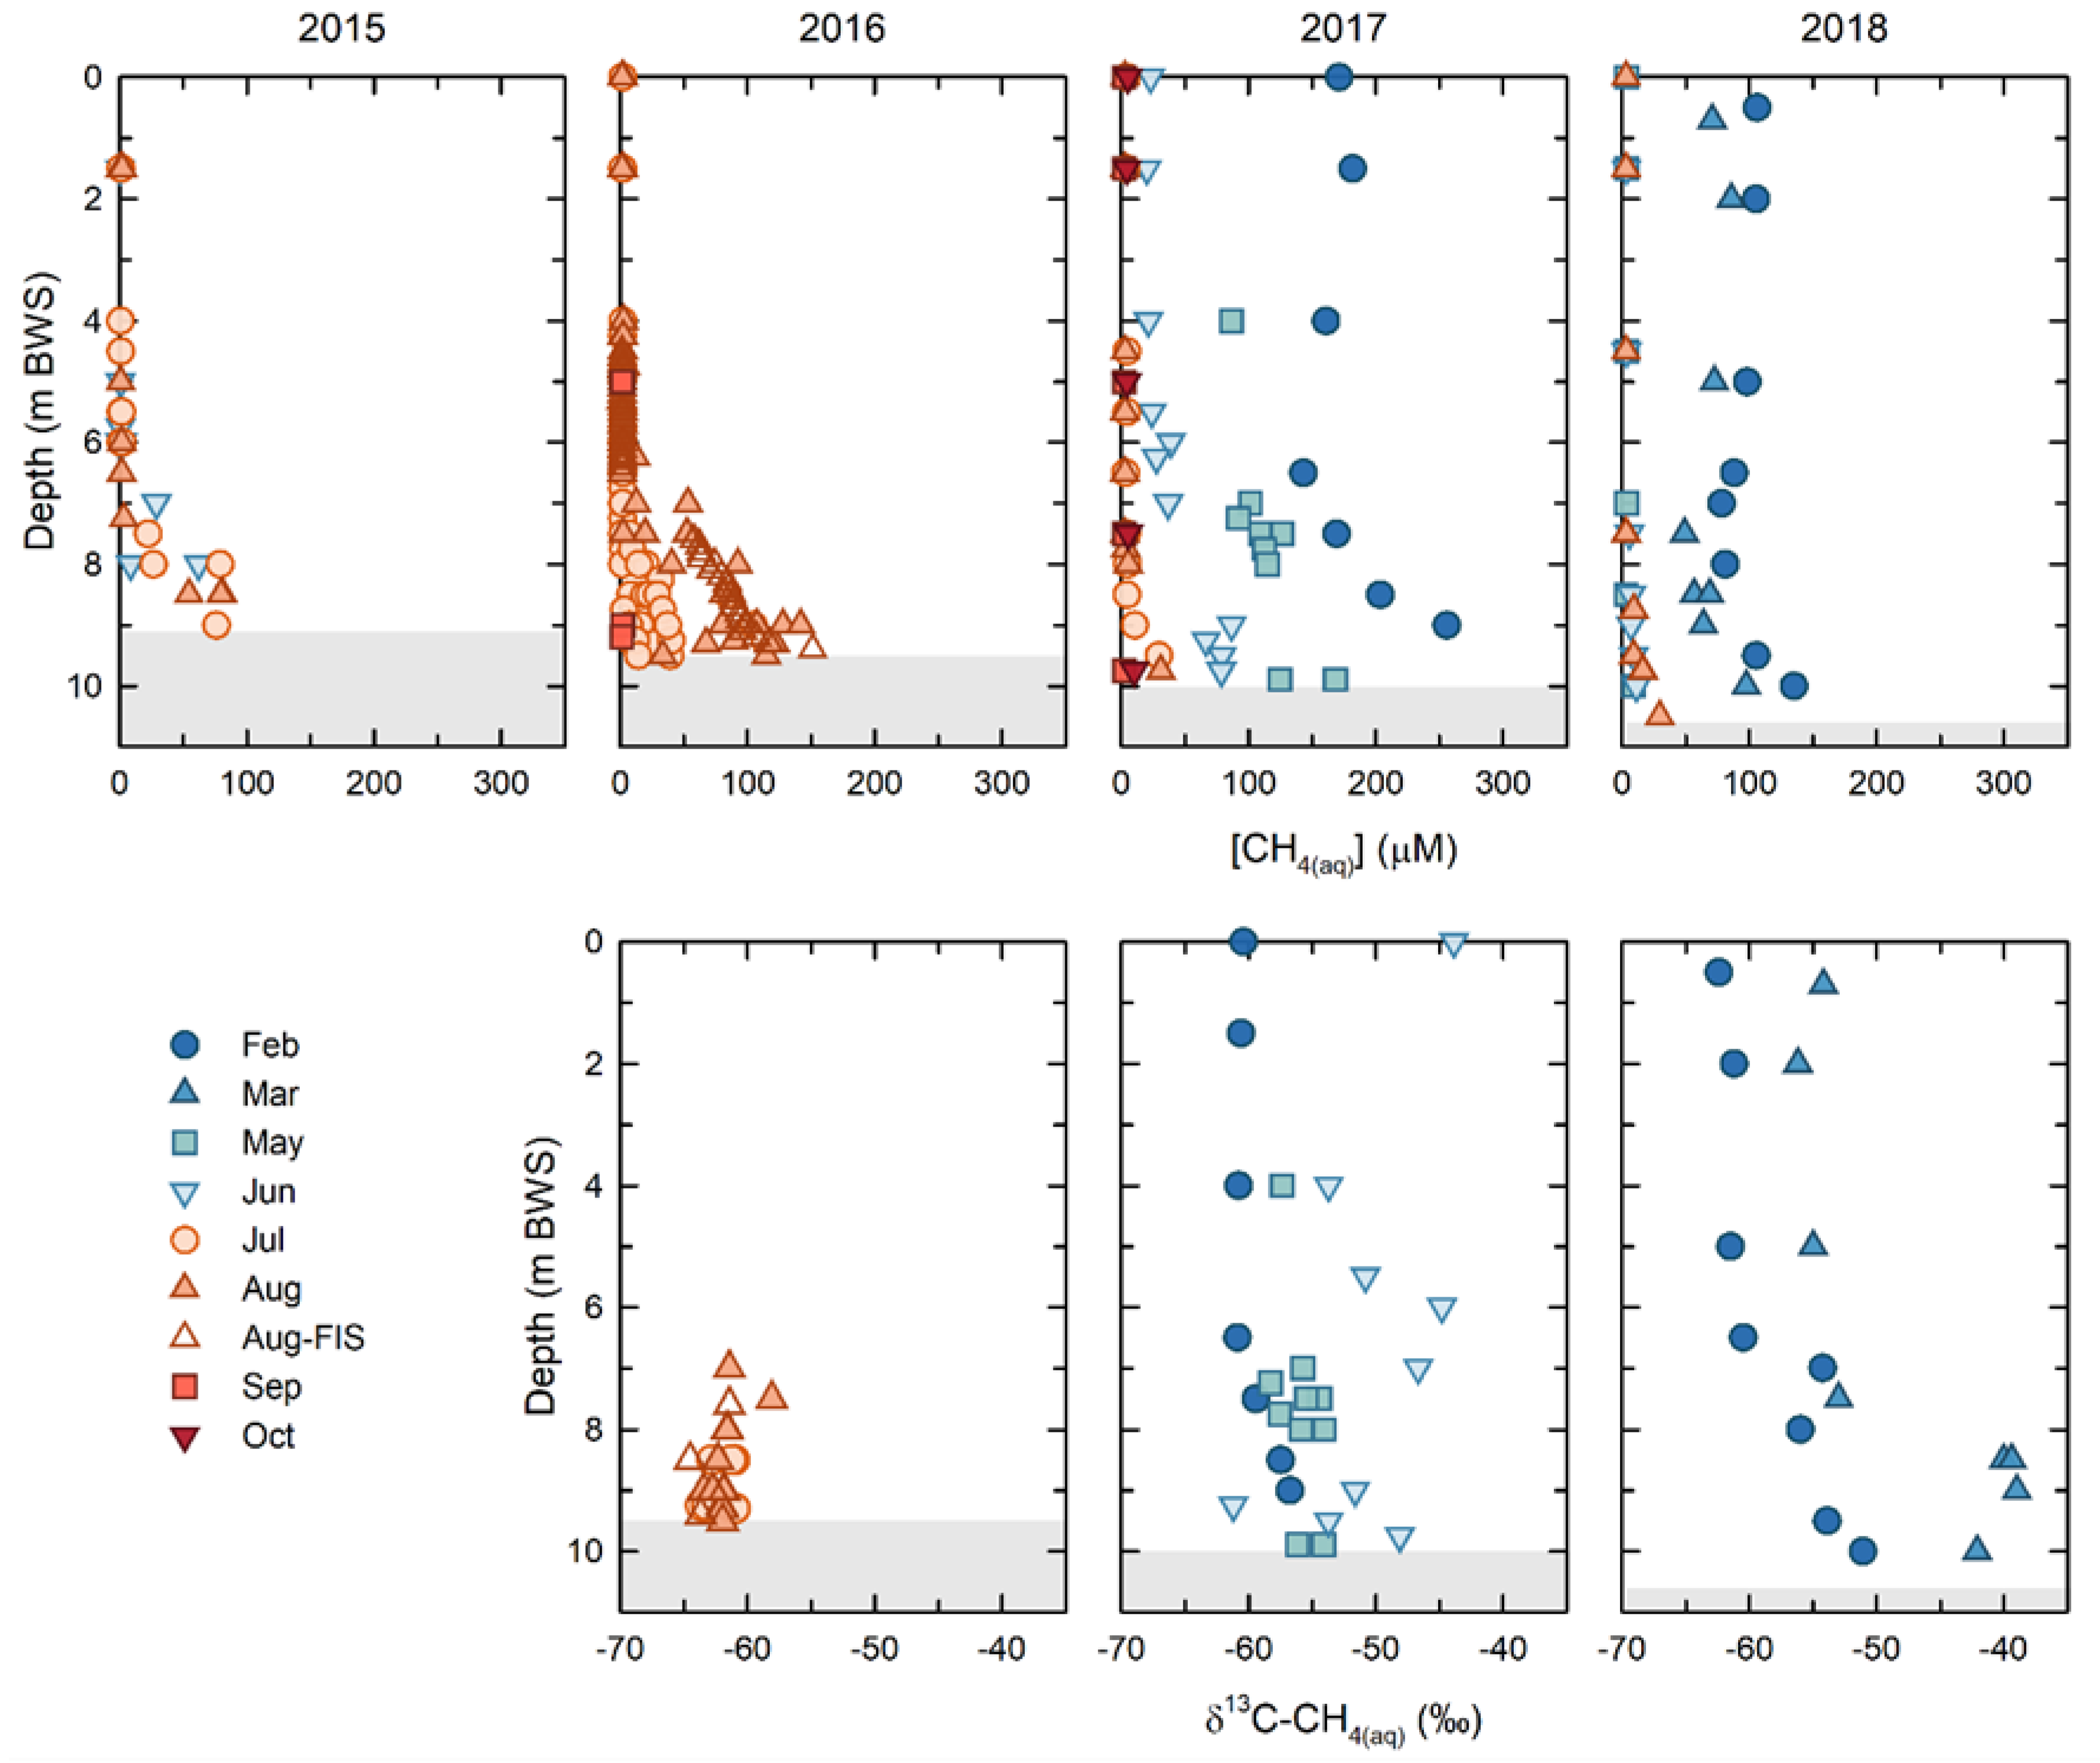
Overall, the [CH
4(aq)] decreased within BML over the course of this study. However, dynamic seasonal and annual trends emerged, particularly between winter ice-covered and ice-free periods. (
Figure 3). The highest [CH
4(aq)], where concentrations were more than 100 μM throughout the water column, were observed under the ice cover for both years that samples could be collected (2017, 2018). With the notable exception of spring 2017, upon the onset of ice-free conditions, the water column [CH
4(aq)] decreased rapidly. The epilimnetic and metalimnetic concentrations decreased to, and remained at, less than 1 μM throughout the ice-free season. The [CH
4(aq)] persisted in the hypolimnion, with the highest concentrations observed at the FWI early in the study (2015: 104 μM and 2016: 150 μM), subsequently decreasing to maximum concentrations of ~29 uM in 2017, and to ~27 uM in 2018. The [CH
4(aq)] were always maximal at the FWI, decreasing away from the FFT up into the water column. The shallowest depth at which methane was present, i.e., the greatest penetration up into the water column from the FWI, also decreased from ~ 6 mbws at the bottom of the metalimnion in 2015 and 2016, to 7.5 mbws in 2017 (metalimnetic—hypolimnetic boundary) and 8.5 mbws (upper hypolimnion) in 2018. The exception to this trend was in the spring of 2017, when dissolved methane persisted in the epilimnion through May (~88 μM) and June (~25 μM), after which it decreased to <1 μM, consistent with other years (
Figure 3). This unique behavior appeared to be related to the alum addition in the fall of 2016. Regardless of the persistence of methane in the spring of 2017, the overall trend was of a decreasing overall total [CH
4(aq)] within the BML water column between 2015 and 2018 (
Figure 3).
Concurrent δ13C-CH4(aq) were only able to be determined for samples with sufficiently high [CH4(aq)] in the sample headspace for accurate detection, which was primarily samples in the hypolimnion in 2016, samples throughout the water column in spring 2017, and samples under ice in 2018 and 2019. The water column δ13C-CH4(aq) in 2016 ranged from −64‰ to −58‰, with a mean of −62.2 ± 1.3‰. In February 2017, the upper water column (epilimnetic) δ13C-CH4(aq) were consistently −60.9 ± 0.2‰ to a depth of 6.5 m, below which they became isotopically enriched as they approached the FWI, reaching a maximum of −57‰. In May and June of 2017, the δ13C-CH4(aq) were generally isotopically enriched relative to February, ranging from −58‰ to −54.5‰. In February and March 2018, the δ13C-CH4(aq) showed similar trends to February 2017. In February 2018, the δ13C-CH4(aq) were again consistent in the epilimnion, with an average value of −61.7 ± 0.8‰ to a depth of 6.5 m, and below this point they became isotopically enriched to a value of −51.4‰, just above the FWI. In March 2018, the trend was similar, however, the δ13C-CH4(aq) showed isotopic enrichment relative to the February data at all depths. The epilimnetic δ13C-CH4(aq) had a mean value of −55.4 ± 1‰ to a depth of 5 m, below which they became isotopically enriched to a value of −42.4‰, just above the FWI.
3.2. Temporal and Spatial Distributions of FFT [CH4(aq)] and δ13C-CH4(aq)
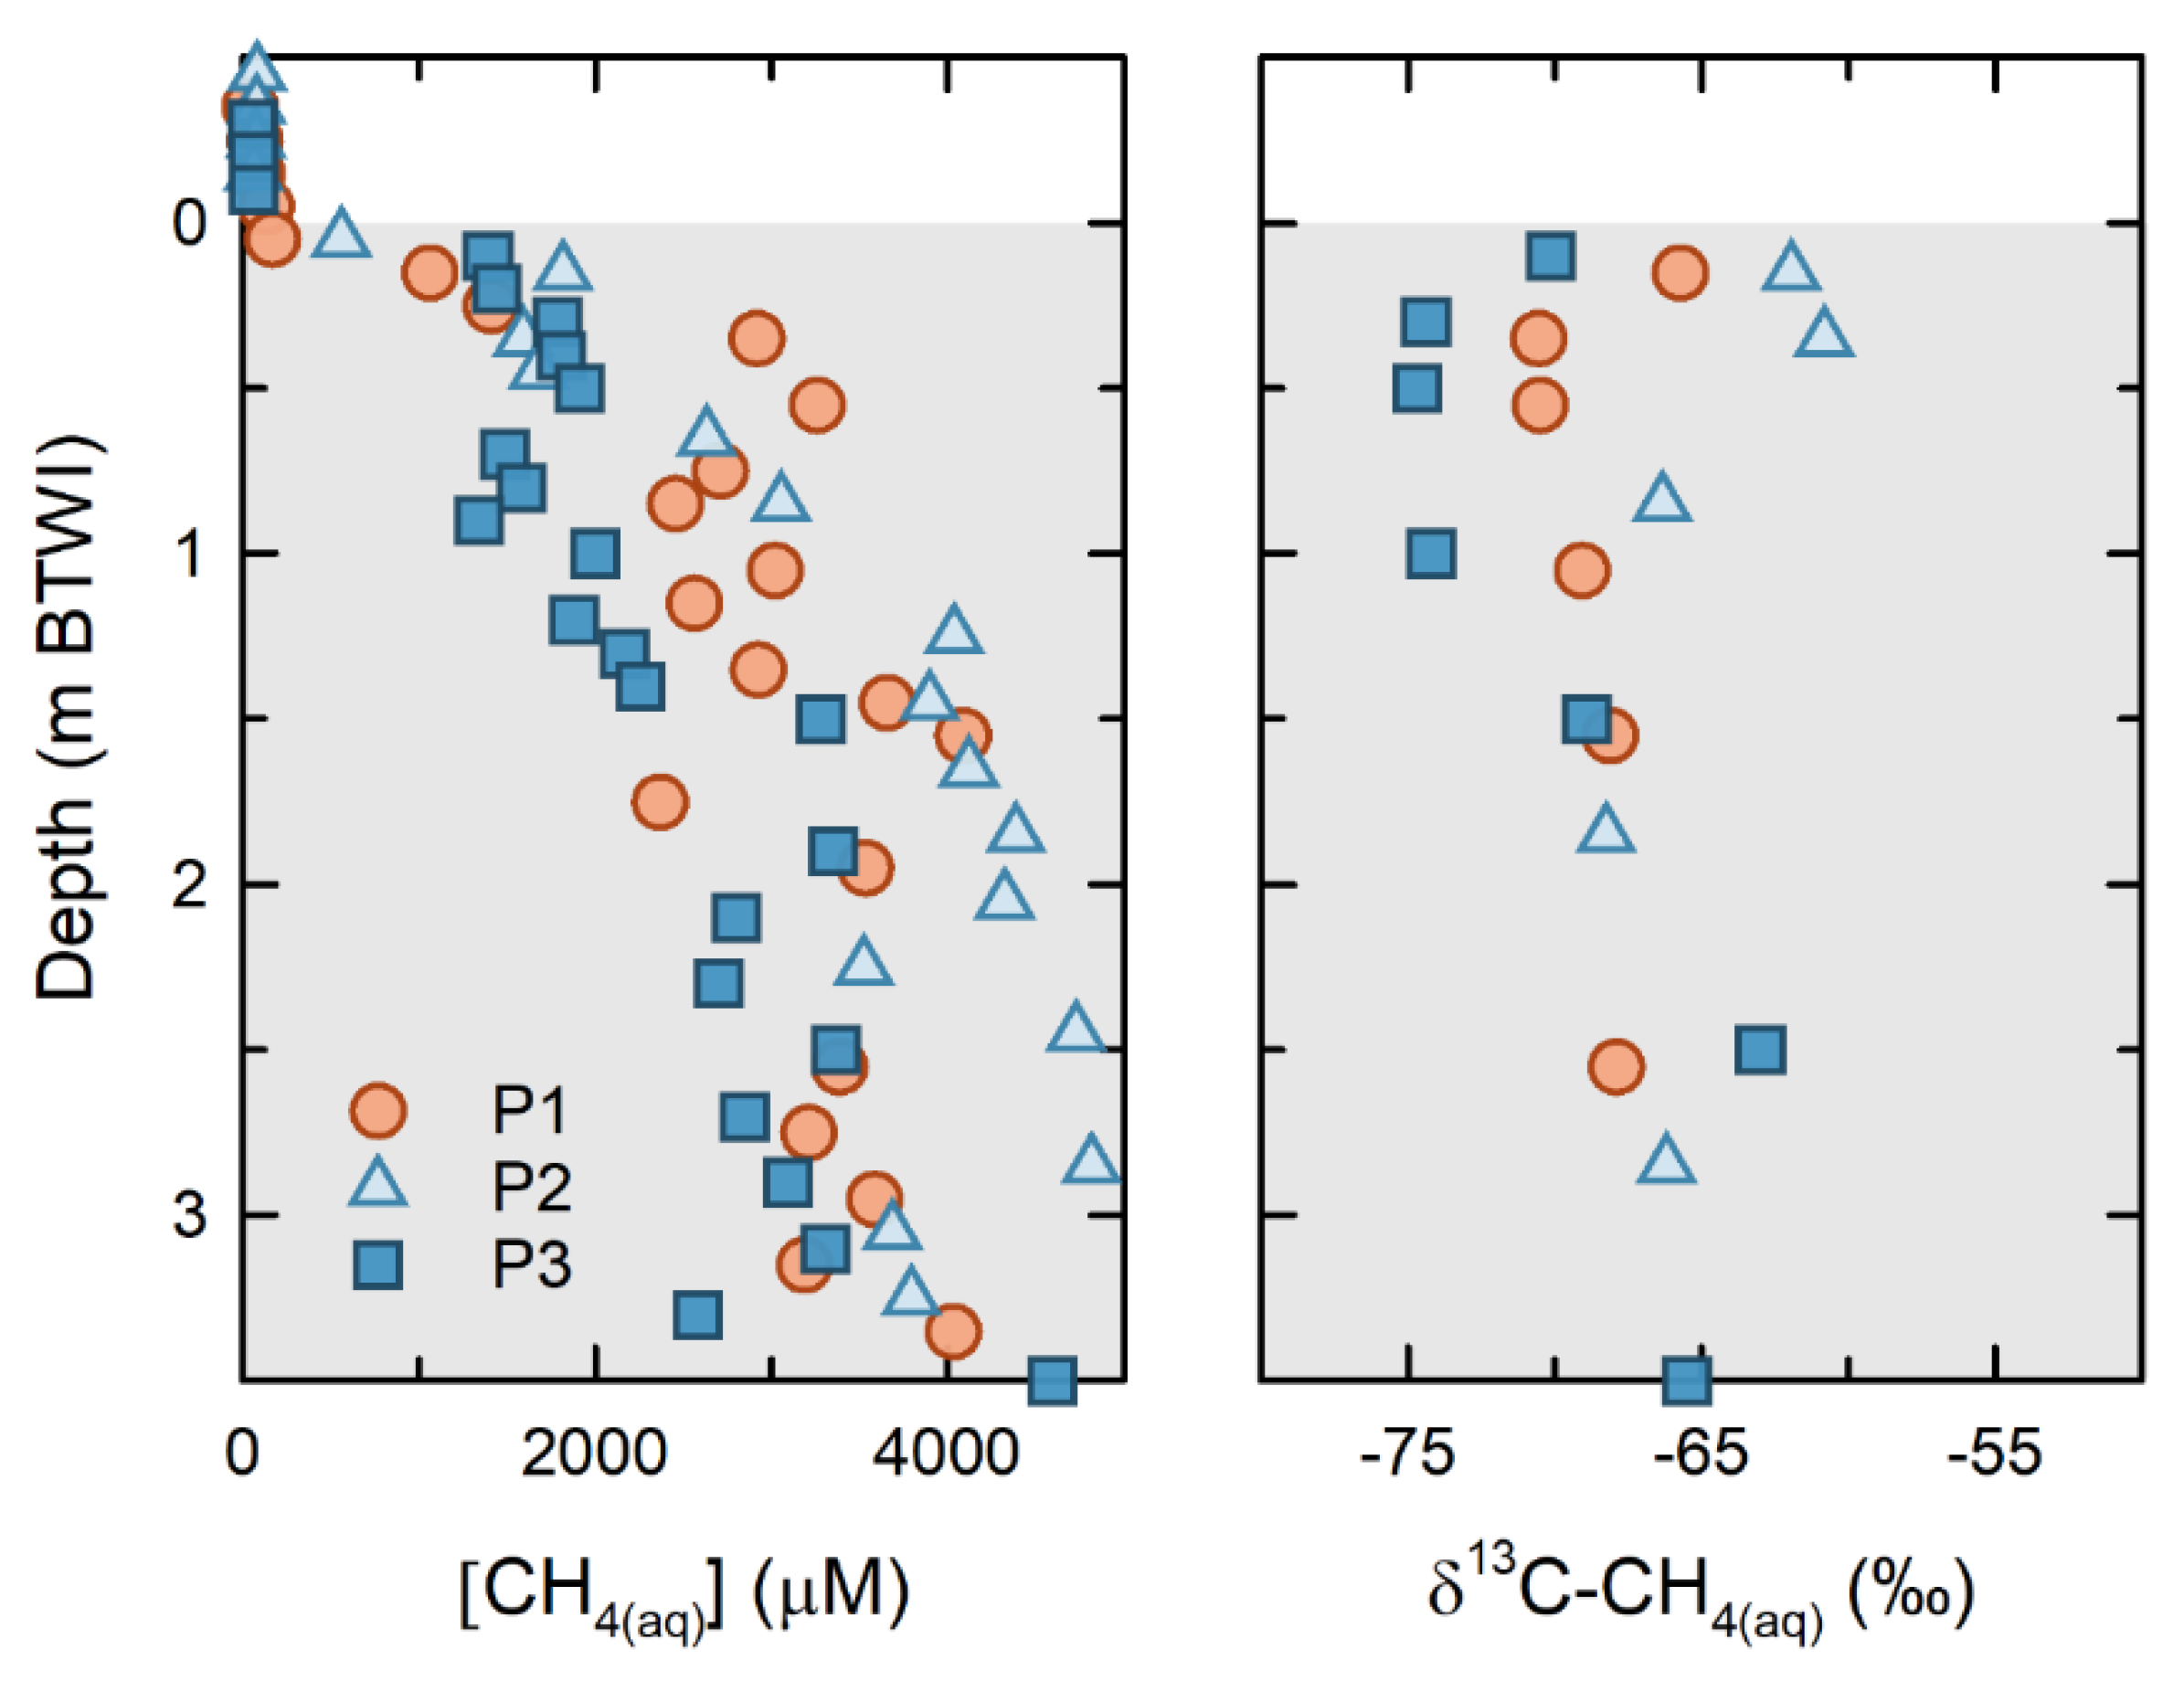
Results from the 2016 and 2017 FFT sampling campaigns show that [CH
4(aq)] increases sharply with depth, from <100 µM near the FWI, to >2000 µM within the upper 1.0 m of the FFT (
Figure 4). From 1.0 to 3.5 m below the FWI, [CH
4(aq)] values range from 2000 to 4000 µM and represent 60 to >80% of the theoretical CH
4(aq) saturation modeled using the measured temperature, pressure, and salinity values [
33]. These thermodynamic models revealed that theoretical CH
4(aq) saturation increased approximately 3000 to 4000 µM with depth over the upper 4 m of FFT (Duan and Mao, 2006).
Concurrent δ
13C-CH
4(aq) at the three platforms showed the greatest variability near the FFT surface, ranging from −74.8‰ to −61‰. Near-surface δ
13C-CH
4(aq) were the most isotopically depleted at P3, and were the most enriched at P2. At depth, the δ
13C-CH
4(aq) for all platforms were less variable, with a range of −69 to −63‰. The Δ
2H-CH
4(aq) for these samples ranged from −289‰ to −326‰ (see
SI Figure S2)
3.3. Temporal and Spatial Trends in BML Microbial Community Abundance and Structure
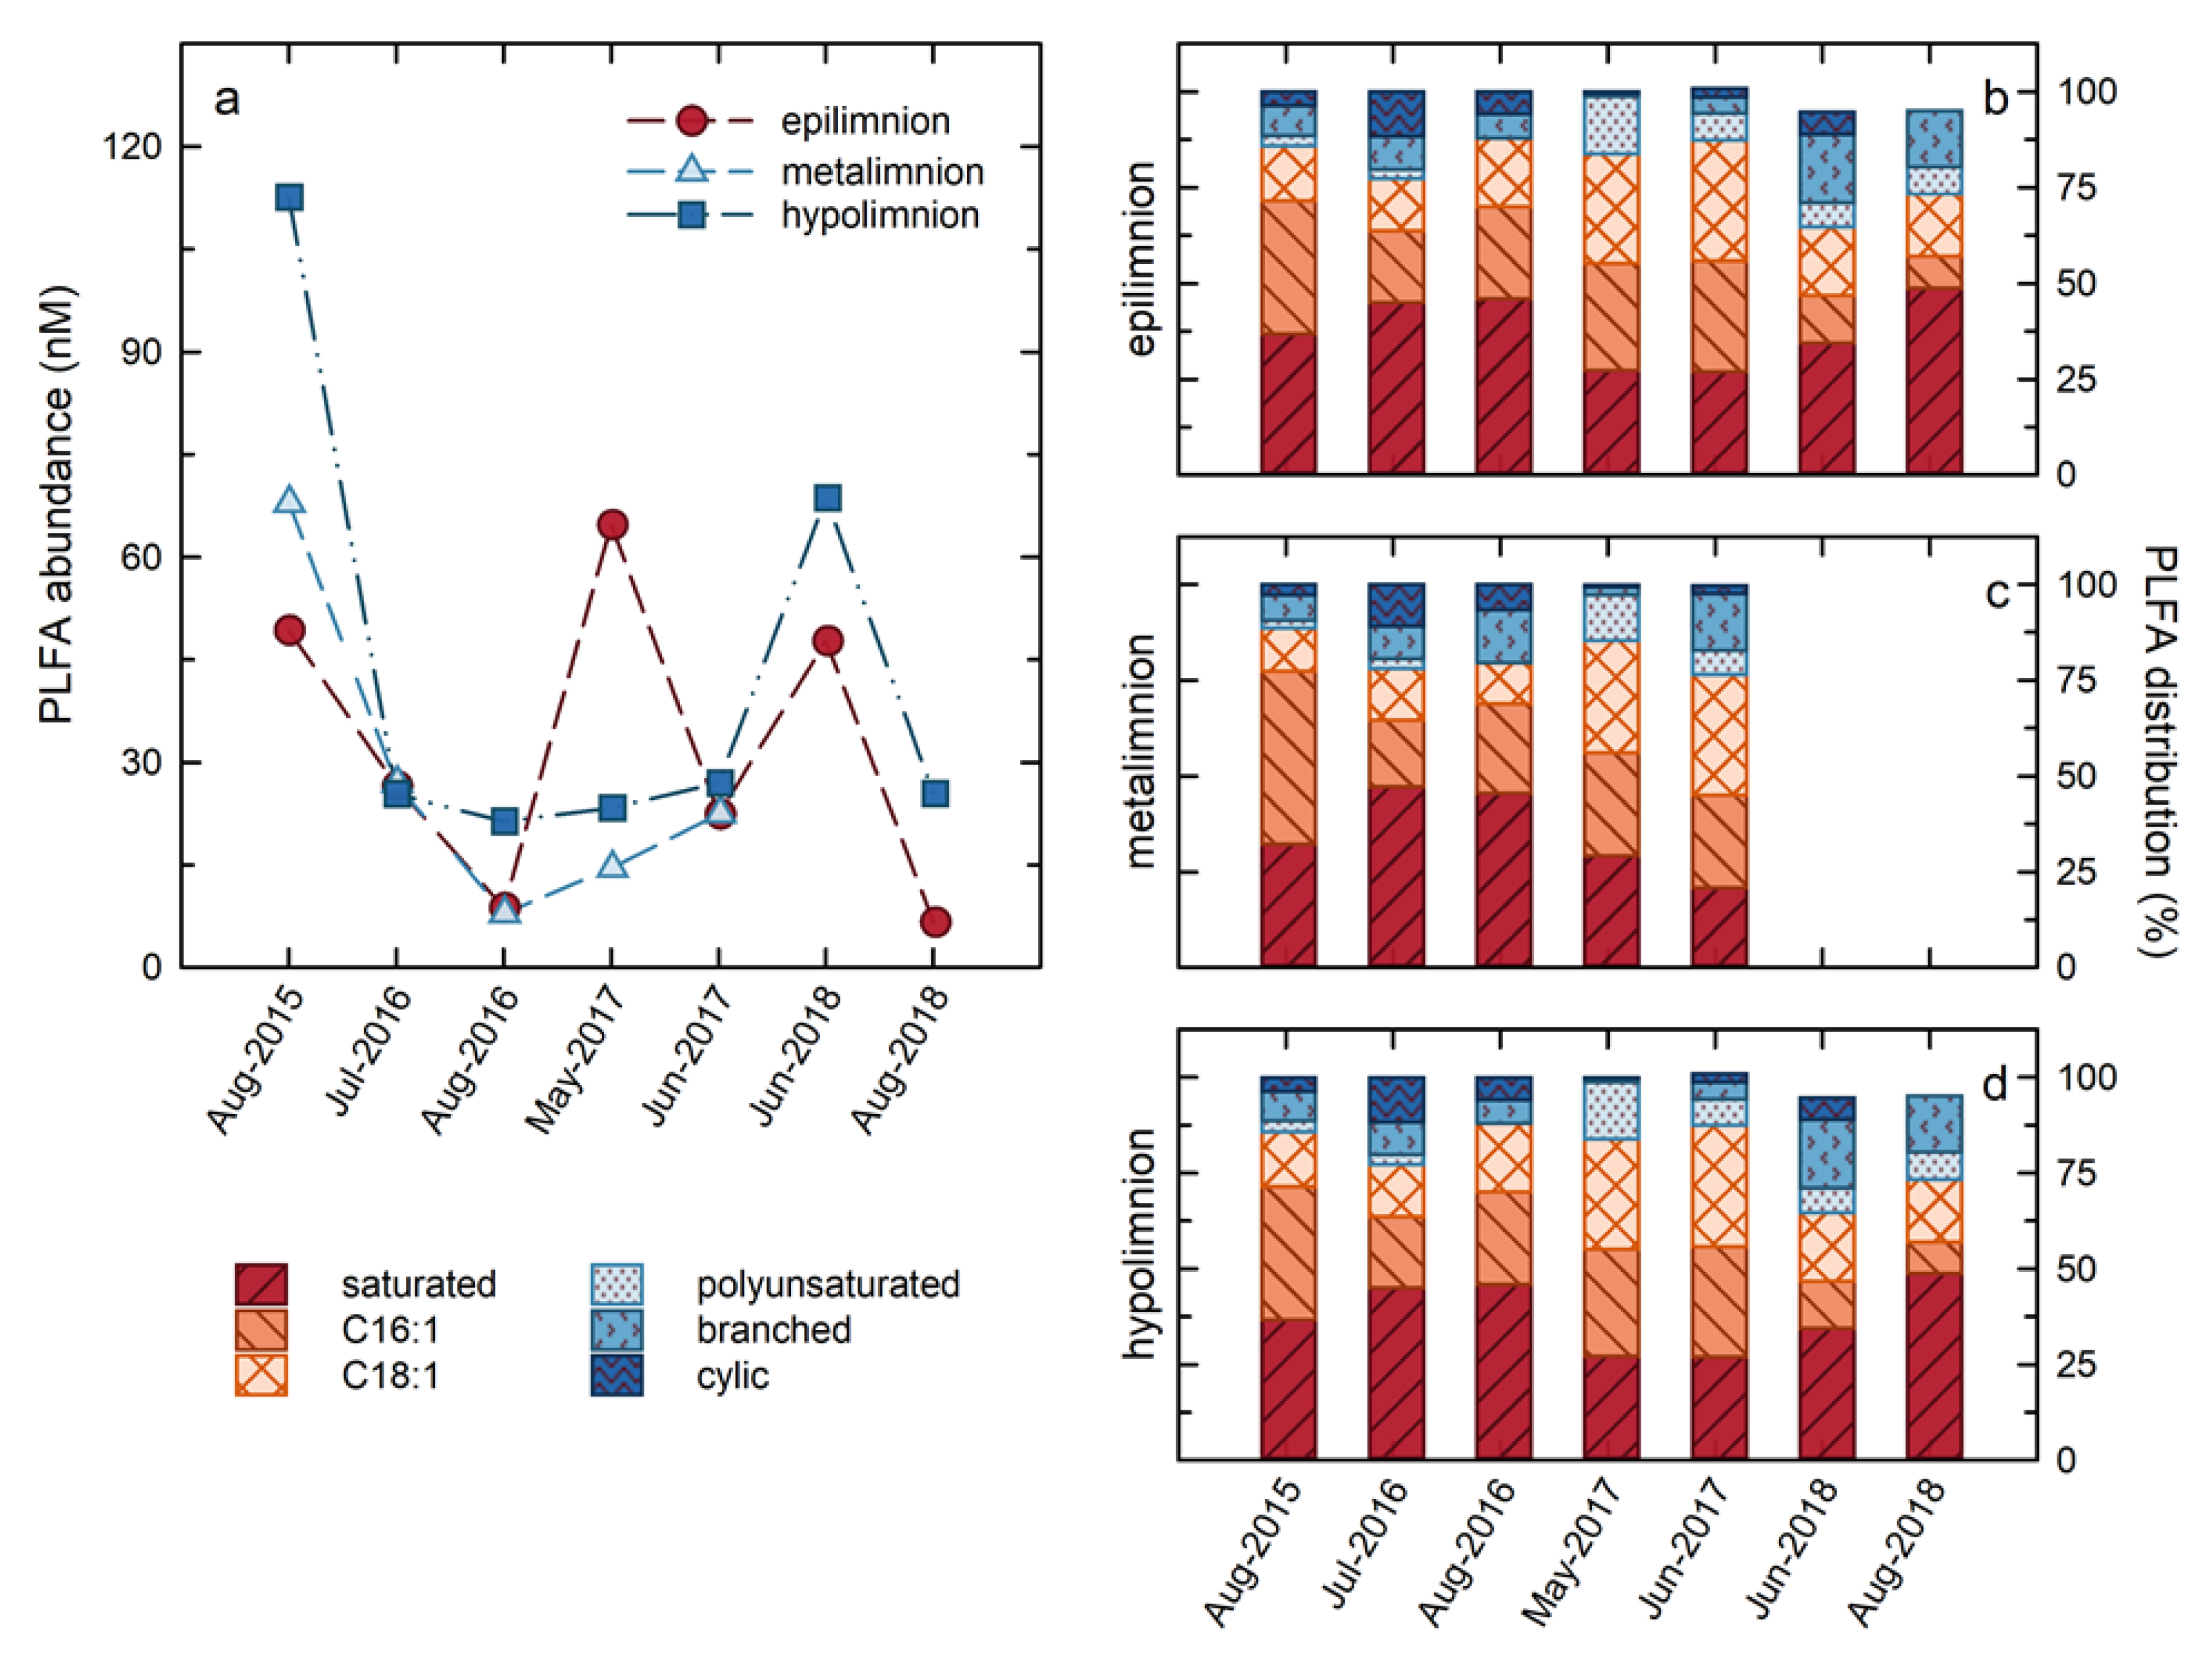
Total water column PLFA concentrations, indicative of cellular abundances, ranged from 5 to 112 µg mL
−1 over the course of the study (
Figure 5), corresponding to estimated cellular abundances of 2 × 10
5 to 5 × 10
6 cells/mL on the basis of a conversion factor of 4 × 10
4 pmol cell
−1 [
18]. These cellular abundances are similar to those reported in lakes ranging from Lake Erie [
34] and Lake Michigan [
35], to temperate lakes in Quebec [
36], and to dystrophic lakes in Poland [
37], as well as Lake Kinneret in Israel [
38]. With the exception of the results for May 2017, the highest PLFA concentrations were consistently observed in the hypolimnion, consistent with the results of Risacher et al. (2018), and Arriaga et al. (2019), identifying the hypolimnion as the most microbiologically active zone in BML (
Figure 5). Generally, the PLFA concentrations followed the same trend in both zones of the lake, with maximum concentrations observed in the earliest summer of the study, July 2015, and subsequently decreasing through 2016, and remaining consistent in 2017, with the notable exception of a spike in the PLFA concentrations observed in the epilimnion in May 2017. In 2018, there was an increase in the total PLFA in both zones in June, followed by a decrease in August 2018.
Variations in the distributions of PLFA in BML also occurred, indicating that the changes in cellular abundances were contemporaneous with changes in the microbial community composition and/or metabolisms (
Figure 5). Sixteen individual PLFA observed within BML were grouped according to their structures into: (i) Saturated PLFA produced by all microbes; (ii) C16:1 unsaturated PLFA (C16:1) that include biomarker PLFA for Type I and X methanotrophs [
20]; (iii) C18:1 unsaturated PLFA (C18:1) that include biomarker PLFA for Type II methanotrophs [
20] and are also produced by autotrophs [
39,
40]; (iv) Polyunsaturated PLFA (PUFA) that are produced by phototrophs and algae [
41]; (v) Branched PLFA that include PLFA considered indicative of heterotrophic organisms, including sulphate reducers [
19,
42]; and (vi) Cyclic PLFA (
Figure 5). Overall, and particularly early in the study (2015, 2016), the PLFA distribution was dominated by C16:1 and saturated PLFA. While C16:1 are not uniquely produced by methanotrophs, these high abundances are consistent with Type I/X methanotrophs comprising a large proportion of the microbial community within BML. Synchronous with the spike in the PLFA abundances in the epilimnion in May 2017 there was the most notable shift in the PLFA distributions as the C18:1 PLFA became the dominant PLFA and the proportion of polyunsaturated PLFA increasing markedly in both the epilimnion and hypolimnion. While C18:1 PLFA are produced by a variety of organisms, they are often associated with phototrophic organisms [
39,
40]. Similarly, PUFA are generally associated with eukarya, including algae [
39]. This increase in the proportions of these PLFA is consistent with the bloom of algae in May 2017 that was indicated by field observations, increased water column Chl-a, and shifts in the microbial community structure, as indicated by genetic analysis in response to the alum addition [
43]. Subsequently, the proportions of the C18:1 and PUFA PLFA decreased in 2018, concurrent with the re-establishment of an increased proportion of branched PLFA, suggesting a shift to an increased presence of heterotrophic organisms. At this time, cyclic PLFA that were present prior to the alum addition, were also re-established, though to a lesser extent than the branched PLFA. The cause of this shift is not clear, but it may related to changing metabolisms or to nutritional or stress conditions [
44]. C16:1 again became the most abundant PLFA in the hypolimnion in 2018, indicating a return to the dominance of methanotrophy. In contrast, saturated PLFA dominated in the epilimnion with C18:1, continuing to be the second most abundant PLFA group, followed closely by branched PLFA. The concentrations of C16:1 in the epilimnion were quite a bit below these groups for all of 2018, suggesting a decreased role of methanotrophic organisms and an increased role for phototrophy and heterotrophy.
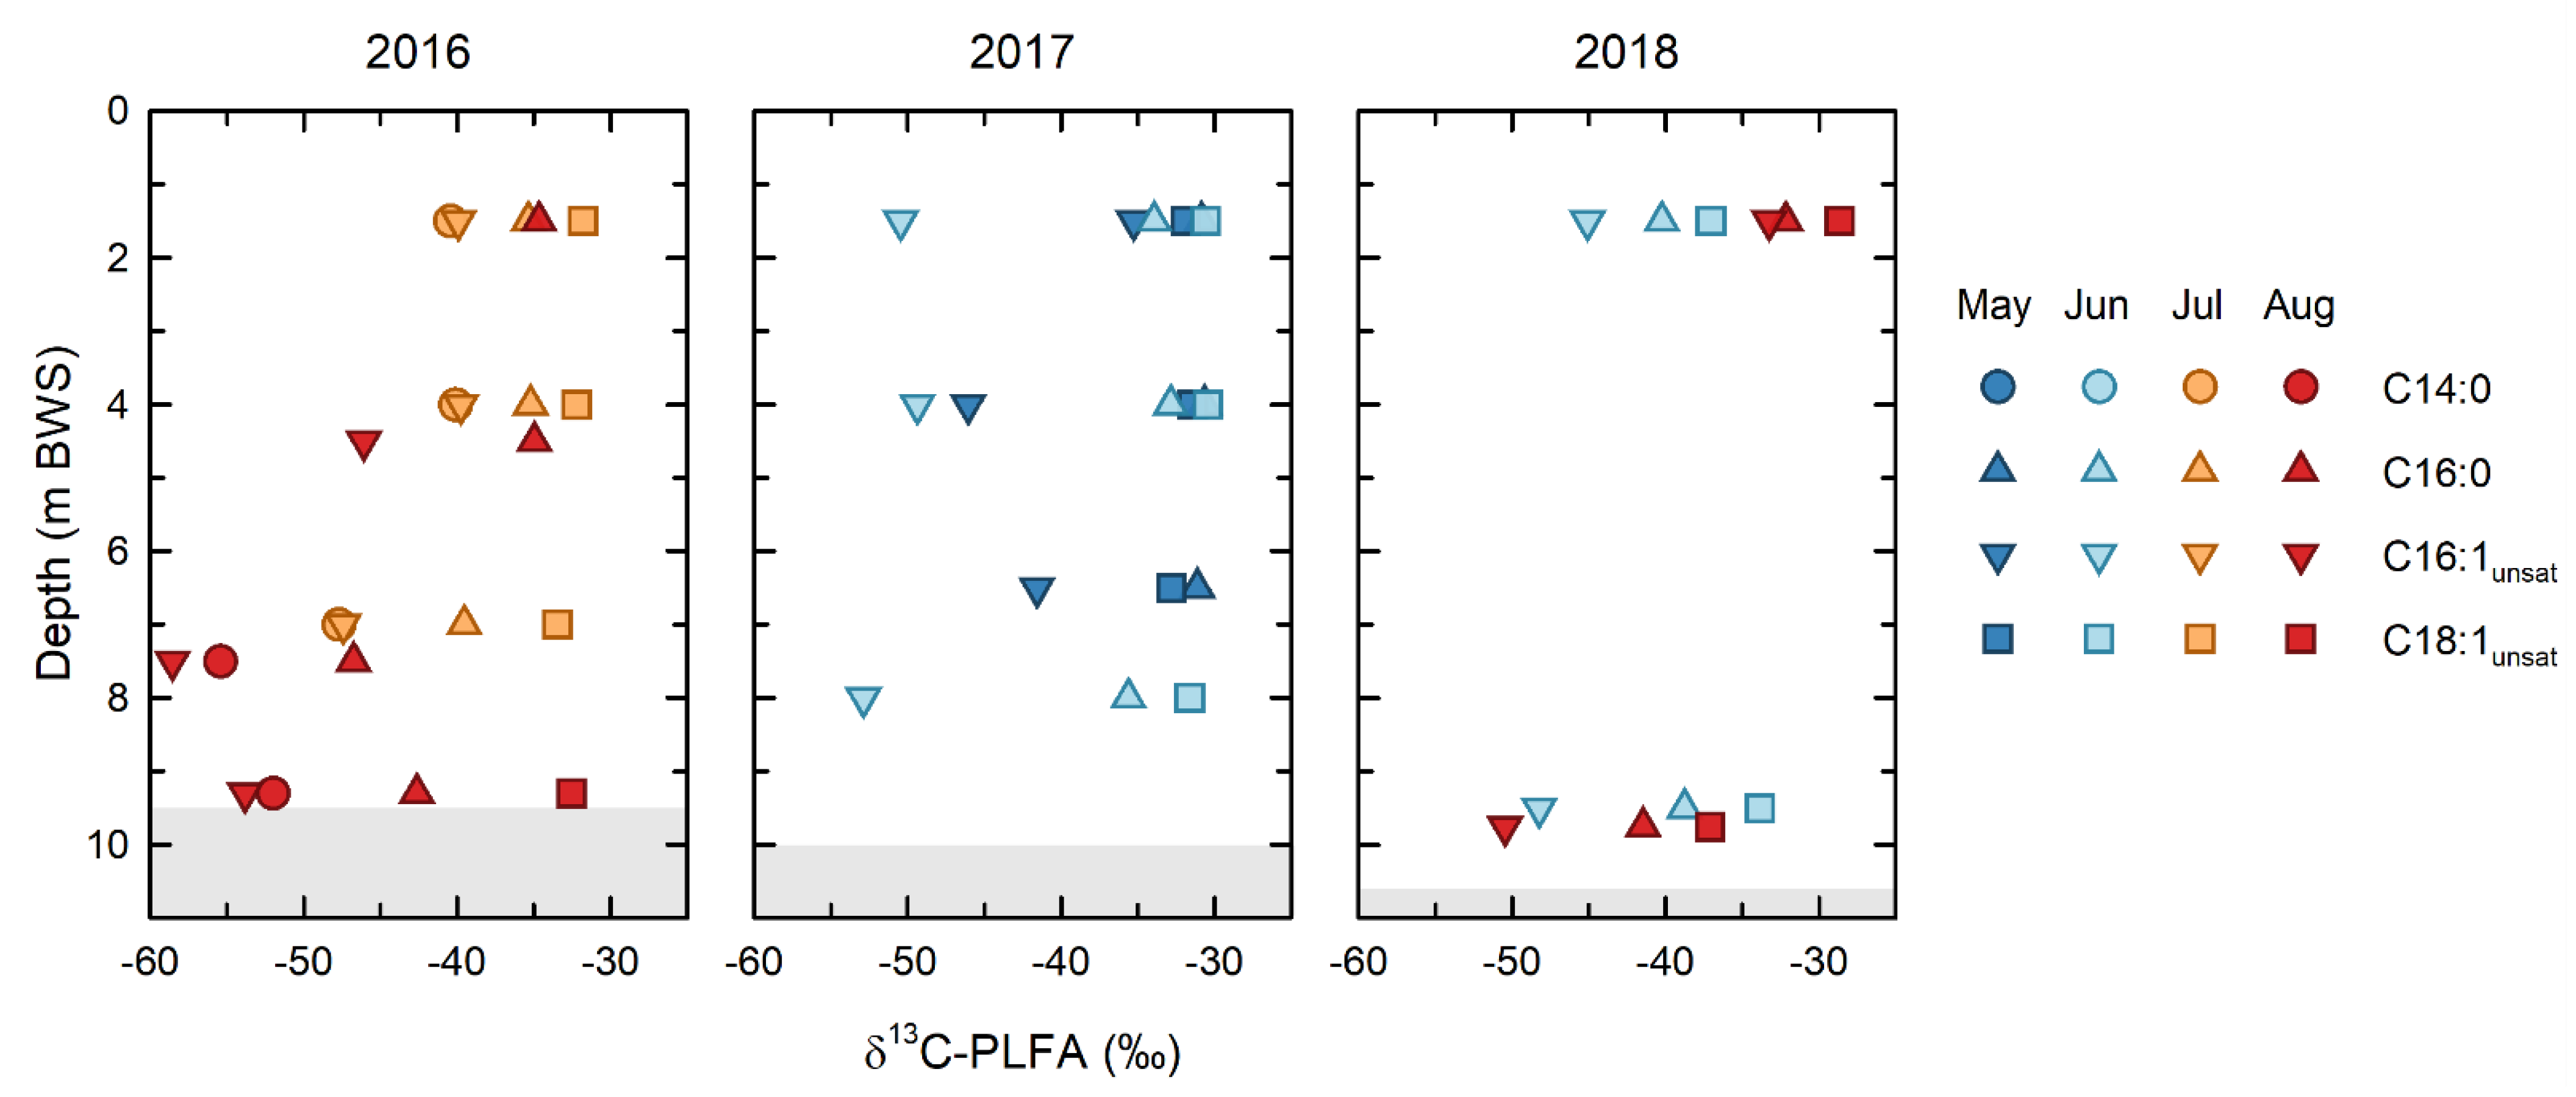
3.4. PLFA Isotopic Evidence of the Role of Microbial Methane Oxidation
The isotopic depletion of the C16:1 PLFA, relative to the C18:1 and C16:0 PLFA (
Figure 6), demonstrated that microbial methane oxidation occurred throughout the water column over the entirety of the study. This interpretation is based on the general patterns of isotopic depletion expected between microbial PLFA and their carbon sources. PLFA produced by heterotrophic bacteria in aerobic environments, such as the BML water column, are generally ~3‰ depleted, relative to their carbon source [
45]. While stronger isotopic depletions are seen in PLFA produced by anaerobic organisms grown under certain conditions [
46], such anaerobic conditions were only observed in the BML water column in August in 2018 [
43]. Because of the strongly isotopically depleted nature of methane, the PLFA of methanotrophs have been shown to be uniquely and strongly depleted in δ
13C, and this can be a unique identifier of methanotrophy [
47]. When applying this PLFA approach in the environment it is important to remember that the δ
13C of an individual, or of grouped PLFA, will be determined by a mass balance of the isotopic compositions of the fatty acids derived from all organisms that produce a particular PLFA. Thus, a ubiquitously produced PLFA, such as C16:0, reflects an isotopic mass balance of all the organisms present in the community; similarly, the isotopic composition of pooled PLFA represents a mass balance of all the organisms producing PLFA included with the pool.
Despite the potential for multiple sources to contribute to both the individual and pooled PLFA analyzed, the δ
13C PLFA data show clear evidence of microbial methane oxidation throughout the BML water column. The δ
13C of the C16:1 PLFA (δ
13C = −59 to −40‰), which include the biomarker PLFA for Type I/X methanotrophs, was consistently the most depleted throughout the study. The most depleted end of the range of the C16:1 PLFA δ
13C values closely approached the isotopic composition of the FFT methane endmember (δ
13C = −61‰). In addition to this signature, the δ
13C C14:0 PLFA (δ
13C = −55 to −40‰), also produced in high proportions by Type I/X methanotrophs, see Ref. [
20], were strongly depleted in 2016, when they could be measured. Such isotopic depletion of C16:1 PLFA in the groundwater near oil sands tailings ponds has previously been attributed to the uptake of a δ
13C-depleted substrate, such as methane [
48].
In contrast, the of C18:1 PLFA reflected the presence of a distinct component of the microbial community that was not utilizing methane-derived carbon, indicating that type II methanotrophy is not occurring in this system. The C18:1 PLFA were the most isotopically enriched and the most isotopically consistent PLFA over the course of the study, with a mean δ
13C of −33.0 ± 2.0‰ and a range of only −32 to −33.6‰ across all depths for all years, with the exception of 2018, where δ
13C C18:1 PLFA became slightly depleted (δ
13C = −37‰) in the epilimnion in June, and the hypolimnion in August. The δ
13C of C18:1 PLFA of −33.0 ± 2.0‰ is consistent with the heterotrophic utilization of a carbon source with a δ
13C of ~−30‰ [
49], and, thus, represents a component of the microbial community utilizing dissolved organic carbon sources, such as petroleum hydrocarbons from the underlying FFT, which have elsewhere been shown to be ~−30‰ [
50], and/or photosynthetically produced organic carbon.
The relative contribution of these two end-member microbial carbon sources/metabolisms to the microbial community can be evaluated using the δ13C of the C16:0 PLFA, which lie intermediate between these two groups for almost all samples. As noted, C16:0 PLFA are produced by all organisms and, thus, reflect a mass balance of the isotopic compositions of the PLFA making up the microbial community. Therefore, the extent to which the C16:0 PLFA are comparable to one or other of the endmembers reflects the relative contribution that endmember is making to the overall microbial community. The most strongly depleted δ13C of C16:0 PLFA indicated that methane oxidation was making the greatest contributions to the overall microbial carbon cycling in the hypolimnion in 2016, consistent with the observation by Arriaga et al. (2019) and Riacher et al. (2018) that methane oxidation was occurring in this zone. While the extent of the isotopic depletion of δ13C of C16:0 PLFA was smaller, it continued to be isotopically depleted with respect to δ13C C18:1 PLFA at almost all depths and timepoints throughout the study, echoing the isotopic depletion of the C16:1 PLFA, reinforcing that methane oxidation was an important and recognizable component of microbial carbon cycling.
3.5. Extent of Microbial Methane Oxidation
The extent of the impact of methane oxidation in removing dissolved methane from the water column can be evaluated using the observed shifts in δ
13C-CH
4(aq) for the timepoints where it could be measured. The isotopic compositions of methane within the FFT determined in 2016 were δ
13C-CH
4(aq) = −75 to −61‰ (
Figure 4), and δ
2H-CH
4(aq) = −343 to −289‰ (
Figure S2 in "Supplemental Information"), indicative of microbial methane production by fermentative pathways [
14]. While it was not possible to assess the controls on the range of δ
13C-CH
4(aq) within the FFT with the data available, if it is assumed that the observed range is representative, then isotopic enrichment above this range within the water column can be considered to indicate the occurrence of fractionation during microbial methane oxidation [
15].
Where concentrations were sufficient for analysis, the water column δ
13C-CH
4(aq) ranged from values equivalent to the most isotopically enriched FFT values (δ
13C-CH
4(aq = −63 to −61‰), to values as enriched as −45‰. The most isotopically enriched water column δ
13C-CH
4(aq) values were generally observed close to the FFT, particularly in winter 2018, though isotopic enrichments were observed throughout the water column between successive sampling events in winter 2018 and in spring 2017 (
Figure 3).
The extent to which microbial methane oxidation was influencing the observed trends in the BML water cap [CH
4(aq)] can be assessed by applying a Rayleigh fractionation model to the δ
13C-CH
4(aq). Using the isotopic shift in the δ
13C-CH
4(aq) values between two sampling points, and assuming an enrichment factor (ɛ) of 30‰ as representative for aerobic methanotrophy [
15], the modeled fraction of methane remaining (f
iso) can be compared to the observed changes in the concentration (f
obs) (
Table 1a,b). Applying this approach to the February and March 2018 data yielded estimates of methane oxidation based on changes in the δ
13C-CH
4(aq) that were within 15% of the observed differences in [CH
4(aq)]. This agreement indicates that the observed changes in [CH
4(aq)] were predominantly the result of microbial methanotrophy occurring under the ice, with a net rate of 1.0 ± 0.3 μM d
−1.
The same approach enabled the extent of methane oxidation that had occurred at the FWI to be assessed. Assuming an initial δ
13C-CH
4(aq) of −61%, on the basis of the most enriched value observed within the FFT (
Figure 4,
SI Figure S2), the Rayleigh model indicated that the fraction of initial methane remaining in the samples just above the FWI in February 2017, and in February and March 2018, was 0.7 and 0.52, respectively, equivalent to an oxidation of 30 to 48% of the initial methane concentrations. Thus, without the occurrence of microbial methanotrophy at the FWI, the [CH
4(aq)] would have been 1.3 to 2 times higher than what was observed at these times.
The persistence of methane throughout the water column in spring 2017 allowed the contribution of methane oxidation to be differentiated from the nonisotopically fractionating processes of methane loss, such as air-partitioning (
Table 1b). Between February and May 2017, the model estimated a fraction of the methane remaining (f
iso) of a 0.88 to 0.91 equivalent to a loss by microbial oxidation of 9 to 12%, far lower than the observed decrease in [CH
4(aq)] of 18 to 48% (f
obs = 0.52 to 0.82;
Table 1b). Similarly, between May and June 2017, the fractionation-based estimates for microbial oxidation (8 to 26%: f
iso = 0.92 to 0.74) exhibited even greater deviation from the observed methane loss (47 to 81%: f
obs = 0.19 to 0.53;
Table 1b). The fact that methane oxidation can only account for 23 to 45% of the observed loss between February and May, and 15 to 37% of the observed loss between May and June implies an equally important, if not greater, role for nonfractionating processes, such as air-water partitioning, in methane loss from the epilimnion over this interval. Air-water partitioning losses would be expected to occur annually at spring thaw and, in conjunction with the release of methane bubbles trapped beneath the ice, are likely responsible for the maximum fluxes of methane from the surface of BML observed by the eddy covariance measurements [
32].
In addition to identifying the role of air-water partitioning, the isotope-based assessment of methane oxidation also indicated that the rate of net methane oxidation between February and May (0.22 ± 0.02 μM/day) was nearly an order of magnitude lower than that calculated for May to June (1.1 ± 0.4 μM/day), the latter being consistent with the rate calculated for February to March 2018. This low rate of methane oxidation between February and May 2018 suggested a large decrease in the oxidation capacity that may not only be related to decreased water temperatures, but that may also potentially be related to a decrease in the pelagic methanotrophic microbial community after the alum addition in the fall of 2016 (Jessen et al., this issue).
3.6. Assessment of Methane Source Contributions
The PLFA and methane isotopic data provide clear evidence of microbial methane oxidation throughout the BML water column over the course of the study. Thus, the observed dissolved methane concentrations were the net outcome of the balance between the methane inputs and oxidation and imply that methane inputs were, in fact, larger than indicated by the measured BML water-column dissolved methane concentration data. The complete dataset, including the FFT methane concentrations collected in 2016, enabled the potential inputs related to: (i) The advection of porewater during FFT compaction; (ii) Molecular diffusion; and iii) The dissolution from bubbles (
Figure 1) to be assessed.
The [CH
4(aq)] profiles were consistent, with the underlying FFT being the dominant source of CH
4(aq) to the water column, indicating that the advection of FFT porewater and/or molecular diffusion were the dominant sources. This is consistent with the observations of Dompierre et al. (2017), which identified the advection of FFT porewater as the primary source of chloride to the BML water column. Using the 2016 FFT porewater [CH
4(aq)], and the rate of FFT-settling, calculated by Dompierre et al. (2017), of 0.73 m a
−1 (Dompierre et al. 2017), the mass loading of methane due to porewater advection was calculated to be the dominant source of CH
4(aq) at 4.6 × 10
6 to 1.8 × 10
7 moles a
−1, (equivalent to 55 to 220 metric tons of carbon per year) (
Table 2). By comparison, the mass loading of CH
4(aq) by molecular diffusion from the FFT porewater, calculated using Fick’s law, ranged from 5.0 × 10
5 to 8.7 × 10
6 mol a
−1 (6 to 104 metric tons of carbon per year) (
Table 2). Notably, the upper end of this estimated range overlapped with the lower end of the range calculated for FFT porewater advection, indicating that molecular diffusion was potentially also an important source of CH
4(aq) to the hypolimnion in 2016. Since porewater advection due to FFT compaction is expected to decrease over time [
52], molecular diffusion may become the dominant mechanism transporting CH
4(aq) to the hypolimnion in the future.
While advection and diffusion were the dominant sources of CH
4(aq) to the water column, the ongoing occurrence of ebullition represents another potentially important source. Using the model of Leifer and Patro (2002), the mass loading of methane to the water column, due to dissolution from bubbles during ebullition, was estimated to be 1.8 × 10
5 to 4.7 × 10
6 mol a
−1 (2.1 to 56 metric tons of carbon per year) (
Table 2), extensively overlapping with the range for molecular diffusion. It must be noted, however, that an interpretation of this result requires a consideration of the recognized large uncertainties associated with the modeled bubble dissolution. A methane flux of 0.0150 to 0.0345 mol m
−2 d
−1 from the lake surface, determined by eddy covariance measurements at Platform 1 [
32], was used to estimate the number of bubbles moving through the water column and, thus, the overall methane loading. This eddy covariance method integrated a relatively small area of the lake surface, and on-site field observations indicate that the ebullition rates vary temporally and spatially over the lake, which adds uncertainty to the eddy covariance fluxes and, therefore, to the bubbling rates. The model was also sensitive to the estimates of bubble size, which, based on on-site field observations, can also vary temporally and spatially over large ranges. Despite these limitations, the fact that the estimated dissolved methane mass loading, due to dissolution from bubbles, is on the same order of magnitude as molecular diffusion does indicate that the dissolution from bubbles is potentially an important methane source to the water column.
An important attribute of the dissolution from bubbles is that, unlike inputs from molecular diffusion or porewater advection that occur at the FWI into the hypolimnion, the dissolution from bubbles occurs throughout the water column. Such a mechanism is consistent with the observation of evidence of methane oxidation within the epilimnion throughout the study, despite the low concentrations of dissolved methane and previous evidence indicating high rates of methane consumption in the hypolimnion [
5,
7] that would be expected to prevent the upward diffusive transport of methane across the thermocline. The dissolution of methane from bubbles also provides an explanation for the observation of high concentrations of dissolved methane in the epilimnion during under-ice sampling. In February of both 2017 and 2018, relatively consistent concentrations of methane, with invariant δ
13C values of −61‰, equivalent to the enriched end of the FFT range, were observed across the epilimnion. This is consistent with the delivery of methane to the epilimnion without experiencing the isotopic fractionation occurring in the hypolimnion near the FWI observed at the same time. This would be expected for bubbles that are released from the FFT and trapped beneath the ice, where they dissolve into the epilimnion waters and are then circulated through the epilimnion. While the dissolved methane appears to have undergone little fractionation in February, there is clear evidence of isotopic fractionation between February and March 2018 throughout the water column. The reason for the lack of evidence for the under-ice methane oxidation in February, and the subsequent establishment of an oxidized signal in March 2018, is not known. However, it may be related to the relative rates of methane oxidation versus supply, suggesting that the under-ice oxidation prior to March is relatively slow.
3.7. Biogeochemical Response to Perturbation, Spring 2017: Phototrophic Response to Alum Addition
As noted, the low rates of methane oxidation and the persistence of CH
4(aq) into May and June in 2017 (
Table 1b) appear to be the result of the perturbation of the BML system by the whole-lake addition of alum in fall 2016. The decreased rates of methane oxidation observed between February and May 2017 are consistent with a decreased presence of methanotrophic organisms within the water column, which would be expected if the alum addition had stripped out pelagic organisms as well as particulates from the water column. Because of technical issues during analysis, the PLFA abundances and distributions could not be confidently determined for February 2017. However, the PLFA abundances (
Figure 5) and isotopic compositions (
Figure 6) indicate that the pelagic microbial community underwent a significant shift immediately following this interval. The total PLFA abundances in the epilimnion increased dramatically in May 2017 (
Figure 5), and there was a concurrent shift to a greater proportion of the biomarkers of phototrophic organisms (C18:1unsat and polyunsaturated PLFA) in both the epilimnion and hypolimnion (
Figure 5). These trends are consistent with the occurrence of a bloom of phototrophic organisms, such as algae, indicated by field observations, increased water column Chl-a, and shifts in the microbial community structure [
43], associated with increased water clarity after the alum addition in fall 2016. The δ
13C of the PLFA further support this interpretation. In May 2017, the δ
13C of all the epilimnetic PLFA became isotopically enriched (
Figure 6). This was one of only two times that the δ
13C of the C16:1 PLFA was >−40‰ and was only slightly depleted relative to the C16:0 and C18:1 PLFA. The relatively small isotopic depletion of the C16:1 relative to the other PLFA indicates that while methane oxidation was ongoing, it represented a relatively smaller component of the overall microbial community than at other times. Furthermore, the relatively close agreement between the δ
13C of the C16:0 and C18:1 PLFA was consistent, with these PLFA being derived from a similar photosynthetically derived carbon source. Consistent with the re-establishment of higher rates of microbial methane oxidation between May and June 2017, the C16:1 PLFA again became strongly isotopically depleted throughout the water column, although the relatively small isotopic depletion of C16:0 PLFA indicates that this process was making a relatively smaller contribution to the overall microbial community than previously, in 2016.
3.8. δ13C Evidence of Ongoing Shifts in Microbial Metabolism in 2018
Methanotrophy continued to play a recognizable role in the hypolimnion in June and August 2018, and in the epilimnion in June 2018, where the δ
13C of C16:1 PLFA remained isotopically depleted, echoed by the isotopic depletion of the C16:0 PLFA (
Figure 6). In contrast, there was a large shift in the δ
13C of the PLFA in the epilimnion in August, such that the δ
13C of the PLFA groups converged to relatively enriched values of −29 to −34‰. This shift is consistent with what was observed in May 2017 and suggests a shift to a dominance of phototrophic metabolism. Increased phototrophy in August would be consistent with the general trend of increasing water clarity over the summer [
23]. While the signal of phototrophy, based on the C18:1
unsat and polyunsaturated PLFA abundances in August 2018, was not as strong as that observed in May 2017, both of these PLFA groups continue to make large contributions to the PLFA distribution, which is dominated by ubiquitously produced saturated PLFA (
Figure 5).
A second change in the microbial metabolism, observed in the summer of 2018, was indicated by the shift in the δ
13C of C18:1 PLFA to −37‰ in the epilimnion in June, and in the hypolimnion in August (
Figure 6). While not as large a shift as observed for C16:1 PLFA associated with methanotrophy, it is notable given the consistency of all of the previous samples, which ranged from −32 to −34‰. The cause of this shift is not certain; however, it is likely the outcome of a change in the metabolisms within the BML microbial community [
43]. Jessen et al., 2021, observed that the bottom waters of BML became anoxic in August 2018, and further detected the presence of dissolved aqueous sulphide in the water column for the first time. Microbial sulphate reduction is known to be able to produce isotopically depleted PLFA [
46]. An increased presence of heterotrophic bacteria, including sulphate-reducing bacteria, would also provide an explanation for the increased abundances of branched PLFA that are often produced in abundance by these organisms. While the current data are insufficient to definitively assess the cause of the observed shift in the isotopic compositions, the unique δ
13C PLFA, observed in both the epilimnion and hypolimnion in August 2018, indicate ongoing changes in the dominant microbial metabolisms in the lake that are consistent with the shifts in the microbial community composition reported in Jessen et al. (submitted) [
43].
4. Conclusions
The results of this study demonstrate that microbial methane oxidation made an important contribution to limiting methane release throughout the BML water column over the entirety of the study (2015–2019). These results confirm previous reports indicating the occurrence of microbial methane oxidation, and demonstrate that this process responded dynamically to both seasonal cycles and management intervention. The PLFA abundances, distributions, and isotopic compositions provided clear evidence of extensive methane oxidation, which was greatest in the first year of the study, particularly in the hypolimnion, but remained recognizable throughout the water column at all sampling times. The dissolved methane concentration profiles and the modeling results indicate that the porewater advection and molecular diffusion from the FFT were the primary sources of methane to the BML water column. The observed isotopic fractionation of methane close to the FWI demonstrated that the methane concentrations had undergone oxidation, and inputs from the FWI were 1.3 to 2 times higher than the measured concentrations suggested. The mass balance modeling results also indicate that methane dissolution from bubbles was an important source of dissolved methane that could account for the observations of detectable dissolved methane within the epilimnion throughout the study, as well as for the observed under-ice epilimnetic high concentrations of dissolved methane in 2017 and 2018. While there was no evidence of methane fractionation in the February (under ice) data for both 2017 and 2018, shifts in δ13C CH4 in March 2018 indicated that the occurrence of methane oxidation was responsible for the observed decreases in the methane concentrations throughout the water column. Taken together, these results indicate that microbial methane oxidation is capable of preventing the release of dissolved methane from BML. Thus, if methane ebullition releases are reduced over time, or because of mitigation efforts, the BML water column should prevent BML from being a long-term source of methane to the atmosphere.
The addition of alum to the lake in the fall of 2016 had extensive impacts on the microbial biogeochemical cycling within BML. The calculated rates of methane oxidation between February and May 2017 were nearly an order of magnitude lower than those at other times. This decreased rate was associated with the persistence of dissolved methane throughout the water column of BML into June 2017. The decreased rates of methane oxidation during this time may reflect the stripping out of pelagic methanotrophs by the alum addition. The PLFA and methane δ
13C results indicate that the methane oxidation by the pelagic microbial community had re-established in May 2017, and even more strongly in June (2017), though this process was a relatively smaller contribution to the overall microbial community. Shifts in the PLFA distribution and δ
13C indicated the occurrence of a phototrophic algal bloom that was further supported by field observations. These observations were consistent with the trends observed by Jessen et al. [
43]. The observation of such a shift, and the associated change in the lake's capacity to oxidize methane, demonstrates that, in addition to having the planned effect of increasing the water clarity, the alum addition appears to have had large impacts on the biogeochemical cycling within the lake that should be considered when undertaking management interventions.
The biogeochemical cycling within BML continued to change in 2018. While methane oxidation continued to play a recognizable role, the PLFA distributions and isotopic compositions indicated the emergence of a phototrophically dominated community in the epilimnion in August 2018, similar to that observed in May 2017. However, unlike in May 2017, the influence of this community shift is smaller in the hypolimnion, where methanotrophy still plays a larger role. Concurrent with this is the observation of a shift in the carbon cycling by the other components of the microbial community, indicated by a shift in the δ
13C of C18:1 PLFA. While the specific causes of these shifts are not yet clear, these ongoing changes in the PLFA and isotopic biomarkers of the BML microbial community are concurrent with the changes identified via amplicon sequencing by Jessen et al. [
43].
These results demonstrate the dynamic nature of microbial methane oxidation as a carbon and energy source to the BML microbial community, and as a control on the methane and oxygen concentrations. The role of methane oxidation was dramatically affected by the addition of alum in the fall of 2016 to increase the water clarity, such that methane persisted into June 2017, for the first and only time observed in the study period (2015–2018). The increased water clarity led to a phytoplanktonic bloom in May 2017 that continued to influence the BML microbial community throughout 2017. Further shifts in the microbial methane oxidation and carbon sources were indicated in 2018. Whether these were influenced by the 2016 alum addition or represent new changes in the lake as methane sources and other biogeochemical parameters continue to develop, is unclear. As noted, on the basis of these results, it appears that microbial methane oxidation will continue to be capable of consuming the dissolved methane inputs to BML, particularly as the methane inputs are expected to decline. However, the ongoing changes in the microbial community in 2018 indicate that other microbial metabolic processes may become dominant within the water column. If these changes lead to major shifts in the redox conditions and/or microbial metabolisms within the lake, they may impact the biogeochemical balance and affect the extent of methane oxidation, which could have important implications for lake management and which needs to be the focus of further investigations.


 ,
, 


