Article

Fungi Dominated the Incorporation of 13C-CO2 into Microbial Biomass in Tomato Rhizosphere Soil under Different CO2 Concentrations

1
Research Center for Environmental Ecology and Engineering, School of Environmental Ecology and Biological Engineering, Wuhan Institute of Technology, Wuhan 430073, China
2
Key Laboratory of Urban Environment and Health, Institute of Urban Environment, Chinese Academy of Sciences, Xiamen 361021, China
3
Ningbo Key Laboratory of Urban Environmental Processes and Pollution Control, Ningbo Urban Environment Observation and Research Station—NUEORS, Institute of Urban Environment, Chinese Academy of Sciences, Ningbo 315800, China
*
Authors to whom correspondence should be addressed.
Microorganisms 2021, 9(10), 2121; https://doi.org/10.3390/microorganisms9102121
Submission received: 24 August 2021 / Revised: 25 September 2021 / Accepted: 5 October 2021 / Published: 9 October 2021
(This article belongs to the Section Environmental Microbiology)

Abstract

:
An elevated CO2 (eCO2) fumigation experiment was carried out to study the influence of various CO2 concentrations on microorganisms involved in the incorporation of root-derived C in greenhouse soil systems. In this study, 400 and 800 µmol·mol−1 CO2 fumigation treatments were conducted during tomato planting. Phospholipid fatty acid (PLFA) profiling based on the stable isotope probing (SIP) technique was applied to trace active microorganisms. The absolute total abundance of 13C-PLFAs was much higher under eCO2 treatment. Most of the 13C-CO2 was incorporated into the 13C-PLFAs 18:2ω6,9 (fungi), 16:0 (general PLFA), 18:1ω9c (Gram-negative bacteria, G) and i17:0 (Gram-positive bacteria, G+) via rhizodeposition from tomato under ambient CO2 (aCO2) and eCO2 treatments, suggesting similar responses of active microorganisms to different CO2 treatments. However, the fungi (characterized by the 13C-PLFA 18:2ω6,9) played a much more dominant role in the incorporation of root-derived C under eCO2. Actinomycetes, marked by the 13C-PLFA 10-Me-18:0, occurred only on labeling day 15 under the eCO2 treatment, indicating that the actinomycetes fed on both soil organic carbon and fresh rhizodeposition. It was indicated that eCO2 significantly affected microbial biomass and microbial community structures involved in the incorporation of 13C-CO2 via tomato root secretions, as supported by Adonis analysis and the Mantel test.

Graphical Abstract

1. Introduction

Atmospheric CO2 concentrations have been increasing annually since the Industrial Revolution, reaching 400 µmol·mol−1 for the first time in 2013 [1]. eCO2 could improve the net primary production and quality by accelerating photosynthetic rates and increasing water use efficiency [2,3,4,5]. At the same time, plant rhizodeposition, which accounted for 17% of photosynthates [6], was altered quantitatively and qualitatively under eCO2 treatment [4,7,8,9]. As a consequence, microbial biomass was generally significantly increased under eCO2 because of the increased carbon flow in plant root secretions [8,10], and the microbial community structure was affected by eCO2 to different degrees depending on plant species [11], soil characteristics [11] and experimental designs [12,13]. However, whether the changes in microbial biomass and community structure were derived from increased rhizodeposition or soil organic matter remains largely unknown in most cases [11,14,15], which could ultimately affect the soil’s nutrient balance and the sustainable development of ecosystems.
Under this condition, studies on the microorganisms responsible for the incorporation of root-derived C have received more and more attention and can provide insights into this phenomenon. Fungi (PLFAs 18:1ω9 and 18:2ω6,9) and G (PLFAs 16:1ω7, 18:1ω7 and cy19:0) incorporated most of the 13C-CO2 in a 5 h stable isotope labeling experiment in grassland soils [16]. Similarly, the 13C-PLFA 18:2ω6,9 was shown to significantly incorporate root-derived C, while bacterial PLFAs showed no significant changes in another experiment conducted on young beech trees [17]. For anaerobic incubation with 13C-labeled urea in wheat-rice rotation soils, the 13C-PLFA 18:1ω9c was much more abundant when the wheat season changed into the rice season [18]. Furthermore, microbes involved in the incorporation of root-derived C were found to be significantly different under various CO2 concentrations with the support of Deoxyribonucleic acid-stable isotope probing (DNA-SIP) [19]. Bacilli, Gammaproteobacteria and Clostridia were dominant under aCO2 treatment, while Bacilli and Betaproteobacteria were dominant under the eCO2 treatment. Based on the above discoveries, it was found that fungi (18:2ω6,9) played a dominant role in incorporating root-derived C, and the changes in active microbial community structures were mainly dependent on ecosystems. eCO2 stimulates the C flow from plant roots to soils and promotes microbial activity. Greater utilization of additional C resources and root secretions [20,21], a significantly higher abundance of genes associated with C and N cycling [22] and increased enzyme activity [23,24] indicate rapid nutrient cycling and the stimulation of microbial activity under eCO2. Unfortunately, the isotope pulse-labeling technique used in previous studies was less stable than the steady isotope labeling technique, and little research has focused on the effects of various CO2 concentrations, especially in greenhouse soil ecosystems.
Soils managed under plastic tunnel greenhouses, which are widely used in fruit and vegetable plantations and characterized by lower pH levels and nutrient-poor conditions under longer planting durations, have rarely been studied under various CO2 treatments [22,25,26]. The soil microbial community composition in the rhizosphere soils of tomato changed insignificantly under various CO2 treatments in our previous study [27]. However, the changes in active microbial community structures incorporating root-derived C were largely unknown. The Phospholipid fatty acid-stable isotope probing (PLFA-SIP) technique based on steady 13CO2 labeling can be used to reflect the changes in active PLFAs that are characteristic of diverse microbes [28].
A study demonstrated that the ideal concentration of CO2 for the production of vegetables in greenhouses is 800–1000 µmol·mol1 [29]. It has been shown that eCO2 can significantly improve crop photosynthesis, including that in tomatoes [30,31]. According to reports by the Intergovernmental Panel on Climate Change (IPCC, 2014) [1], atmospheric CO2 has been reached 400 µmol·mol1 in 2013, and it will increase at the rate of 1.9 μmol·mol1·y1, reaching 550 µmol·mol1 in 2050. In previous studies about eCO2 fumigation, higher CO2 concentration was usually set as 550 [24], 700 [32] or 800 µmol·mol1 [26,33,34] and so on, and the ambient atmospheric CO2 concentration was usually regarded as 400 µmol·mol1. In order to clearly reveal the stimulation of plant biomass under eCO2 condition, 800 µmol·mol1 CO2 was also chosen in our study. As higher plant dry biomass usually means more root secretions, so only one higher eCO2 concentration was chosen to induce significant changes of microbes.
In this study, a 2% 13C-CO2 steady-state labeling experiment with the support of the PLFA-SIP technique was conducted in both tomato planted and unplanted soils, in which 400 or 800 µmol·mol−1 CO2 fumigation was performed for 15 days because of the rapid metabolism of PLFAs. Based on our previous study that fungal biomass was significantly increased under eCO2, we hypothesized that fungi would play a dominant role in the incorporation of root-derived C under eCO2 treatment. The aim was to reveal the differences in the compositions of active microbial communities that assimilate plant-derived carbon under various CO2 concentrations.

2. Materials and Methods

2.1. Study Site

In August 2020, the plow layer of the soil was sampled from a 10-year-old tomato greenhouse located in Wuhan city (30°17’44″ N, 114°16’34″ E). The field holding capacity of the soil was 24.36%, and the moisture content of the air-dried soil was 2.86%. The soil pH was 5.31 (soil:water = 1:2.5). The total carbon and total nitrogen contents were 10.3 and 1.6 g·kg−1 dry soil, respectively, and the C:N ratio was 6.49. The dissolved organic carbon (DOC) and dissolved organic nitrogen (DON) contents were 395.75 and 122.88 mg·kg−1 dry soil, respectively. The soil NH4+-N and NO3-N contents were 2.11 and 37.16 mg·kg−1 dry soil, respectively. The soil was defined as loamy because sand, silt and clay accounted for 47.7%, 42.6% and 8.2% of its contents, respectively.

2.2. Experimental Set-Up

In this study, each pot was filled with the equivalent of 200 g of soil (dry weight). The soils in each pot were passed through a 5.0 mm sieve, the water content was adjusted to 65% of the field holding capacity, and 0.2 g NPK fertilizer was mixed before the transplantation of the tomato plants.
The seeds of the tomato plants (Solanum lycopersicum L., Jinguan 28) were soaked in tap water (37 °C, 10 h) and then germinated at room temperature (25 °C) according to the planting instructions. Tomato seedlings were placed into larger pots (15 × 12 × 14 cm) for seedling cultivation. After 13 days, three plants of similar sizes (5 cm length with 4 leaves) were transplanted into each small pot (9 × 6 × 9.5 cm). All the pots were transferred to a controlled environment room (day 22–26 °C/night 15–19 °C; photoperiod, 12 h light; watered every two days with deionized water; CO2 concentration, 400 µmol·mol−1, controlled with a volumetric flow meter and a control panel).
All pots were divided into two parts: pots for plant growth and pots for soil incubation. In each part, two variants (CO2 concentration and labeling days) were set. In total, 28 pots for plant growth (2 CO2 concentrations (400 and 800 µmol·mol−1 CO2) × 3 labeling days (labeling days 5, 10 and 15) × 4 replicates + 4 pots sampled on the day before labeling); 12 pots for soil incubation (2 CO2 concentrations (400 and 800 µmol·mol−1 CO2) × 1 labeling days (labeling days 15) × 4 replicates + 4 pots sampled on the day before labeling).
One week after transplantation (day 21), the pots were separated equally into two different CO2 concentration treatment groups (400 or 800 µmol·mol−1 CO2), and 2% 13C-CO2 steady-state labeling was performed. The two growth chambers were placed in the above-mentioned controlled-environment room, so the growth conditions were the same as those in the plant growth period. The steady-state labeling of 13CO2 was accomplished by mixing compressed air without CO2, natural 12CO2 and 13CO2 at fixed rates controlled by mass-flow controllers, which were described previously [30]. Briefly, the flow rates of 13CO2, 12CO2 and air without CO2 were set as 0.072 mL·min−1, 7.128 mL·min−1 and 18 L·min−1, respectively, in the 400 µmol·mol−1 CO2 chamber, while they were 0.144 mL·min−1, 14.256 mL·min−1 and 18 L·min−1, respectively, in the 800 µmol·mol−1 CO2 chamber.
In the pots used for plant growth, destructive sampling of tomato plants and rhizosphere soils was performed on days 21 (the day before labeling), 26, 31 and 36 (every 5 days after labeling). From the pots used for soil cultivation, soils were collected only on day 21 (the day before labeling) and day 36 (the end of the labeling experiment). Rhizosphere soils were harvested by collecting the soils adhering to the root after shaking and then freeze-dried for PLFA analysis. Plant shoots and roots were separated and dried (105 °C for 45 min and 60 °C for 48 h) for further analysis.

2.3. Analysis of Biochemical Properties

To reflect the changes in the biochemical properties of the soils, the soil pH, moisture, DOC, DON, NO3-N and NH4+-N were measured. The measurement details are available in a previous study [27]. In brief, the total C and total N levels in the soils were measured by an elemental analyzer (Elementar Vario MACRO cube, Langenselbold, Germany) according to the operating instructions. The NO3-N and NH4+-N in the soil were extracted with 2 M KCl at a 1:5 fresh soil to KCl ratio, and the extract was analyzed with a continuous flow analyzer (SKALAR, Delft, The Netherlands). The DOC and DON in the soil were extracted with 0.5 M K2SO4 at a 1:5 fresh soil to K2SO4 ratio and analyzed with a Multi N/C 2100S TOC/TN b analyzer (Analytik Jena, Jena, Germany). The % C and 13C/12C ratio of the soils and tomato roots and shoots were analyzed with a Flash EA 2000 Series Elemental Analyzer connected via a Conflo IV to a Delta V Advantage isotope ratio mass spectrometer (all Thermo Scientific, Germany) [35]. The isotope ratios were calculated according to a previous study [36].

2.4. PLFA Analysis

PLFA extraction and analyses were performed according to the modified Bligh and Dyer method [37], the details of which were provided in a previous study [27]. The concentration and 13C labeling of fatty acid methyl esters (FAMEs) were analyzed by using a Trace GC 1310 system with a combustion column attached via a GC IsoLink II system to a Delta V Advantage isotope ratio mass spectrometer (all Thermo Scientific, Germany) [36]. Other details were the same as those described in previous studies [36,38].
In total, 38 PLFAs were detected across all the treatments. Taking into account the concentration of 13C among these 38 PLFAs, 19 PLFAs accounting for 90% of the total amount of PLFAs were considered valid and were finally retained for further analyses. These PLFAs were divided into the following categories according to previous reports [39]: general PLFAs (14:0, 15:0, 16:0, 17:0, 18:0 and 20:0), PLFAs from G- (16:1ω7c, cy17:0, 18:1ω9c and cy19:0), PLFAs from G+ (i15:0, a15:0, i16:0, i17:0 and a17:0), actinomycetes (10-Me-16:0 and 10-Me-18:0), fungi (18:2ω6,9) and arbuscular mycorrhizal fungi (AMF) (16:1ω5c) [40].
The proportion (Pi) of 13C in each PLFA was determined according to the mass balance equation below [36].
Pi = (AT% 13Ct − AT% 13C0)/(AT% 13Cg − AT% 13C0)
where AT% means the ratio of an isotope atom to the total atomic number of an element, AT% 13Ct and AT% 13C0 are the AT% 13C/12C enrichment (%) of each PLFA in the rhizosphere soil at the end and beginning of labeling, respectively, and AT% 13Cg is the AT% 13C/12C enrichment (%) of labeled CO2 (%). The absolute amount of labeled 13C in each PLFA was defined as the product of Pi and the absolute concentration of carbon in each PLFA (the number of carbons multiplied by the absolute abundance of each PLFA).

2.5. Statistical Analysis

Basic data processing, including the calculation of means and standard deviations (SDs), was performed with Microsoft Excel 2010. Tests of significant variation in the effects of CO2 concentrations and labeling days on biochemical properties and plant biomass were conducted with the Scheirer–Ray–Hare test in R 3.6.3 with the rcompanion package [41]. Analyses of the effects of CO2 concentrations and labeling days on microbial community structure (PLFAs) were conducted via Adonis analysis with 999 permutations in R 3.6.3. The assessment of whether the mol% of PLFAs or 13C was correlated with environmental factors was carried out with Mantel tests. The principal component analysis (PCA) of 19 PLFAs was conducted with the help of IBM SPSS Statistics 22. Other figures were plotted by using Origin 2018.

3. Results

3.1. Effect of CO2 Concentration on the Tomato Biomass and AT% 13C/12C

The eCO2 concentration significantly (p < 0.001) increased the shoot and root dry weights of tomato at the end of the labeling experiment (Figure 1a). However, both the labeling days and CO2 concentration:labeling days had no effect on plant biomass during the whole labeling period (p > 0.05).
The natural AT% 13C/12C values of the tomato shoots and roots were 1.06 before labeling. The AT% 13C/12C values of the shoots and roots were significantly (p < 0.001) higher under the eCO2 treatment, while the CO2 concentration:labeling days produced no significant (p > 0.05) effects on these induces during the labeling period (Figure 1b). Specifically, the AT% 13C/12C values of both tomato shoots and roots increased significantly (p < 0.05) with the labeling days under both the 400 and 800 µmol·mol−1 CO2 treatments. Moreover, the AT% 13C/12C values of the shoots and roots were greater than 2 (the AT% 13C/12C value of CO2 used in this experiment) on labeling days 10 and 15 under the 800 µmol·mol−1 CO2 treatment (Figure 1b), indicating that most of the carbon in the tomato shoots and roots was derived from photosynthesate after labeling day 10 under eCO2.

3.2. Effect of CO2 Concentration on the Biochemical Properties of the Soils

The changes in the biochemical properties of the soils during the labeling period were analyzed. In the planted treatment groups, the soil pH was nonsignificantly influenced (p > 0.05) by the CO2 concentration but decreased significantly (p < 0.001) with labeling days (Figure 2a). The soil moisture decreased significantly (p < 0.05) under the eCO2 treatment (Figure 2b). The CO2 concentration significantly (p < 0.05) increased the soil DOC, while labeling days significantly (p < 0.05) decreased it, and CO2 concentration:labeling days had no effect (p > 0.05) during the whole labeling period (Figure 2c). In particular, the soil DOC increased significantly (p < 0.05) with the CO2 concentration but decreased significantly (p < 0.001) with labeling days. The soil DON was not influenced by the CO2 concentration (p > 0.05) but decreased significantly (p < 0.001) with labeling days over the entire incubation period (Figure 2d). Similar to the soil DON, both the soil NO3-N and NH4+-N decreased significantly (p < 0.001) with labeling days and were much lower (p < 0.05) under the eCO2 treatments on labeling days 10 and 15 (Figure 2e,f). In the soil cultivation treatments, the soil DOC increased significantly (p < 0.05), while the soil NO3-N and soil NH4+-N decreased significantly (p < 0.05), under the eCO2 treatment (Table S1). The AT% 13C/12C values of the soils remained at 1.082 before labeling day 5 in both the aCO2 and eCO2 treatments, while they increased significantly (p < 0.05) on labeling days 10 and 15 under the eCO2 treatment.

3.3. Effect of CO2 Concentration on the Soil Microbial Community

In the tomato-planted treatment groups, the absolute abundance of total PLFAs was significantly (p < 0.05) higher under the eCO2 treatments (30.8 ± 0.6 vs. 38.5 ± 3.6 nmol·g−1 soil) at the end of labeling. However, the total PLFA contents of soils from the unplanted treatment groups were not significantly (p > 0.05) affected by the CO2 concentration, as the values in the 400 and 800 µmol·mol−1 CO2 treatment groups were 19.3 ± 0.4 and 20.1 ± 0.2 nmol·g−1 soil, respectively.
Based on the distributions of 19 PLFAs on each sampling day, general bacteria (PLFA 16:0), G (PLFAs cy19:0 and 18:1ω9c) and fungi (PLFA 18:2ω6,9c) were considered to be most abundant in both the planted and unplanted treatment groups (Figure S1). However, minor differences in the relative abundance of the abovementioned PLFAs existed between the planted and unplanted treatment groups. For example, the abundance of the fungal PLFA marker 18:2ω6,9 was much higher (p < 0.05) in the planted treatment groups than in the unplanted treatment group. For the significantly (p < 0.05) changed microbial PLFAs under various CO2 concentrations, both the PLFA species and numbers (6, 3 and 5) changed with labeling days in the planted treatment groups. Specifically, the relative abundance of the PLFA 18:2ω6,9 (fungi) was not significantly affected by eCO2 in the earlier labeling period (day 5) but was affected by eCO2 on labeling days 10 and 15, finally accounting for more than 20% of the total PLFAs at the end of labeling (Figure S1).
Principal component analysis (PCA) based on the relative abundance of 19 PLFAs was conducted to reveal the effects of tomato plants and CO2 concentrations on the microbial community composition (Figure 3). The microbial community compositions in the planted and soil cultivation treatment groups were separated on the first principal component axis (PC1), explaining 63.41% of the total variation, indicating the important role of tomato plants in shaping the microbial community structure. Analyses of the loading scores of PLFAs on the PC1 axis suggested that significant (p < 0.05) increases in i16:0 (score 0.081) and 10-Me-16:0 (score 0.081) and decreases in 18:2ω6,9 (score −0.082) and i17:0 (score −0.068) occurred in the soils without tomato (Figure S2), which was the same as the distribution of the mol% of PLFAs (Figure S1). Though the microbial community structures of soils from the 400-plant and 800-plant treatment groups were nicely clustered by direct visual observation (Figure 3), the p value of the Adonis analysis was above 0.05, which indicated that the CO2 concentration had no significant effects on microbial community structure in soils from the planted treatments during the 15 days of CO2 fumigation.

3.4. Variation in Soil Microbial Composition Incorporating 13C-Rhizodeposition under Different CO2 Concentrations

In the tomato planted treatment groups, the total 13C incorporation into PLFAs was significantly stimulated by the CO2 concentration (p < 0.05) and labeling days (p < 0.001), reaching 188.71 ± 16.14 and 456.76 ± 67.91 nmol·g−1 soil in the 400-day 15 and 800-day 15 treatment groups, respectively (Table 1). The average enrichment rate of 13C under the eCO2 treatment was almost twice as high as that under the aCO2 treatment (69% vs. 36%) (Table 1). However, in the soil incubation treatment groups, the average enrichment rate of 13C was less than 2%, and 13C labeling was not affected by the CO2 concentration (p > 0.05) (Table 1). Based on the distribution of 13C among fungal, general, G, G+ and actinomycete PLFAs, fungi and general bacteria were dominant in the planted treatments, while general bacteria and G were dominant in the unplanted treatments (Figure S3).
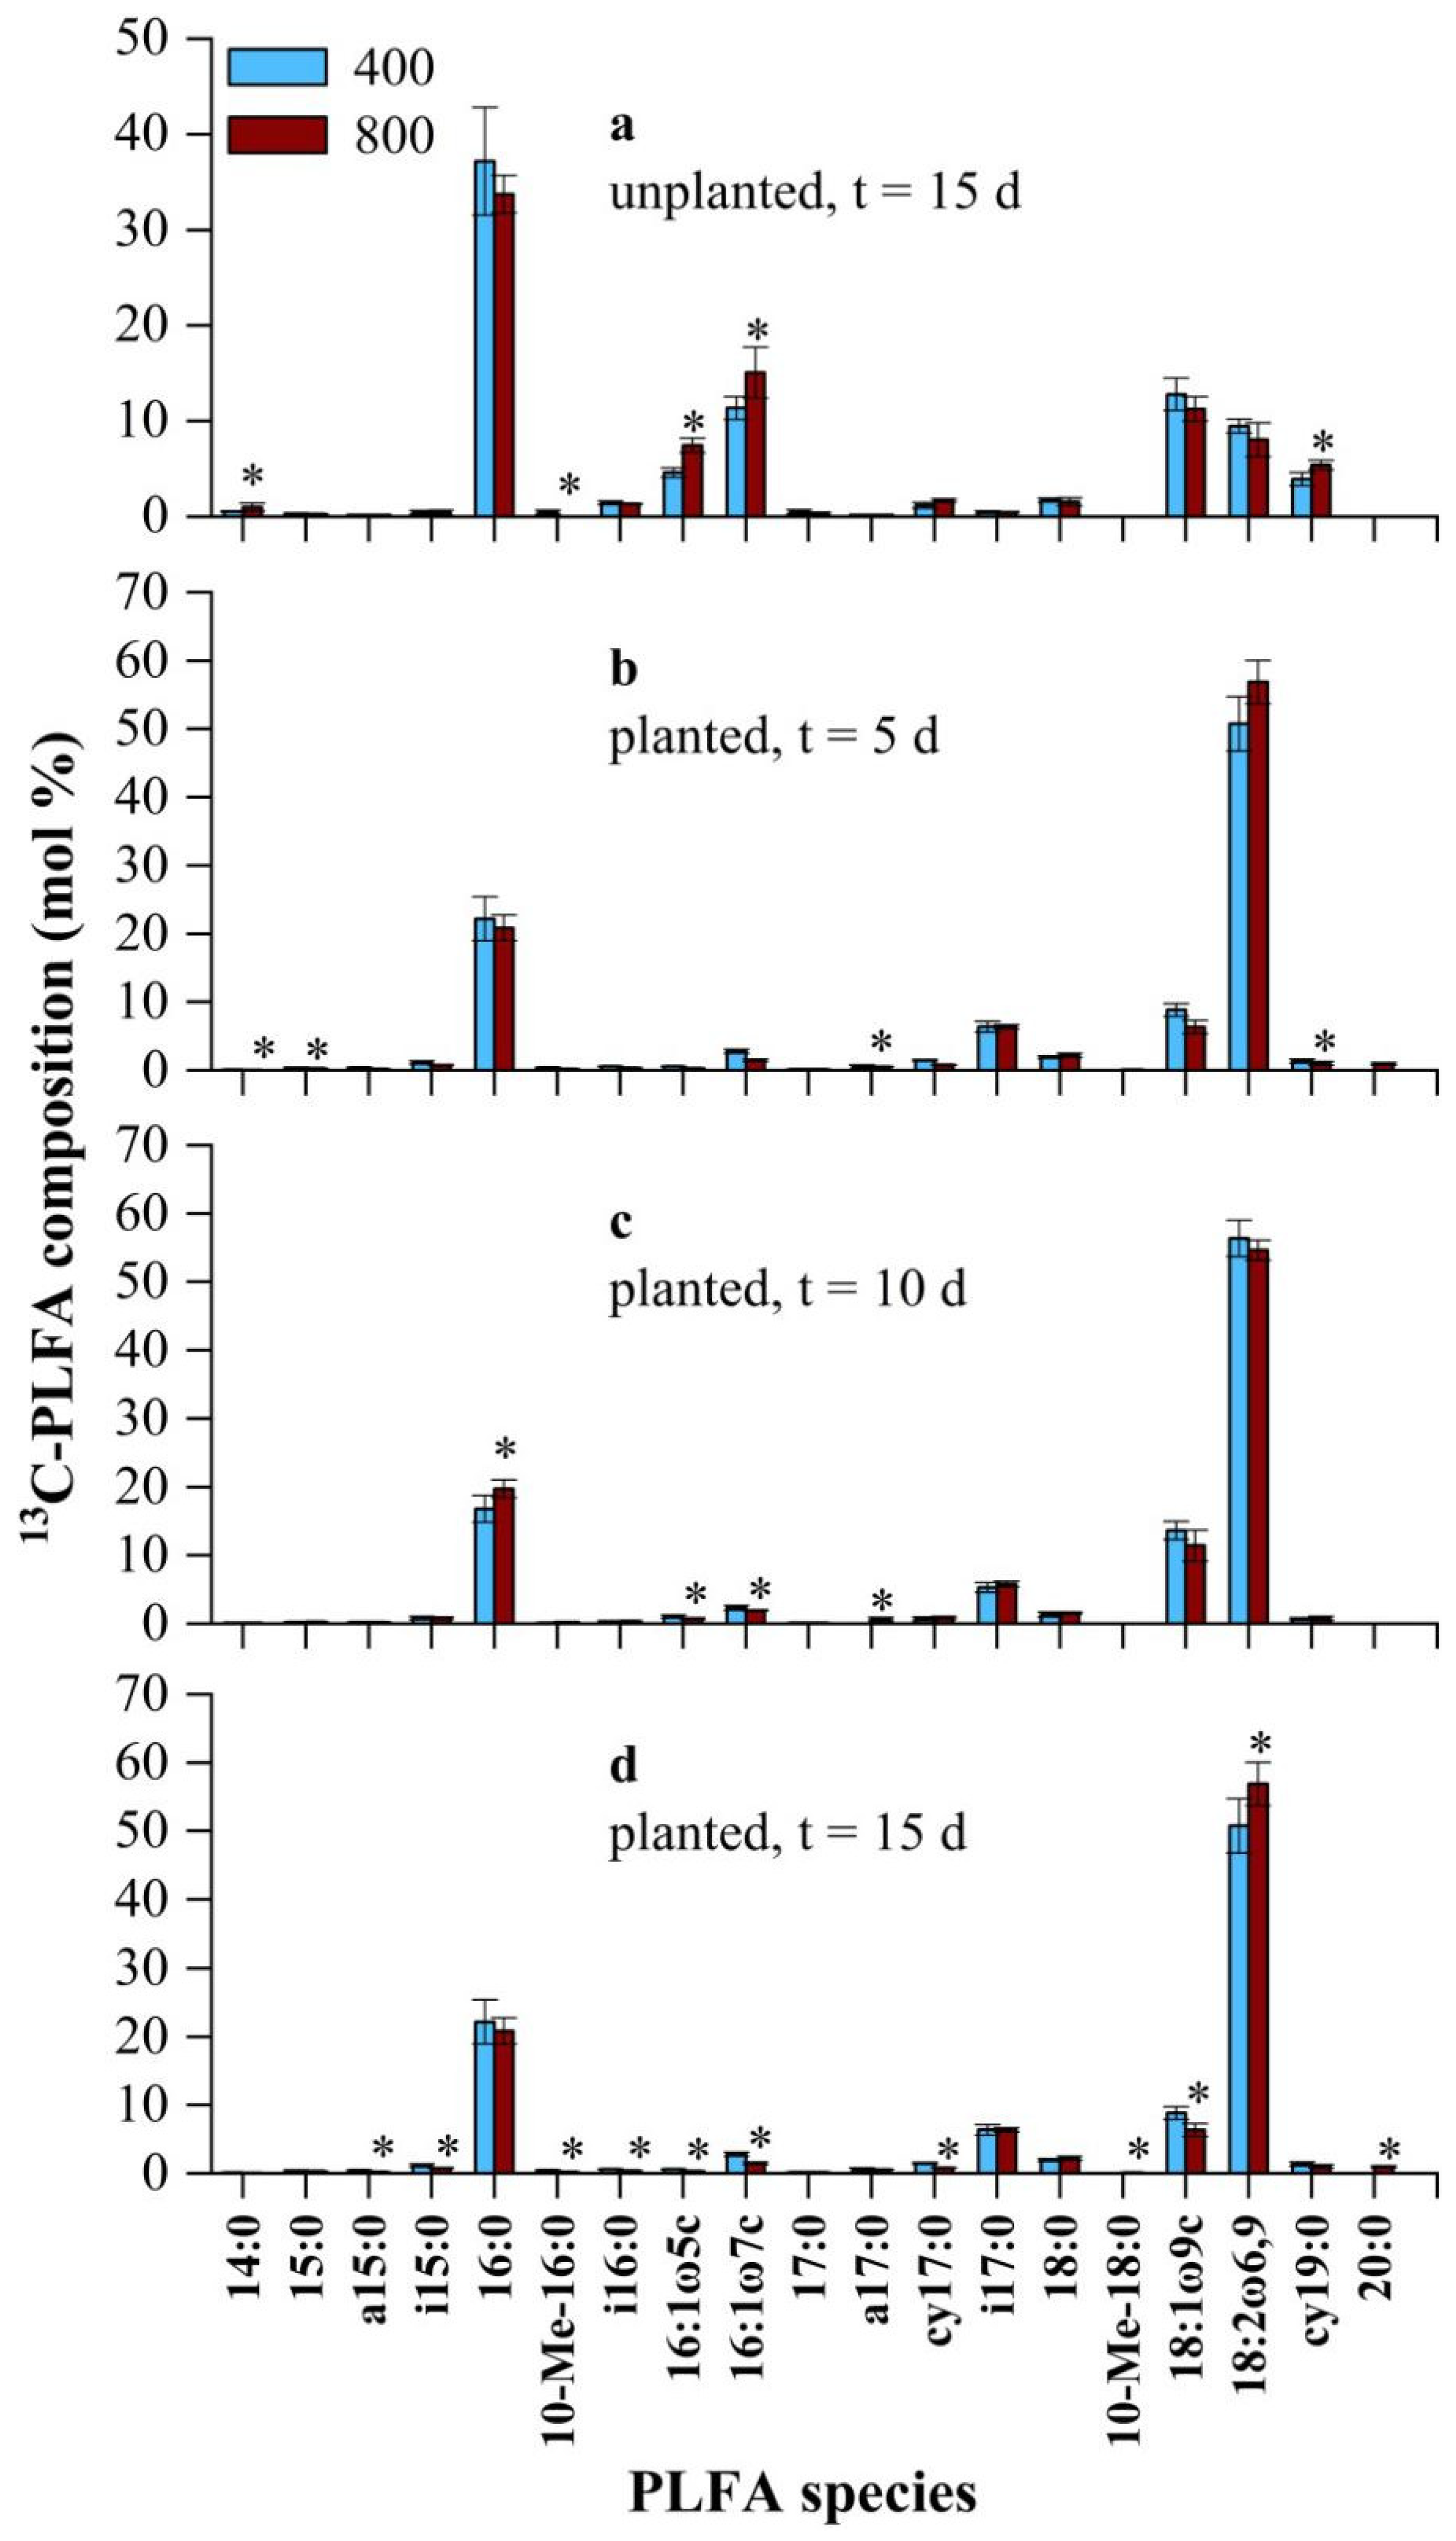
The percentage distribution of 13C in the PLFAs revealed the composition of microorganisms that incorporated root-derived 13C (Figure 4). In the unplanted soils, the 13C in a general PLFA (16:0) and G (16:1ω7c and 18:1ω9c) accounted for 60% of the total 13C (Figure 4a), which was in accordance with previous results (Figure S3). In contrast, 18:2ω6,9 (fungi), 16:0 (general PLFA), 18:1ω9c (G) and i17:0 (G+) were the most abundant 13C-PLFAs under both 400 and 800 µmol·mol−1 CO2 in the planted treatment groups, accounting for more than 85% of the total 13C-PLFAs (Figure 4b–d).
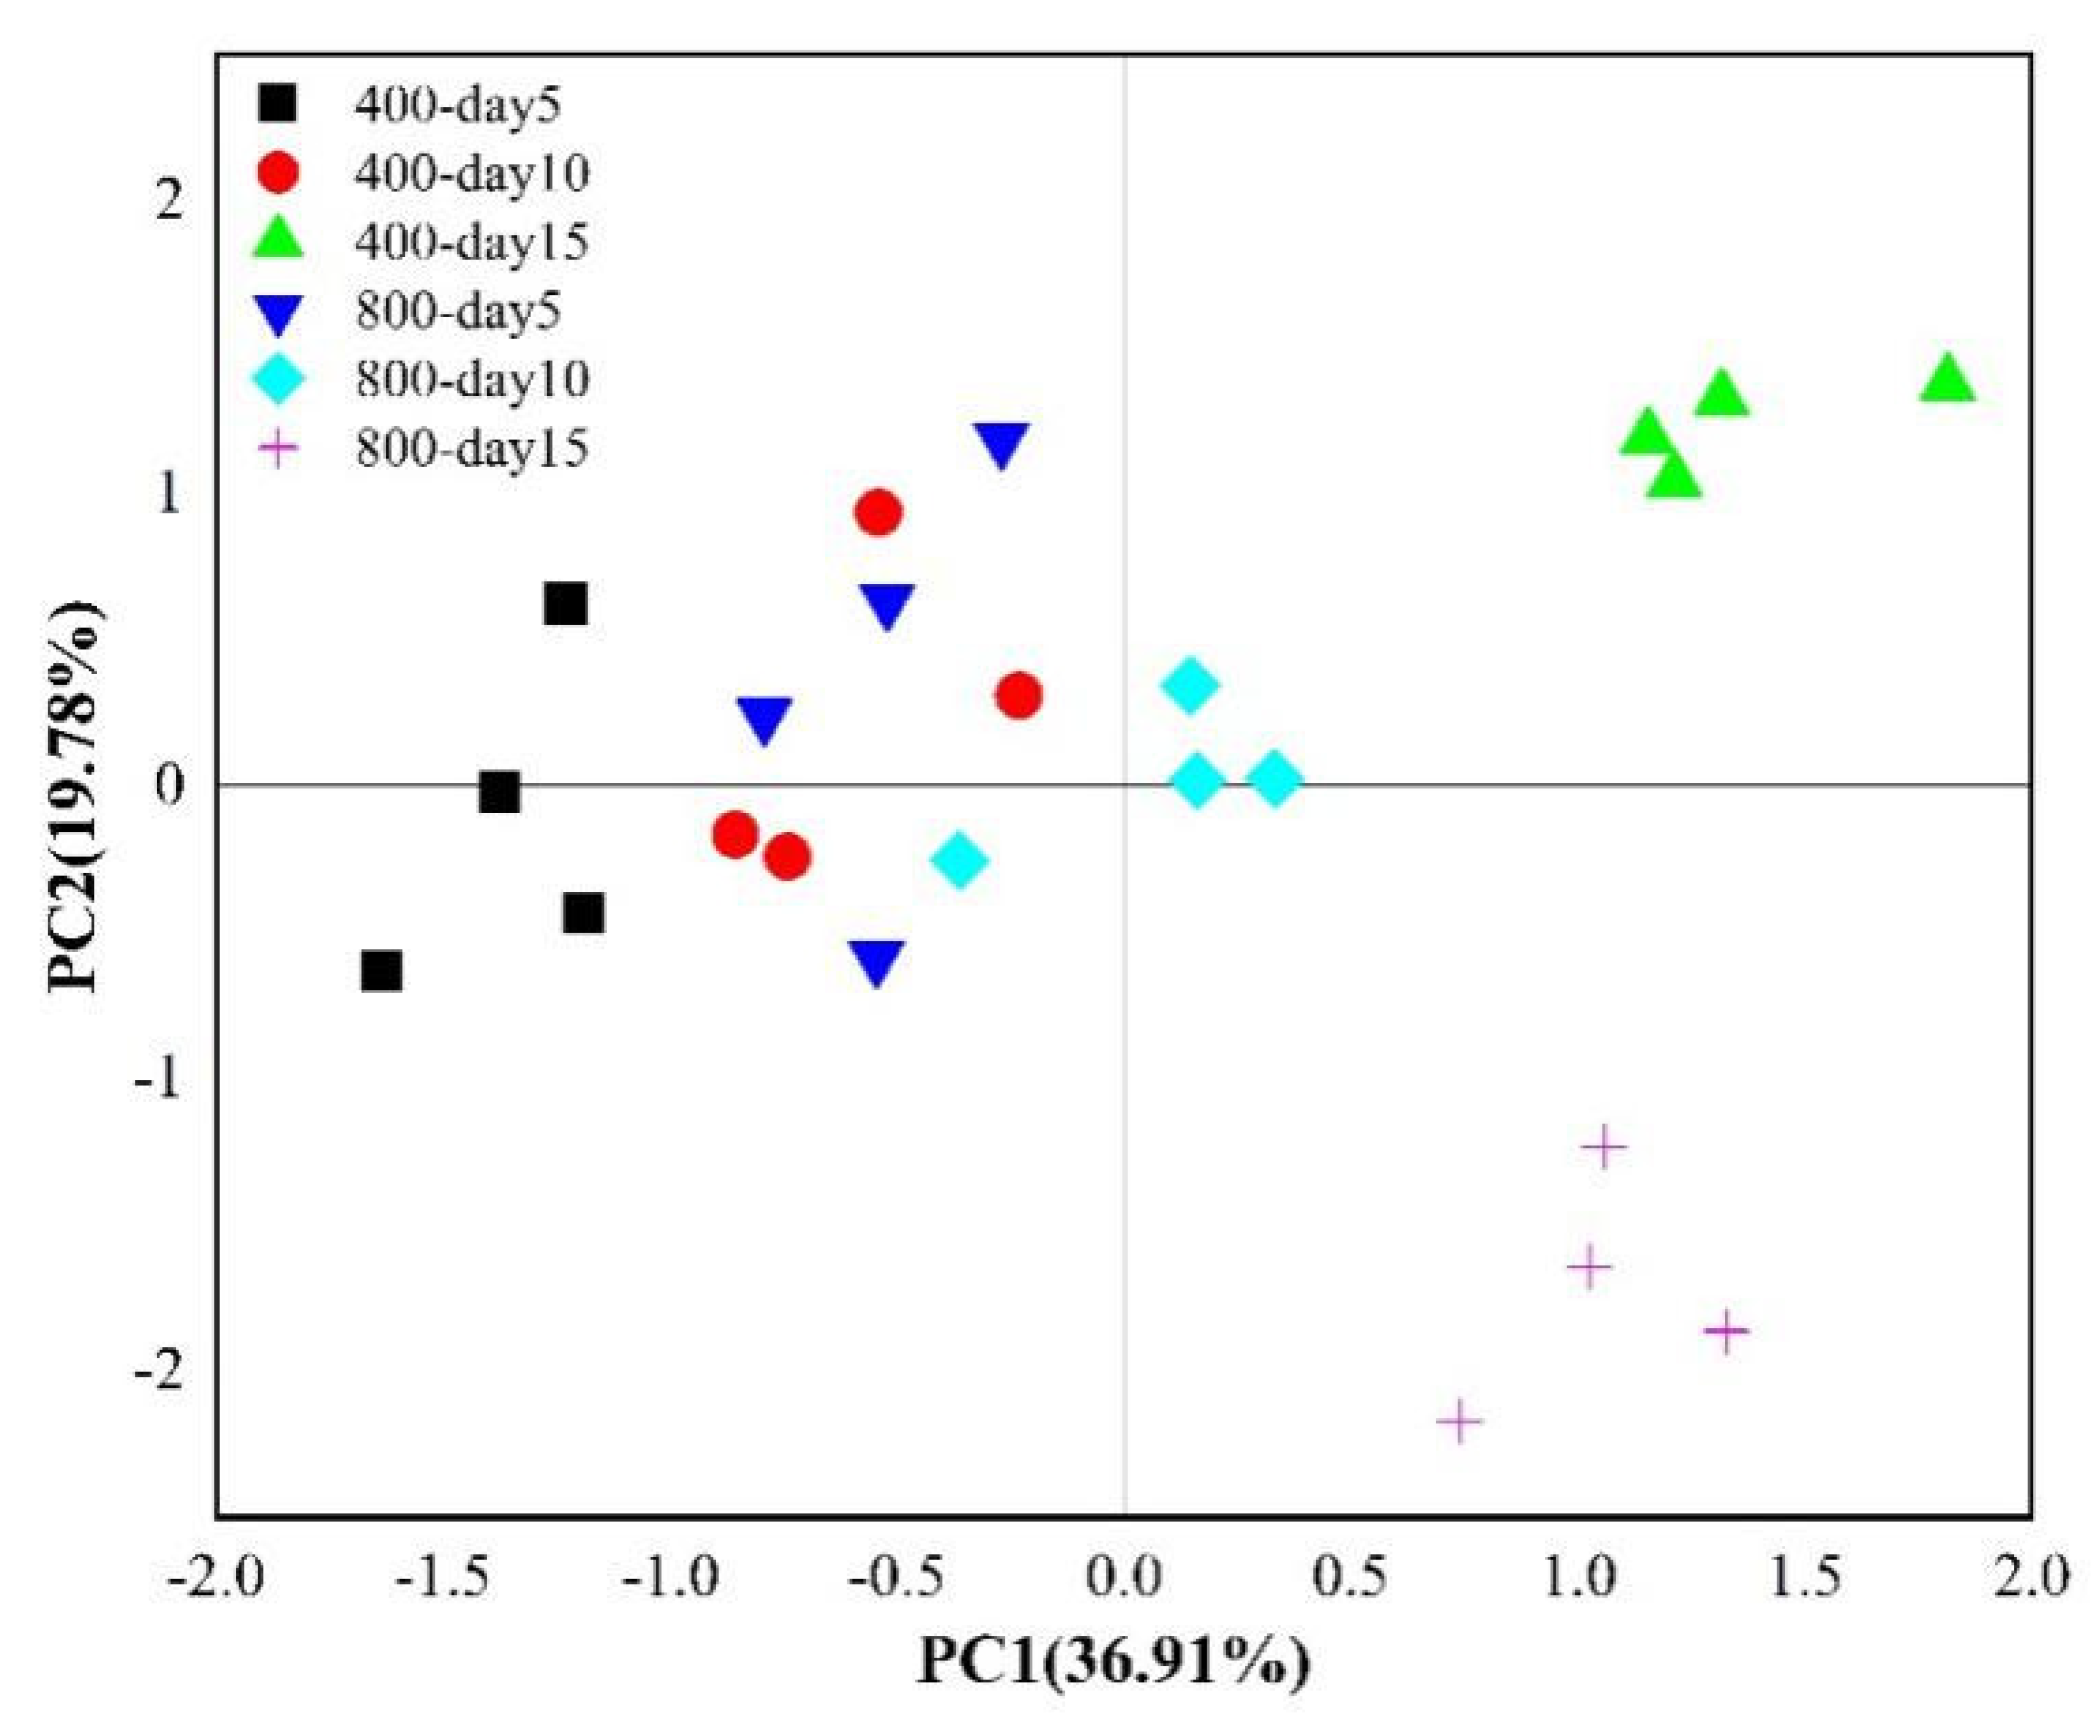
The differences in the soil microbial community structure in terms of 13C incorporation between the 400 and 800 µmol·mol−1 CO2 treatment groups was dependent on the labeling days, as indicated by both PCA and Adonis analyses (Figure 5, Table S2). Adonis analyses demonstrated that significant (p < 0.05) differences in the microbial community structure between the 400 and 800 µmol·mol−1 CO2 treatment groups occurred on labeling days 10 and 15 (Table S2). PCA further revealed that the 400-day 10 and 800-day 10 treatment groups were separated by PC1, while the 400-day 15 and 800-day 15 treatment groups were separated by PC2. In detail, the plant-derived 13C contents of the PLFAs 16:0 (a general PLFA), 18:1ω9c (G) and 16:1ω7c (G) were much higher (p < 0.05) under the 400 µmol·mol−1 CO2 treatment, while the plant-derived 13C contents of the PLFAs 18:2ω6,9 (fungi), 20:0 (general PLFA) and 10-Me-18:0 (actinomycetes) were much higher (p < 0.05) under the 800 µmol mol−1 CO2 treatment at the end of labeling period (Figure 4d). In terms of the AT% 13C/12C values of PLFAs, 18:2ω6,9 and 18:1ω9c were the top two of the 19 discussed 13C-PLFAs (Figure S4). Moreover, the AT% 13C/12C values of 18:2ω6,9 exceeded 2 (the AT% 13C/12C value of CO2 used in this experiment) on labeling days 10 and 15 under in 800 µmol·mol−1 CO2 treatment group (Figure S4). In addition, the incorporation of 13C from CO2 into the PLFAs 10-Me-18:0 and 20:0 occurred only in the 800-day 15 treatment group (Figure 4b–d), although the difference in the mol% of the PLFAs 10-Me-18:0 and 20:0 between the 400-day 15 and 800-day 15 treatment groups was not significant (p > 0.05), suggesting that microorganisms containing the PLFAs 10-Me-18:0 and 20:0 were dependent mainly on the original soil carbon source (such as organic matter) in the 400 µmol·mol−1 CO2 treatment group and in the earlier period of eCO2 treatment (up to labeling day 10).

3.5. Relationship between PLFAs and Environmental Factors

To reveal the associations between microbial compositions and soil and plant characteristics, Mantel test analyses were conducted based on the mol% of PLFAs or 13C and three key factors (CO2 concentration, DOC and total dry weight (TDW)). The whole PLFA profile was significantly (p < 0.05) related to DOC and TDW, while the whole 13C-PLFA profile was significantly (p < 0.05) correlated with CO2, DOC and TDW (Table 2). However, when TDW or DOC was set as a covariate, the influence of DOC or TDW on the whole PLFA profile was not significant (p > 0.05), indicating that the soil DOC and plant TDW interacted with each other. When TDW or DOC was set as a covariate, the effect of CO2 on the whole 13C-PLFA profile was not significant (p > 0.05), indicating that CO2 made an influence on 13C-PLFA profile by stimulating the TDW and DOC. Furthermore, when DOC was set as a covariate, the effect of TDW on the whole 13C-PLFA profile was significant (p < 0.05), suggesting that TDW could directly influence microbial community structures.
When specific PLFAs were considered alone, the results showed that CO2 produced a significant (p > 0.05) influence on 13C-18:1ω9c by increasing the tomato biomass, while it had a direct influence on 18:1ω9c (p < 0.05) (Table S3). In addition, both 18:2ω6,9 and 13C-18:2ω6,9 were significantly (p < 0.05) related to TDW. However, CO2 and TDW were significantly (p < 0.05) correlated with only the labeled 13C-10-Me-18:0 and 13C-20:0 (Table S3). The above results indicated that specific 13C- PLFAs were correlated with environmental factors in various manners.

4. Discussion

Similar responses of soil microorganisms to root-derived C under aCO2 have been shown in previous studies [16,17]. The 13C-PLFA 18:2ω6,9 was shown to significantly (p < 0.05) incorporate root-derived C, while bacterial PLFAs showed no significant changes in an experiment conducted on young beech trees [17]. In our results, the significantly higher abundance of 13C among fungal and actinomycete PLFAs under eCO2 treatment partially supports our hypothesis and is consistent with previous findings.

4.1. Effect of CO2 Concentration on 13C-Plant Biomass

The AT% 13C/12C values of tomato shoots and roots were significantly (p < 0.05) increased in the 800 µmol·mol−1 CO2 treatment group (Figure 1b), in accordance with the general theory that eCO2 is beneficial for plant photosynthesis [30,31]. In addition, the greater tomato root biomass and AT% 13C/12C values of tomato roots (exceeding 2, the AT% 13C/12C of CO2 value used in this experiment) (Figure 1) might indicate that the quantity of 13C-root secretions increased in the 800 µmol·mol−1 CO2 treatment group, as rhizodeposition accounted for approximately 17% of the photosynthates [6] and an increase in fine roots usually indicates increased root secretion. The significant (p < 0.05) increases in soil DOC (Figure 2c) and 13C among the PLFAs (Table 1) observed under eCO2 further supported the above hypothesis.

4.2. Effect of CO2 Concentration on Microbial Community Structure

During the 15 days of CO2 fumigation, the absolute abundance of the total PLFAs was significantly (p < 0.05) stimulated by eCO2 treatment, while the overall microbial community structure (the PLFA profile) was not influenced by CO2 concentration (Figure 3), as confirmed by Adonis analysis and Mantel tests (p > 0.05). The above results were similar to those of previous studies in which short-term eCO2 fumigation usually led to increases in root rhizodeposition and microbial biomass [42] but had little influence on microbial community structure [27,43,44]. In fact, because of the differences in plant species, soil characteristics and experimental designs, the observed response of the microbial community structure to eCO2 is not always the same [27]. A study conducted in a grassland revealed that even a longer period of eCO2 fumigation produced no effect on the microbial community structure [45], which might be attributed to the specific ecosystem involved and the large pool of soil carbon underground. Therefore, a focus on the changes in microbes involved in the incorporation of root-derived C is essential for understanding the effect of eCO2.

4.3. Effect of CO2 Concentration on 13C-Microbial Community Structure

In this study, the 13C-PLFAs 18:2ω6,9, 16:0, 18:1ω9c and i17:0 showed the highest activity in terms of the incorporation of rhizodeposited 13C compared with other PLFAs under both 400 and 800 µmol·mol−1 CO2, accounting for 85% of the total 13C (Figure 4d), which was in accordance with previous studies conducted in forests or other nonflooded ecosystems [16,17]. Moreover, both the absolute abundance of total 13C (Table 1) and the distribution of 13C-PLFAs (Figure 5) changed significantly (p < 0.05) under eCO2 at the end of the labeling period.
On the one hand, 13C-18:2ω6,9 (fungi) showed a significantly (p < 0.05) higher relative abundance under eCO2 (56.9% vs. 50.8%) (Figure 4d). The dominant role of fungi (18:2ω6,9) in incorporating root-derived carbon has also been observed in previous studies [16,17,46]. The significantly increased relative abundance of the 13C-PLFA 18:2ω6,9 under eCO2, in accordance with experiments conducted in young beech trees [17], could be attributed to the characteristics of fungi. First, the suitable pH range for fungi is acidic; in the present study, it was 4.8 on average and decreased under eCO2 (Figure 2a) [47]. Second, fungi can efficiently absorb nutrients through their long hyphal network to overcome the significant decrease in the soil N status, especially in the later stages of eCO2 fumigation (Figure 2d–f) [48]. Third, mutualism occurs between AMF and plant roots, and eCO2 further stimulates the growth of AMF and plants by increasing plant rhizodeposition secretion into rhizosphere soils [49,50]. Finally, fungi contain phenol oxidase, and this enzyme can mediate the absorption of sufficient N resources from recalcitrant C forms (such as lignin) with increased levels under eCO2 [51,52]. Therefore, the increase in fungi might be a general trend for eCO2 treatments in most studies. In addition, Mantel tests suggested that 13C-18:2ω6,9 was significantly (p < 0.05) related to TDW (Table S3), which means that fungi were affected mainly by the plant biomass or root secretions in this study. Therefore, the above results were consistent with the hypothesis that fungi played a much more dominant role in the incorporation of root-derived carbon under the eCO2 treatment.
On the other hand, 20:0 (general PLFA) and 10-Me-18:0 (actinomycete) were involved in the incorporation of 13C-CO2 later in the eCO2 treatment (such as 15 days) (Figure 4d). However, no significant (p > 0.05) variations in the mol% of 20:0 or 10-Me-18:0 existed between the 400 and 800 µmol·mol−1 CO2 treatment groups (Figure S1d). This result suggested that C among these two PLFAs was mainly derived from original soil carbon sources under aCO2 treatment, but root-derived carbon (rhizodeposition) could also be utilized under the eCO2 treatment, which was in accordance with the wide range of substrates utilized by actinomycetes [53]. Mantel tests demonstrated that 13C-20:0 and 13C-10-Me-18:0 were significantly (p < 0.05) correlated with the CO2 concentration, TDW and CO2 _TDW (Table S3). Therefore, both general bacteria and actinomycetes also play an important role in the incorporation of root-derived carbon under long-term eCO2 fumigation [19].
The PLFA 18:1ω9c is usually regarded as a biomarker of G and fungi in agroecosystems and forest ecosystems, respectively [40]. In this study, 13C-18:1ω9c (G) was much more abundant (p < 0.05) under aCO2 than under eCO2 (8.8% vs. 6.3%) on labeling day 15 (Figure 4d). The Mantel test results further indicated that the CO2 concentration affected 13C-18:1ω9c by increasing the TDW (Table S3). A recent study of the anammox reaction of urea revealed that the relative abundance of 13C-PLFA 18:1ω9c increased significantly (p < 0.05) during crop rotation from wheat to rice [18]. This might explain why 13C-18:1ω9c was much more abundant under aCO2, and it could be attributed to the higher water status under aCO2 (Figure 2b).
In addition, the whole 13C-PLFA profile was also identified to be significantly related to CO2 concentration (Mantel test, p < 0.05) (Table 2). The increase in plant biomass was considered to be the main mechanism underlying the above responses.

5. Conclusions

In this study, we focused on the changes in the overall microbial community structure and the subset of microbes involved in 13C-CO2 incorporation during 15 days of CO2 fumigation at different levels. We demonstrated that the overall microbial community structure was not changed, while the microbes involved in 13C-CO2 incorporation significantly (p < 0.05) differed between the 400 and 800 µmol·mol−1 CO2 treatment groups from labeling day 10 onward. The Mantel test further revealed that the 13C-PLFA profile was significantly related to the CO2 concentration. In addition, the mol% of 13C in the PLFAs 18:2ω6,9 (fungi), 20:0 (general PLFA) and 10-Me-18:0 (actinomycetes) were higher (p < 0.05) in the 800 µmol mol−1 CO2 treatment group, while those of 18:1ω9c (G) and 16:1ω7c (G) were much higher (p < 0.05) in the 400 µmol·mol−1 CO2 treatment group. In summary, this study successfully revealed the important role of 18:2ω6,9, 10-Me-18:0 and 18:1ω9c in incorporating rhizodeposits under eCO2. The structures of 13C rhizodeposits need to be analyzed to completely understand the mechanism of the effects of eCO2 on soil microbes in future work.

Supplementary Materials

The following are available online at https://www.mdpi.com/article/10.3390/microorganisms9102121/s1. Figure S1: Differences in PLFA composition (mol%) between the 400 and 800 µmol·mol−1 CO2 treatment groups in unplanted and planted soils on each sampling day. Figure S2: Loading scores of 19 PLFAs in the principal component analysis (PCA) at the end of the 15-day labeling experiment. Figure S3: 13C-PLFA compositions (mol%) of fungi, general PLFAs, G, G+ and actinomycetes in planted and unplanted soils during the 15-day labeling experiment. Figure S4: Changes in AT% 13C/12C values of 18:2ω6,9 and 18:1ω9c under various CO2 treatments during the 15-day labeling experiment. Table S1: Biochemical properties of the unplanted soils under various CO2 treatments. Table S2: Adonis analysis based on mol% of 13C-PLFAs between the 400 and 800 µmol·mol−1 CO2 treatment groups during the whole labeling period. Table S3: Mantel tests between special PLFAs or 13C-PLFAs and environmental factors at the end of labeling in the 400 and 800 µmol·mol−1 CO2 treatment groups (p).

Author Contributions

Conceptualization, H.Y.; data curation, H.W.; funding acquisition, C.G. and H.Y.; investigation, H.W.; methodology, C.G. and H.Y.; writing—original draft, H.W.; writing—review and editing, J.W. and C.G. All authors have read and agreed to the published version of the manuscript.

Funding

This research was funded by the National Natural Science Foundation of China (Grant Numbers 41976151 and 42077036).

Institutional Review Board Statement

Not applicable.

Informed Consent Statement

Not applicable.

Data Availability Statement

The data presented in this study are available in this article and Supplementary Materials.

Acknowledgments

We thank Yongxiang Yu, Jiantao Xue, Haoxin Fan, Xing Li and Ming Yuan for technical assistance.

Conflicts of Interest

The authors declare no conflict of interest.

References

  1. IPCC. IPCC, 2013: Climate Change 2013: The Physical Science Basis. Contribution of Working Group I to the Fifth Assessment Report of the Intergovernmental Panel on Climate Change; Cambridge University Press: Cambridge, UK; New York, NY, USA, 2014; 1535p. Available online: trove.nla.gov.au/work/190076309 (accessed on 24 August 2021).
  2. Procter, A.C.; Gill, R.A.; Fay, P.A.; Polley, H.W.; Jackson, R.B. Soil carbon responses to past and future CO2 in three Texas prairie soils. Soil Biol. Biochem. 2015, 83, 66–75. [Google Scholar] [CrossRef] [Green Version]
  3. Van der Kooi, C.J.; Reich, M.; Löw, M.; De Kok, L.J.; Tausz, M. Growth and yield stimulation under elevated CO2 and drought: A meta-analysis on crops. Environ. Exp. Bot. 2016, 122, 150–157. [Google Scholar] [CrossRef]
  4. Calvo, O.C.; Franzaring, J.; Schmid, I.; Fangmeier, A. Root exudation of carbohydrates and cations from barley in response to drought and elevated CO2. Plant Soil 2019, 438, 127–142. [Google Scholar] [CrossRef]
  5. Saha, S.; Sehgal, V.K.; Chakraborty, D.; Pal, M. Atmospheric carbon dioxide enrichment induced modifications in canopy radiation utilization, growth and yield of chickpea (Cicer arietinum L.). Agric. For. Meteorol. 2015, 202, 102–111. [Google Scholar] [CrossRef]
  6. Nguyen, C. Rhizodeposition of organic C by plants: Mechanisms and controls. In Sustainable Agriculture; Springer: Dordrecht, The Netherlands, 2003; pp. 97–123. [Google Scholar] [CrossRef]
  7. Bertin, C.; Yang, X.; Weston, L.A. The role of root exudates and allelochemicals in the rhizosphere. Plant Soil 2003, 256, 67–83. [Google Scholar] [CrossRef]
  8. Li, X.; Dong, J.; Chu, W.; Chen, Y.; Duan, Z. The relationship between root exudation properties and root morphological traits of cucumber grown under different nitrogen supplies and atmospheric CO2 concentrations. Plant Soil 2018, 425, 415–432. [Google Scholar] [CrossRef]
  9. Badri, D.V.; Vivanco, J.M. Regulation and function of root exudates. Plant Cell Environ. 2010, 32, 666–681. [Google Scholar] [CrossRef]
  10. Wu, Q.; Congzhi, Z.; Zhenghong, Y.; Jiabao, Z.; Chunwu, Z.; Zhanhui, Z.; Jiananran, X.; Jinlin, C. Effects of elevated CO2 and nitrogen addition on organic carbon and aggregates in soil planted with different rice cultivars. Plant Soil 2018, 432, 245–258. [Google Scholar] [CrossRef]
  11. Yu, Z.; Li, Y.; Wang, G.; Liu, J.; Liu, J.; Liu, X.; Herbert, S.J.; Jin, J. Effectiveness of elevated CO2 mediating bacterial communities in the soybean rhizosphere depends on genotypes. Agric. Ecosyst. Environ. 2016, 231, 229–232. [Google Scholar] [CrossRef]
  12. Runion, G.B.; Curl, E.A.; Rogers, H.H.; Backman, P.A.; Rodríguez-Kábana, R.; Helms, B.E. Effects of free-air CO2 enrichment on microbial populations in the rhizosphere and phyllosphere of cotton. Agric. For. Meteorol. 1994, 70, 117–130. [Google Scholar] [CrossRef]
  13. Wang, P.; Marsh, E.L.; Ainsworth, E.A.; Leakey, A.D.B.; Sheflin, A.M.; Schachtman, D.P. Shifts in microbial communities in soil, rhizosphere and roots of two major crop systems under elevated CO2 and O3. Sci. Rep. 2017, 7, 15019. [Google Scholar] [CrossRef] [Green Version]
  14. Blagodatskaya, E.; Blagodatsky, S.; Dorodnikov, M.; Kuzyakov, Y. Elevated atmospheric CO2 increases microbial growth rates in soil: Results of three CO2 enrichment experiments. Glob. Chang. Biol. 2010, 16, 836–848. [Google Scholar] [CrossRef] [Green Version]
  15. Qiu, Y.; Jiang, Y.; Guo, L.; Zhang, L.; Hu, S. Shifts in the Composition and Activities of Denitrifiers Dominate CO2 Stimulation of N2O Emissions. Environ. Sci. Technol. 2019, 53, 11204–11213. [Google Scholar] [CrossRef]
  16. Treonis, A.M.; Ostle, N.J.; Stott, A.W.; Primrose, R.; Grayston, S.J.; Ineson, P. Identification of groups of metabolically-active rhizosphere microorganisms by stable isotope probing of PLFAs. Soil Biol. Biochem. 2004, 36, 533–537. [Google Scholar] [CrossRef]
  17. Esperschütz, J.; Gattinger, A.; Buegger, F.; Lang, H.; Munch, J.C.; Winkler, M.S.B. A continuous labelling approach to recover photosynthetically fixed carbon in plant tissue and rhizosphere organisms of young beech trees (Fagus sylvatica L.) using 13C depleted CO2. Plant Soil 2009, 323, 21–29. [Google Scholar] [CrossRef]
  18. Zhang, Q.; Jin, H.; Zhou, H.; Cai, M.; Li, Y.; Zhang, G.; Di, H. Variation of soil anaerobic microorganisms connected with anammox processes by 13C-phospholipid fatty acid analysis among long-term fertilization regimes in a crop rotation system. Appl. Soil Ecol. 2018, 133, 34–43. [Google Scholar] [CrossRef]
  19. Da Costa, D.P.; Dias, A.C.F.; Cotta, S.R.; Vilela, D.; de Andrade, P.A.M.; Pellizari, V.H.; Andreote, F.D. Changes of bacterial communities in the rhizosphere of sugarcane under elevated concentration of atmospheric CO2. GCB Bioenergy 2018, 10, 137–145. [Google Scholar] [CrossRef] [Green Version]
  20. Mayr, C.; Miller, M.; Insam, H. Elevated CO2 alters community-level physiological profiles and enzyme activities in alpine grassland. J. Microbiol. Methods 1999, 36, 35–43. [Google Scholar] [CrossRef]
  21. Grayston, S.J.; Campbell, C.D.; Lutze, J.L.; Gifford, R.M. Impact of elevated CO2 on the metabolic diversity of microbial communities in N-limited grass swards. Plant Soil 1998, 203, 289–300. [Google Scholar] [CrossRef]
  22. Diao, T.; Peng, Z.; Niu, X.; Yang, R.; Ma, F.; Guo, L. Changes of Soil Microbes Related with Carbon and Nitrogen Cycling after Long-Term CO2 Enrichment in a Typical Chinese Maize Field. Sustainability 2020, 12, 1250. [Google Scholar] [CrossRef] [Green Version]
  23. Fang, H.; Cheng, S.; Lin, E.; Yu, G.; Niu, S.; Wang, Y.; Xu, M.; Dang, X.; Li, L.; Wang, L. Elevated atmospheric carbon dioxide concentration stimulates soil microbial activity and impacts water-extractable organic carbon in an agricultural soil. Biogeochemistry 2015, 122, 253–267. [Google Scholar] [CrossRef]
  24. Zheng, J.-Q.; Han, S.-J.; Zhou, Y.-M.; Ren, F.-R.; Xin, L.-H.; Zhang, Y. Microbial Activity in a Temperate Forest Soil as Affected by Elevated Atmospheric CO2. Pedosphere 2010, 20, 427–435. [Google Scholar] [CrossRef]
  25. Cheng, L.; Booker, F.L.; Burkey, K.O.; Tu, C.; Shew, H.D.; Rufty, T.W.; Fiscus, E.L.; Deforest, J.L.; Hu, S. Soil microbial responses to elevated CO2 and O3 in a nitrogen-aggrading agroecosystem. PLoS ONE 2011, 6, e21377. [Google Scholar] [CrossRef] [Green Version]
  26. Haase, S.; Philippot, L.; Neumann, G.; Marhan, S.; Kandeler, E. Local response of bacterial densities and enzyme activities to elevated atmospheric CO2 and different N supply in the rhizosphere of Phaseolus vulgaris L. Soil Biol. Biochem. 2008, 40, 1225–1234. [Google Scholar] [CrossRef]
  27. Wang, H.; Fan, H.; Yao, H. Effects of Elevated CO2 on Tomato (Lycopersicon esculentum Mill.) Growth and Rhizosphere Soil Microbial Community Structure and Functionality. Agronomy 2020, 10, 1752. [Google Scholar] [CrossRef]
  28. Wu, W.X.; Liu, W.; Lu, H.H.; Chen, Y.X.; Devare, M.; Thies, J. Use of 13C labeling to assess carbon partitioning in transgenic and nontransgenic (parental) rice and their rhizosphere soil microbial communities. FEMS Microbiol. Ecol. 2009, 67, 93–102. [Google Scholar] [CrossRef]
  29. Schonhof, I.; Kläring, H.P.; Krumbein, A.; Schreiner, M. Interaction Between Atmospheric CO2 and Glucosinolates in Broccoli. J. Chem. Ecol. 2007, 33, 105–114. [Google Scholar] [CrossRef]
  30. Long, S.P.; Ainsworth, E.; Rogers, A.; Ort, D.R. Rising atmospheric carbon dioxide: Plants FACE the future. Annu. Rev. Plant Biol. 2004, 55, 591–628. [Google Scholar] [CrossRef]
  31. Korres, N.E.; Norsworthy, J.K.; Tehranchian, P.; Gitsopoulos, T.K.; Loka, D.A.; Oosterhuis, D.M.; Gealy, D.R.; Moss, S.R.; Burgos, N.R.; Miller, M.R. Cultivars to face climate change effects on crops and weeds: A review. Agron. Sustain. Dev. 2016, 36, 12. [Google Scholar] [CrossRef] [Green Version]
  32. Butterly, C.R.; Wang, X.; Armstrong, R.D.; Chen, D.; Tang, C. Elevated CO2 induced rhizosphere effects on the decomposition and N recovery from crop residues. Plant Soil 2016, 408, 55–71. [Google Scholar] [CrossRef]
  33. Xu, Q.; O’Sullivan, J.B.; Wang, X.; Tang, C. Elevated CO2 alters the rhizosphere effect on crop residue decomposition. Plant Soil 2019, 436, 413–426. [Google Scholar] [CrossRef]
  34. Ferrocino, I.; Chitarra, W.; Pugliese, M.; Gilardi, G.; Gullino, M.L.; Garibaldi, A. Effect of elevated atmospheric CO2 and temperature on disease severity of Fusarium oxysporum f.sp. lactucae on lettuce plants. Appl. Soil Ecol. 2013, 72, 1–6. [Google Scholar] [CrossRef]
  35. Martinsen, V.; Austrheim, G.; Mysterud, A.; Mulder, J. Effects of herbivory on N-cycling and distribution of added 15NH4+ in N-limited low-alpine grasslands. Plant Soil 2011, 347, 279–292. [Google Scholar] [CrossRef]
  36. Yao, H.; Thornton, B.; Paterson, E. Incorporation of 13C-labelled rice rhizodeposition carbon into soil microbial communities under different water status. Soil Biol. Biochem. 2012, 53, 72–77. [Google Scholar] [CrossRef]
  37. Bligh, E.G.; Dyer, W.J. A rapid method of total lipid extraction and purification. Can. J. Biochem. Physiol. 1959, 37, 911–917. [Google Scholar] [CrossRef] [Green Version]
  38. Thornton, B.; Zhang, Z.; Mayes, R.W.; Hogberg, M.N.; Midwood, A.J. Can gas chromatography combustion isotope ratio mass spectrometry be used to quantify organic compound abundance? Rapid Commun. Mass Spectrom. 2011, 25, 2433–2438. [Google Scholar] [CrossRef] [PubMed]
  39. Zhang, H.; Ding, W.; Yu, H.; He, X. Carbon uptake by a microbial community during 30-day treatment with 13C-glucose of a sandy loam soil fertilized for 20 years with NPK or compost as determined by a GC–C–IRMS analysis of phospholipid fatty acids. Soil Biol. Biochem. 2013, 57, 228–236. [Google Scholar] [CrossRef]
  40. Frostegård, Å.; Tunlid, A.; Bååthb, E. Use and misuse of PLFA measurements in soils. Soil Biol. Biochem. 2011, 43, 1621–1625. [Google Scholar] [CrossRef]
  41. Lai, J. Quantitative Ecology: Applications of the R Language; Higher Education Press: Beijing, China, 2014. [Google Scholar]
  42. Canarini, A.; Wanek, W.; Merchant, A.; Richter, A.; Kaiser, C. Root exudation of primary metabolites: Mechanisms and their roles in plant responses to environmental stimuli. Front. Plant Sci. 2019, 10, 157. [Google Scholar] [CrossRef] [Green Version]
  43. Hodge, A.; Paterson, E.; Grayston, S.J.; Campbell, C.; Ord, B.G.; Killham, K. Characterization and microbial utilization of exudate material from the rhizosphere of Lolium perenne grown under CO2 enrichment. Soil Biol. Biochem. 1998, 583, 1033–1043. [Google Scholar] [CrossRef]
  44. Zak, D.R.; Pregitzer, K.S.; Curtis, P.S.; Holmes, W.E. Atmospheric CO2 and the composition and function of soil microbial communities. Ecol. Appl. 2000, 10, 47–59. [Google Scholar] [CrossRef] [Green Version]
  45. Guenet, B.; Lenhart, K.; Leloup, J.; Giusti-Miller, S.; Pouteau, V.; Mora, P.; Nunan, N.; Abbadie, L. The impact of long-term CO2 enrichment and moisture levels on soil microbial community structure and enzyme activities. Geoderma 2012, 170, 331–336. [Google Scholar] [CrossRef]
  46. Hayden, H.L.; Mele, P.M.; Bougoure, D.S.; Allan, C.Y.; Norng, S.; Piceno, Y.M.; Brodie, E.L.; DeSantis, T.Z.; Andersen, G.L.; Williams, A.L. Changes in the microbial community structure of bacteria, archaea and fungi in response to elevated CO2 and warming in an Australian native grassland soil. Environ. Microbiol. 2012, 14, 3081–3096. [Google Scholar] [CrossRef]
  47. Long, X.E.; Yao, H.; Huang, Y.; Wei, W.; Zhu, Y.G. Phosphate levels influence the utilization of rice rhizodeposition carbon and the phosphate-solubilising microbial community in a paddy soil. Soil Biol. Biochem. 2018, 118, 103–114. [Google Scholar] [CrossRef]
  48. Klamer, M.; Bååthb, E. Estimation of conversion factors for fungal biomass determination in compost using ergosterol and PLFA 18:2ω6,9. Soil Biol. Biochem. 2004, 36, 57–65. [Google Scholar] [CrossRef]
  49. Cheng, L.; Booker, F.L.; Tu, C.; Burkey, K.O.; Zhou, L.; Shew, H.D.; Rufty, T.W.; Hu, S. Arbuscular mycorrhizal fungi increase organic carbon decomposition under elevated CO2. Science 2012, 337, 1084–1087. [Google Scholar] [CrossRef]
  50. Lesaulnier, C.; Papamichail, D.; McCorkle, S.; Ollivier, B.; Skiena, S.; Taghavi, S.; Zak, D.; Van Der Lelie, D. Elevated atmospheric CO2 affects soil microbial diversity associated with trembling aspen. Environ. Microbiol. 2008, 10, 926–941. [Google Scholar] [CrossRef] [Green Version]
  51. Gill, R.A.; Polley, H.W.; Johnson, H.B.; Anderson, L.J.; Maherali, H.; Jackson, R.B. Nonlinear grassland responses to past and future atmospheric CO2. Nature 2002, 417, 279–282. [Google Scholar] [CrossRef]
  52. Hu, S.; Chapin, F.S.; Firestone, M.; Field, C.; Chiariello, N. Nitrogen limitation of microbial decomposition in a grassland under elevated CO2. Nature 2001, 409, 188–191. [Google Scholar] [CrossRef]
  53. Ho, A.; Di Lonardo, D.P.; Bodelier, P.L.E. Revisiting life strategy concepts in environmental microbial ecology. FEMS Microbiol. Ecol. 2017, 93, fix006. [Google Scholar] [CrossRef] [Green Version]
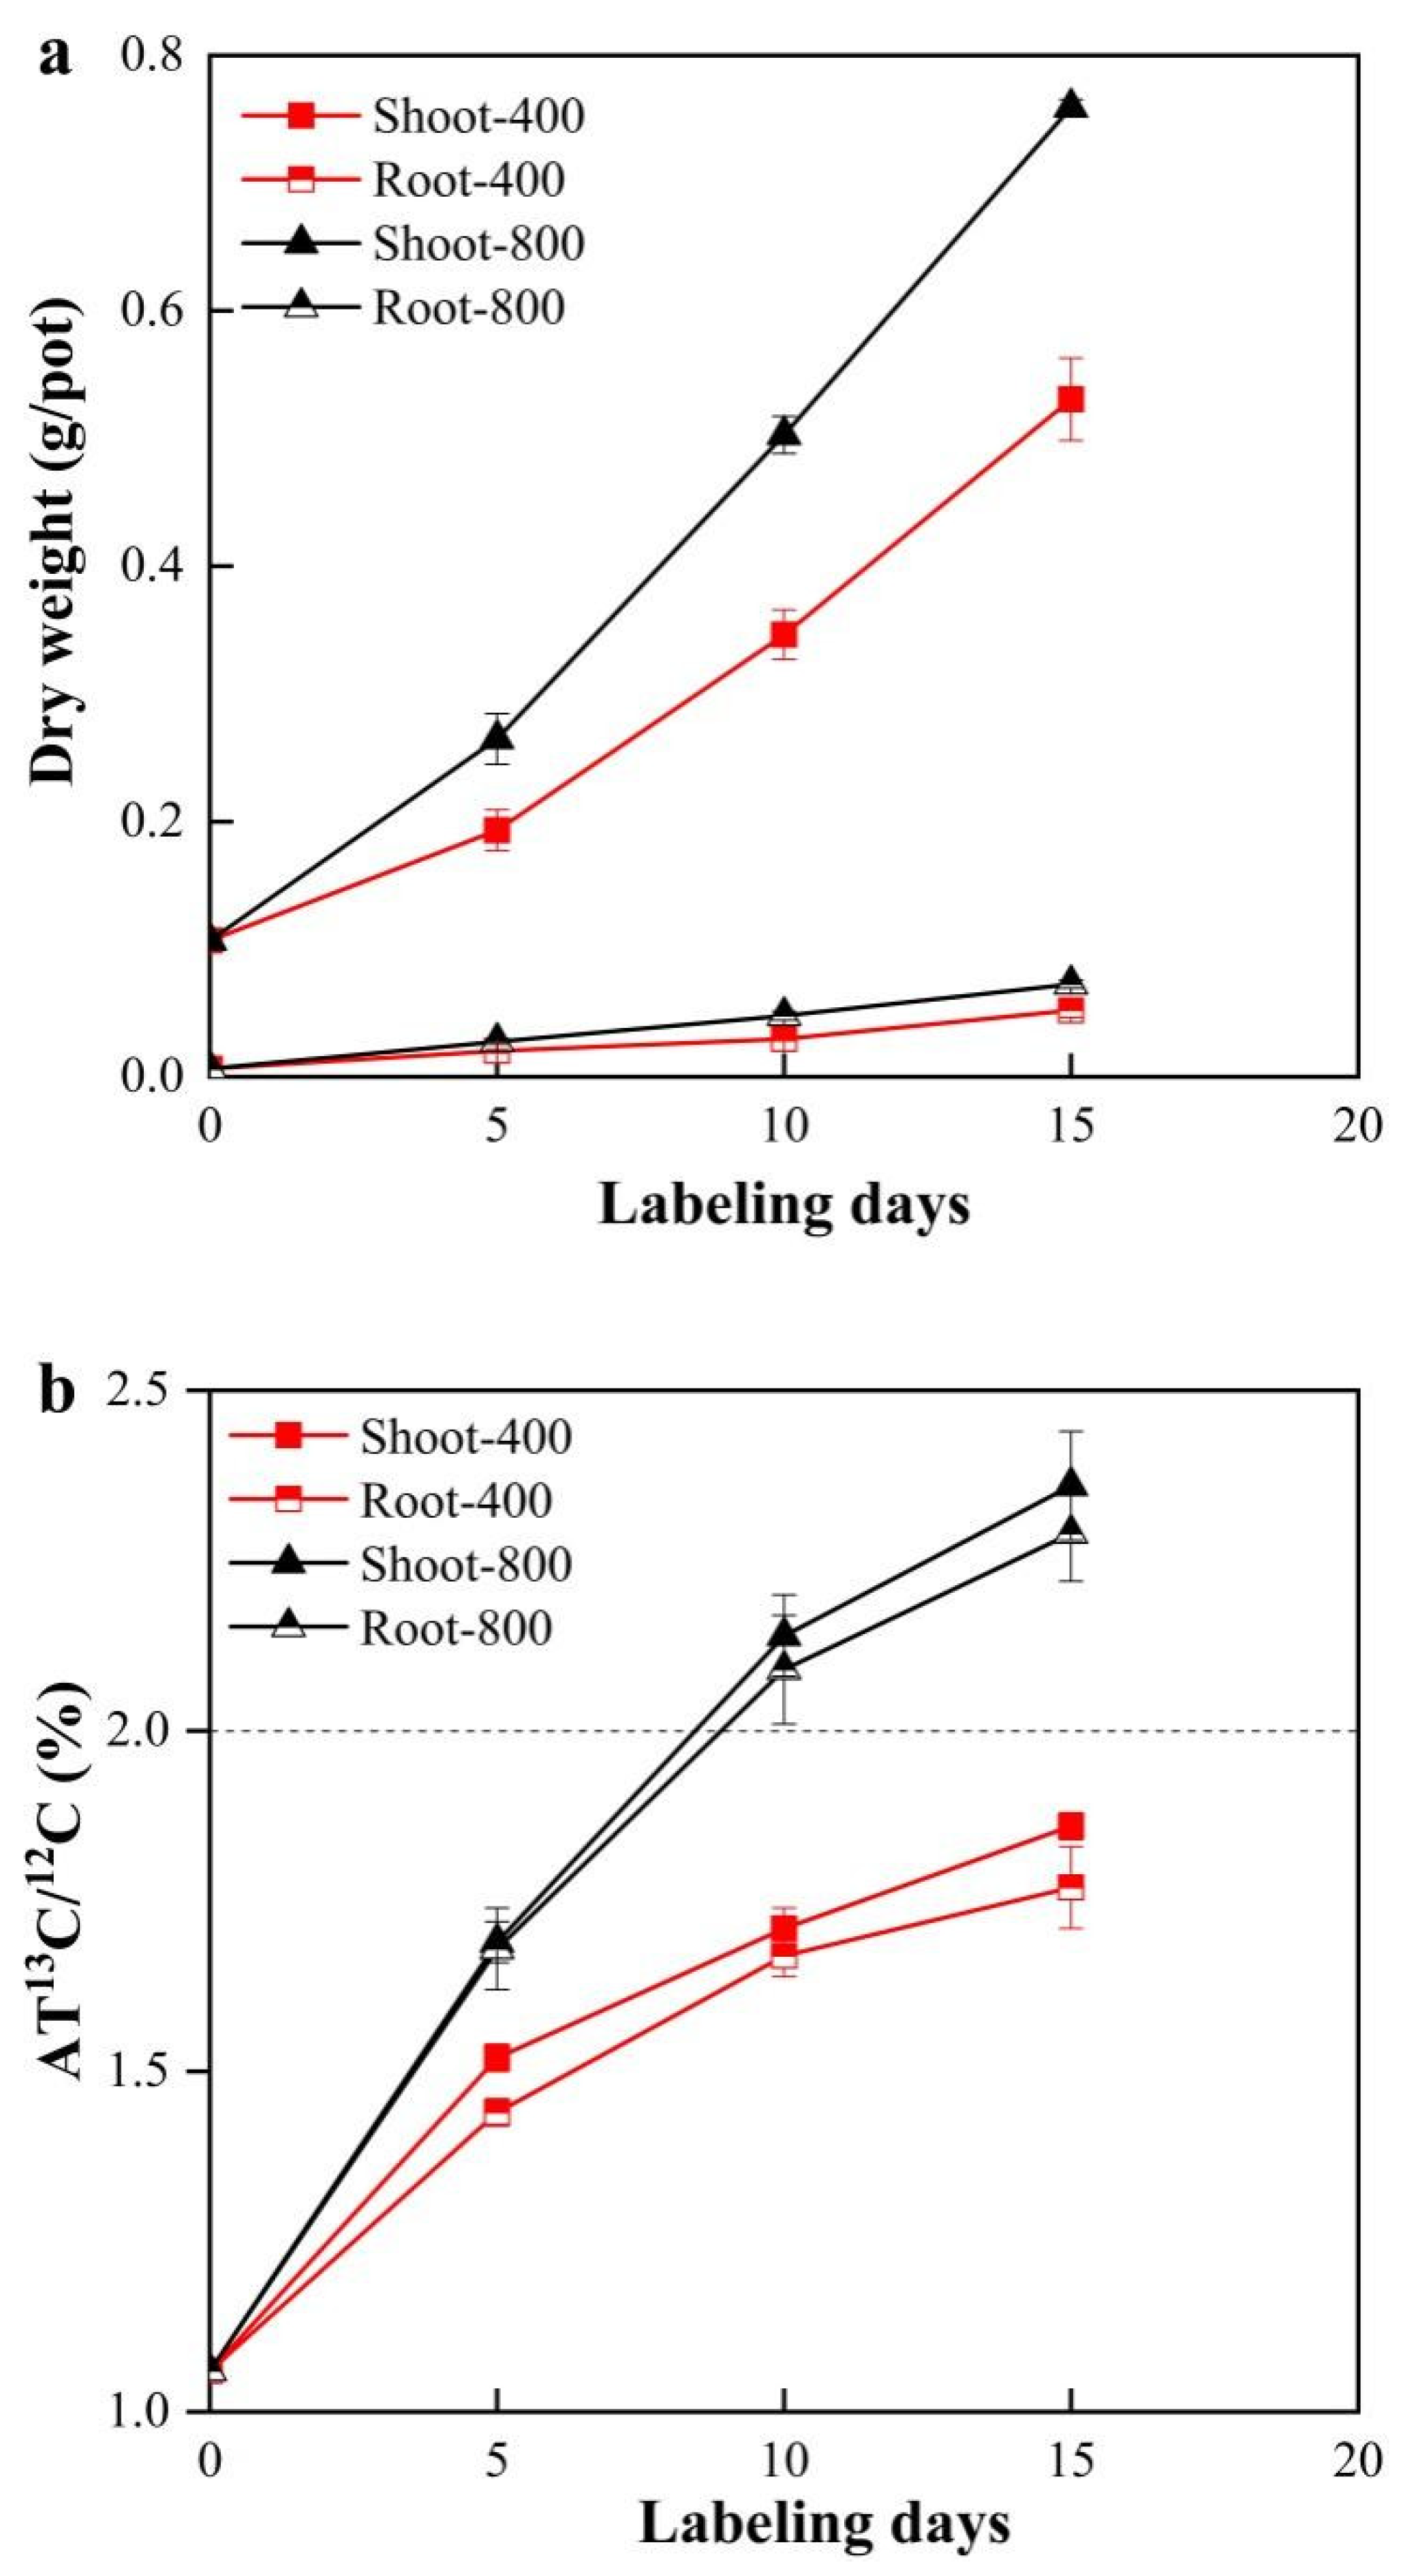
Figure 1. Changes in plant dry weights (a) and AT% 13C/12C values of shoots and roots (b) during the 15 labeling days. 400:400 µmol·mol−1 CO2 treatment; 800:800 µmol·mol−1 CO2 treatment. Bars represent the standard errors of the means (n = 4).
Microorganisms 09 02121 g001
Figure 2. Changes in pH (a), moisture (b), DOC (c), DON (d), NO3−N (e) and NH4+−N (f) during the 15 labeling days under both the 400 and 800 treatments. 400:400 µmol·mol−1 CO2 treatment; 800:800 µmol·mol−1 CO2 treatment. Bars represent the standard errors of the means (n = 4). *: p < 0.05; ***: p < 0.001.
Microorganisms 09 02121 g002
Figure 3. Principal component analysis of the PLFA composition of soil samples at the end of the 15−day labeling experiment. Values in parentheses on the axis labels indicate the percentage variation accounted for by each axis. 400:400 µmol·mol−1 CO2 treatment; 800:800 µmol·mol−1 CO2 treatment; the control soil is the original tomato soil.
Microorganisms 09 02121 g003
Figure 4. Differences in 13C-PLFA composition (mol%) between the 400 and 800 µmol·mol−1 CO2 treatment groups in unplanted (a) and planted (bd) soils on each sampling day. Labels shown in the figure represent significant 13C-PLFA biomarkers (p < 0.05). 400:400 µmol mol−1 CO2 treatment; 800:800 µmol·mol−1 CO2 treatment. Bars represent the standard errors of the means (n = 4). *: p < 0.05.
Microorganisms 09 02121 g004
Figure 5. Principal component analysis of the 13C−PLFA composition (mol%) of soil samples under various CO2 treatments during the 15-day labeling experiment. Values in parentheses on the axis labels indicate the percentage variation accounted for by each axis. 400:400 µmol·mol−1 CO2 treatment; 800:800 µmol·mol−1 CO2 treatment.
Microorganisms 09 02121 g005
Table 1. The total enrichment of 13C into the PLFA of individual soil samples under varied CO2 concentration treatments.
Labeled DaysCO2 Concentration (µmol·mol−1)Labeled Amount (nmol·g −1)
Average ± STD
Enrichment Rate (%)
Average ± STD
5400 124.43 ± 4.39 ab 27.43 ± 1.35 b
80060.05 ± 11.37 b15.13 ± 1.45 c
1040049.66 ± 9.6 ab12.65 ± 1.95 c
800150.46 ± 45.25 c34.27 ± 6.29 d
15400188.71 ± 16.14 c35.82 ± 2.33 d
800456.76 ± 67.91 d68.89 ± 4.25 e
CO2 concentrations*
Labeling days***
CO2 concentration:Labeling daysns
Unplanted soil4003.52 ± 0.45 a1.08 ± 0.14 a
8005.61 ± 0.79 a1.65 ± 0.22 a
1 400:400 µmol·mol−1 CO2 treatments; 800:800 µmol·mol−1 CO2 treatments. 2 Values are means ± standard deviation (n = 4). Values with different lowercase letters within a column and same stage are statistically significantly different at p < 0.05. * p < 0.05; *** p < 0.001.
Table 2. Mantel tests between PLFA or 13C-PLFA and environmental factors under 400 and 800 µmol·mol−1 CO2 treatments.
FactorsPLFA Composition13C-PLFA Composition
Mantel Statistic rSignificanceMantel Statistic rSignificance
CO20.38870.05620.45560.0289 *
DOC 10.36360.0489 *0.42810.0256 *
TDW0.49050.0204 *0.70880.0008 ***
CO2_DOC0.16480.18810.19580.1594
CO2_TDW−0.07140.6301−0.41990.9494
DOC_TDW−0.026410.5555−0.26380.846
TDW_DOC0.35430.06850.65810.0035 **
1 Abbreviations: DOC, dissolved organic carbon; TDW, total dry weight; CO2_DOC, the DOC was set as a covariate; CO2_TDW, the TDW was set as a covariate; DOC_TDW, the TDW was set as a covariate; TDW_DOC, the DOC was set as a covariate. *, p < 0.05; **, p < 0.01; ***, p < 0.001.
Publisher’s Note: MDPI stays neutral with regard to jurisdictional claims in published maps and institutional affiliations.