Abstract
The induction of highly conserved heat shock protein 70 (HSP70) is often related to a cellular response due to harmful stress or adverse life conditions. In this study, we determined the expression of Hsp70 genes in the Antarctic yeast, Glaciozyma antarctica, under different several thermal treatments for several exposure periods. The main aims of the present study were (1) to determine if stress-induced Hsp70 could be used to monitor the exposure of the yeast species G. antarctica to various types of thermal stress; (2) to analyze the structures of the G. antarctica HSP70 proteins using comparative modeling; and (3) to evaluate the relationship between the function and structure of HSP70 in G. antarctica. In this study, we managed to amplify and clone 2 Hsp70 genes from G. antarctica named GaHsp70-1 and GaHsp70-2. The cells of G. antarctica expressed significantly inducible Hsp70 genes after the heat and cold shock treatments. Interestingly, GaHsp70-1 showed 2–6-fold higher expression than GaHsp70-2 after the heat and cold exposure. ATP hydrolysis analysis on both G. antarctica HSP70s proved that these psychrophilic chaperones can perform activities in a wide range of temperatures, such as at 37, 25, 15, and 4 °C. The 3D structures of both HSP70s revealed several interesting findings, such as the substitution of a β-sheet to loop in the N-terminal ATPase binding domain and some modest residue substitutions, which gave the proteins the flexibility to function at low temperatures and retain their functional activity at ambient temperatures. In conclusion, both analyzed HSP70s played important roles in the physiological adaptation of G. antarctica.
1. Introduction
HSP70 proteins in marine organisms have gained much research attention. They serve as potential biomarkers for environmental stress because of their high sensitivity and variability in expression when cells are exposed to different stimuli [1,2]. They also play important roles in cellular protein folding processes, change the structures of newly synthesized proteins, and repair unsuccessful protein conformations [3]. In bacteria, DnaK is a bacterial representative of the HSP70 chaperone family, which plays a key role in protein folding during non-stress growth conditions and becomes more important during stress conditions [4]. To elucidate the characteristics of the HSP70, numerous studies have been conducted using HSP70 as a biomarker to signal the possible environmental changes expressed in the organisms through the expression of the genes and the subsequent activation of the protein [5,6,7,8,9,10,11]. Furthermore, HSP70s are the best indicator for environmental stress, such as heat, because they are activated in all cellular reactions, reside in all subcellular compartments, are abundant and highly sensitive, are extremely important for cellular repair machinery, and are involved in the homeostasis of all living organisms [12,13,14,15].
From a molecular point of view, the mechanisms of action of HSP70 are generally based on the N-terminal ATPase domain and the C-terminal binding domain, which is subdivided into a β-sandwich subdomain and a C-terminal α-helical subdomain. The sequence alignment of the HSP70 proteins reveals differences that may reflect adaptations related to resistance and resilience to environmental stress [16]. A shift in the ATPase cycle can be observed, with it changing between the ATP state, which has a low affinity and a rapid energetic cost for a substrate, and ADP state, which has a high affinity and a low energetic cost for the substrate [3]. Although the importance of HSP70 is undeniable, research on the structure and function of psychrophilic HSP70 is still in its infancy. Hence, it is important to unveil the relationship between the structure and function of HSP70 in order to understand the response and level of resistance towards thermal stress in living organisms in Antarctica.
Glaciozyma antarctica PI12 is an obligate psychrophilic yeast isolated from the Antarctic marine water near Casey Station (S66° 21′ 25″; E110° 37′ 09″) in the Southern Ocean of Antarctica. It can grow in a range of temperatures from −12 °C to 20 °C, with its optimal growth temperature being 12 °C. [17]. The genome data have revealed that G. antarctica PI12 has a total of 7857 protein-coding genes [18]. Previously, Boo et al. (2013) measured the expression levels of genes in G. antarctica PI12 that was exposed to cold and heat shocks using quantitative real-time PCR (qPCR) [17]. Several related studies on G. antarctica PI12 have provided some insight into the strategies used by this yeast to adapt to thermal stress [19,20,21,22,23]. Most stress-related gene studies have been carried out at the gene level, and our understanding of the molecular architecture of the proteins is still limited [5,6,7,9,13,17,24,25,26,27,28,29]. In the previous study by Yusof et al. (2019), a total of five Hsp70s were found to have significant expression patterns in response to heat stress [23]. G. antarctica Hsp70 genes were identified to contain transcript-1 and transcript-2, which were found in the ribosome and mitochondria, respectively [23]. Meanwhile, in this study, the full lengths of 2 out of 5 Hsp70 genes were amplified and characterized. Transcript-1 and transcript-2 were characterized and named GaHsp70-1 and GaHsp70-2, respectively. Therefore, the findings from this study will provide the community with a better understanding of the adaptation mechanisms of G. antarctica PI12 by determining the relationship between the structure and function of the HSP70 stress proteins.
In the present study, G. antarctica PI12 was chosen for several reasons. Firstly, the availability of its genome allows the thorough investigation of its heat shock proteins. Secondly, it can be readily maintained under laboratory conditions for in vitro and in vivo experiments, as many studies have previously proven [18,20,21,22]. HSP70′s protein-coding genes were the main targets, since the Hsp70 genes appeared to be significantly expressed when exposed to a sublethal temperature of 22 °C [17]. Moreover, G. antarctica PI12 has a high similarity with Saccharomyces cerevisiae, with more than 60% similarity; hence, it may serve as a good model organism with which to study the thermal adaptation of the eukaryotic polar organism. Since the genome of G. antarctica PI12 and the optimal cultivation conditions are known, G. antarctica PI12 may serve as an excellent model organism for the polar environment. Therefore, using gene expression analysis with real-time polymerase chain reaction (PCR), the aims of the present study were (1) to determine if stress-induced Hsp70 could be used to monitor the exposure of the yeast species G. antarctica to various types of thermal stress, (2) to analyze the structures of the G. antarctica HSP70 proteins using comparative modelling, and (3) to evaluate the relationship between the function and structure of HSP70 in G. antarctica.
2. Results
2.1. G. antarctica HSP70 Sequence Analysis
Extracted RNA was analyzed to determine its integrity and the presence of 18 S and 28 S using gel electrophoresis (Figure S1). GaHsp70-1 and GaHsp70-2 were amplified at the target sizes of 1884 bp and 2019 bp, respectively, followed by cloning and verification using sequencing (Figure S2). The G. antarctica HSP70 sequence analysis revealed that these proteins are related to HSP70 proteins from other organisms. GaHSP70-1 was found to be related to HSP70s from Rhodotorula graminis WP1 (acc. no. XP_018267745.1), Rhodotorula diobovata (acc. no. TNY21258.1), Rhodotorula sp. JG-1b (acc. no. KWU41802.1), and Rhodotorula mucilaginosa (acc. no. KAG0657616.1), with a percentage identity between 81% and 91%. In addition, GaHSP70-2 was found to be related to HSP70s and DnaK from Leucosporidium creatinivorum (acc. no. ORY92759.1), HSP70-like protein Microbotryum lychnidis-dioicae p1A1 Lamole (acc. no. KDE08371.1), Rhodotorula toruloides NP11 (acc. no. XP_016269663.1), and Puccinia sorghi (acc. no. KNZ63140.1), with a percentage identity between 73% and 89% (Table S1). The sequence alignment with model organisms showed that both sequences contained a C-terminal subdomain, substrate-binding domain, and conserved ATPase N-terminal binding domain (Figure S3). Based on the GO analysis, both HSP70s were projected to have a similar biological process for protein folding (GO:0006457) and molecular functions for ATP binding (GO: 0005525) and ATPase (GO: 0016887). Phylogenetic tree analysis showed that GaHSP70-1 and GaHSP70-2 have a high similarity at the protein level with other HSP70s from other fungi (Figure 1).
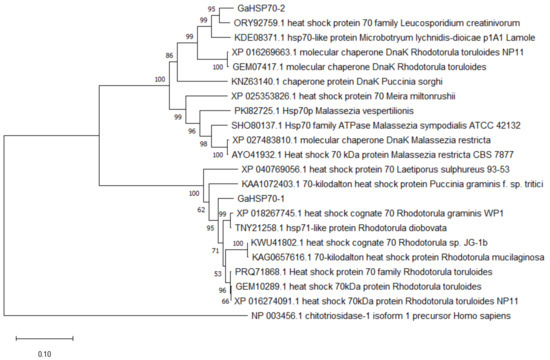
Figure 1.
Phylogenetic tree analysis of GaHSP70-1 and GaHSP70-2 aligned with HSP70 proteins from other organisms. A chitotriosidase from Homo sapiens was used as an outlier. The tree was constructed using the neighbor-joining method. The numbers close to the individual branches represent the percentage of the 1000 bootstrap iterations supporting the branch.
2.2. G. antarctica Hsp70 mRNA Expression Levels at Different Temperatures
The real-time PCR primers were designed to specifically amplify G. antarctica Hsp70 at the level of 100 to 200 base pairs. The efficiency of the primers used in this study had values of between 95% and 110%, with R2 values ranging from 0.97 to 1.00 (Table 1). The purity of the RNA was 1.9 to 2.0. The melting curve analysis showed a single amplification of the 18 S, GaHsp70-1, and GaHsp70-2 genes. The PCR efficiency of the primers used to amplify the 18 S, GaHsp70-1, and GaHsp70-2 genes was acceptable, as the slopes were within the range of −3.0 to −3.3. Thus, the template purity and PCR efficiency fulfilled the standard characteristics [30]. The GaHsp70-1 and GaHsp70-2 messenger RNA (mRNA) expressions in G. antarctica were measured at different temperatures to determine the induction of G. antarctica Hsp70 genes (Figure 2). GaHsp70-1 mRNA expression strongly increased in cells exposed to temperatures far from the optimal growth of 12 °C, with temperatures of −20, 0, 20, and 30 °C associated with 5.26-, 6.33-, 5.43-, and 4-fold increases, respectively. Meanwhile, the GaHsp70-2 mRNA expression showed increments of 2.82-, 1.3-, 2.43-, and 1.37-fold, lower than the GaHsp70-1 mRNA expression at −20, 0, 20, and 30 °C. The increase in expression of both G. antarctica Hsp70 mRNAs at all exposure temperatures indicates the importance of Hsp70 in cell stress management in conditions of thermal stress.

Table 1.
Primers used for rt-PCR.
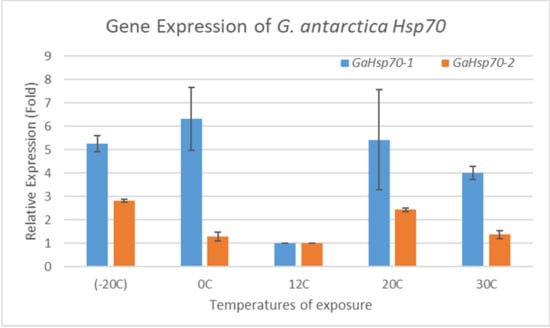
Figure 2.
Hsp70 mRNA expression in G. antarctica PI12. GaHsp70-1 and GaHsp70-2 levels were measured in cells exposed to temperatures of −20, 0, 20, and 30 °C for 6 h and normalized to 18 S (reference gene) levels. The mRNA expression at 12 °C was set to 1, and other values were normalized against this value. The data are representative of three trials with standard deviations of the mean, and statistical significance was assessed using a two-way ANOVA test.
2.3. ATPase Assay Analysis
In order to determine the ability of GaHSP70-1 and GaHSP70-2 to hydrolyze ATP at temperatures lower and higher than room temperature, ATPase activity assays were conducted to measure the rate of ATP hydrolysis at 37, 25, 15, and 4 °C (Figure 3). The measurement of the ATPase activity using a malachite green colorimetric assay is commonly carried out at room temperature, as this is the optimum temperature for ATP hydrolysis [24]. The by-product of the ATP hydrolysis, which was the phosphate ions in this case, was measured. One unit is the amount of ATPase that catalyzes the production of 1 mole of free phosphate per minute under the assay conditions. In this study, the ATPase activities in GaHSP70-2 were slightly higher compared to those in GaHSP70-1 at all temperatures tested, except 15 °C. Both GaHSP70-1 and GaHSP70-2 showed approximately the same rate of ATP hydrolysis at 15 °C, which was 0.516 µmole/min/µL. At temperatures lower than 25 °C, the ATP hydrolysis activity decreased almost by two-fold compared to the activity at 25 °C. This finding showed that GaHSP70-1 and GaHSP70-2 could function at a lower activity rate at cold temperatures below 25 °C.
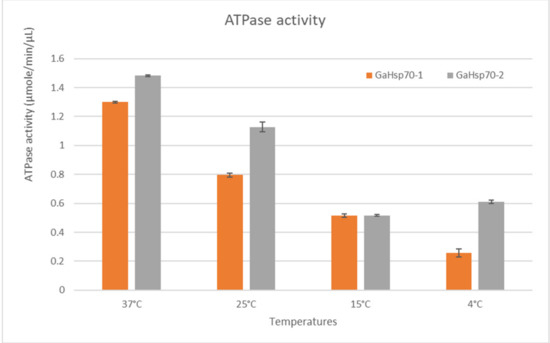
Figure 3.
ATPase hydrolysis activity at different temperatures.
2.4. 3D Structure Analysis
GaHSP70-1 and GaHSP70-2 had a 60% similarity with each other. GaHSP70-1 had the highest similarity with human HSP70 (PDB: 5FPN), with a 73.44% similarity with an E-value of 0. Meanwhile, GaHSP70-2 had the highest similarity of 60.27% with E. coli DnaK (PDB: 5NRO), with an E-value of 0. The tertiary structures of GaHSP70-1 and GaHSP70-2 were modelled with SWISS-MODEL using the structures of 5FPN and 5NRO as templates, respectively [31,32,33,34,35,36,37,38,39]. Both models were evaluated using PROCHECK, Verify3D, and ANOLEA. PROCHECK analysis showed that the build models had 100% amino acids in favored and allowed regions. Furthermore, model verification using Verify3D showed that the constructed models obtained a positive score of more than 80%. Analysis using ANOLEA showed acceptable energy calculations at the atomic level in the protein model structure. The superimposed GaHSP70-1 model, and its template produced a very significant RMSD value of 0.071 Å. A comparative analysis of the GaHSP70-1 model and 5FPN showed that the constructed model contained a substitution of a β-sheet to a loop located at the N-terminal ATPase binding domain (Figure 4). In addition, the superimposed GaHSP70-2 model, and its template gave a significant RMSD value of 0.118 Å. The sequence analysis also revealed several types of residue substitution in GaHSP70-2: (1) substitution to alanine and (2) the substitution of charged and polar amino acids to uncharged and hydrophobic amino acids. The residue substitutions to alanine were identified at the ATP-binding domain at positions 106, 118, 228, 299, 321, 364, 388, 416, and 462. There were two substitutions to alanine at the substrate-binding domain, which were at 572 and 577. Besides these, several charged and polar amino acids in the ATP-binding domain were replaced with uncharged and hydrophobic amino acids. For example, arginine at position 61 was substituted to isoleucine, aspartic acid at position 90 was substituted to leucine, serine at position 154 was substituted to glycine, aspartic acid at position 257 was substituted to asparagine, and histidine at position 272 was substituted to tyrosine. There were two residue substitutions in the substrate-binding domain; negatively charged residues were substituted for uncharged ones at position 475 (glutamic acid substituted for glutamine) and a bulky polar side chain was substituted for a hydrophobic side chain at position 493 (serine substituted for valine). Three-dimensional structure analysis revealed that these residue substitutions increased the distance of interaction between the two residues. For example, the substitution of valine for alanine at position 364 in GaHSP70-2 weakened the aromatic interaction that occurred at 3.441 Å (Figure 5).
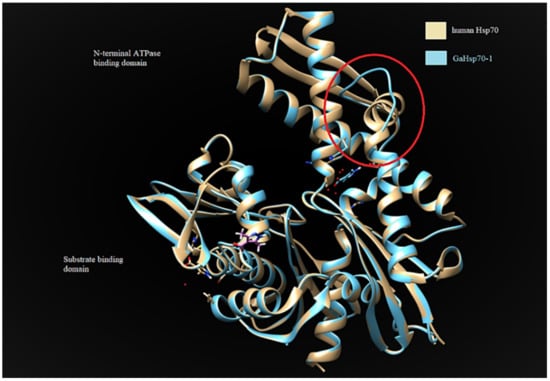
Figure 4.
Comparative structural analysis between GaHSP70-1 model and human HSP70 (PDB 5FPN). The red circle indicates the substitution of a β-sheet for a loop located at the N-terminal ATPase of GaHSP70-1. The structures were visualized using CHIMERA UCSF [40].
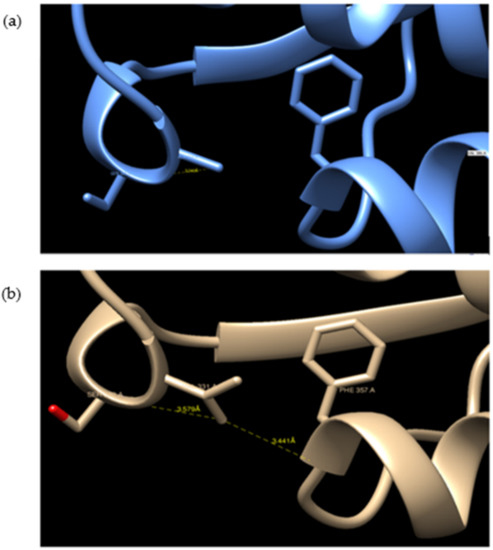
Figure 5.
Substitution of valine for alanine in the N-terminal ATP-binding domain at position 364: (a) GaHSP70-2 and (b) DnaK. The substitution of valine for alanine hindered the aromatic interaction between valine at 364 and phenylalanine at position 357. The structures were visualized using CHIMERA UCSF [40].
3. Discussion
Previous studies have proven the vital role of HSP70 in the stress resistance of organisms, which is mostly related to temperature stress [41]. This study is the first description of the gene expression of HSP70 chaperones of the Antarctic obligate psychrophilic yeast, G. antarctica PI12, during conditions of acute thermal stress and cold shock. To date, several investigations on Antarctic organisms have evaluated the thermal stress response related to the expression of Hsp70 at different temperatures [26,27,28,29,42,43,44,45]. However, in Antarctic yeast, the expression of type HSP70 chaperones has not yet been evaluated. Hence, this study in Antarctic yeast is crucial in order to understand how these organisms face the current and future changes in the Antarctic seawater temperature as well as to possibly measure the effects of different climate change scenarios.
In this study, we cloned full-length cDNA of 1815 bp and 2019 bp encoding HSP70 in G. antarctica PI12. The lengths of the GaHsp70-1 and GaHsp70-2 ORFs were 627 and 672 amino acids, respectively. Multiple sequence alignment revealed that HSP70 in G. antarctica contained conserved regions found in S. cerevisiae, A. thaliana, D. melanogaster, and Homo sapiens. Structurally, the GaHSP70-1 and GaHSP70-2 contained a highly conserved ATPase binding domain for ATP hydrolysis, a substrate-binding domain, and a varied C-terminal region that functioned as a lid. The phylogenetic analysis showed that both G. antarctic HSP70s have a high homology with HSP70s from other organisms, reflecting its long independent evolutionary history. GaHSP70-1 and GaHSP70-2 are possibly paralogs present in the G. antarctica genome that arise by duplication, since they have a high sequence similarity and common ortholog proteins with HSP70 from other organisms. Both HSP70 proteins are diversified into heat-inducible paralogs; their functions in stress response may vary significantly from a low effect to a rapid effect and strong protein folding activities [46,47,48,49].
Our study on Hsp70 expression patterns showed that the expression levels of both GaHsp70-1 and GaHsp70-2 increased as the temperature increased, and all were higher than those of the control groups. Similar results were reported by previous studies that showed the upregulation of Hsp70 mRNA expression levels when cells were exposed to higher temperatures [1,28,44,50]. Interestingly, the expression level of GaHsp70-1 was higher than that of GaHsp70-2 by up to 6-fold. GaHsp70-1 showed a 2-fold higher expression compared to GaHsp70-2 when exposed to 20 °C and a 4-fold higher expression when exposed to 30 °C. At −20 °C, the expression level of GaHsp70-1 increased by 5.26-fold while that of GaHsp70-2 increased by 2.82-folds, which was about 2-fold higher than that of GaHsp70-1. At 0 °C, the expression of GaHsp70-1 was 6-fold higher than that of GaHsp70-2. The importance of HSP70 in bacteria to eukarya has been demonstrated in numerous studies [50,51,52,53,54,55]. One study showed the abundance of HSP70 in the psychrophilic bacterium Shewanella frigidimarina when cells were exposed to heat stress at 28 °C [56]. Another study on the Antarctic haloarchaea showed that Halohasta litchfieldiae and Halorubrum lacusprofundi had higher expression levels of Hsp70 at high temperatures in response to heat stress [55]. In addition, studies in D. melanogaster, Caenorhabditis elegans, rodents, insects, and humans have also indicated that the higher the expression level of HSP70, the better the thermal stress tolerance of cells [50,51,52,53,54]. Rout et al. (2016) indicated that the gene expression pattern of Hsp70 in different goat organs exhibited a higher expression than that of the control during the peak heat stress period [57]. These findings confirmed the importance of HSP70 in protecting cells against thermal and cold stress. Hence, HSP70 serves as a potential biomarker for determining the expression of mRNA inside G. antarctica cells upon exposure to thermal stress.
At the protein level, we decided to determine whether GaHSP70-1 and GaHSP70-2 were able to function at temperatures lower and higher than the G. antarctica optimum growth temperature, which is 12 °C. Since this is the first study, we know of to be carried out on the Antarctic yeast HSP70, we decided to test the G. antarctica HSP70 function at temperatures ranging between 4 °C and 37 °C. The results showed that both GaHSP70-1 and GaHSP70-2 were able to function at the tested temperatures. Both HSP70 proteins had similar assay values at 15 °C. The analysis of the ATP assay at 37, 25, and 4 °C showed that GaHSP70-2 was able to perform better in ATP hydrolysis than GaHSP70-1. Therefore, this finding suggested that GaHSP70-2 plays a more important role than GaHSP70-1 in protein folding and the prevention of aggregation processes in cells, especially during thermal stress. At the cellular level, heat stress causes the denaturation of polypeptides, while cold stress causes degradation. Cells activate HSP70 to prevent and minimize the accumulation of denatured toxic and abnormal proteins [1,14,58]. This reflects the importance of HSP70 in response to thermal and cold stress in G. antarctica.
The determination of the 3D protein structure of HSP70 from G. antarctica PI12 was crucial to elucidate the relationship between HSP70′s structure and function, thus helping us to understand the mechanisms of thermal adaptation in cold-adapted proteins [59]. The protein structure of GaHSP70-1 has a high similarity with that of human HSP70, with a very significant RMSD of 0.071 Å. Superimposing the two protein structures with an RMSD of below 2 Å shows their high similarity, as the proteins share a similar architecture. The analysis of the GaHSP70-1 structure showed a substitution of the β-sheet with a loop at the ATP-binding domain (Figure 4). To date, this is the first study to report the replacement of a β-sheet with a loop at the ATP-binding domain of a cold-adapted HSP70. Structural flexibility and dynamics are strongly related to the presence of loops, which increased the degree of structural flexibility and contributed to the increase in enzyme activity [60,61]. In cold adaptation studies, loops in protein structures have been associated with better flexibility as a central role in adaptation to cold environments [62]. The extension of a loop in the protein structure is also associated with structural adaptation in cold-adapted proteins [63]. Hence, the presence of a loop at the ATP-binding domain may promote flexibility and thus allow ATP hydrolysis at low temperatures. Moreover, our analysis on HSP70-2 showed that the protein was structurally more similar to DnaK in E. coli, with a 60.27% identity. The superimposing of the GaHSP70-2 model with a DnaK structure achieved an RMSD of 0.118 Å, which indicated that both structures were aligned closely, as they shared a high similarity in terms of their protein structure. The protein architecture of GaHSP70-2 revealed several residue substitutions with alanine as well as less polar and charged residues at the ATP-binding domain. Cold-adapted enzymes generally exhibit an increased glycine content and reduced arginine, proline, and acidic amino acid contents [64]. Structural studies on cold adaptation have also revealed that a modest substitution with alanine increased the structural ability of a protein to function in the cold while maintaining its rigidity and stability [65]. The analysis of the protein structure at the atomic level showed that several substitutions could hinder the strong force and contribute to protein rigidity. For example, the substitution of valine for alanine at position 364 in GaHSP70-2 hindered the strong aromatic interaction with phenylalanine at 3.581 Å. Aromatic interactions provide stability to protein structures and the weakening of aromatic interactions improves structural flexibility in cold-adapted enzymes [66]. Hence, we propose that the substitutions of loop and alanine at the HSP70 ATP-binding domain may possibly contribute to the structural flexibility, which is important for cold adaptation. The substitution of polar, charged residues for nonpolar, uncharged, and hydrophobic residues is another cold adaptation characteristic of G. antarctica HSP70 that has been reported in several studies on cold-adapted enzymes [67].
The suite of amino acid substitutions observed in the G. antarctica HSP70s is consistent with the evolution of polypeptide flexibility to facilitate efficient folding activity for cold adaptation. Another question that has not been answered yet is how cold-adapted proteins respond to heat stress, especially during climate change. It could be possible that the residue substitutions observed in the HSP70 protein structures have evolved and undergo positive selection, allowing them to not only function at low temperatures but also to retain their functions during thermal stress, thus protecting the host organisms from cold denaturation and heat aggregation. In our study, the HSP70 genes in G. antarctica PI12 were significantly expressed at high and low temperatures and functioned at a wide range of temperatures from 4 °C to 37 °C. Our findings showed that G. antarctica HSP70s have evolved to function at low temperatures and retained their functions during thermal stress. Hence, these HSP70s may serve as potential biomarkers for detecting the effects of global climate change in the Antarctic Ocean.
4. Materials and Methods
4.1. Culturing G. antarctica and Exposure to Different Heat and Cold Shock Temperatures
The isolated G. antarctica PI12 culture was obtained courtesy of the School of Biological Sciences, Universiti Sains Malaysia. The cells were cultured in yeast peptone dextrose broth (10% (w/v) yeast extract (Sigma-Aldrich, St. Louis, MO, USA), 20% (w/v) peptone (Sigma-Aldrich, USA), and 20% (w/v) dextrose (Sigma-Aldrich, USA)) in shake flasks at 200 rpm and 12 °C until the OD600 reached approximately 0.6–0.8. Subsequently, the cultures were then exposed to different temperatures of −20, 0, 12, 20, and 30 °C. The cells were harvested at 10,000 rpm for 10 min after 6 h of exposure to each temperature and the pellet was stored at −80 °C until further usage.
4.2. Mining Hsp70 Genes from G. antarctica Genome
The nucleotide sequences of the Hsp70 genes from G. antarctica were designated GaHsp70-1 and GaHsp70-2. The taxonomy identity for G. antarctica PI12 in NCBI is NCBI:txid1332765. The Hsp70 sequences were obtained from the genome data of G. antarctica (GenBank assembly accession GCA_002917775.1); a total of 7857 protein-coding genes have been identified in this Antarctic yeast [18]. The degree of homology of these Hsp70 sequences was confirmed by similarity search using the Blastx program NCBI (https://blast.ncbi.nlm.nih.gov/Blast.cgi; (accessed on 3 August 2021)). The HSP70 amino acid sequences were aligned using a multiple sequence alignment by the ClustalW program (https://www.genome.jp/tools-bin/clustalw; (accessed on 3 August 2021)) to analyze regions with similarities with other organisms [68]. Subsequently, the primers were designed using the software Primer 3.0.
4.3. RNA Extraction
The total RNA of G. antarctica PII12 after exposure to different temperatures was extracted using the GeneJET RNA Purification kit (Thermo Scientific, Waltham, MA, USA) following the manufacturer’s protocol. Before the extraction yeast lysate was prepared, the yeast cell pellet was resuspended in Yeast Lysis buffer (1 M sorbitol (Sigma-Aldrich, USA), 0.1 M EDTA (Sigma-Aldrich, USA), pH 7.4, 0.1% -β-mercaptoethanol (Sigma-Aldrich, USA), and zymolyase 20T (Sigma-Aldrich, USA)) and incubated at 30 °C for 30 min. Then, the yeast sample was lysed with Lysis Buffer (Thermo Scientific, USA) supplemented with 14.3 M β-mercaptoethanol and Proteinase K (Thermo Scientific, USA) diluted with TE buffer (10 mM Tris HCl, pH 8.0, 1 mM EDTA) and incubated at 22 °C for 10 min. Following extraction, the concentration and purity of the total RNA were measured using a Nanodrop spectrophotometer (Thermo Scientific, USA) at 260 nm. The RNA quality was evaluated on 1% (w/v) agarose (Nacalai, Kyoto, Japan) gel electrophoresis at 100 V for 20 min and kept at −80 °C until further use.
4.4. Synthesis of cDNA
Before the cDNA synthesis, the extracted RNA was treated with DNase I (Thermo Scientific, USA) to remove traces of genomic DNA contamination from the RNA sample. The pretreatment protocol was conducted based on the manufacturer’s protocol. Both the gDNA removal and first-strand cDNA synthesis were performed using the ReverTra Ace™ qPCR RT Master Mix with a gDNA Remover (TOYOBO, Osaka, Japan). A total of 10 μL of reaction solution containing 8 μL of reaction solution from the DNase I treatment (2 μL mixture of 1 in 50 volume of gDNA remover to 4× DN Master Mix, 0.5 μg of total RNA template and nuclease-free water) with 2 μL of 5× RT Master Mix II (master mix reagent contains oligo dT and random primers). The reaction was carried out in the PCR thermal cycler (Bio-Rad, Hercules, CA, USA) at 37 °C for 15 min, followed by 50 °C for 5 min, and was terminated at 98 °C for 5 min. Then, the first-strand cDNA was used as the template for full-length cDNA amplification. Specific primers were used to amplify the cDNA targeting GaHsp70-1 and GaHsp70-2 (Table 2). The PCR mixture contains 200 ng of cDNA template, 20 μM forward and reverse primers, and 1× MyTaq Red Mix (Bioline, London, UK). PCRs were performed as follows: Initial denaturation at 95 °C for 1 min, followed by 35 cycles of denaturation at 95 °C for 15 s, annealing at 60 °C for 15 s, and elongation at 72 °C for 10 s. The reaction was terminated at 72 °C for 10 min. Subsequently, the PCR product was analyzed using agarose gel electrophoresis (1% w/v) at 100 V for 40 min.
Table 2.
Primers used for cDNA amplification.
4.5. mRNA Expression Analysis by Real-Time PCR
Quantitative PCR analysis was carried out to determine whether there were acute changes in gene expression; sampling occurred after 6 h exposure during the sublethal and acute thermal stress. The RT-qPCR reactions were carried using a real-time thermal cycler, CFX96 (Bio-Rad, USA). The assays were run using SensiFAST SYBR® No-ROX Kit (Bioline, UK). Each real-time PCR mixture contained 10 μL 2× SensiFAST SYBR® No-ROX Mix, 0.8 μL of a 10 μM forward/reverse primer, and ~100 ng cDNA template (refer to 3.4.2 for cDNA preparation). This was lastly topped up with RNase-free water to obtain a final volume 20 μL. Specific primers were designed based on sequence data from the G. antarctica database. A total of three sets of primers, which included GaHsp70-1 and GaHsp70-2 and 18 S, were used in the reactions (Table 2). The real-time cycler conditions were set as follows: reverse transcription step at 45 °C for 10 min for 1 cycle; an initial activation step at 95 °C for 2 min; 50 cycles of the denaturation step at 95 °C for 10 s; annealing at 60 °C for 10 s; and then exposure to 72 °C for 10 s. At the end of each run, the melting curves for the amplicons were determined by raising the temperature during fluorescence monitoring by 0.4 °C from 60 °C to 95 °C. The setpoint temperature was increased after cycle 2 by 0.5 °C. Subsequently, 2% agarose gel electrophoresis and melting curve analysis confirmed the PCR amplification. A standard curve was constructed using 10-fold serial dilutions (100, 10, 1, 0.1, and 0.01 ng) of RNA amplified with 18 S reference gene and GaHsp70 primers. The analysis was conducted in triplicate. A one-way analysis of variance (ANOVA) at a significance level of p < 0.05 was used to compare the expression levels at different temperatures. The GaHsp70 expression profiles were normalized with the 18 S to compensate for any variation in the amount of starting material among the samples [18,20]. Melting curves analyses of the PCR reactions were carried out to analyze the specificity of each set of primers.
4.6. Cloning and Sequence Analysis
The cDNA amplification of GaHsp70-1 and GaHsp70-2 was conducted, and they were cloned into pGEMT-T easy vector (PROMEGA, Madison, WI, USA). Finally, the annealed product was transformed into an E. coli DH5α cloning host using the heat shock method. For protein expression, specific primers promoting the ligation-independent cloning of target genes into the pET30 Ek/LIC (Merck-Millipore, Germany) vector were used (Table 3). The direct ligation of amplified GaHsp70-1 and GaHsp70-2 with the pET30 Ek/LIC vector was carried out according to the manufacturer’s instructions. Moreover, the annealed products were transformed into an E. coli BL21(DE3) expression host. The positive transformants were identified using sequencing analysis. The isoelectric point was determined using the ProtParam tool [69]. The sequence domain was analyzed using InterPro Scan [70] and Pfam [71]. Sequence alignment was performed using ClustalW [72]. A phylogenetic tree analysis was carried out by the neighbor-joining method in MEGA X and the confidence values among species were calculated by bootstrapping repeated 1000 times [73,74]. The sequences of the GaHsp70-1 and GaHsp70-2 were deposited in the GenBank™ database under these accession numbers of AEG19530.1 and MZ313862, respectively.
Table 3.
Primers used for ligation independent cloning (LIC).
4.7. Expression, Purification, and Detection of Recombinant G. antarctica Hsp70
Expression was assessed in LB containing 50 μg/mL of kanamycin (Nacalai, Japan). Induction was performed using 0.5 mM isopropyl β-D-thiogalactopyrosidase (IPTG) (Nacalai, Japan) after reaching an OD600 of ~0.8 and inducing for 16 h at 20 °C. The overexpression of the G. antarctica HSP70 was analyzed using 15% SDS-PAGE (Figure S4). The protein bands were visualized by Coomassie brilliant blue R250 staining (Nacalai, Japan). Purification was performed using prepacked Ni-NTA columns and AKTA Avant based on the manufacturer’s instructions (GE Healthcare, Marlborough, MA, USA). The purified GaHSP70-1 and GaHSP70-2 were analyzed for purity using SDS-PAGE (Figure S5).
4.8. Hsp70 ATPase Activity Analysis
The ATPase activity was evaluated by the measurement of colorimetric product resulting from the malachite green reagent and free ion [PO4]3− measured at 620 nm. The ATPase assays were carried out using an ATPase/GTPase Activity Assay Kit (Sigma-Aldrich, USA). The assay reaction mixture was composed of 10 µg recombinant protein (for the ATPase activity measurements) incubated in a 30 uL reaction volume containing 20 µL 40 mM Tris, 80 mM NaCl, 8 mM MgAc2, 1 mM EDTA at pH 7.5, and 10 uL 4 mM ATP (Sigma-Aldrich, USA). To monitor the effect of temperature on the activity of GaHSP70-1 and GaHSP70-2, the ATPase reaction mixture was incubated at 37, 25, 15, and 4 °C for 1 h. After 1 h of incubation, the reaction was stopped by adding 200 µL of malachite green reagent and incubated for an additional 30 min at room temperature to generate the colorimetric product. The product mixtures were loaded onto a 96-well plate and the absorbance values of colorimetric products were read using a SpectraMax spectrophotometer (Molecular Devices, San Jose, CA, USA) at 620 nm. All the samples were run in triplicate. Phosphate standard values for colorimetric detection were prepared according to the manufacturer’s instructions.
4.9. Modeling GaHSP70 Tertiary Structures
The three-dimensional GaHSP70-1 and GaHSP70-2 were modelled for the Escherichia coli DnaK (PDB entry 5NRO) and human HSP70 (PDB entry 5FPN), respectively, using the SWISS-MODEL program [31,32,33,34,35,36,37,38,39]. The structure quality was evaluated using PROCHECK [75], Verify3D [76], and ANOLEA [77,78,79]. The superimposed model and template and comparative analyses were performed using CHIMERA USCF [40].
5. Conclusions
In the present study, we report the complete cDNA of two Hsp70s encoding the ORFs of G. antarctica, as well as their amino acid sequences and protein structure models. The questions addressed in this study were whether G. antarctica PI12 has a significant effect on the gene regulation of Hsp70 during thermal and cold stress conditions and if the protein structures confer certain traits that allow thermal and cold adaptation ability in the Antarctic yeast G. antarctica. Our results provide the first molecular evidence that both GaHsp70-1 and GaHsp70-2 are significantly upregulated and inducible by thermal and cold stress in G. antarctica PI12. These findings are similar to responses shown in many Antarctic organisms, such as the Antarctic marine mollusc (Laternula elliptica and Nacella concinna), producing a rapid increase in the Hsp70 response. The protein structure models showed residue substitution strategies that allowed the protein to function well at a wider range of temperatures, including low and high temperatures. Therefore, this study indicates that the residue substitutions observed in the G. antarctica HSP70 structure have evolved and undergo positive selection to not only function at low temperatures but also to retain their functions during thermal stress, thus protecting host organisms from cold denaturation and heat aggregation. We unveil the underlying transcriptional plasticity and functional divergence of HSP70 copies in G. antarctica after a duplication event and the potential of this plasticity to promote adaptation in response to low temperatures and heat stress. Overall, these results will be useful for predicting an efficient measurement to evaluate the effect of thermal stress in G. antarctica PI12. Further research needs to be carried out on manipulating HSP70 in G. antarctica PI12 as a biomarker for measuring the effects of global warming on the Antarctic Ocean.
Supplementary Materials
The following are available online at https://www.mdpi.com/article/10.3390/microorganisms9102069/s1, Figure S1. RNA Extraction Result. 1% agarose gel electrophoresis of total RNA extracted from G. antarctica. Figure S2. DNA Amplification of Hsp70 genes from G. antarctica. 1% agarose gel of amplified Hsp70 genes from G. antarctica total RNA. (1) GaHsp70-2; (2) GaHsp70-1. Table S1. Identity between amino acid sequences of heat shock proteins obtained from G. antarctica PI12. Figure S3. Multiple sequence alignment and domain analysis of G. antarctica HSP70s aligned with HSP70 proteins from S. cerevisiae Ssa1 (GenBank Accession: GHM92458.1), Arabidopsis thaliana (GenBank Accession: NP_187864.1), Drosophila melanogaster (GenBank Accession: AAK30248.1) and Homo sapiens (GenBank Accession: AAC50076.1). The red letter in the alignment showed the residue substitutions to Alanine, less polar residues and charged residues mostly at the N-terminal ATP binding site. Figure S4. Protein expression of HSP70 proteins from G. antarctica. SDS-PAGE of G. antarctica HSP70 protein expression at 20 °C. Lane 1: GaHSP70-1, Lane 2: GaHSP70-2. BSA with the size of 66 kDa was ran as a control. Figure S5. Purified protein of HSP70 proteins from G. antarctica. SDS-PAGE of G. antarctica HSP70 purified protein ran at 1 mg/mL. Lane 1: GaHSP70-2; Lane 2: Protein marker; Lane 3: GaHSP70-1 and Lane 4: BSA.
Author Contributions
Conceptualization, N.A.Y. and W.N.S.W.M.; Methodology, J.C.; Software, J.C.; Validation, N.A.Y., A.M.A.M. and N.M.M.; Formal analysis, J.C.; Investigation, J.C.; Resources, N.A.Y., A.M.A.M. and N.M.M.; Data curation, N.A.Y.; Writing—original draft preparation, J.C.; writing—review and editing, N.A.Y., A.M.A.M. and N.M.M.; Visualization, N.A.Y.; Supervision, N.A.Y., A.M.A.M. and N.M.M.; Project administration, N.A.Y.; Funding acquisition, N.A.Y. All authors have read and agreed to the published version of the manuscript.
Funding
This research was funded by Yayasan Penyelidikan Antartika Sultan Mizan (YPASM), grant number “GLS0032-2019”, and The APC was funded by Universiti Malaysia Sabah.
Institutional Review Board Statement
Not applicable.
Informed Consent Statement
Not applicable.
Acknowledgments
We would like to thank University Malaysia Sabah for its strong support of research and innovation. We also would like to thank the research and innovation team at Biotechnology Research Institute for their administrative and technical support in this research and grant management.
Conflicts of Interest
The authors declare no conflict of interest.
References
- Radons, J. The human HSP70 family of chaperones: Where do we stand? Cell Stress Chaperones 2016, 21, 379–404. [Google Scholar] [CrossRef] [Green Version]
- Giri, S.S.; Sen, S.S.; Sukumaran, V. Role of HSP70 in cytoplasm protection against thermal stress in rohu, Labeo rohita. Fish Shellfish Immunol. 2014, 41, 294–299. [Google Scholar] [CrossRef] [PubMed]
- Mayer, M.P.; Bukau, B. Hsp70 chaperones: Cellular functions and molecular mechanism. Cell. Mol. Life Sci. 2005, 62, 670–684. [Google Scholar] [CrossRef] [Green Version]
- Sugimoto, S.; Nakayama, J.; Fukuda, D.; Sonezaki, S.; Watanabe, M.; Tosukhowong, A.; Sonomoto, K. Effect of heterologous expression of molecular chaperone DnaK from Tetragenococcus halophilus on salinity adaptation of Escherichia coli. J. Biosci. Bioeng. 2003, 96, 129–133. [Google Scholar] [CrossRef]
- Nadeau, D.; Plante, I.; Morrow, G.; Tanguay, R.M. Evaluation for Hsp70 as a biomarker of effect of pollutants on the earth worm Lumbricus terrestres. Cell Stress Chaperones 2001, 6, 153–163. [Google Scholar] [CrossRef] [Green Version]
- Tedeschi, J.N.; Kennington, W.J.; Berry, O.; Whiting, S.; Meekan, M.; Mitchell, N.J. Increased expression of Hsp70 and Hsp90 mRNA as biomarkers of thermal stress in loggerhead turtle embryos (Caretta Caretta). J. Therm. Biol. 2015, 47, 42–50. [Google Scholar] [CrossRef] [PubMed]
- Mello, D.F.; De Oliveira, E.S.; Vieira, R.C.; Simoes, E.; Trevisan, R.; Dafre, A.L.; Barracco, M.A. Cellular and transcriptional responses of Crassostrea gigas hemocytes exposed in vitro to brevetoxin (PbTx-2). Mar. Drugs 2012, 10, 583–597. [Google Scholar] [CrossRef]
- Silva-Zacarin, E.C.M.; Chauzat, M.P.; Zeggane, S.; Drajnudel, P.; Schurr, F.; Faucon, J.P.; Malaspina, O.; Engler, J.A. Protocol for optimization of histological, histochemical and immunohistochemical analyses of larval tissues: Application in histopathology of honey bee. Curr. Microsc. Contrib. Adv. Sci. Technol. 2012, 1, 696–703. [Google Scholar]
- Taylor, D.A.; Thompson, E.L.; Nair, S.V.; Raftos, D.A. Differential effects of metal contamination on the transcript expression of immune-and stress-response genes in the Sydney Rock oyster, Saccostrea glomerata. Environ. Pollut. 2013, 17, 65–71. [Google Scholar] [CrossRef]
- Ansoar-Rodríguez, Y.; Christofoletti, C.A.; Correia, J.E.; Souza, R.B.; Moreira-de-Sousa, C.; Marcato, A.C.C.; Bueno, O.C.; Malaspina, O.; Silva-Zacarin, E.C.M.; Fontanetti, C.S. Liver alterations in Oreochromis niloticus (Pisces) induced by insecticide imidacloprid: Histopathology and heat shock protein in situ localization. J. Environ. Sci. Health B 2016, 51, 881–887. [Google Scholar] [CrossRef] [PubMed] [Green Version]
- Coelho, M.P.M.; Moreira-de-Sousa, C.; Souza, R.B.; Ansoar Rodríguez, Y.; Silva-Zacarin, E.C.M.; Fontanetti, C.S. Toxicity evaluation of vinasse and biossolid sample in diplopod midgut: Heat shock protein in situ localization. Environ. Sci. Pollut. Res. 2017, 27, 22007–22017. [Google Scholar] [CrossRef] [PubMed]
- Mishra, S.R.; Palai, T.K. Importance of heat shock protein 70 in livestock—At cellular level. J. Mol. Pathophysiol. 2014, 3, 30–32. [Google Scholar] [CrossRef]
- Sabirzhanov, B.; Stoica, B.A.; Hanscom, M.; Piao, C.S.; Faden, A.L. Over-expression of HSP70 attenuates caspase dependent and caspase independent pathways and inhibits neuronalapoptosis. J. Neurochem. 2012, 123, 542–554. [Google Scholar] [CrossRef]
- Evans, C.G.; Chang, L.; Gestwicki, J.E. Heat shock protein 70 (Hsp70) as an emerging drug target. J. Med. Chem. 2010, 53, 4585–4602. [Google Scholar] [CrossRef] [Green Version]
- Sharma, D.; Masison, D.C. Hsp70 structure, function, regulation and influence on yeast Prions. Protein Pept. Lett. 2009, 16, 571–581. [Google Scholar] [CrossRef] [Green Version]
- Tang, T.; Yu, A.; Li, P.; Yang, H.; Liu, G.; Liu, L. Sequence analysis of the Hsp70 family in moss and evaluation of their functions in abiotic stress responses. Sci. Rep. 2016, 6, 33650. [Google Scholar] [CrossRef] [Green Version]
- Boo, S.Y.; Wong, C.M.V.L.; Rodrigues, K.F.; Najimudin, N.; Murad, A.M.A.; Mahadi, N.M. Thermal stress responses in Antarctic yeast, Glaciozyma antarctica PI12, characterized by real-time quantitative PCR. Polar Biol. 2012, 36, 381–389. [Google Scholar] [CrossRef]
- Firdaus-Raih, M.; Hashim, N.H.F.; Bharudin, I.; Bakar, M.F.A.; Huang, K.K.; Alias, H.; Lee, B.K.B.; Isa, M.N.M.; Mat-Sharani, S.; Sulaiman, S.; et al. The Glaciozyma antarctica genome reveals an array of systems that provide sustained responses towards temperature variations in a persistently cold habitat. PLoS ONE 2018, 13, e0189947. [Google Scholar] [CrossRef] [Green Version]
- Yusof, N.A.; Hashim, N.H.F.; Bharudin, I. Cold adaptation strategies and the potential of psychrophilic enzymes from the antarctic yeast, Glaciozyma antarctica PI12. J. Fungi 2021, 7, 528. [Google Scholar] [CrossRef] [PubMed]
- Hashim, N.; Bharudin, I.; Nguong, D.; Higa, S.; Bakar, F.; Nathan, S.; Rabu, A.; Kawahara, H.; Illias, R.; Najimudin, N.; et al. Characterization of Afp1, an antifreeze protein from the psychrophilic yeast Glaciozyma antarctica PI12. Extremophiles 2013, 17, 63–73. [Google Scholar] [CrossRef]
- Charles, J.; Masnoddin, M.; Nazaie, F.; Yusof, N.A. Structure and function of a novel cold regulated cold shock domain containing protein from an obligate psychrophilic yeast, Glaciozyma antarctica. Adv. Polar Bio. 2020, 31, 137–145. [Google Scholar] [CrossRef]
- Yusof, N.A.; Kamaruddin, S.; Bakar, F.D.A.; Mahadi, N.M.; Murad, A.M.A. Structural and functional insights into TRiC chaperonin from a psychrophilic yeast, Glaciozyma antarctica. Cell Stress Chaperones 2019, 24, 351–368. [Google Scholar] [CrossRef] [PubMed]
- Yusof, N.A.; Wong, C.M.V.L.; Murad, A.M.A.; Bakar, F.D.A.; Mahadi, N.M.; Rahman, A.Y.A.; Zainuddin, N.; Najimudin, M.N.M. Expression patterns of molecular chaperone genes in Antarctic psychrophilic yeast, Glaciozyma antarctica PI12 in response to heat stress. Pol. Polar Res. 2019, 40, 273–292. [Google Scholar] [CrossRef]
- Mulaudzi-Masuku, T.; Mutepe, R.D.; Mukhoro, O.C.; Faro, A.; Ndimba, B. Identification and characterization of a heat-inducible Hsp70 gene from Sorghum bicolor which confers tolerance to thermal stress. Cell Stress Chaperones 2015, 20, 793–804. [Google Scholar] [CrossRef] [Green Version]
- Štětina, T.; Koštál, V.; Korbelová, J. The Role of Inducible Hsp70, and Other Heat Shock Proteins, in Adaptive Complex of Cold Tolerance of the Fruit Fly (Drosophila melanogaster). PLoS ONE 2015, 10, e0128976. [Google Scholar] [CrossRef] [Green Version]
- González-Aravena, M.; Calfio, C.; Mercado, L.; Morales-Lange, B.; Bethke, J.; Lorgeril, J.D.; Cárdenas, C.A. HSP70 from the Antarctic sea urchin Sterechinus neumayeri: Molecular characterization and expression in response to heat stress. Biol. Res. 2018, 51. [Google Scholar] [CrossRef]
- Clark, M.S.; Fraser, K.P.; Peck, L.S. Antarctic marine molluscs do have an HSP70 heat shock response. Cell Stress Chaperones 2008, 13, 39–49. [Google Scholar] [CrossRef] [PubMed] [Green Version]
- Clark, M.S.; Fraser, K.P.P.; Burns, G.; Peck, L.S. The HSP70 heat shock response in the Antarctic fish Harpagifer antarcticus. Polar Biol. 2008, 31, 171–180. [Google Scholar] [CrossRef] [Green Version]
- Clark, M.S.; Peck, L.S. Triggers of the HSP70 stress response: Environmental responses and laboratory manipulation in an Antarctic marine invertebrate (Nacella concinna). Cell Stress Chaperones 2009, 14, 649–660. [Google Scholar] [CrossRef] [Green Version]
- Bustin, S.A.; Benes, V.; Garson, J.A.; Hellemans, J.; Huggett, J.; Kubista, M.; Mueller, R.; Nolan, T.; Pfaffl, M.W.; Shipley, G.L.; et al. The MIQE guidelines: Minimum information for publication of quantitative real-time PCR experiments. Clin. Chem. 2009, 55, 611–622. [Google Scholar] [CrossRef] [Green Version]
- Waterhouse, A.; Bertoni, M.; Bienert, S.; Studer, G.; Tauriello, G.; Gumienny, R.; Heer, F.T.; de Beer, T.A.P.; Rempfer, C.; Bordoli, L.; et al. SWISS-MODEL: Homology modelling of protein structures and complexes. Nucleic Acids Res. 2018, 46, W296–W303. [Google Scholar] [CrossRef] [Green Version]
- Bienert, S.; Waterhouse, A.; de Beer, T.A.P.; Tauriello, G.; Studer, G.; Bordoli, L.; Schwede, T. The SWISS-MODEL Repository—New features and functionality. Nucleic Acids Res. 2017, 45, D313–D319. [Google Scholar] [CrossRef] [Green Version]
- Guex, N.; Peitsch, M.C.; Schwede, T. Automated comparative protein structure modeling with SWISS-MODEL and Swiss-PdbViewer: A historical perspective. Electrophoresis 2009, 30, S162–S173. [Google Scholar] [CrossRef]
- Studer, G.; Tauriello, G.; Bienert, S.; Biasini, M.; Johner, N.; Schwede, T. ProMod3—A versatile homology modelling toolbox. PLoS Comput. Biol. 2021, 17, e1008667. [Google Scholar] [CrossRef]
- Studer, G.; Rempfer, C.; Waterhouse, A.M.; Gumienny, R.; Haas, J.; Schwede, T. QMEANDisCo—Distance constraints applied on model quality estimation. Bioinformatics 2020, 36, 1765–1771. [Google Scholar] [CrossRef]
- Studer, G.; Biasini, M.; Schwede, T. The local structural quality of transmembrane protein models using statistical potentials (QMEANBrane). Bioinformatics 2014, 30, i505–i511. [Google Scholar] [CrossRef] [PubMed] [Green Version]
- Benkert, P.; Biasini, M.; Schwede, T. Toward the estimation of the absolute quality of individual protein structure models. Bioinformatics 2011, 27, 343–350. [Google Scholar] [CrossRef]
- Bertoni, M.; Kiefer, F.; Biasini, M.; Bordoli, L.; Schwede, T. Modeling protein quaternary structure of homo- and hetero-oligomers beyond binary interactions by homology. Sci. Rep. 2017, 7, 10480. [Google Scholar] [CrossRef] [Green Version]
- Mariani, V.; Biasini, M.; Barbato, A.; Schwede, T. lDDT: A local superposition-free score for comparing protein structures and models using distance difference tests. Bioinformatics 2013, 29, 2722–2728. [Google Scholar] [CrossRef] [Green Version]
- Pettersen, E.F.; Goddard, T.D.; Huang, C.C.; Couch, G.S.; Greenblatt, D.M.; Meng, E.C.; Ferrin, T.E. UCSF Chimera—A visualization system for exploratory research and analysis. J. Comput. Chem. 2004, 25, 1605–1612. [Google Scholar] [CrossRef] [Green Version]
- Yu, A.; Li, P.; Tang, T.; Wang, J.; Chen, Y.; Liu, L. Roles of Hsp70s in stress responses of microorganisms, plants, and animals. BioMed Res. Int. 2015, 2015, 510319. [Google Scholar] [CrossRef] [Green Version]
- Fuentes, V.; Alurralde, G.; Meyer, B.; Aguirre, G.E.; Canepa, A.; Wölfl, A.-C.; Hass, H.C.; Williams, G.N.; Schloss, I.R. Glacial melting: An overlooked threat to Antarctic krill. Sci. Rep. 2016, 6, 27234. [Google Scholar] [CrossRef] [PubMed] [Green Version]
- Cascella, K.; Jollivet, D.; Papot, C.; Clark, M.S.; Toullec, J.Y. Diversification, evolution and sub-functionalization of 70kDa heat-shock proteins in two sister species of antarctic krill: Differences in thermal habitats, responses and implications under climate change. PLoS ONE 2015, 10, e0121642. [Google Scholar] [CrossRef] [PubMed] [Green Version]
- Liu, S.; Wang, J.; Cong, B.; Huang, X.; Chen, K.; Zhang, P. Characterization and expression analysis of a mitochondrial heat-shock protein 70 gene from the Antarctic moss Pohlia nutans. Polar Biol. 2014, 37, 1145–1155. [Google Scholar] [CrossRef]
- Place, S.P.; Zippay, M.L.; Hofmann, G.E. Constitutive roles for inducible genes: Evidence for the alteration in expression of the inducible Hsp70 gene in Antarctic notothenioid fishes. Am. J. Physiol. Regul. Integr. Comp. Physiol. 2004, 287, R429–R436. [Google Scholar] [CrossRef] [Green Version]
- Zatsepina, O.G.; Przhiboro, A.A.; Yushenova, I.A.; Shilova, V.; Zelentsova, E.S.; Shostak, N.G.; Evgen’ev, M.B.; Garbuz, D.G. A Drosophila heat shock response represents an exception rather than a rule amongst Diptera species. Insect Mol. Biol. 2016, 25, 431–449. [Google Scholar] [CrossRef] [PubMed]
- Huenerlage, K.; Cascella, K.; Corre, E.; Toomey, L.; Lee, C.Y.; Buchholz, F.; Toullec, J.Y. Responses of the arcto-boreal krill species Thysanoessa inermis to variations in water temperature: Coupling Hsp70 isoform expressions with metabolism. Cell Stress Chaperones 2016, 21, 969–981. [Google Scholar] [CrossRef] [PubMed] [Green Version]
- Cottin, D.; Foucreau, N.; Hervant, F.; Piscart, C. Differential regulation of Hsp70 genes in the freshwater key species Gammarus pulex (Crustacea, Amphipoda) exposed to thermal stress: Effects of latitude and ontogeny. J. Comp. Physiol. B 2015, 185, 303–313. [Google Scholar] [CrossRef]
- Drozdova, P.; Bedulina, D.; Madyarova, E.; Rivarola-Duarte, L.; Schreiber, S.; Stadler, P.F.; Luckenbach, T.; Timofeyev, M. Description of strongly heat-inducible heat shock protein 70 transcripts from Baikal endemic amphipods. Sci. Rep. 2019, 9, 8907. [Google Scholar] [CrossRef] [Green Version]
- Silver, J.T.; Noble, E.G. Regulation of survival gene Hsp70. Cell Stress Chaperones 2012, 17, 1–9. [Google Scholar] [CrossRef] [Green Version]
- Jin, J.; Zhao, M.; Wang, Y.; Zhou, Z.; Wan, F.; Guo, J. Induced thermotolerance and expression of three key Hsp genes (Hsp70, Hsp21, and sHsp21) and their roles in the high temperature tolerance of Agasicles hygrophila. Front. Physiol. 2020, 10, 1593. [Google Scholar] [CrossRef] [Green Version]
- Odunuga, O.O.; Bollinger, S.A.; Choi, K.H.; Polvadore, E.I. Caenorhabditis elegans Hsp70-1 expresses highly in bacteria, is sufficiently soluble, and has a catalytic constant similar to Hsc70 and BiP. Protein Expr. Purif. 2012, 82, 132–137. [Google Scholar] [CrossRef]
- Kuennen, M.; Gillum, T.; Dokladny, K.; Bedrick, E.; Schneider, S.; Moseley, P. Thermotolerance and heat acclimation may share a common mechanism in humans. Am. J. Physiol. Integr. Comp. Physiol. 2011, 301, R524–R533. [Google Scholar] [CrossRef] [Green Version]
- Gong, W.J.; Golic, K.G. Loss of Hsp70 in Drosophila is pleiotropic, with effects on thermotolerance, recovery from heat shock and neurodegeneration. Genetics 2006, 172, 275–286. [Google Scholar] [CrossRef] [PubMed] [Green Version]
- Williams, T.J.; Liao, Y.; Ye, J.; Kuchel, R.P.; Poljak, A.; Raftery, M.J.; Cavicchioli, R. Cold adaptation of the Antarctic haloarchaea Halohasta litchfieldiae and Halorubrum lacusprofundi. Environ. Microbiol. 2017, 19, 2210–2227. [Google Scholar] [CrossRef]
- García-Descalzo, L.; García-López, E.; Alcázar, A.; Baquero, F.; Cid, C. Proteomic analysis of the adaptation to warming in the Antarctic bacteria Shewanella frigidimarina. Biochim. Biophys. Acta BBA Proteins Proteom. 2014, 1844, 2229–2240. [Google Scholar] [CrossRef] [PubMed]
- Rout, P.K.; Kaushik, R.; Ramachandran, N. Differential expression pattern of heat shock protein 70 gene in tissues and heat stress phenotypes in goats during peak heat stress period. Cell Stress Chaperones 2016, 21, 645–651. [Google Scholar] [CrossRef] [Green Version]
- Bhat, S.; Kumar, P.; Kashyap, N.; Deshmukh, B.; Dige, M.S.; Bhushan, B.; Chauhan, A.; Kumar, A.; Singh, G. Effect of heat shock protein 70 polymorphism on thermotolerance in Tharparkar cattle. Vet. World 2016, 9, 113–117. [Google Scholar] [CrossRef] [PubMed]
- Zhang, Y. Protein structure prediction: When is it useful? Curr. Opin. Struct. Biol. 2009, 19, 145–155. [Google Scholar] [CrossRef] [Green Version]
- Singer, C.M.; Joy, D.; Jacobs, D.J.; Nesmelova, I.V. Rigidity and flexibility characteristics of DD[E/D] transposases Mos1 and Sleeping Beauty. Proteins 2019, 87, 313–325. [Google Scholar] [CrossRef]
- Yu, H.; Yan, Y.; Zhang, C.; Dalby, P.A. Two strategies to engineer flexible loops for improved enzyme thermostability. Sci. Rep. 2017, 7, 41212. [Google Scholar] [CrossRef] [PubMed] [Green Version]
- Olufsen, M.; Smalås, A.O.; Moe, E.; Brandsdal, B.O. Increased flexibility as a strategy for cold adaptation: A comparative molecular dynamics study of cold- and warm-active uracil DNA glycosylase. J. Biol. Chem. 2005, 280, 18042–18048. [Google Scholar] [CrossRef] [Green Version]
- Kashif, A.; Tran, L.H.; Jang, S.H.; Lee, C. Roles of active-site aromatic residues in cold adaptation of Sphingomonas glacialis Esterase EstSP1. ACS Omega 2017, 2, 8760–8769. [Google Scholar] [CrossRef] [PubMed] [Green Version]
- Ayala-del-Río, H.L.; Chain, P.S.; Grzymski, J.J.; Ponder, M.A.; Ivanova, N.; Bergholz, P.W.; Di Bartolo, G.; Hauser, L.; Land, M.; Bakermans, C.; et al. The genome sequence of Psychrobacter arcticus 273-4, a psychroactive Siberian permafrost bacterium, reveals mechanisms for adaptation to low-temperature growth. Appl. Environ. Microbiol. 2010, 76, 2304–2312. [Google Scholar] [CrossRef] [PubMed] [Green Version]
- Yusof, N.A.; Hashim, N.H.; Beddoe, T.; Mahadi, N.M.; Illias, R.M.; Bakar, F.D.; Murad, A.M. Thermotolerance and molecular chaperone function of an SGT1-like protein from the psychrophilic yeast, Glaciozyma antarctica. Cell Stress Chaperones 2016, 21, 707–715. [Google Scholar] [CrossRef] [PubMed] [Green Version]
- Makwana, K.M.; Mahalakshmi, R. Implications of aromatic-aromatic interactions: From protein structures to peptide models. Protein Sci. 2015, 24, 1920–1933. [Google Scholar] [CrossRef] [Green Version]
- Zhuravleva, A.; Radford, S.E. How TRiC folds tricky proteins. Cell 2014, 159, 1251–1252. [Google Scholar] [CrossRef] [Green Version]
- Thomsen, R.; Fogel, G.B.; Krink, T. A Clustal alignment improver using evolutionary algorithms. In Proceedings of the 2002 Congress on Evolutionary Computation. CEC’02 (Cat. No.02TH8600), Honolulu, HI, USA, 12–17 May 2002; Volume 1, pp. 121–126. [Google Scholar] [CrossRef]
- Garg, V.K.; Avashthi, H.; Tiwari, A.; Jain, P.A.; Ramkete, P.W.; Kayastha, A.M.; Singh, V.K. MFPPI-multi FASTA ProtParam interface. Bioinformation 2016, 12, 74–77. [Google Scholar] [CrossRef]
- Mulder, N.; Apweiler, R. InterPro and InterProScan: Tools for protein sequence classification and comparison. Methods Mol. Biol. 2007, 396, 59–70. [Google Scholar] [CrossRef]
- Finn, R.D.; Bateman, A.; Clements, J.; Coggill, P.; Eberhardt, R.Y.; Eddy, S.R.; Heger, A.; Hetherington, K.; Holm, L.; Mistry, J.; et al. Pfam: The protein families database. Nucleic Acids Res. 2014, 42, D222–D230. [Google Scholar] [CrossRef] [Green Version]
- Thompson, J.D.; Higgins, D.G.; Gibson, T.J. CLUSTAL W: Improving the sensitivity of progressive multiple sequence alignment through sequence weighting, position-specific gap penalties and weight matrix choice. Nucleic Acids Res. 1994, 22, 4673–4680. [Google Scholar] [CrossRef] [Green Version]
- Nei, M.; Kumar, S. Molecular Evolution and Phylogenetics; Oxford University Press: Oxford, UK, 2000. [Google Scholar]
- Kumar, S.; Stecher, G.; Li, M.; Knyaz, C.; Tamura, K. MEGA X: Molecular evolutionary genetics analysis across computing platforms. Mol. Biol. Evol. 2018, 235, 1547–1549. [Google Scholar] [CrossRef] [PubMed]
- Laskowski, R.A.; MacArthur, M.W.; Moss, D.S.; Thornton, J.M. PROCHECK: A program to check the stereochemical quality of protein structures. J. Appl. Crystallogr. 1993, 26, 283–291. [Google Scholar] [CrossRef]
- Eisenberg, D.; Luthy, R.; Bowie, J.U. Verify3D: Assessment of protein models with three-dimensional profiles. Methods Enzymol. 1997, 277, 396–404. [Google Scholar] [CrossRef] [PubMed]
- Yang, Y.D.; Spratt, P.; Chen, H.; Park, C.; Kihara, D. Sub-AQUA: Real-value quality assessment of protein structure models. Protein Eng. Des. Sel. 2010, 23, 617–632. [Google Scholar] [CrossRef] [Green Version]
- Melo, F.; Devos, D.; Depiereux, E.; Feytmans, E. ANOLEA: A www server to assess protein structures. Proc. Int. Conf. Intell. Syst. Mol. Boil. 1997, 5, 187–190. [Google Scholar]
- Melo, F.; Feytmans, E. Novel knowledge-based mean force potential at atomic level. J. Mol. Biol. 1997, 267, 207–222. [Google Scholar] [CrossRef] [Green Version]
Publisher’s Note: MDPI stays neutral with regard to jurisdictional claims in published maps and institutional affiliations. |
© 2021 by the authors. Licensee MDPI, Basel, Switzerland. This article is an open access article distributed under the terms and conditions of the Creative Commons Attribution (CC BY) license (https://creativecommons.org/licenses/by/4.0/).