Article

Seasonal Variation in the Rhizosphere and Non-Rhizosphere Microbial Community Structures and Functions of Camellia yuhsienensis Hu

Key Laboratory of Cultivation and Protection for Non-Wood Forest Trees, Ministry of Education, Central South University of Forestry and Technology, Changsha 410004, China
*
Author to whom correspondence should be addressed.
Microorganisms 2020, 8(9), 1385; https://doi.org/10.3390/microorganisms8091385
Submission received: 10 August 2020 / Revised: 4 September 2020 / Accepted: 9 September 2020 / Published: 10 September 2020
(This article belongs to the Section Plant Microbe Interactions)

Abstract

:
Camellia yuhsienensis Hu, endemic to China, is a predominant oilseed crop, due to its high yield and pathogen resistance. Past studies have focused on the aboveground parts of C. yuhsienensis, whereas the microbial community of the rhizosphere has not been reported yet. This study is the first time to explore the influence of seasonal variation on the microbial community in the rhizosphere of C. yuhsienensis using high-throughput sequencing. The results showed that the dominant bacteria in the rhizosphere of C. yuhsienensis were Chloroflexi, Proteobacteria, Acidobacteria, Actinobacteria, and Planctomycetes, and the dominant fungi were Ascomycota, Basidiomycota, and Mucoromycota. Seasonal variation has significant effects on the abundance of the bacterial and fungal groups in the rhizosphere. A significant increase in bacterial abundance and diversity in the rhizosphere reflected the root activity of C. yuhsienensis in winter. Over the entire year, there were weak correlations between microorganisms and soil physiochemical properties in the rhizosphere. In this study, we found that the bacterial biomarkers in the rhizosphere were chemoorganotrophic Gram-negative bacteria that grow under aerobic conditions, and fungal biomarkers, such as Trichoderma, Mortierella, and Lecanicillium, exhibited protection against pathogens in the rhizosphere. In the rhizosphere of C. yuhsienensis, the dominant functions of the bacteria included nitrogen metabolism, oxidative phosphorylation, glycine, serine and threonine metabolism, glutathione metabolism, and sulfur metabolism. The dominant fungal functional groups were endophytes and ectomycorrhizal fungi of a symbiotroph trophic type. In conclusion, seasonal variation had a remarkable influence on the microbial communities and functions, which were also significantly different in the rhizosphere and non-rhizosphere of C. yuhsienensis. The rhizosphere of C. yuhsienensis provides suitable conditions with good air permeability that allows beneficial bacteria and fungi to dominate the soil microbial community, which can improve the growth and pathogen resistance of C. yuhsienensis.

1. Introduction

Microorganisms play a significant role in the decomposition process of soil organic matter, litter, and wood residues [1,2,3]. The microbial community structures partly reflect the nutrient and health conditions of the soil. Some bacterial phyla only proliferate in copiotrophic substances, such as Alphaproteobacteria, Betaproteobacteria, and Bacteroidetes, while others proliferate in oligotrophic substances, such as Acidobacteria [4,5,6]. Some fungi are interdependent with the plant rhizosphere, such as arbuscular mycorrhizal fungi, while others can cause plant disease, such as Venturia inaequalis [7,8,9]. Due to their sensitive features, microorganisms are significantly regulated by many factors, such as plant roots and seasonal variation [10,11,12].
The rhizosphere is recognized as one of the most complex environments colonized by significant numbers of microorganisms [13]. Generally, plant roots impact microorganisms via their physiological activity, such as the production of secondary metabolites [14]. Thus, the microbial communities around the rhizosphere have a close association with plant roots and differ significantly from the non-rhizosphere microbial communities. Rhizosphere microorganisms are mainly divided into two categories according to whether they have deleterious or beneficial effects on plants [15]. The beneficial microorganisms, for example, can promote the abiotic stress tolerance of plants, facilitate nutrient absorption and plant growth, and protect plants from pathogens [16,17]. On the contrary, harmful microorganisms, such as deleterious rhizobacteria, are largely saprophytic bacteria that aggressively colonize plant roots, which leads to plant disease, the inhibition of root growth, the suppression of plant growth, and crop failure [18]. Seasonal variation has major direct and indirect influences on the rhizosphere microbial community. Soil water content affects the rhizosphere microbial community significantly. Zhou et al. [19] found that regardless of water availability, microbial activities were restricted in the rhizosphere of wheat. Similarly, the research of Ilyas and Bano [20] indicated that there were more Azospirillum strains isolated from the rhizosphere soil of plants in well-watered conditions than in arid and semiarid conditions. Seasonal drought and rainfall have a significant influence on rhizosphere microbial diversity and abundance [21]. Drought stress can indirectly impact microorganisms by restricting plant root growth and regulating root exudation [22]. López-Gutiérrez et al. [23] reported that seasonality could mediate arbuscular mycorrhiza-colonized root length, dehydrogenase activity, and bacterial plate counts in the rhizosphere. Microorganisms are usually classified according to different functions. Due to the activity of plant roots, there are major differences in the microbial functions between the rhizosphere and in the bulk soil. Yang et al. [24] found that microbial catabolic diversity in the rhizosphere differed significantly from that in the bulk soil. Mestre et al. [25] explored yeast community and function in Nothofagus pumilio forests. They found that glucose fermentation, organic acid production, and cellobiose assimilation occurred more frequently in the rhizosphere than in the bulk soil. Hernesmaa et al. [26] revealed that the numbers of cultivable bacteria and phosphatase activity in the rhizosphere of Scots pine were significantly higher than in the bulk soil. In summary, microbial communities in the rhizosphere are indispensable for plants [27]. Therefore, researching the dynamics of the rhizosphere microbial community across seasons could inform the promotion of plant growth and yield.
Camellia yuhsienensis Hu, a species of oil tea, was once widely cultivated in central China because of its high yield and high resistance to disease pathogens [28]. Cook et al. [29] found that plants tend to regulate microbial communities for their own benefit. Previous studies have reported on the significant carbon metabolic activity in the rhizosphere and bulk soil of Camellia oleifera plantations, another species of oil tea [10,30]. Hartmann et al. [31] revealed that specific microenvironments around the rhizosphere lead to specific interactions among microbes with the development of plant roots, resulting in the biological protection of plants from pathogenic microbes. However, the above studies on microbial communities in the rhizosphere or bulk soil of C. oleifera plantations did not observe any microorganisms with great disease resistance against pathogens. Previous studies have confirmed that the disease resistance of C. oleifera is inferior to that of C. yuhsienensis [28,32]. No studies have explored the rhizosphere microbial community of C. yuhsienensis. Therefore, we hypothesize that some specific microbial communities must exist that improve the resistance of C. yuhsienensis to pathogens, and furthermore, that these microbial communities might be regulated by seasonality. In order to verify this, high-throughput sequencing was used to determine the microbial community structure and functions in the rhizosphere and non-rhizosphere of C. yuhsienensis in spring, summer, autumn, and winter.

2. Materials and Methods

2.1. Site Description

The sampling site was located at a 10-year-old C. yuhsienensis forest in Youxian, Hunan, China (N 27°02′, E 113°20′). The plant and row spacing were 2 m and 3 m, respectively. The climate is subtropical monsoon with a mean annual total rainfall and temperature of 1410 mm and 17.8 °C, respectively [33]. The soil at the experimental site is a Quaternary red clay with a pH of 4.1–4.5. The total organic matter content is 17–23 g/kg. The total nitrogen content is approximately 330–810 mg/kg. The available phosphorus content is 0.1–10 mg/kg, and the available potassium content is 64–95 mg/kg. The chemical properties mentioned above are displayed in Table S1.

2.2. Experimental Design and Sampling

According to the phenological phase of C. yuhsienensis, the soil samples were collected on 23 October 2018 (autumn, C), 19 January 2019 (winter, D), 5 April 2019 (spring, A), and 22 July 2019 (summer, B). Three quadrats of 20 m × 20 m were selected in the C. yuhsienensis plantation. Five trees were chosen according to an “S” type route in the center of each quadrat. The rhizosphere soil samples of C. yuhsienensis were collected, as described by Reference [34] after shoveling the roots from four ordinations approximately 0.5 m away from the trunk. The corresponding non-rhizosphere soil samples at 0–20 cm depth were collected as a control approximately 1 m away from the trunk. The rhizosphere and non-rhizosphere soils in each quadrate were each well blended as a single sample. The soil samples were then transported back to the laboratory on dry ice. After removing debris and roots, the soil samples were well mixed, ground, and sieved (<2 mm). One part of the soil samples was used for evaluating the physiochemical properties after air-drying in the shade, while the remainder was stored at −80 °C for high-throughput sequencing at Genedenovo Biotechnology Co., LTD (Guangzhou, China). The soil temperature at 0–20 cm depth was detected using a Wdsen Electronic temperature recorder (iButton DS1925) during the whole experimental period (Figure S1).

2.3. The Measure of Soil Physiochemical Properties

Soil moisture content (SMC) was measured by evaporating the water with burning alcohol [35]. Soil pH, total organic carbon (TOC), total nitrogen (TN), alkaline hydrolyzable nitrogen (AHN), total phosphorous (TP), and total potassium (TK) were measured according to Chinese forestry standards [36,37,38,39,40,41]. A 2 mol/L KCl soil extract was used to measure ammonium nitrogen (AMN) and nitrate nitrogen (NN) using a continuous flow auto-analyzer (Smartchem 200, Westco Scientific Instruments, Roman, Italy). Mehlich 3 extractant was used to extract soil available phosphorous (AP) and potassium (AK), and then AP was measured using a continuous flow auto-analyzer, while AK was measured as TK [42].

2.4. Bacterial and Fungal Community Assessment

2.4.1. DNA Extraction and PCR Amplification

Microbial DNA was extracted using HiPure Soil DNA Kits (Magen, Guangzhou, China) according to the manufacturer’s protocols. The 16S rDNA V3-V4 region of the ribosomal RNA gene was amplified by PCR using primers 341F: 5′-CCTACGGGNGGCWGCAG-3′, 806R: 5′-GGACTACHVGGGTATCTAAT-3′. The PCR amplification of 16S r DNA proceeded, as described in Reference [43]. The ITS rDNA region of the ribosomal RNA gene was amplified by PCR using primers ITS3-KYO2 (F): 5′-GATGAAGAACGYAGYRAA-3′ and ITS4 (R): 5′-TCCTCCGCTTATTGATATGC-3′ [44]. The ITS region of the Eukaryotic ribosomal RNA gene was amplified by PCR (95 °C for 2 min, followed by 27 cycles at 98 °C for 10 s, 62 °C for 30 s, and 68 °C for 30 s and a final extension at 68 °C for 10 min). The PCR reactions were performed in triplicate 50 μL mixtures containing 5 μL of 10× KOD Buffer, 5 μL of 2 mM dNTPs, 3 μL of 25 mM MgSO4,1.5 μL of each primer (10 μM), 1 μL of KOD Polymerase, and 100 ng of template DNA.

2.4.2. Illumina Novaseq6000 Sequencing

Amplicons were extracted from 2% agarose gels and purified using the AxyPrep DNA Gel Extraction Kit (Axygen Biosciences, Union City, CA, USA.) according to the manufacturer’s instructions and quantified using an ABI StepOnePlus Real-Time PCR System (Life Technologies, Foster City, CA, USA). Purified amplicons were pooled in equimolar ratios and paired-end sequenced (PE250) on an Illumina platform according to the standard protocols. The raw reads were deposited into the NCBI Sequence Read Archive (SRA) database (BioProject: PRJNA646017).

2.4.3. Statistical and Bioinformatics Analysis

Raw reads were further filtered using FASTP according to the rule: Remove reads containing more than 10% unknown nucleotides (N) and reads with less than 50% of bases with quality (Q-value)>20 [45]. Paired-end clean reads were merged as raw tags using FLASH (version 1.2.11) with a minimum overlap of 10 bp and mismatch error rates of 2% [46]. The effective tags were clustered into operational taxonomic units (OTUs) of ≥ 97% similarity using the UPARSE (version 9.2.64) pipeline [47]. The tag sequence with the highest abundance was selected as a representative sequence within each cluster.
A Venn analysis was used to identify unique and common OTUs among the different groups, was performed using the R “VennDiagram” package (version 1.6.16) [48]. The OTU rarefaction curves and rank abundance curves were plotted using the R “ggplot2” package (version 2.2.1) [49]. Alpha diversities of bacteria and fungi (Sobs, Shannon, and Chao 1 index) were calculated in QIIME (version 1.9.1) [50]. The abundance statistics of each taxonomy were visualized using Krona (version 2.6) [51]. Principal co-ordinates analysis (PCoA) and permutational multivariate analysis of variance (MANOVA) (Permanova) based on unweighted unifrac distance were used to evaluate the influence of plant root and seasonal dynamics on bacterial and fungal community structures. A least discriminant analysis (LDA) effect size (LEfSe) taxonomic cladogram was used to identify bacterial biomarkers (LDA > 3.5) and fungal biomarkers (LDA > 3.5) in the different treatment using LEfSe software [52]. Indicator analysis was used to determine the significantly different species (biomarkers) between rhizosphere and non-rhizosphere soil during the entire year using the R “labdsv” package (version 2.0-1) [53]. The Kyoto Encyclopedia of Genes and Genomes (KEGG) pathway analysis of the OTUs was inferred using Tax4Fun (version 1.0) [54]. The functional group (Guild) of the fungi (relative abundance greater than 0.01% in the rhizosphere) was inferred using FUNGuild (version 1.0) [55]. The bacterial function differences between the rhizosphere and non-rhizosphere samples were calculated by Welch’s t-test, and the fungal function differences between the rhizosphere and non-rhizosphere were calculated using the Wilcoxon rank test in the R “vegan” package (version 2.5.3) [56].
One-way analysis of variance (ANOVA) was used to determine the significant differences among different treatments during the whole year. Nonparametric tests with a significance level of 0.05 were used to compare the means of bacterial and fungal alpha diversities in different treatments and seasons. Variance partitioning analysis, generated in the R “vegan” package (version 2.5.3) [56], was used to evaluate the contribution of environmental factors to microbial community structure. Pearson’s correlation coefficients between environmental factors and microbial species and alpha diversities were calculated by Omicshare tools, a free online platform for data analysis [57].

3. Results

3.1. Soil Microbial Community Structure

3.1.1. Quality Control Report of the High-Throughput Sequencing

The tags and OTUs of the bacteria and fungi are presented in Table S2 and Table S3. In order to ensure the reproducibility and validity of the microbial data, the data extraction flat and dilution cures were processed before analysis [58]. According to Figure S2, the dilution cure of the Sobs index indicated that there would be more bacteria and fungi if sequencing were continued, but the plateau of the dilution cure of Shannon’s index was reached early, showing that the number of reads was sufficient for this research.

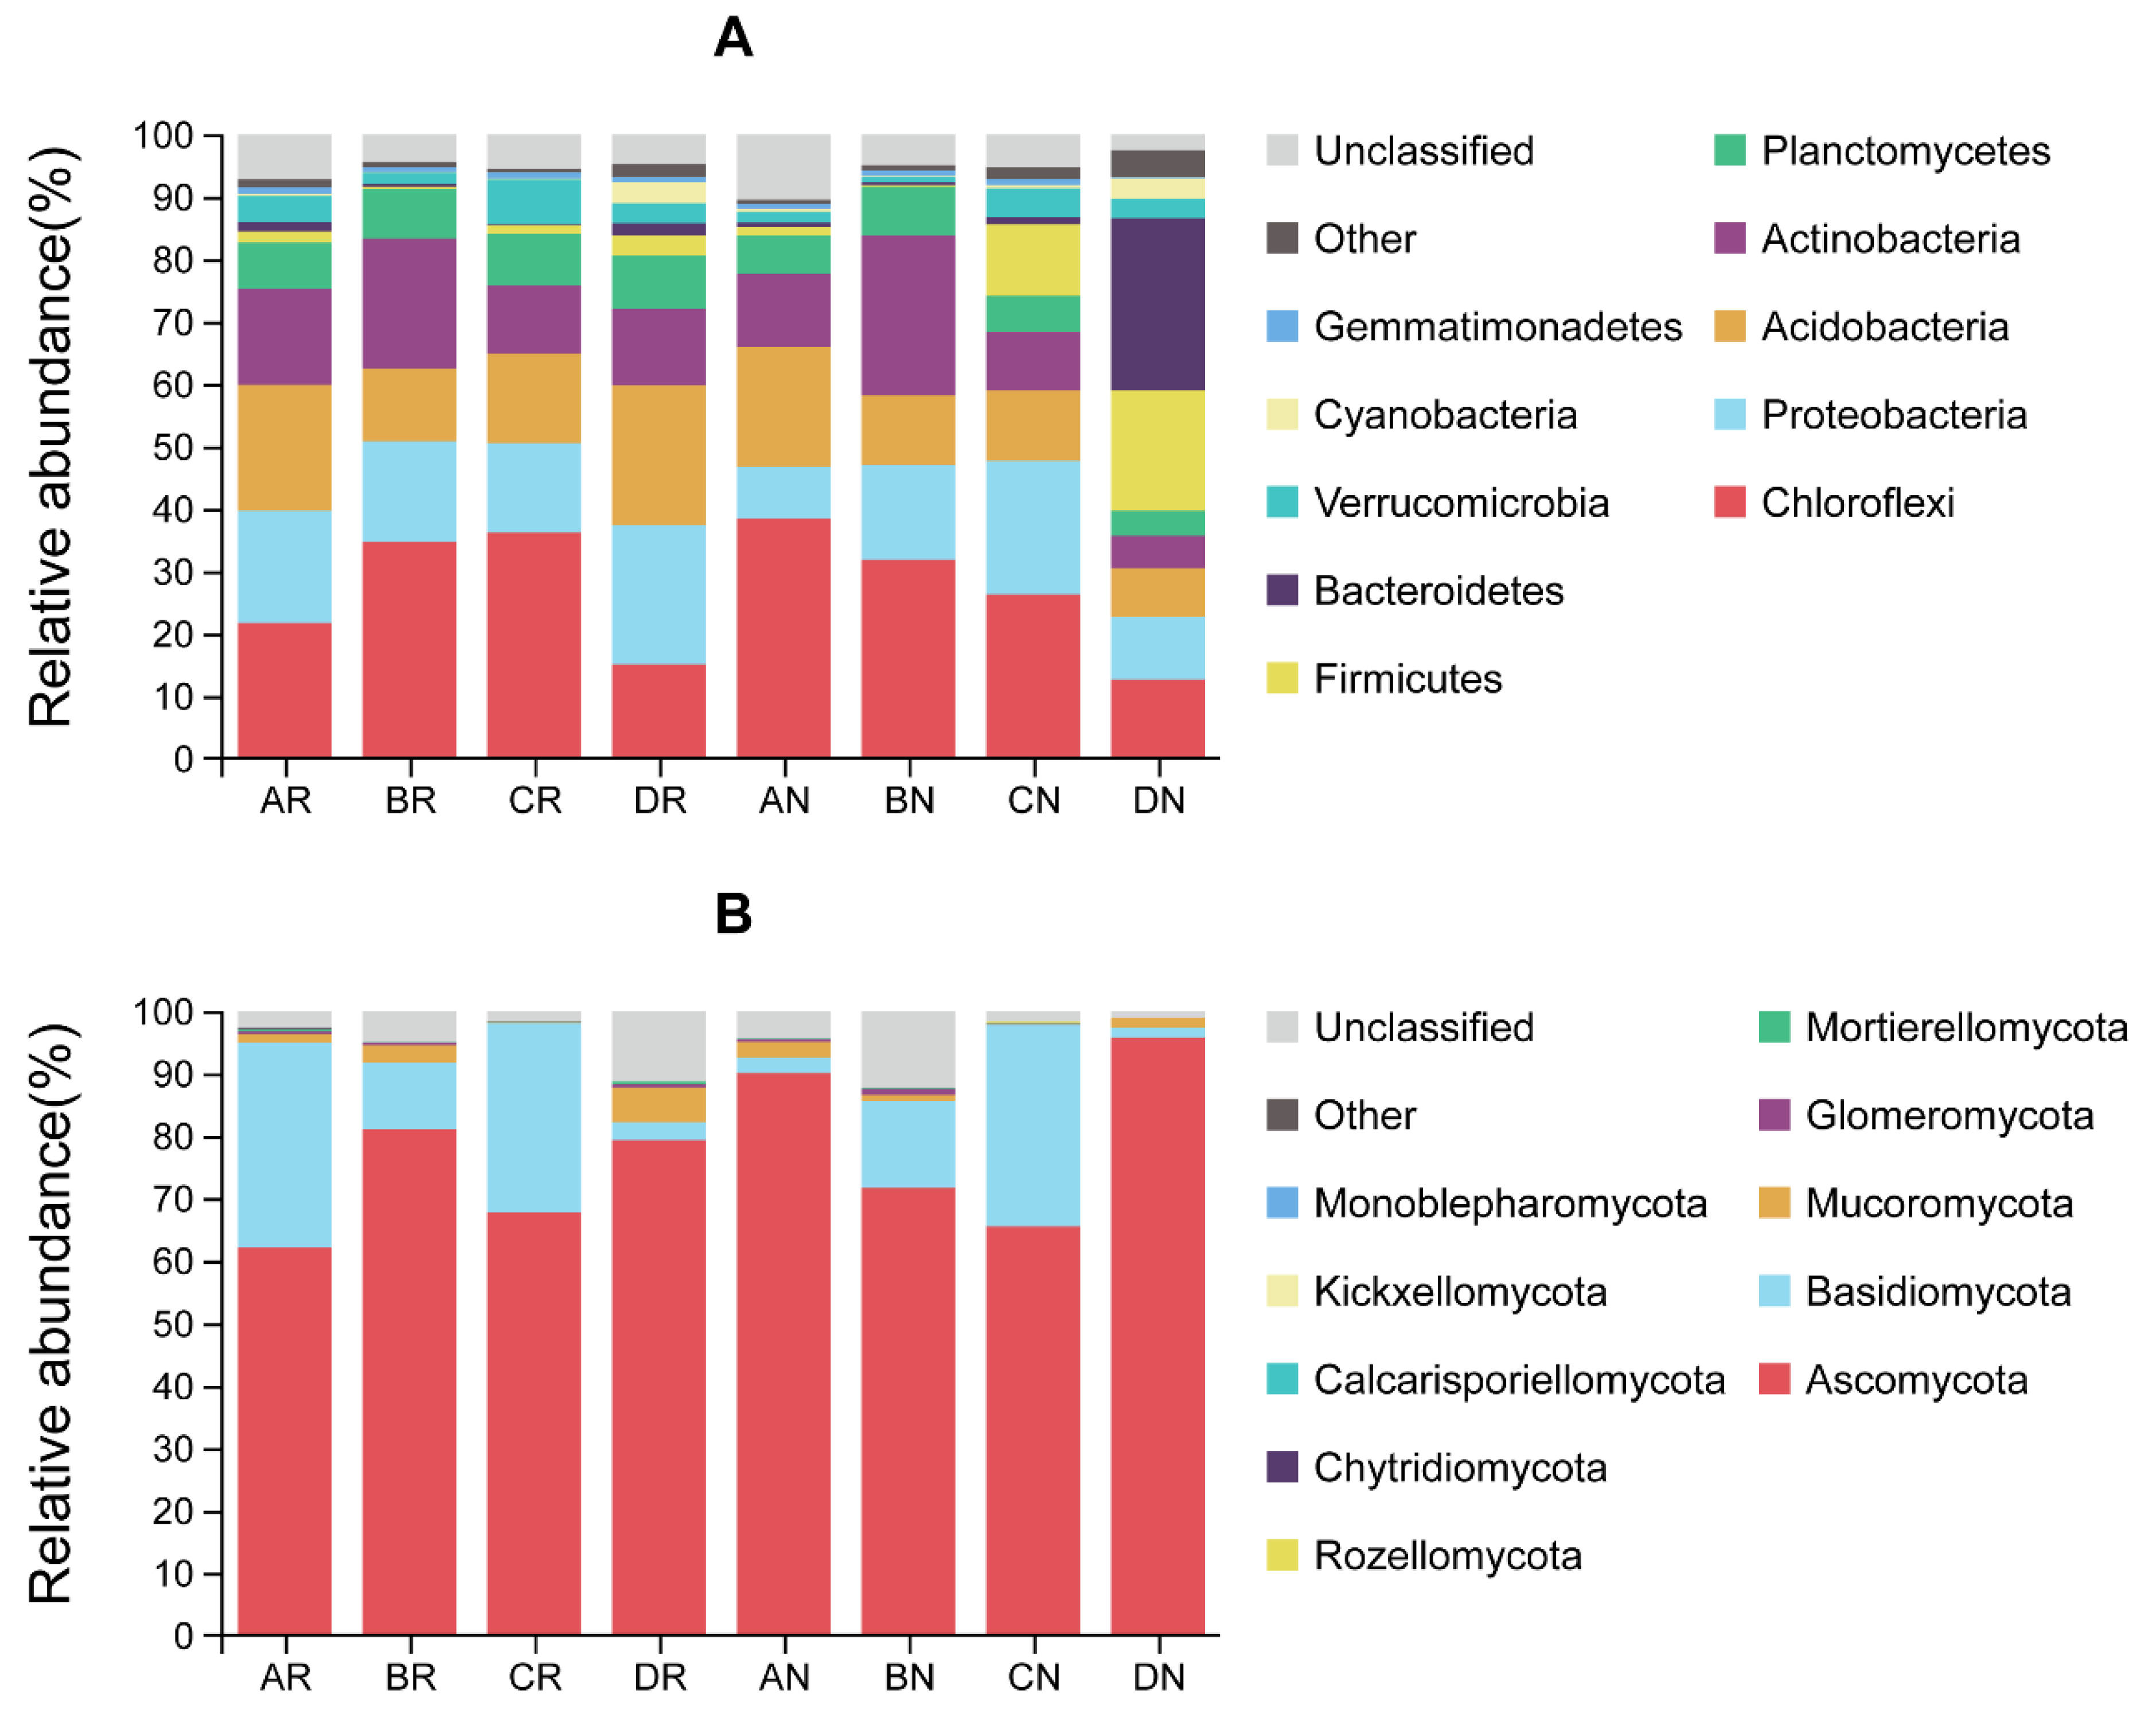
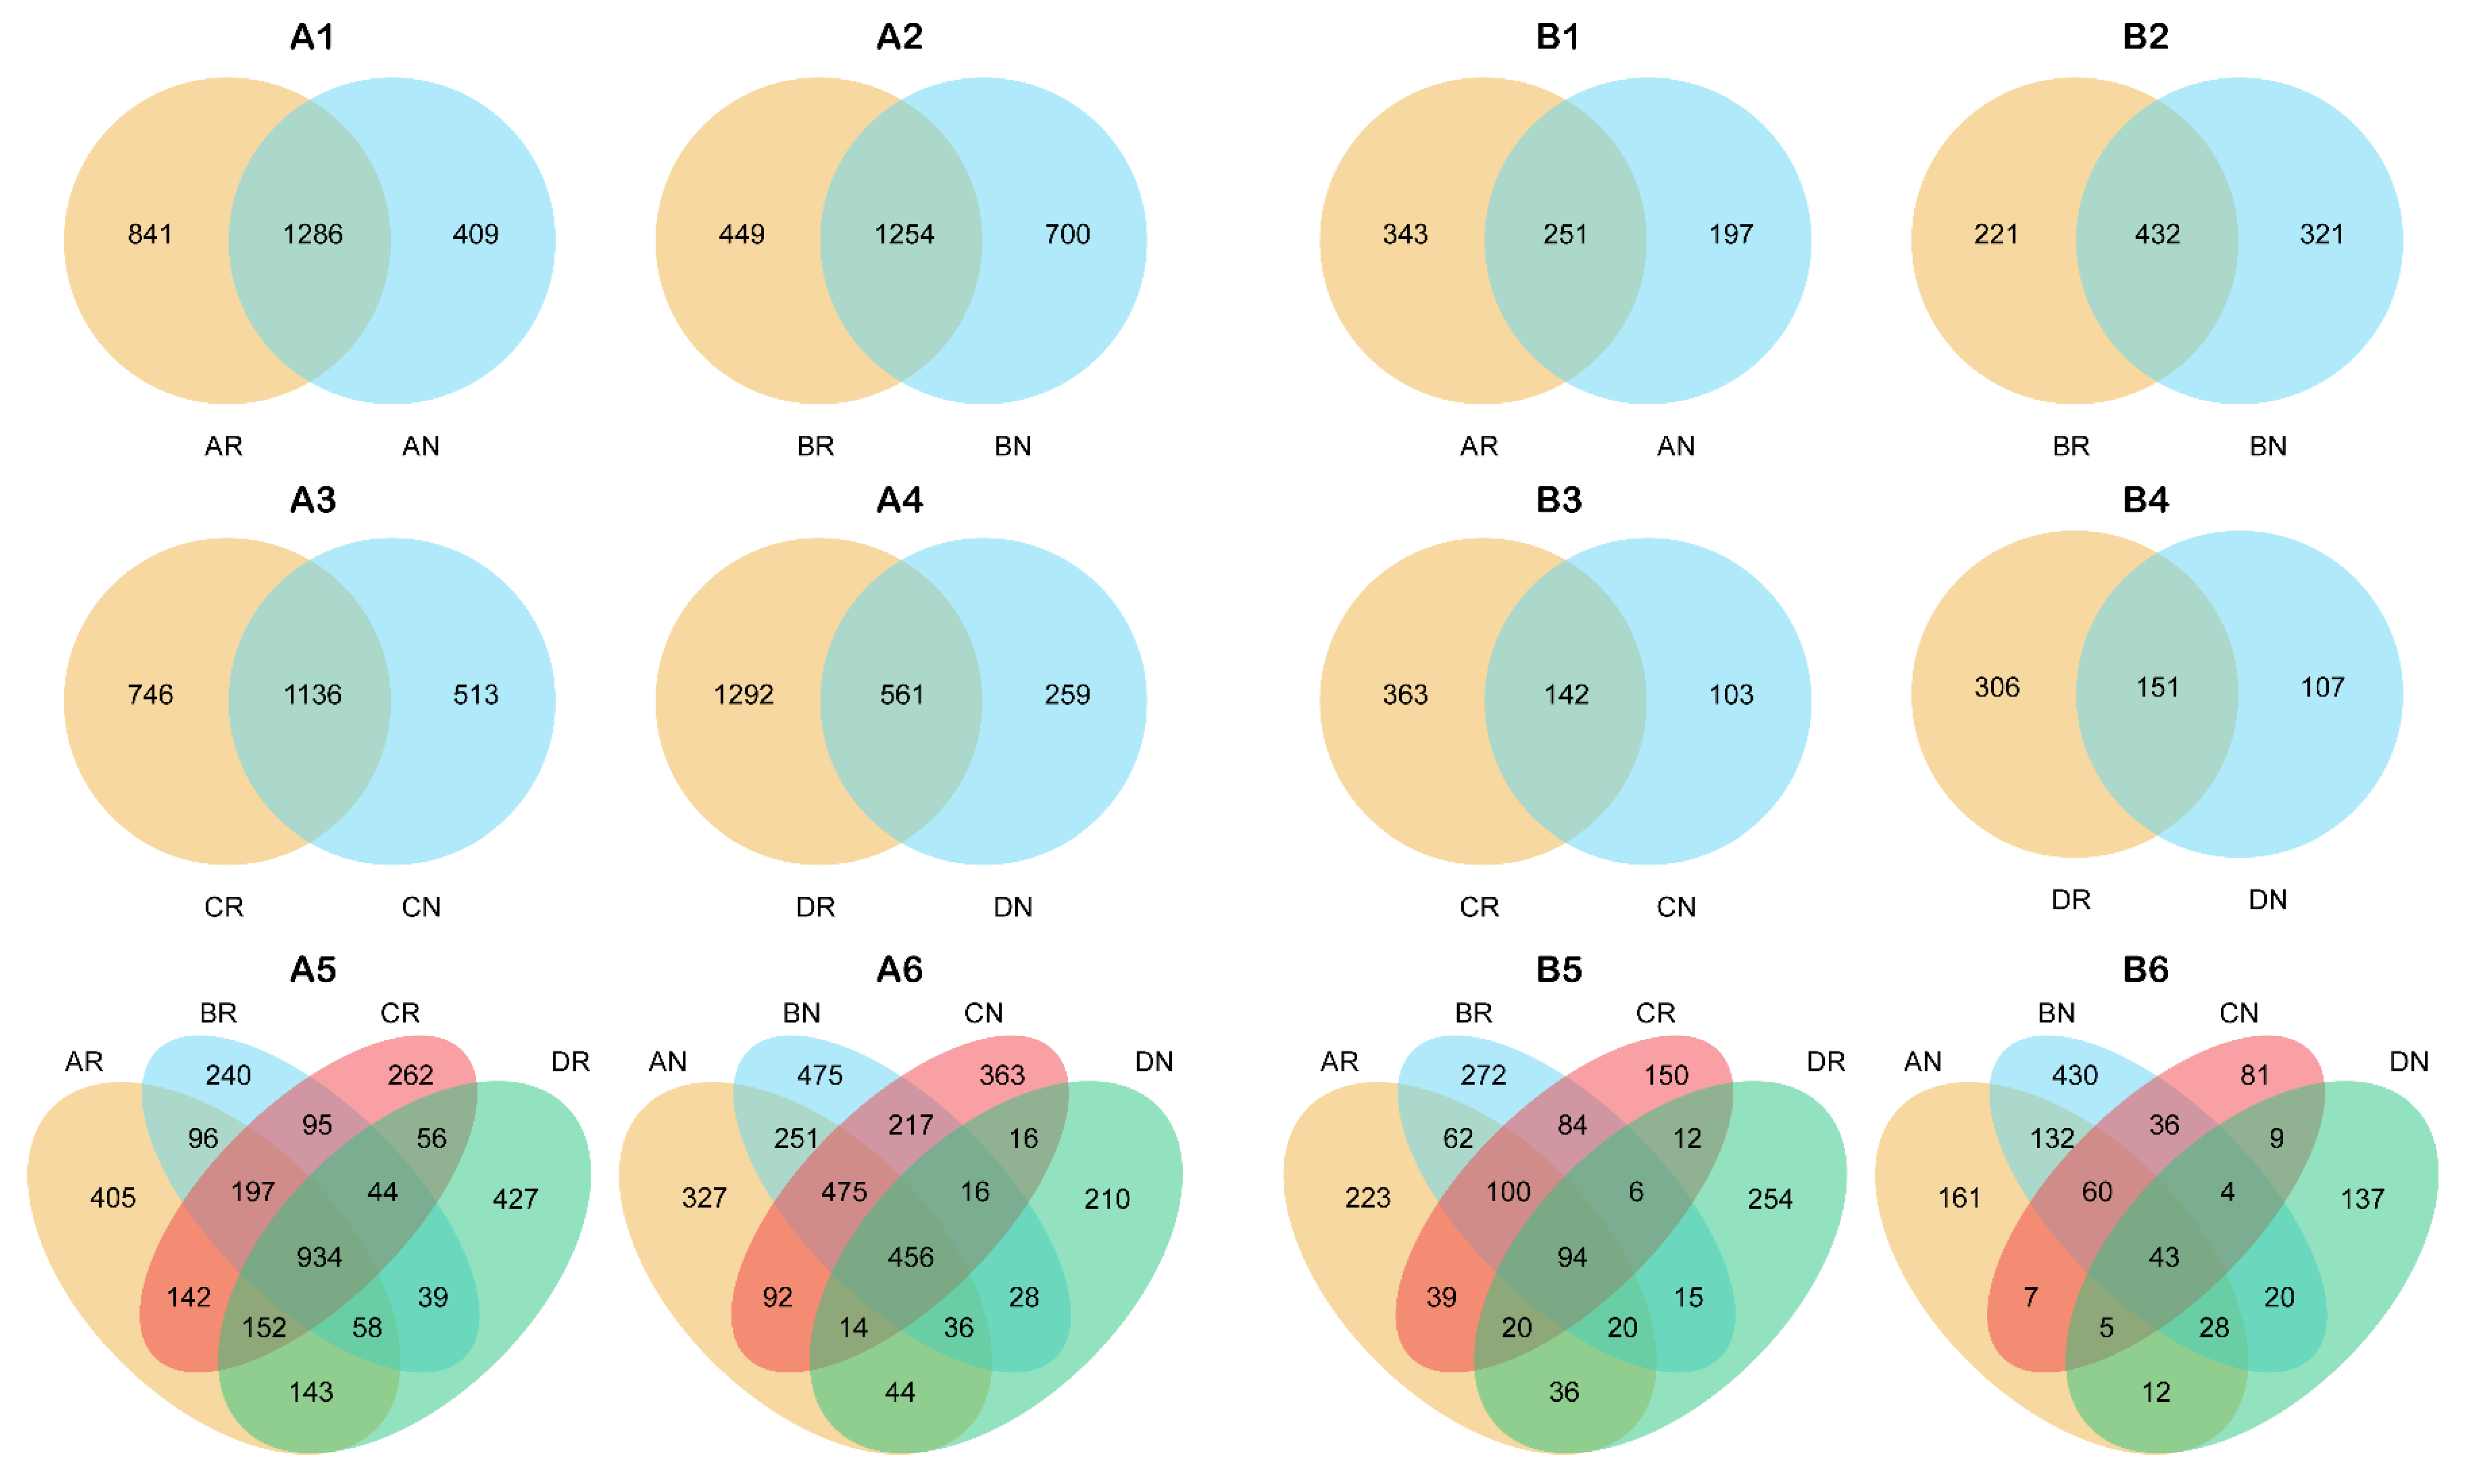
3.1.2. Microbial Composition

According to Figure 1, the dominant bacteria were Chloroflexi, Proteobacteria, Acidobacteria, Actinobacteria, Planctomycetes, Firmicutes, and Bacteroidetes at the phylum level. The dominant fungi were Ascomycota, Basidiomycota, and Mucoromycota at the phylum level. Venn diagrams (Figure 2) indicated that, with the exception of summer, the number of specific bacterial OTUs in the rhizosphere was higher than in the non-rhizosphere. In winter, the number of specific bacterial OTUs in the non-rhizosphere and the number of common bacterial OTUs between the rhizosphere and non-rhizosphere were much lower than in the other seasons, while the number of specific bacterial OTUs in the rhizosphere was much higher than in the other seasons. In the rhizosphere, the number of specific bacterial OTUs in spring and winter was higher than in summer and autumn, while the opposite was observed in the non-rhizosphere. The number of common bacterial OTUs among each season in the rhizosphere was 934, which was higher than the value of 456 in the non-rhizosphere.
As observed with the bacterial OTUs, the number of specific fungal OTUs in the rhizosphere was higher than in the non-rhizosphere, except for in summer. The highest number of common fungal OTUs between the rhizosphere and non-rhizosphere was in summer. In both the rhizosphere and non-rhizosphere, the highest number of specific fungal OTUs was detected in summer, while the lowest was found in autumn. The number of common fungal OTUs among each season in the rhizosphere was 94, which was higher than the value of 43 in the non-rhizosphere.

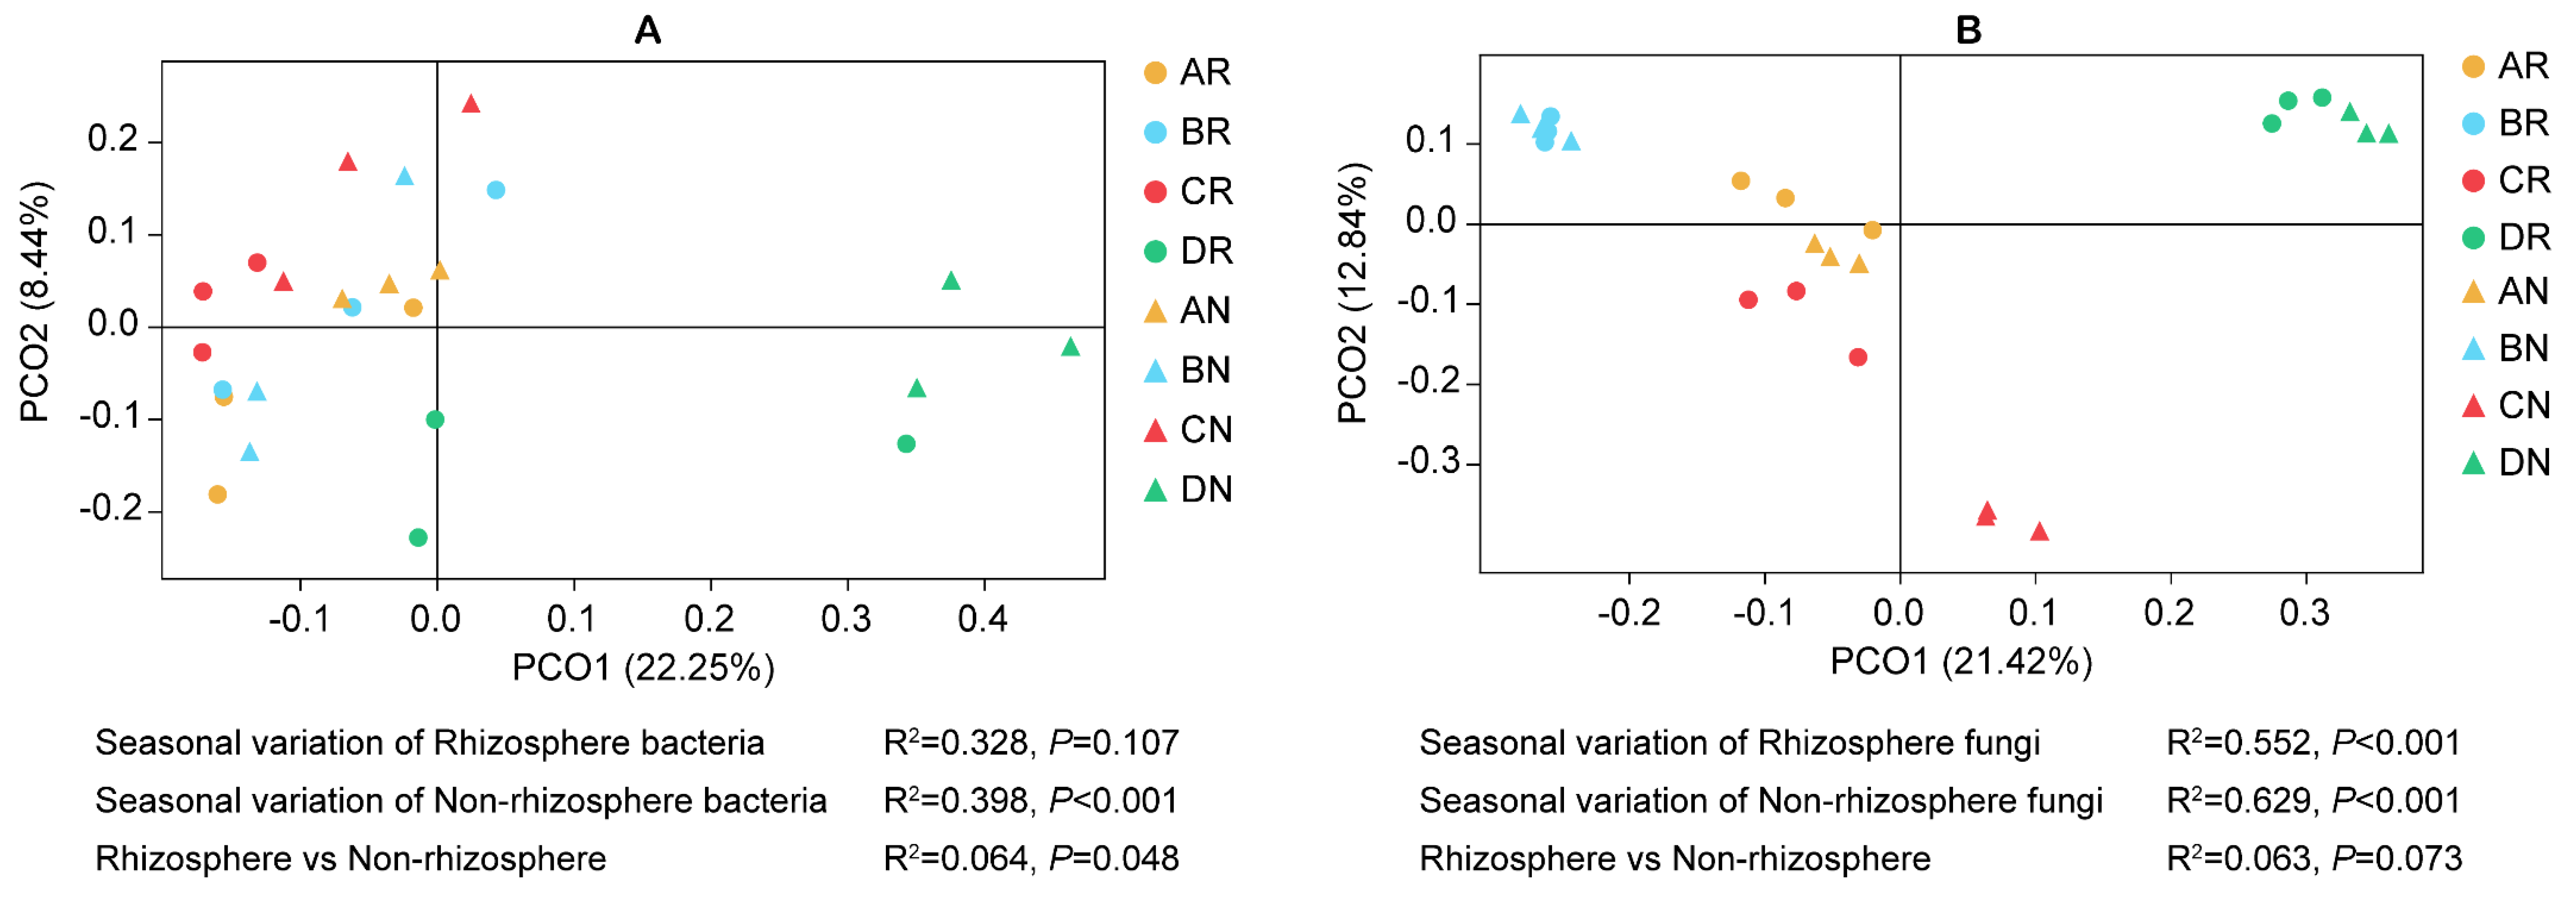
3.1.3. Microbial Diversity

According to Table 1, there were no significant differences in bacterial Sobs and Shannon indexes among different seasons in the rhizosphere. The bacterial Sobs, Chao 1, and Shannon indexes in winter were much lower than in the other seasons in the non-rhizosphere. The highest fungal Sobs, Chao 1, and Shannon indexes were detected in summer in both the rhizosphere and non-rhizosphere. There was no significant difference in fungal Sobs and Shannon index between the rhizosphere and non-rhizosphere during the entire year. In autumn, the fungal Chao 1 index in the rhizosphere was remarkably higher than in the non-rhizosphere.
PCoA and Permanova (Figure 3) indicated that seasonality had a great influence on the soil bacterial communities in the non-rhizosphere (p < 0.001), fungal communities in the rhizosphere (p < 0.001), and fungal communities in the non-rhizosphere (p < 0.001). Across the whole year, the bacterial communities in the rhizosphere differed significantly (p = 0.048) from those in the non-rhizosphere (Figure 3A). However, there was no significant difference (p = 0.073) between fungal communities in the rhizosphere and non-rhizosphere (Figure 3B).

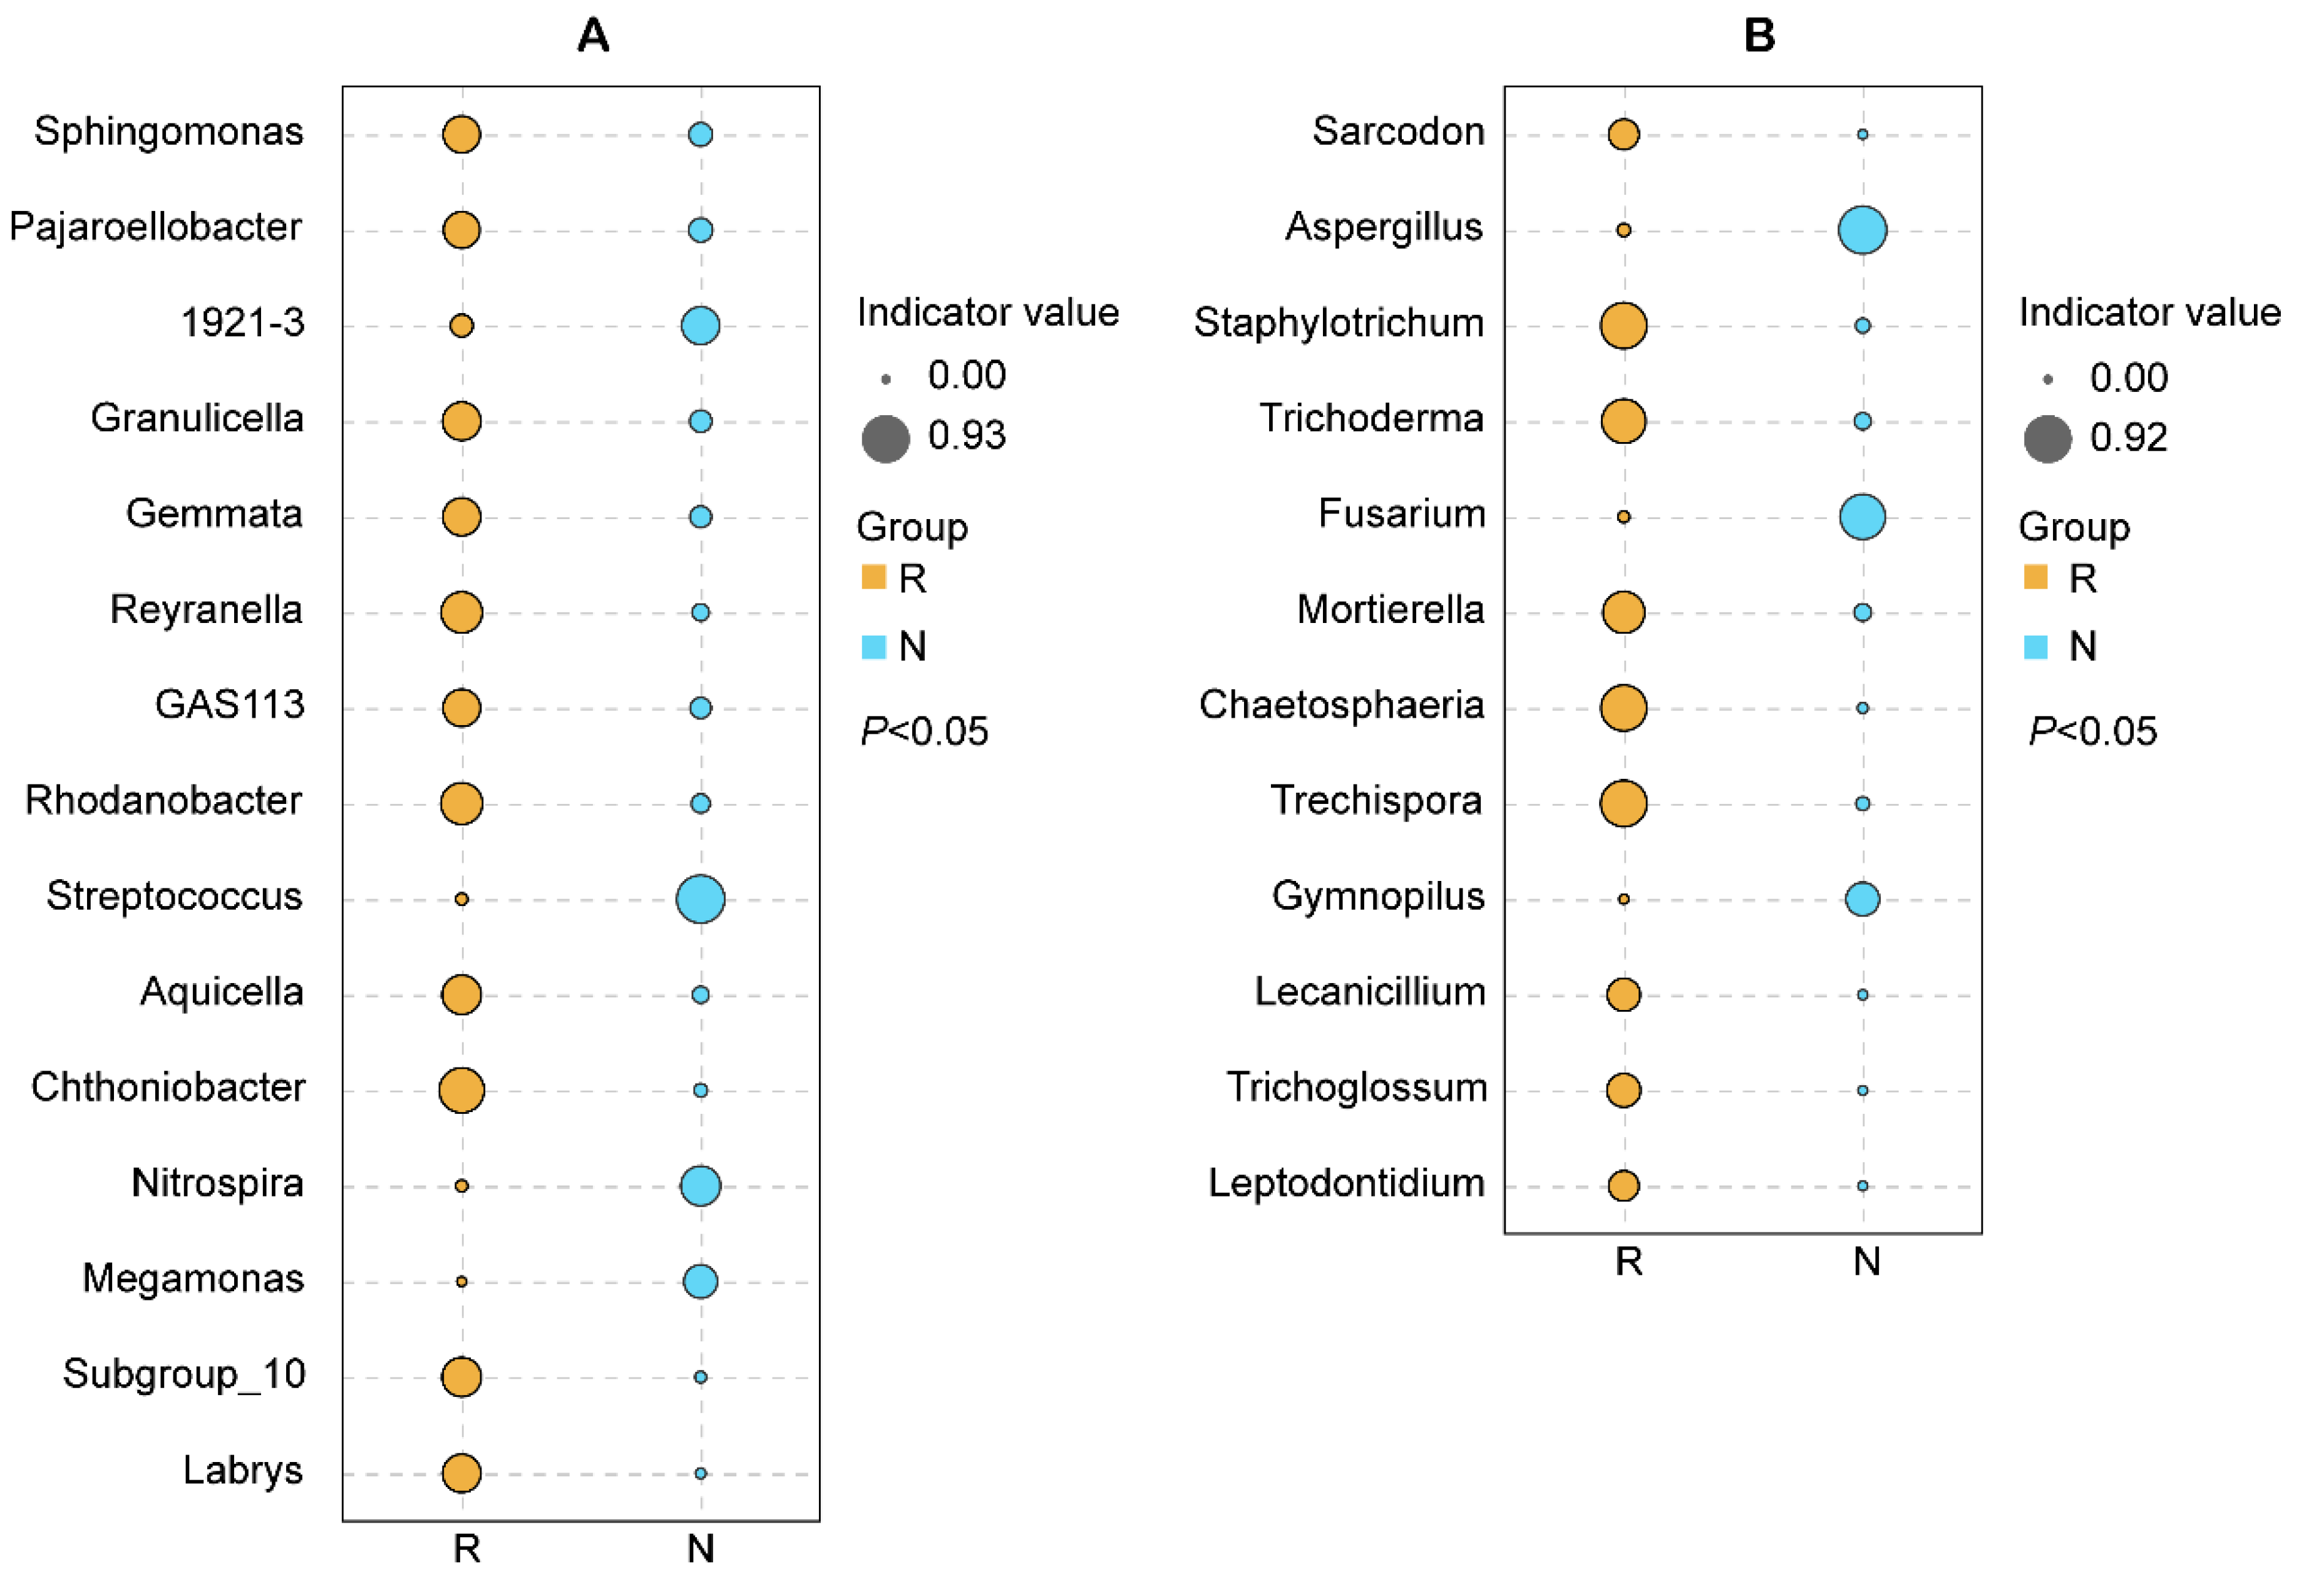
3.1.4. Microbial Biomarkers in the Rhizosphere

In order to identify biomarkers in the rhizosphere, LEfSe and indicator analysis were applied. As observed with microbial diversity and composition, the biomarkers in the rhizosphere were also significantly affected by seasonal variation. According to Figure S3, the most bacterial biomarkers were detected in winter, while there were no biomarkers in summer in the rhizosphere. As observed with the bacterial biomarkers, the most fungal biomarkers were detected in winter, while the least was detected in summer (Figure S4).
Across the entire year, the bacterial and fungal biomarkers in the rhizosphere were both much higher than in the non-rhizosphere. In the rhizosphere, the bacterial biomarkers included Chthoniobacter, Rhodanobacter, Reyranella, Aquicella, Subgroup_10, Granulicella, Labrys, Gemmata, GAS113, Sphingomonas, and Pajaroellobacter at the genus level (Figure 4A), while the fungal biomarkers were Trechispora, Staphylotrichum, Chaetosphaeria, Trichoderma, Mortierella, Trichoglossum, Lecanicillium, Sarcodon, and Leptodontidium at the genus level (Figure 4B).

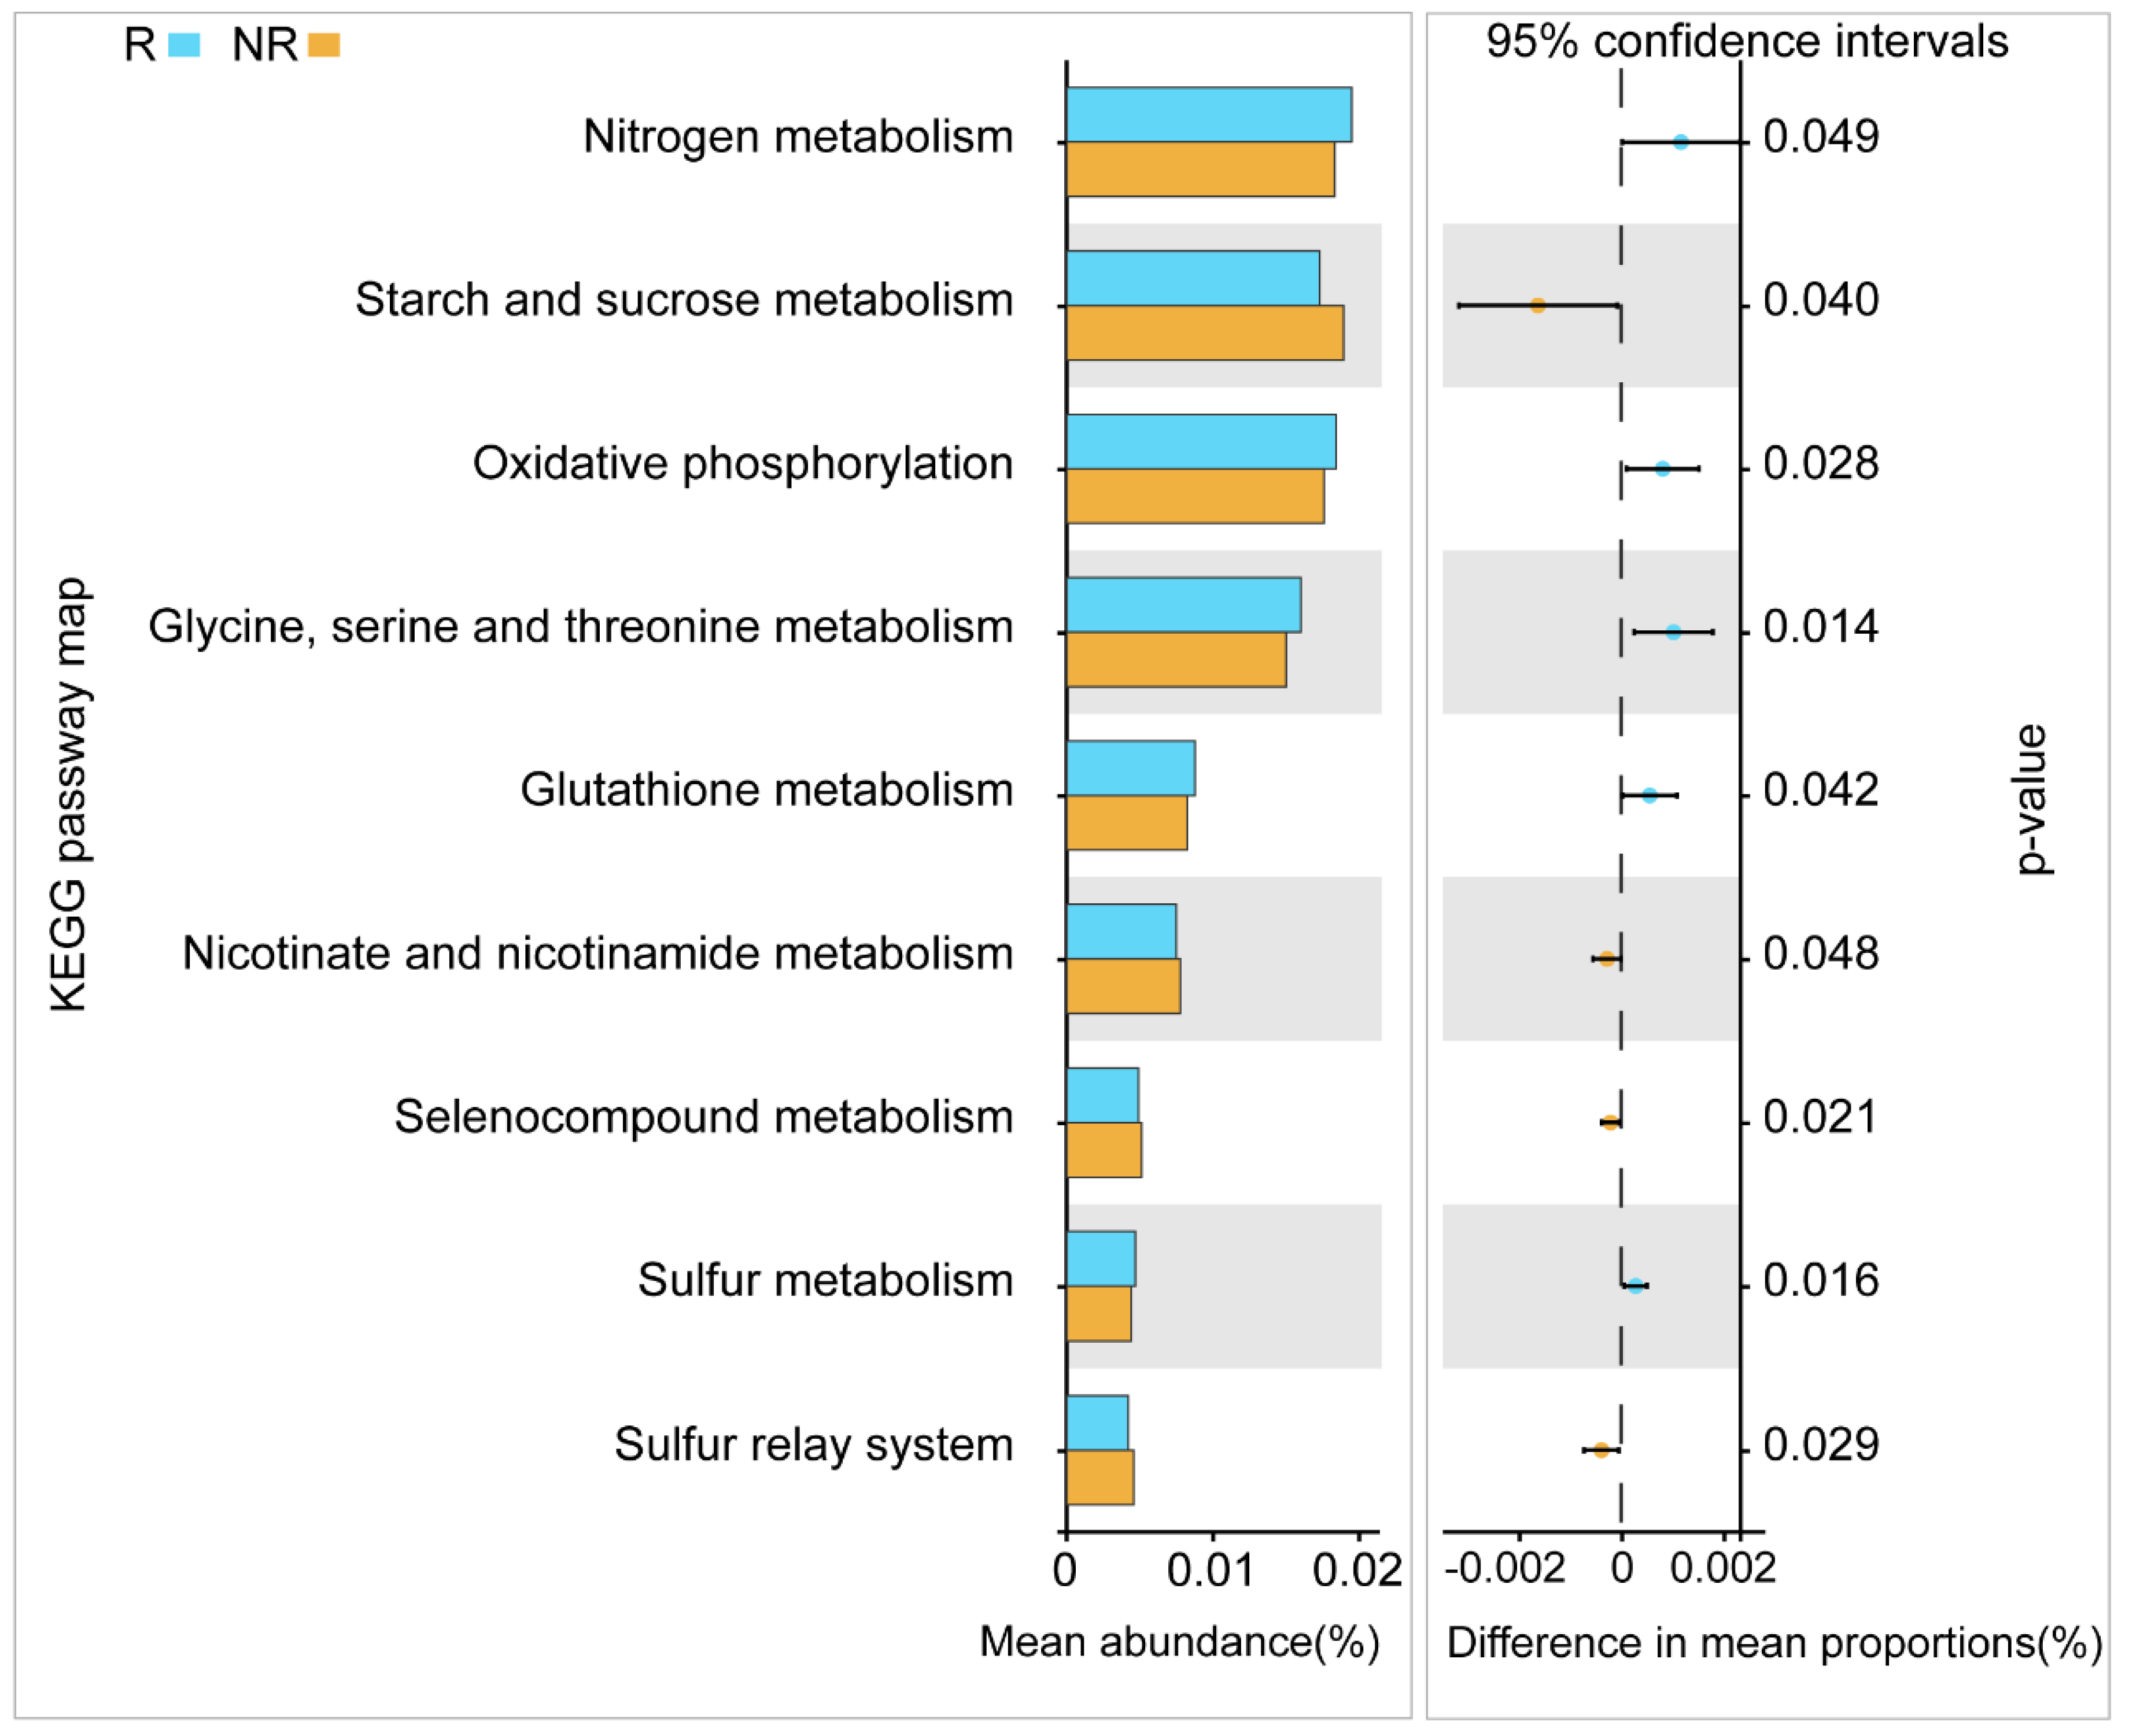
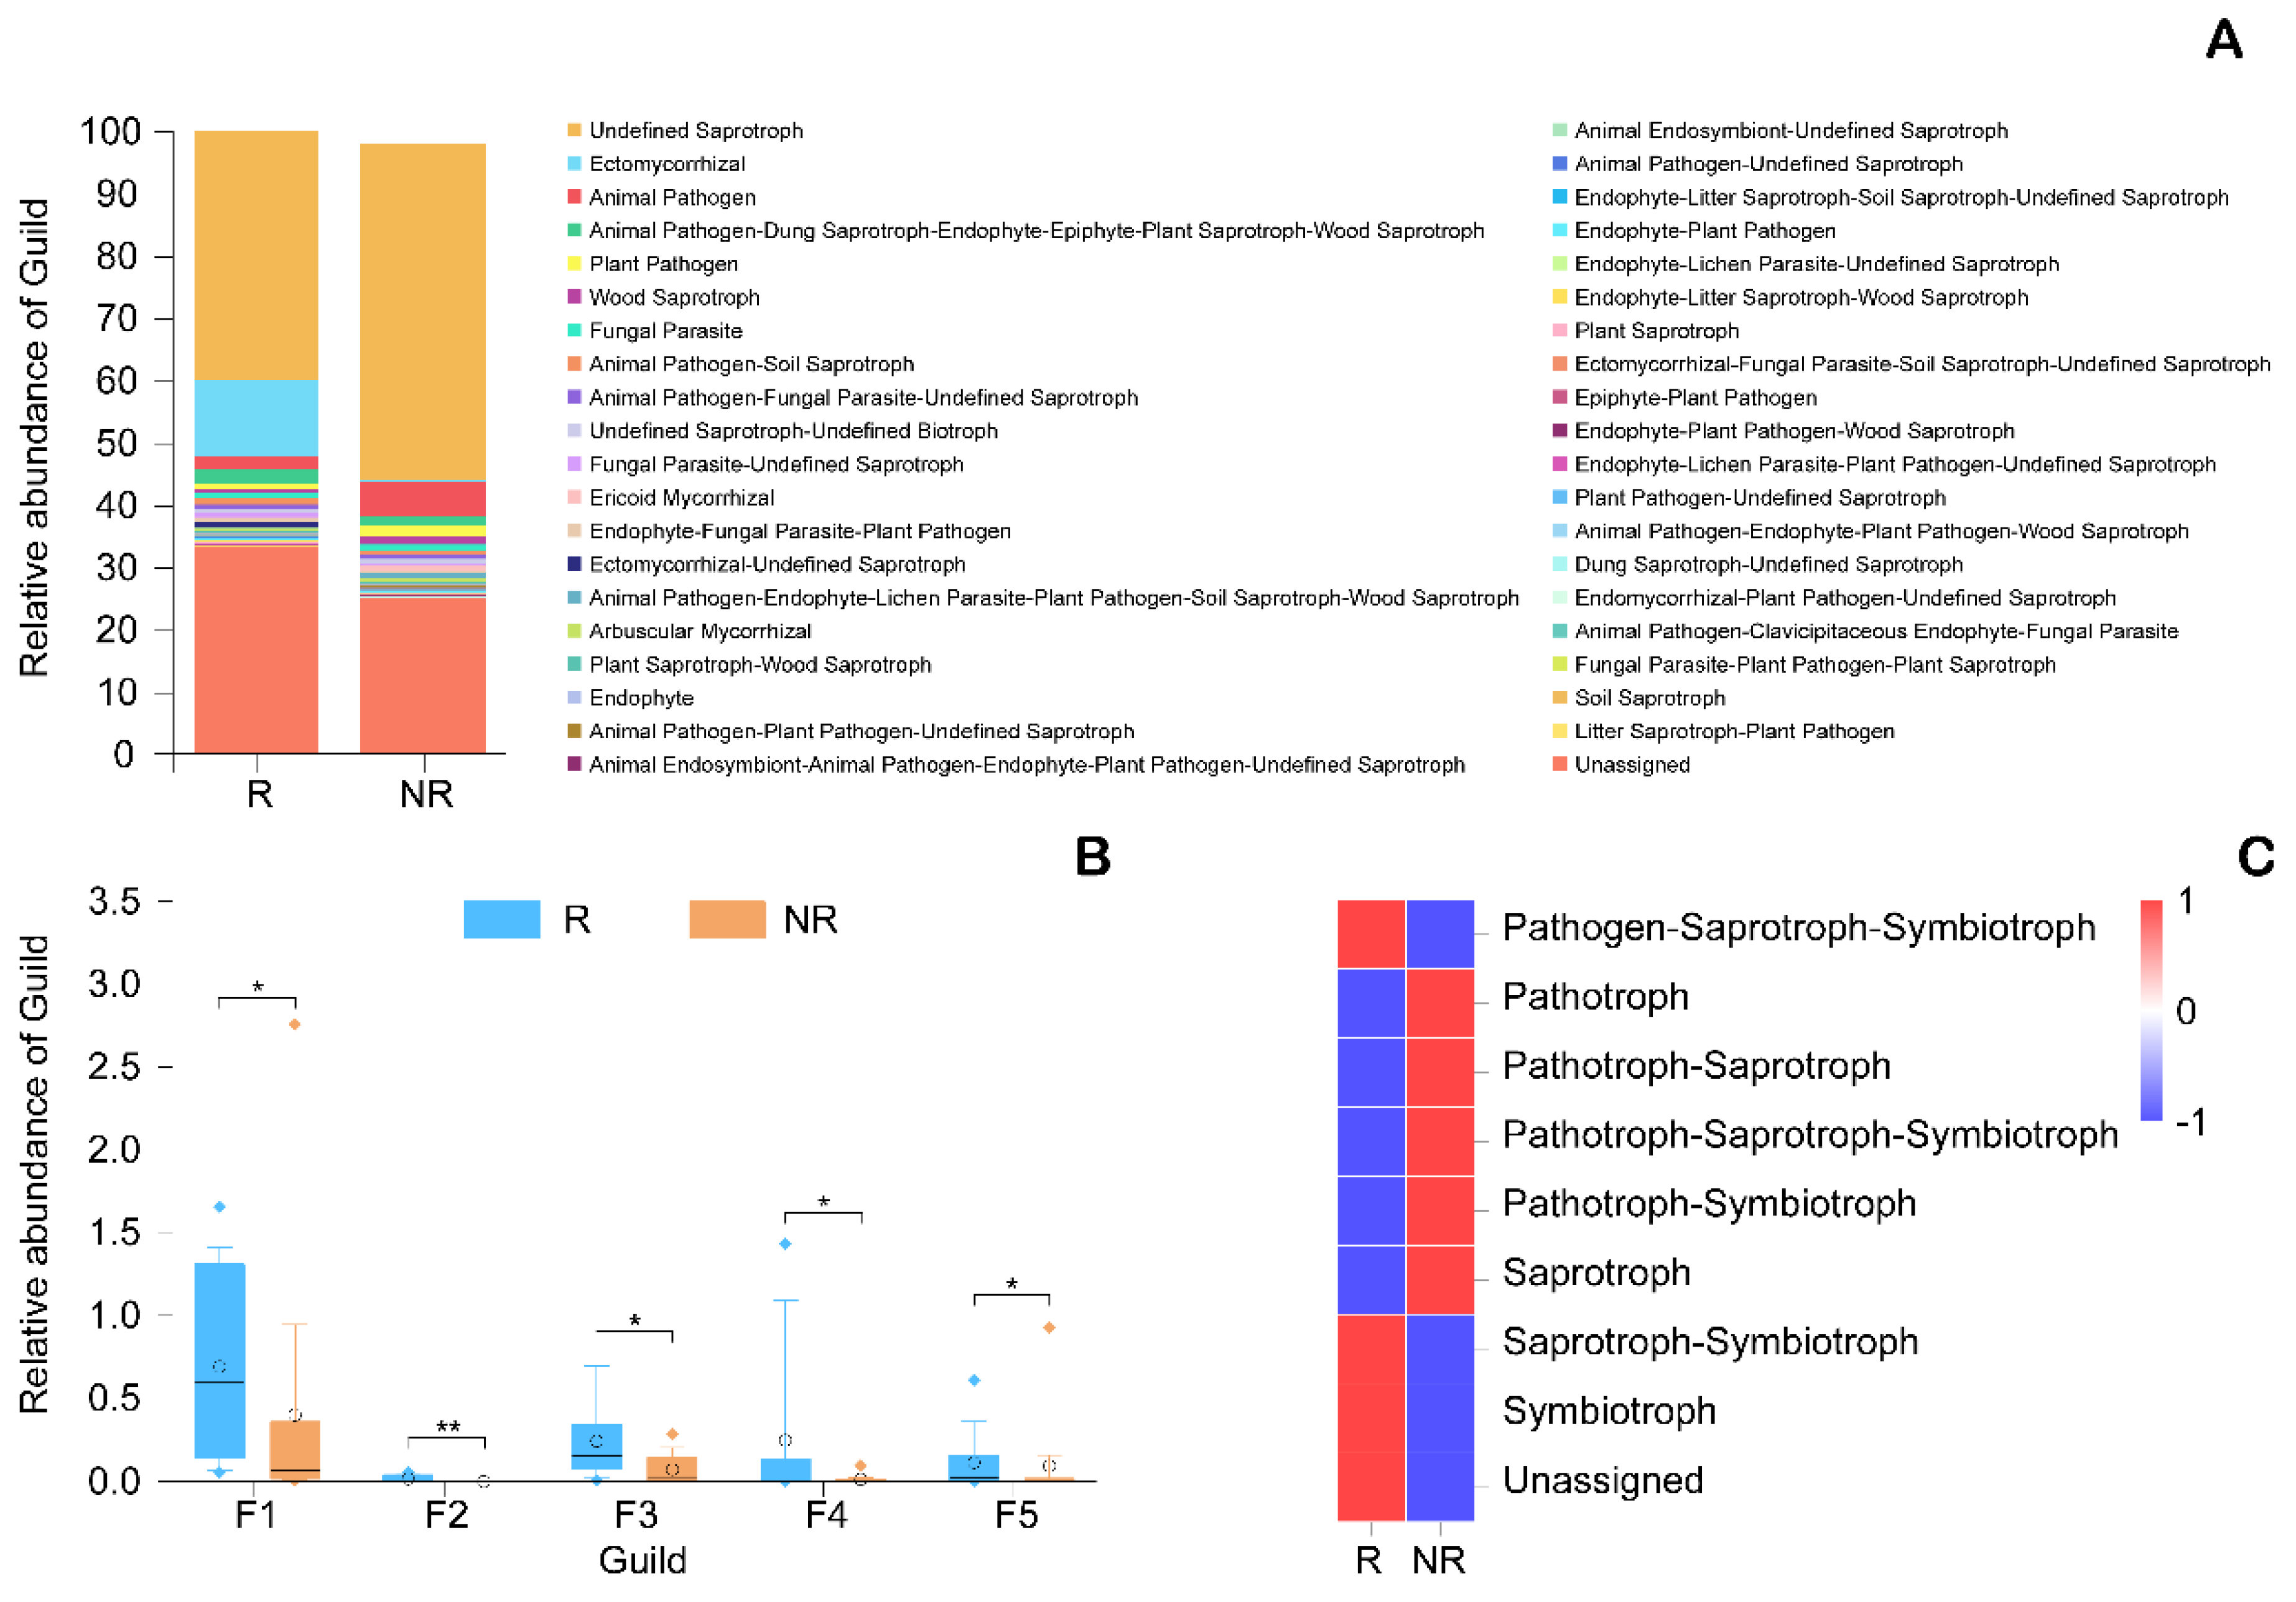
3.2. Functional Analysis of Microorganisms

The abundances of nitrogen metabolism, oxidative phosphorylation, glycine, serine and threonine metabolism, glutathione metabolism, and sulfur metabolism in the rhizosphere were significantly higher than in the non-rhizosphere (Figure 5). According to the FUNGuild analysis, endophytes and ectomycorrhizal fungi in the rhizosphere were significantly higher than in the non-rhizosphere (Figure 6B). Trophic analysis indicated that symbiotrophs were more abundant in the rhizosphere, while pathotrophs were more abundant in the non-rhizosphere (Figure 6B).

3.3. Interactions Between Environmental Factors and Microbial Communities

According to Table S1, seasonality and rhizosphere had a remarkable influence on soil physiochemical properties. Different soil physiochemical properties had different responses to seasonal variation. Available nutrients, such as AP, AK, AMN, NN, and AHN, varied more frequently than TP, TN, and TOC along with seasonal dynamics. AP was higher in spring and summer than in winter and autumn, while TK, AMN, NN, and SWC were higher in autumn and winter than in spring and summer. There was no significant difference in most soil physiochemical properties between the rhizosphere and non-rhizosphere, except for AMN, AHN, TOC, and N/P. AMN was significantly higher in the non-rhizosphere than in the rhizosphere in summer. AHN was significantly lower in the rhizosphere than in the non-rhizosphere in spring, while the result was reversed in winter. TOC and N/P were both significantly higher in the rhizosphere than in the non-rhizosphere in winter.
Figure S5 indicates the environmental factors with significant contributions to the microbial communities in the rhizosphere and non-rhizosphere soil at the genus level. According to Table 2, there were no significant correlations between environmental factors and bacterial diversity in the rhizosphere. According to Table 3, in the rhizosphere, fungal abundance was positively correlated with TP and Tem, but negatively correlated with TK, NN, and N/P.
In order to elucidate the interactions between environmental factors and microbial species, the biomarkers and the top 10 abundant species at the genus level were selected to conduct correlation analysis with environmental factors (Figures S6 and S7). In both bacteria and fungi, the interactions between microorganisms and environmental factors were strikingly different between the rhizosphere and non-rhizosphere. pH was significantly correlated with most bacteria in the rhizosphere (Figure S6). Acidothermus, the most abundant bacteria in the rhizosphere, was significantly positively related to Tem both in the rhizosphere and non-rhizosphere. Compared with bacteria, there were more significant correlations between environmental factors and fungi at the genus level (Figure S7). Most fungi were negatively correlated with Tem, but positively correlated with NN and AHN in the rhizosphere.

4. Discussion

Numerous studies have shown that seasonal variation strongly regulates soil physiochemical properties and microorganisms [10,59,60,61,62]. However, no studies have assessed the seasonal variation in soil properties and microbial communities in the rhizosphere of C. yuhsienensis. In this study, seasonal variation was the predominant influencing factor on soil physiochemical properties. The soil properties among seasons in this study differed greatly from those of Zhang, Cui, Guo, and Xi [30] in C. oleifera forests. This might be because the climate and soil types are markedly different. Many studies have reported that the soil properties in the rhizosphere differ greatly from those in the non-rhizosphere [30,63]. Our result showed that AHN, TOC, and N/P were both significantly higher in the rhizosphere than in the non-rhizosphere in winter. This indicates that the C. yuhsienensis roots maintained higher activity in winter. No significant differences were found in soil pH between rhizosphere and non-rhizosphere—which is not consistent with Zhang et al. [30], who found that the rhizosphere pH of C. oleifera was significantly lower than non-rhizosphere. A previous study showed that in order to acquire more phosphorous, C. oleifera exuded various organic acid, which led to the decline of pH [64]. These results suggested that C. yuhsienensis roots might not be as active as C. oleifera and had a weaker influence on soil physiochemical properties.
Compared with bacteria, fungi were more sensitive to soil physicochemical properties in this study (Table 2 and Table 3). The positive correlations between TP and fungal richness (Table 3) in this study are contrary to those studies which showed that phosphorous is the key limiting factor on the establishment of symbioses between plant and mycorrhizal fungi [65,66]. Previous studies about the negative influences of phosphorous on mycorrhizal fungi were under the high content of phosphorous. However, the contents of the AP and TP were low in this study (Table S1), which is not enough to inhibit mycorrhizal fungi. AP was widely considered to be a limiting factor of yield for oil tea in China [67,68]. Otherwise, mycorrhizal fungi were not dominant in the fungal community in this study, which also explained why phosphorous contents were positively correlated with fungal richness.
The dominant bacteria, Chloroflexi, Proteobacteria, Acidobacteria, Actinobacteria, and Planctomycetes, and fungi, Ascomycota and Basidiomycota, in the rhizosphere of C. yuhsienensis were similar to previous studies in C. oleifera rhizosphere or bulk soil [10,30], but a little different from the rhizosphere soil of Camellia sinensis [69]. These results indicated that nutrient utilization patterns of the plant might significantly alter microbial communities. There were significantly different responses between the rhizosphere and non-rhizosphere microbial communities to seasonal variation. During the entire year, the shared OTUs of the four seasons in the rhizosphere were higher than those in the non-rhizosphere for both bacteria and fungi (Figure 2). The PCoA also indicated that the effect of seasonal variation on bacterial community structure was smaller in the rhizosphere (R2 = 0.328, p = 0.107) than in the non-rhizosphere (R2 = 0.398, p < 0.001) (Figure 3A). On account of the root activity of C. yuhsienensis, the bacterial community structure in the rhizosphere differed significantly from that in the non-rhizosphere (R2 = 0.064, p = 0.048). Particularly in winter, the bacterial OTUs in the rhizosphere did not decrease due to the low temperature, as observed in the non-rhizosphere, but rather the number of exclusive OTUs increased (Figure 2A). The bacterial Sobs, Chao 1, and Shannon indexes were significantly higher in the rhizosphere than in the non-rhizosphere in winter. These results indicated that the roots of C. yuhsienensis might have higher excretions in winter, thus remarkably increasing the activity of bacteria in winter. This result is consistent with past studies that indicated that the roots of C. yuhsienensis are also active in winter [70,71]. The fungal community structures also varied greatly with seasonal variation (Figure 3B). Across the entire year, fungi in the non-rhizosphere were more sensitive to seasonal variation than those in the rhizosphere (Table 1 and Figure 2B). Notably, there were slight differences between the rhizosphere and non-rhizosphere microbial communities, regardless of microbial community structure, microbial diversity, or microbial OTUs (Figure 1 and Figure 2 and Table 1), and the number of fungal and bacterial biomarkers was lowest in summer in both the rhizosphere and non-rhizosphere (Figure S3 and Figure S4). In summary, seasonal variation was the predominant effective factor influencing microbial diversity and structure, and the activity of C. yuhsienensis roots could provide a more stable environment for microorganisms, especially for bacteria in winter.
Exploring the rhizosphere microbial function is a great way to understand the interactions between plants and microorganisms. Although there are already some researchers focusing on microbial communities associated with oil tea [10,30], the microbial functions in the oil tea rhizosphere have never been noticed. Indicator analysis showed that the number of biomarkers in the rhizosphere was much higher than in the non-rhizosphere (Figure 4). All of the bacterial biomarkers in the rhizosphere in this study were chemoorganotrophic Gram-negative bacteria that grow under aerobic conditions [72,73,74,75,76,77,78]. Some species of Rhodanobacter can degrade γ-hexachlorocyclohexane (lindane; γ-HCH) under aerobic conditions, and some species have the ability to antagonize root rot fungi [79] or to denitrify nitrate [80,81]. Most Labrys species have been reported as biodegraders of some harmful organic matter for animals, such as Labrys portucalensis [82,83]. Sphingomonas, a Gram-negative bacteria that was a biomarker in the rhizosphere, grows under aerobic conditions. Sphingomonas species are widely distributed throughout the soil and water and are associated with plant roots [84]. Sphingomonas species are multifunctional. Some exhibit antagonism against the phytopathogenic fungus Verticillium dahliae [85], while some are the pathogenic bacteria causing plant root disease [86], and some are able to degrade refractory pollutants [87]. The biomarkers reflect that the rhizosphere environment of C. yuhsienensis had high air permeability and abundant organic nutrients for these bacteria.
Most fungal biomarkers in the rhizosphere of C. yuhsienensis are beneficial fungi for plants. Trichoderma has been reported several times to protect plants and contain pathogen populations [88,89]. This is the first study to report Trichoderma in the rhizosphere of C. yuhsienensis. Mortierella is a large and diverse genus, and most species of Mortierella are saprobic and abundant in the soil and plant debris [90]. Arachidonic acid (ARA), produced by most Mortierella species, is an important constituent of biological cells [91]. ARA is not only beneficial for animals [92], but can also antagonize plant disease [93]. Lecanicillium species have great potential as biocontrol agents [94]. Most Lecanicillium species are able to parasitize many insects, such as Lecanicillium longisporum against aphids, Lecanicillium muscarium against whiteflies and thrips [95], and Lecanicillium psalliotae against the root-knot nematode Meloidogyne incognita [96]. Meloidogyne incognita is one of the major nematodes of oil tea roots [97].
In general, most biomarkers in the rhizosphere of C. yuhsienensis are beneficial for plants, and thus, we may speculate that the root activity of C. yuhsienensis markedly improved the rhizosphere conditions and increased the beneficial microorganisms. Functional analysis also verified this (Figure 5 and Figure 6).

5. Conclusions

The dominant bacteria in the rhizosphere of C. yuhsienensis were Chloroflexi, Proteobacteria, Acidobacteria, Actinobacteria, and Planctomycetes, and the dominant fungi were Ascomycota, Basidiomycota, and Mucoromycota. Seasonal variation was the predominant factor influencing soil microbial abundance, diversity, and structure and the soil physiochemical properties in the rhizosphere of C. yuhsienensis. There were weak correlations between microorganisms and soil physiochemical properties in the rhizosphere. Seasonal variation had significant effects on bacterial abundance, but not on diversity and structure, and had significant effects on fungal abundance and structure, but not on diversity in the rhizosphere. Significantly higher bacterial abundance and diversity were observed in the rhizosphere than in the non-rhizosphere, which reflected the high activity of the C. yuhsienensis roots in winter. All of the bacterial biomarkers in the rhizosphere were chemoorganotrophic Gram-negative bacteria that grow under aerobic conditions, and the fungal biomarkers, including Trichoderma, Mortierella, and Lecanicillium, have a great ability to protect against pathogens in the rhizosphere. In the rhizosphere of C. yuhsienensis, the dominant functions of the bacteria were oxidative phosphorylation and metabolism of nitrogen, glycine, serine, threonine, glutathione, and sulfur in the rhizosphere, while the dominant fungal functional groups were endophytes and ectomycorrhizal fungi of the symbiotroph trophic type. The activity of C. yuhsienensis created better conditions with good air permeability and formed a microbial community dominated by beneficial bacteria and fungi. We strongly suggest that future research should pay greater attention to the root vitality and exudation of C. yuhsienensis in different seasons, which might be the key to a better understanding of the relationships between roots and microbial community. This is the first time to study C. yuhsienensis rhizosphere microbial communities during seasonal variations, and the first time to study Camellia species rhizosphere microbial function. Therefore, we strongly suggest that researchers pay more attention to the rhizosphere microorganisms and provide more scientific data to better study and manage Camellia plantations.

Supplementary Materials

The following are available online at https://www.mdpi.com/2076-2607/8/9/1385/s1, Figure S1: Annual variation of soil temperature in Camellia yuhsienensis Hu. forest. Figure S2: Dilution curves of Sobs index of bacteria (A) and fungus (C) and Shannon index of bacteria (B) and fungus (D). AR, BR, CR and DR indicates rhizosphere soil sample in spring, summer, autumn, and winter, respectively. AN, BN, CN and DN indicates non-rhizosphere soil sample in spring, summer, autumn, and winter, respectively. Figure S3: Least discriminant analysis effect size (LEfSe) analysis of bacterial community in spring (A), summer (B), autumn (C) and winter (D). Red parts of circle in each cladogram indicate the biomarkers in rhizosphere soil samples. Green parts of circle in each cladogram indicate the biomarkers in non-rhizosphere soil samples. Yellow solid circles indicate that the abundance of species have no significant difference in rhizosphere and non-rhizosphere. n = 3. Figure S4: LEfSe analysis of fungal community in spring (A), summer (B), autumn (C) and winter (D). Red parts of circle in each cladogram indicate the biomarkers in rhizosphere soil samples. Green parts of circle in each cladogram indicate the biomarkers in non-rhizosphere soil samples. Yellow solid circles indicate that the abundance of species have no significant difference in rhizosphere and non-rhizosphere. n = 3. Figure S5: Contribution of environmental factors on bacterial community at genus level in rhizosphere (A) and non-rhizosphere (B) and fungal community in rhizosphere (C) and non-rhizosphere (D) using Variance Partitioning Analysis (VPA). AP, available phosphorous; TP, total phosphorous; AK, available potassium; TK, total potassium; AMN, ammonium nitrogen; NN, nitrate nitrogen; AHN, alkaline hydrolyzable nitrogen; TN, total nitrogen; TOC, total organic carbon; SWC, soil water content; Tem, soil monthly mean temperature; C/N, ratio of total carbon to total nitrogen; C/P, ratio of total carbon to total phosphorous; N/P, ration of total nitrogen to total phosphorous. n=3. Figure S6: Heatmap of correlations between environmental factors and bacteria at genus level in rhizosphere (A) and non-rhizosphere (B) based on Pearson correlation coefficients with the two-tail test. Red squares indicate positive correlations. Blue squares indicate negative correlations. “*” and “**” indicate the significant correlations at 0.05 and 0.01 level, respectively. AP, available phosphorous; TP, total phosphorous; AK, available potassium; TK, total potassium; AMN, ammonium nitrogen; NN, nitrate nitrogen; AHN, alkaline hydrolyzable nitrogen; TN, total nitrogen; TOC, total organic carbon; SWC, soil water content; Tem, soil monthly mean temperature; C/N, ratio of total carbon to total nitrogen; C/P, ratio of total carbon to total phosphorous; N/P, ration of total nitrogen to total phosphorous. n = 3. Figure S7: Heatmap of correlations between environmental factors and fungus at genus level in rhizosphere (A) and non-rhizosphere (B) based on Pearson correlation coefficients with the two-tail test. Red squares indicate positive correlations. Blue squares indicate negative correlations. “*” and “**” indicate the significant correlations at 0.05 and 0.01 level, respectively. AP, available phosphorous; TP, total phosphorous; AK, available potassium; TK, total potassium; AMN, ammonium nitrogen; NN, nitrate nitrogen; AHN, alkaline hydrolyzable nitrogen; TN, total nitrogen; TOC, total organic carbon; SWC, soil water content; Tem, soil monthly mean temperature; C/N, ratio of total carbon to total nitrogen; C/P, ratio of total carbon to total phosphorous; N/P, ration of total nitrogen to total phosphorous. n = 3. Table S1: Soil physicochemical property of each sample. Table S2: Quantitative statistics of bacterial OTUs and Tags of each sample. Table S3: Quantitative statistics of fungal OTUs and Tags of each sample.

Author Contributions

Conceptualization, J.Y. and J.L.; methodology, J.L.; validation, J.Y. and J.L.; formal analysis, J.L.; investigation, J.L., Z.L., C.Z., X.Q., M.C., T.S.; data curation, J.L.; writing—original draft preparation, J.L.; writing—review and editing, J.L. and J.Y.; visualization, J.L.; supervision, J.Y.; funding acquisition, J.Y. and J.L. All authors have read and agreed to the published version of the manuscript.

Funding

This research was funded by “Provincial Science and Technology Major Project of Hunan, China under Grant, grant number 2018NK1030”, “the Forestry Science and Technology Innovation Project of Hunan, China under Grant, grant number XLK201987”, “Scientific Innovation Fund for Post-graduates of Central South University of Forestry and Technology, grant number CX20191002”, and “Hunan Provincial Innovation Foundation For Postgraduate, grant number CX20190598”.

Conflicts of Interest

The authors declare no conflict of interest.

References

  1. Wood, C.T.; Schlindwein, C.C.D.; Soares, G.L.G.; Araujo, P.B. Feeding rates of Balloniscus sellowii (Crustacea, Isopoda, Oniscidea): The effect of leaf litter decomposition and its relation to the phenolic and flavonoid content. Zookeys 2012, 24, 231–245. [Google Scholar] [CrossRef] [PubMed]
  2. Progar, R.; Schowalter, T.; Freitag, C.; Morrell, J. Respiration from coarse woody debris as affected by moisture and sapotroph functional diversity in Western Oregon. Oecologia 2000, 124, 426–431. [Google Scholar] [CrossRef] [PubMed]
  3. Hamilton, E.; Frank, D. Can Plants Stimulate Soil Microbes and Their Own Nutrient Supply? Evidence from a Grazing Tolerant Grass. Ecology 2001, 82, 2397–2402. [Google Scholar] [CrossRef]
  4. Nemergut, D.R.; Cleveland, C.C.; Wieder, W.R.; Washenberger, C.L.; Townsend, A.R. Plot-scale manipulations of organic matter inputs to soils correlate with shifts in microbial community composition in a lowland tropical rain forest. Soil Biol. Biochem. 2010, 42, 2153–2160. [Google Scholar] [CrossRef]
  5. Fierer, N.; Bradford, M.A.; Jackson, R.B. Toward an ecological classification of soil bacteria. Ecology 2007, 88, 1354–1364. [Google Scholar] [CrossRef] [PubMed]
  6. Martin, P.; MacLeod, R.A. Observations on the Distinction between Oligotrophic and Eutrophic Marine Bacteria. Appl. Environ. Microb. 1984, 47, 1017–1022. [Google Scholar] [CrossRef] [Green Version]
  7. Smith, S.E.; Read, D.J. Mycorrhizal Symbioses, 2nd ed.; Academic Press: London, UK, 1997. [Google Scholar]
  8. Masny, S. Occurrence of Venturia inaequalis races in Poland able to overcome specific apple scab resistance genes. Eur. J. Plant Pathol. 2016, 147, 313–323. [Google Scholar] [CrossRef] [Green Version]
  9. Islam, S.; Akanda, A.M.; Sultana, F.; Hossain, M.M. Chilli rhizosphere fungus Aspergillus spp. PPA1 promotes vegetative growth of cucumber (Cucumis sativus) plants upon root colonisation. Arch. Phytopathol. Plant Protect. 2013, 47, 1231–1238. [Google Scholar] [CrossRef]
  10. Li, J.; Wu, Z.; Yuan, J. Impact of agro-farming activities on microbial diversity of acidic red soils in a Camellia Oleifera Forest. Rev. Bras. Cienc. Solo 2019, 43, e0190044. [Google Scholar] [CrossRef]
  11. Dennis, P.G.; Miller, A.J.; Hirsch, P.R. Are root exudates more important than other sources of rhizodeposits in structuring rhizosphere bacterial communities? FEMS Microbiol. Ecol. 2010, 72, 313–327. [Google Scholar] [CrossRef] [Green Version]
  12. Marschner, P.; Marino, W.; Lieberei, R. Seasonal effects on microorganisms in the rhizosphere of two tropical plants in a polyculture agroforestry system in Central Amazonia, Brazil. Biol. Fert. Soils 2002, 35, 68–71. [Google Scholar] [CrossRef]
  13. Lynch, J.M. The Rhizosphere; John Wiley & Sons: New York, NY, USA, 2007. [Google Scholar]
  14. Jousset, A.; Scheu, S.; Bonkowski, M. Secondary metabolite production facilitates establishment of rhizobacteria by reducing both protozoan predation and the competitive effects of indigenous bacteria. Funct. Ecol. 2008, 22, 714–719. [Google Scholar] [CrossRef]
  15. Bob, S.; Bakker, A.W.; Bakker, P.A. Interactions of Deleterious and Beneficial Rhizosphere Microorganisms and the Effect of Cropping Practices. Annu. Rev. Phytopathol. 1987, 25, 339–358. [Google Scholar] [CrossRef]
  16. Lugtenberg, B.; Kamilova, F. Plant-Growth-Promoting Rhizobacteria. Annu. Rev. Microbiol. 2009, 63, 541–556. [Google Scholar] [CrossRef] [PubMed] [Green Version]
  17. Van Loon, L.C. Plant responses to plant growth-promoting rhizobacteria. Eur. J. Plant Pathol. 2007, 119, 243–254. [Google Scholar] [CrossRef] [Green Version]
  18. Kremer, R.J. Deleterious Rhizobacteria. In Plant-Associated Bacteria; Gnanamanickam, S.S., Ed.; Springer: Dordrecht, The Netherlands, 2006; pp. 335–361. [Google Scholar]
  19. Zhou, S.; Zhang, M.; Zhang, K.; Yang, X.; He, D.; Yin, J.; Wang, C. Effects of reduced nitrogen and suitable soil moisture on wheat (Triticum aestivum L.) rhizosphere soil microbiological, biochemical properties and yield in the Huanghuai Plain, China. J. Integr. Agric. 2020, 19, 234–250. [Google Scholar] [CrossRef]
  20. Ilyas, N.; Bano, A. Azospirillum strains isolated from roots and rhizosphere soil of wheat (Triticum aestivum L.) grown under different soil moisture conditions. Biol. Fert. Soils 2010, 46, 393–406. [Google Scholar] [CrossRef]
  21. Taketani, R.G.; Lançoni, M.D.; Kavamura, V.N.; Durrer, A.; Andreote, F.D.; Melo, I.S. Dry Season Constrains Bacterial Phylogenetic Diversity in a Semi-Arid Rhizosphere System. Microb. Ecol. 2016, 73, 153–161. [Google Scholar] [CrossRef]
  22. Neumann, G.; Römheld, V. The release of root exudates as affected by the plant physiological status. In The Rhizosphere; CRC Press: New York, NY, USA, 2000; pp. 57–110. [Google Scholar]
  23. López-Gutiérrez, J.C.; Toro, M.; López-Hernández, D. Arbuscular mycorrhiza and enzymatic activities in the rhizosphere of Trachypogon plumosus Ness. in three acid savanna soils. Agric. Ecosyst. Environ. 2004, 103, 405–411. [Google Scholar] [CrossRef]
  24. Yang, Q.; Wang, X.; Shen, Y. Comparison of soil microbial community catabolic diversity between rhizosphere and bulk soil induced by tillage or residue retention. J. Soil Sci. Plant Nutr. 2013, 13, 187–199. [Google Scholar] [CrossRef] [Green Version]
  25. Mestre, M.C.; Rosa, C.A.; Safar, S.V.B.; Libkind, D.; Fontenla, S.B. Yeast communities associated with the bulk-soil, rhizosphere and ectomycorrhizosphere of a Nothofagus pumilio forest in northwestern Patagonia, Argentina. FEMS Microbiol. Ecol. 2011, 78, 531–541. [Google Scholar] [CrossRef] [PubMed]
  26. Hernesmaa, A.; Björklöf, K.; Kiikkilä, O.; Fritze, H.; Haahtela, K.; Romantschuk, M. Structure and function of microbial communities in the rhizosphere of Scots pine after tree-felling. Soil Biol. Biochem. 2005, 37, 777–785. [Google Scholar] [CrossRef]
  27. Bhattacharyya, D.; Duta, S.; Yu, S.-M.; Jeong, S.C.; Lee, Y.H. Taxonomic and Functional Changes of Bacterial Communities in the Rhizosphere of Kimchi Cabbage after Seed Bacterization with Proteus vulgaris JBLS202. Plant Pathol. J. 2018, 34, 286–296. [Google Scholar] [CrossRef] [PubMed]
  28. Yang, G.; Shu, Q.; Duan, L.; Chen, C.; Zheng, H. Resistance of Main Cultivars of Oil Tea to Colletotrichum gloeosporioides. J. Anhui Agric. Univ. 2004, 31, 480–483. [Google Scholar] [CrossRef]
  29. Cook, R.J.; Thomashow, L.S.; Weller, D.M.; Fujimoto, D.; Mazzola, M.; Bangera, G.; Kim, D.S. Molecular Mechanisms of Defense by Rhizobacteria against Root Disease. Proc. Natl. Acad. Sci. USA 1995, 92, 4197–4201. [Google Scholar] [CrossRef] [Green Version]
  30. Zhang, P.; Cui, Z.; Guo, M.; Xi, R. Characteristics of the soil microbial community in the forestland of Camellia oleifera. PeerJ 2020, 8, e9117. [Google Scholar] [CrossRef]
  31. Hartmann, A.; Schmid, M.; Tuinen, D.V.; Berg, G. Plant-driven selection of microbes. Plant Soil 2009, 321, 235–257. [Google Scholar] [CrossRef]
  32. Zhu, J. A Study on the Peroxidase in Camellia Species and Their Resistance to Anthracnoso Causing Fungus. J. Fujian Coll. For. 1990, 10, 368–375. Available online: http://en.cnki.com.cn/Article_en/CJFDTotal-FJLB199004011.htm (accessed on 2 August 2020).
  33. Liu, F.; Zeng, S. Short-term Effects of Prescribed Burning on Soil under Middle Aged Pinus Massoniana Plantation. Chin. J. Soil Sci. 2017, 48, 1025–1031. [Google Scholar] [CrossRef]
  34. Wang, X.; Zabowski, D. Nutrient composition of Douglas-fir rhizosphere and bulk soil solutions. Plant Soil 1998, 200, 13–20. [Google Scholar] [CrossRef]
  35. Bouyoucos, G.J. Evaporating the water with burning alcohol as a rapid means of determining moisture content of soils. Soil Sci. 1937, 44, 377–384. [Google Scholar] [CrossRef]
  36. Bureau, T.S.F. Determination of pH Value in Forest Soil; Standards Press of China: Beijing, China, 1999; Volume LY/T1239-1999. [Google Scholar]
  37. Bureau, T.S.F. Determination of Organic Matter in Forest Soil and Calculation Carbon-Nitrogen Ratio; Standards Press of China: Beijing, China, 1999; Volume LY/T1237-1999. [Google Scholar]
  38. Bureau, T.S.F. Determination of Total Nitrogen in Forest Soil; Standards Press of China: Beijing, China, 1999; Volume LY/T1228-1999. [Google Scholar]
  39. Bureau, T.S.F. Determination of Hydrolyzable Nitrogen in Forest Soil; Standards Press of China: Beijing, China, 1999; Volume LY/T1229-1999. [Google Scholar]
  40. Bureau, T.S.F. Determination of Total Phosphorus in Forest Soil; Standards Press of China: Beijing, China, 1999; Volume LY/T1232-1999. [Google Scholar]
  41. Bureau, T.S.F. Determination of Total Potassium in Forest Soil; Standards Press of China: Beijing, China, 1999; Volume LY/T1234-1999. [Google Scholar]
  42. Sims, J.T. Comparison of Mehlich 1 and Mehlich 3 extractants for P, K, Ca, Mg, Mn, Cu and Zn in Atlantic Coastal Plain soils. Commun. Soil Sci. Plan. 1989, 20, 1707–1726. [Google Scholar] [CrossRef]
  43. Li, C.; Zhao, Q.; Gao, T.; Wang, H.; Zhang, Z.; Liang, B.; Wei, Z.; Liu, C.; Ma, F. The mitigation effects of exogenous melatonin on replant disease in apple. J. Pineal Res. 2018, 65, e12523. [Google Scholar] [CrossRef] [PubMed]
  44. Toju, H.; Tanabe, A.S.; Yamamoto, S.; Sato, H. High-coverage ITS primers for the DNA-based identification of ascomycetes and basidiomycetes in environmental samples. PLoS ONE 2012, 7, e40863. [Google Scholar] [CrossRef] [Green Version]
  45. Chen, S.; Zhou, Y.; Chen, Y.; Gu, J. Fastp: An ultra-fast all-in-one FASTQ preprocessor. Bioinformatics 2018, 34, 884–890. [Google Scholar] [CrossRef]
  46. Magoč, T.; Salzberg, S. FLASH: Fast length adjustment of short reads to improve genome assemblies. Bioinformatics 2011, 27, 2957–2963. [Google Scholar] [CrossRef]
  47. Edgar, R.C. UPARSE: Highly accurate OTU sequences from microbial amplicon reads. Nat. Methods 2013, 10, 996. [Google Scholar] [CrossRef]
  48. Chen, H.; Boutros, P. VennDiagram: A package for the generation of highly-customizable Venn and Euler diagrams in R. BMC Bioinform. 2011, 12, 1–7. [Google Scholar] [CrossRef] [Green Version]
  49. Wickham, H. An Introduction to Ggplot: An Implementation of the Grammar of Graphics in R. Statistics 2006. Available online: http://ftp.auckland.ac.nz/software/CRAN/doc/vignettes/ggplot/introduction.pdf (accessed on 2 August 2020).
  50. Caporaso, J.G.; Kuczynski, J.; Stombaugh, J.; Bittinger, K.; Bushman, F.D.; Costello, E.K.; Fierer, N.; Peña, A.G.; Goodrich, J.K.; Gordon, J.I.; et al. QIIME allows analysis of high-throughput community sequencing data. Nat. Methods 2010, 7, 335–336. [Google Scholar] [CrossRef] [PubMed] [Green Version]
  51. Ondov, B.D.; Bergman, N.H.; Phillippy, A.M. Krona: Interactive Metagenomic Visualization in a Web Browser. In Encyclopedia of Metagenomics: Genes, Genomes and Metagenomes: Basics, Methods, Databases and Tools; Nelson, K.E., Ed.; Springer: Boston, MA, USA, 2015; pp. 339–346. [Google Scholar]
  52. Segata, N.; Izard, J.; Waldron, L.; Gevers, D.; Miropolsky, L.; Garrett, W.S.; Huttenhower, C. Metagenomic biomarker discovery and explanation. Genome Biol. 2011, 12, 1–18. [Google Scholar] [CrossRef] [PubMed] [Green Version]
  53. Roberts, D.W. Labdsv: Ordination and Multivariate Analysis for Ecology; R Package Version 2.0-1; R Foundation: Vienna, Austria, 2016. [Google Scholar]
  54. Aßhauer, K.P.; Wemheuer, B.; Daniel, R.; Meinicke, P. Tax4Fun: Predicting functional profiles from metagenomic 16S rRNA data. Bioinformatics 2015, 31, 2882–2884. [Google Scholar] [CrossRef] [PubMed]
  55. Nguyen, N.H.; Song, Z.; Bates, S.T.; Branco, S.; Tedersoo, L.; Menke, J.; Schilling, J.S.; Kennedy, P.G. FUNGuild: An open annotation tool for parsing fungal community datasets by ecological guild. Fungal Ecol. 2015, 20, 1–8. [Google Scholar] [CrossRef]
  56. Oksanen, J.; Blanchet, F.G.; Friendly, M.; Kindt, R.; Legendre, P.; McGlinn, D.; Minchin, P.R.; O’Hara, R.; Simpson, G.L.; Solymos, P. Vegan: Community Ecology Package; R Package Version 2.3-5; R Foundation: Vienna, Austria, 2016. [Google Scholar]
  57. Omicshare Tools. Available online: https://www.omicshare.com/tools/ (accessed on 3 September 2020).
  58. Liang, X.; Ren, H.; Li, S.; Leng, X.; Yao, X. Soil Bacterial Community Structure and Co-occurrence Pattern during Vegetation Restoration in Karst Rocky Desertification Area. Front. Microbiol. 2017, 8, 1–11. [Google Scholar] [CrossRef] [Green Version]
  59. Onwuka, B.M. Effects of soil temperature on Some Soil properties and plant growth. J. Agric. Sci. Technol. 2016, 6, 89–93. [Google Scholar] [CrossRef]
  60. Wu, C.; Liu, G.; Ma, G.; Liu, Q.; Yu, F.; Huang, C.; Zhao, Z.; Liang, L. Study of the differences in soil properties between the dry season and rainy season in the Mun River Basin. Catena 2019, 182, 104103. [Google Scholar] [CrossRef]
  61. Aon, M.A.; Colaneri, A.C., II. Temporal and spatial evolution of enzymatic activities and physico-chemical properties in an agricultural soil. Appl. Soil. Ecol. 2001, 18, 255–270. [Google Scholar] [CrossRef]
  62. Upton, R.N.; Bach, E.M.; Hofmockel, K.S. Spatio-temporal microbial community dynamics within soil aggregates. Soil Biol. Biochem. 2019, 132, 58–68. [Google Scholar] [CrossRef]
  63. Shi, J.; Yuan, X.; Lin, H.; Yang, Y.; Li, Z. Differences in Soil Properties and Bacterial Communities between the Rhizosphere and Bulk Soil and among Different Production Areas of the Medicinal Plant Fritillaria thunbergii. Int. J. Mol. Sci. 2011, 12, 3770–3785. [Google Scholar] [CrossRef]
  64. Yuan, J. Study on Adaptive Mechanism of Camellia Oleifera to Low-phosphorus Environment; Beijing Forestry University: Beijing, China, 2013. [Google Scholar]
  65. Nouri, E.; Breuillin-Sessoms, F.; Feller, U.; Reinhardt, D. Phosphorus and nitrogen regulate arbuscular mycorrhizal symbiosis in Petunia hybrida. PLoS ONE 2014, 9, e90841. [Google Scholar] [CrossRef]
  66. Breuillin, F.; Schramm, J.; Hajirezaei, M.; Ahkami, A.; Favre, P.; Druege, U.; Hause, B.; Bucher, M.; Kretzschmar, T.; Bossolini, E.; et al. Phosphate systemically inhibits development of arbuscular mycorrhiza in Petunia hybrida and represses genes involved in mycorrhizal functioning. Plant J. 2010, 64, 1002–1017. [Google Scholar] [CrossRef]
  67. Liu, J.; Wu, L.; Chena, D.; Lib, M.; Weib, C. Soil quality assessment of different Camellia oleifera stands in mid-subtropical China. Appl. Soil Ecol. 2017, 113, 29–35. [Google Scholar] [CrossRef]
  68. Liu, J.; Wu, L.; Chen, D.; Yu, Z.; Wei, C. Development of a soil quality index for Camellia oleifera forestland yield under three different parent materials in Southern China. Soil Till. Res. 2018, 176, 45–50. [Google Scholar] [CrossRef]
  69. Gu, S.; Hu, Q.; Cheng, Y.; Bai, L.; Liu, Z.; Xiao, W.; Gong, Z.; Wu, Y.; Feng, K.; Deng, Y.; et al. Application of organic fertilizer improves microbial community diversity and alters microbial network structure in tea (Camellia sinensis) plantation soils. Soil Till. Res. 2019, 195, 104356. [Google Scholar] [CrossRef]
  70. Liu, J.; Yu, S.; You, L.; Lian, L.-N.; Wang, H.; Zeng, J.; Cheng, L.; Qin, J.; Liu, X.; Hu, D. Response of Fine Root Growth of Camellia oleifera to Potassium Application Level. For. Res. 2019, 32, 31–38. [Google Scholar] [CrossRef]
  71. Yuan, J. Studies on Nutrition Diagnosis and Fertilization in Camellia Oleifera; Central South University of Forestry and Technology: Changsha, China, 2010. [Google Scholar]
  72. Janssen, P.H. Chthoniobacter. In Bergey’s Manual of Systematics of Archaea and Bacteria; John Wiley & Sons Inc., in association with Bergey’s Manual Trust: New York, NY, USA, 2015. [Google Scholar] [CrossRef]
  73. Board, T.E. Rhodanobacter. In Bergey’s Manual of Systematics of Archaea and Bacteria; John Wiley & Sons, Inc., in association with Bergey’s Manual Trust: New York, NY, USA, 2015. [Google Scholar] [CrossRef]
  74. Kim, S.-J.; Ahn, J.-H.; Lee, T.-H.; Weon, H.-Y.; Hong, S.-B.; Seok, S.-J.; Whang, K.-S.; Kwon, S.-W. Reyranella soli sp. nov., isolated from forest soil, and emended description of the genus Reyranella Pagnier et al. 2011. Int. J. Syst. Evol. Microbiol. 2013, 63, 3164–3167. [Google Scholar] [CrossRef] [PubMed] [Green Version]
  75. Lee, J.-C.; Whang, K.-S. Reyranella graminifolii sp. nov., isolated from bamboo (Phyllostachys bambusoides) litter. Int. J. Syst. Evol. Microbiol. 2014, 64, 2503–2507. [Google Scholar] [CrossRef]
  76. Albuquerque, L.; Rainey, F.A.; Costa, M.S.D. Aquicella. In Bergey’s Manual of Systematics of Archaea and Bacteria; John Wiley & Sons, Inc., in Association with Bergey’s Manual Trust: New York, NY, USA, 2018. [Google Scholar] [CrossRef]
  77. Dedysh, S.N. Granulicella. In Bergey’s Manual of Systematics of Archaea and Bacteria; Trujillo, M.E., Dedysh, S., DeVos, P., Hedlund, B., Kämpfer, P., Rainey, F.A., Whitman, W.B., Eds.; John Wiley & Sons, Inc., in Association with Bergey’s Manual Trust: New York, NY, USA, 2017. [Google Scholar] [CrossRef]
  78. Fuerst, J.A.; Lee, K.; Butler, M.K. Gemmata. In Bergey’s Manual of Systematics of Archaea and Bacteria; John Wiley & Sons, Inc., in Association with Bergey’s Manual Trust: New York, NY, USA, 2015. [Google Scholar] [CrossRef]
  79. Huo, Y.; Jong-Pyo, K.; Park, J.K.; Li, J.; Chen, L.; Yang, D.-C. Rhodanobacter ginsengiterrae sp. nov., an antagonistic bacterium against root rot fungal pathogen Fusarium solani, isolated from ginseng rhizospheric soil. Arch. Microbiol. 2018, 200, 1457–1463. [Google Scholar] [CrossRef]
  80. Green, S.; Prakash, O.; Jasrotia, P.; Overholt, W.; Cardenas, E.; Hubbard, D.; Tiedje, J.M.; Watson, D.B.; Schadt, C.W.; Brooks, S.C.; et al. Denitrifying Bacteria from the Genus Rhodanobacter Dominate Bacterial Communities in the Highly Contaminated Subsurface of a Nuclear Legacy Waste Site. Appl. Environ. Microb. 2012, 78, 1039–1047. [Google Scholar] [CrossRef] [Green Version]
  81. Prakash, O.; Green, S.; Jasrotia, P.; Overholt, W.; Canion, A.; Watson, D.B.; Brooks, S.C.; Kostka, J.E. Rhodanobacter denitrificans sp. nov., isolated from nitrate-rich zones of a contaminated aquifer. Int. J. Syst. Evol. Micr. 2012, 62, 2457–2462. [Google Scholar] [CrossRef] [Green Version]
  82. Li, R.; Zheng, J.; Ni, B.; Chen, K.; Jiang, J. Biodegradation of Pentachloronitrobenzene by Labrys portucalensis pcnb-21 Isolated from Polluted Soil. Pedosphere 2011, 21, 31–36. [Google Scholar] [CrossRef]
  83. Moreira, I.S.; Amorim, C.L.; Carvalho, M.D.F.; Castro, P.M.L. Co-metabolic degradation of chlorobenzene by the fluorobenzene degrading wild strain Labrys portucalensis. Int. Biodeter. Biodegr. 2012, 72, 76–81. [Google Scholar] [CrossRef]
  84. White, D.C.; Sutton, S.D.; Ringelberg, D.B. The genus Sphingomonas: Physiology and ecology. Curr. Opin. Biotechnol. 1996, 7, 301–306. [Google Scholar] [CrossRef]
  85. Berg, G.; Ballin, G. Bacterial Antagonists to Verticillium dahliae Kleb. J. Phytopathol. 1994, 141, 99–110. [Google Scholar] [CrossRef]
  86. Takeuchi, M.; Sawada, H.; Oyaizu, H.; Yokota, A. Phylogenetic Evidence for Sphingomonas and Rhizomonas as Nonphotosynthetic Members of the Alpha-4 Subclass of the Proteobacteria. Int. J. Syst. Bacteriol. 1994, 44, 308–314. [Google Scholar] [CrossRef]
  87. Schmidt, S.; Wittich, R.-M.; Erdmann, D.; Wilkes, H.; Wittko, F.; Fortnagel, P. Biodegradation of diphenyl ether and its monohalogenated derivatives by Sphingomonas sp. strain SS3. Appl. Environ. Microb. 1992, 58, 2744–2750. [Google Scholar] [CrossRef] [Green Version]
  88. Vinale, F.; Sivasithamparam, K.; Ghisalberti, E.L.; Marra, R.; Woo, S.L.; Lorito, M. Trichoderma–plant–pathogen interactions. Soil Biol. Biochem. 2008, 40, 1–10. [Google Scholar] [CrossRef]
  89. Mukherjee, M.; Mukherjee, P.K.; Horwitz, B.; Zachow, C.; Berg, G.; Zeilinger, S. Trichoderma–Plant–Pathogen Interactions: Advances in Genetics of Biological Control. Indian J. Microbiol. 2012, 52, 522–529. [Google Scholar] [CrossRef] [Green Version]
  90. Domsch, K.H.; Gams, W.; Anderson, T.-H. Compendium of Soil Fungi; Academic Press: London, UK, 1980. [Google Scholar]
  91. Sakuradani, E.; Kobayashi, M.; Ashikari, T.; Shimizu, S. Identification of Δ12-fatty acid desaturase from arachidonic acid-producing Mortierella fungus by heterologous expression in the yeast Saccharomyces cerevisiae and the fungus Aspergillus oryzae. Eur. J. Biochem. 1999, 261, 812–820. [Google Scholar] [CrossRef]
  92. Higashiyama, K.; Fujikawa, S.; Park, E.Y.; Shimizu, S. Production of arachidonic acid by Mortierella fungi. Biotechnol. Bioproc. Eng. 2002, 7, 252–262. [Google Scholar] [CrossRef]
  93. Eroshin, V.K.; Dedyukhina, E.G. Effect of lipids from Mortierella hygrophilaon plant resistance to phytopathogens. World J. Microb. Biot. 2002, 18, 165–167. [Google Scholar] [CrossRef]
  94. Brodeur, J. Host specificity in biological control: Insights from from opportunistic pathogens. Evol. Appl. 2012, 5, 470–480. [Google Scholar] [CrossRef] [PubMed]
  95. Goettel, M.S.; Koike, M.; Kim, J.J.; Aiuchi, D.; Shinya, R.; Brodeur, J. Potential of Lecanicillium spp. for management of insects, nematodes and plant diseases. J. Invertebr. Pathol. 2008, 98, 256–261. [Google Scholar] [CrossRef] [PubMed]
  96. Gan, Z.; Yang, J.; Tao, N.; Liang, L.; Mi, Q. Cloning of the gene Lecanicillium psalliotae chitinase Lpchi1 and identification of its potential role in the biocontrol of root-knot nematode Meloidogyne incognita. Appl. Microbiol. Biot. 2007, 76, 1309–1317. [Google Scholar] [CrossRef] [PubMed]
  97. Qiu, S. Oil tea root-knot nematodes (Meloidogyne Spp.) and indentification of their pathogens. J. Cent. South For. Univ. 1986, 6, 163–168. [Google Scholar] [CrossRef]
Figure 1. Relative abundance of bacteria (A) and fungi (B) at the phylum level. AR, BR, CR, and DR indicates rhizosphere soil sample in spring, summer, autumn, and winter, respectively. AN, BN, CN, and DN indicates non-rhizosphere soil sample in spring, summer, autumn, and winter, respectively. n = 3.
Microorganisms 08 01385 g001
Figure 2. Venn diagram of bacterial (A1A6) and fungal (B1B6) Operational taxonomic units (OTUs). AR, BR, CR, and DR indicates rhizosphere soil sample in spring, summer, autumn, and winter, respectively. AN, BN, CN, and DN indicates non-rhizosphere soil sample in spring, summer, autumn, and winter, respectively. Overlaps and non-overlaps indicate shared and exclusive OTUs under different samples, respectively. n = 3.
Microorganisms 08 01385 g002
Figure 3. Principal Co-ordinary Analysis (PCoA) of bacterial (A) and fungal (B) community based on unweighted unifrac distance. AR, BR, CR, and DR indicates rhizosphere soil sample in spring, summer, autumn, and winter, respectively. AN, BN, CN, and DN indicates non-rhizosphere soil sample in spring, summer, autumn, and winter, respectively. Values of R2 and P were calculated using Permutational MANOVA (Permanova). n = 3.
Microorganisms 08 01385 g003
Figure 4. Bacterial (A) and fungal (B) biomarkers of the rhizosphere (R) and non-rhizosphere (N) samples at the genus level based on indicator analysis. The size of the cycle indicates the indicator value of each genus. n = 3.
Microorganisms 08 01385 g004
Figure 5. The difference Kyoto Encyclopedia of Genes and Genomes (KEGG) map of bacteria between rhizosphere (R) and non-rhizosphere (NR) based on Welch’s t-test. n = 3.
Microorganisms 08 01385 g005
Figure 6. Distributed stack diagram (A) of fungal functional group (Guild), box figure of different fungal functional group (Guild) based on Wilcoxon rank-sum test (B), and the heatmap of fungal functional trophic mode (C). R and NR indicated the rhizosphere and non-rhizosphere, respectively. F1, F2, F3, F4, and F5 indicated Fungal Parasite-Undefined Saprotroph, Ectomycorrhizal-Undefined Saprotroph, Endophyte-Litter Saprotroph-Soil Saprotroph-Undefined Saprotroph, Endophyte-Litter Saprotroph-Wood Saprotroph, and Ectomycorrhizal-Fungal Parasite-Soil Saprotroph-Undefined Saprotroph. * and ** over the box indicated a significant difference at 0.05 and 0.01 level, respectively. The black line and hollow cycle in the box indicated the median and mean (n = 3) abundance of Guild, respectively. The solid rhombus beyond the box indicated the discrete data. The top and down line of box indicated 25% and 75% of Guild. The top and down line beyond the box indicated 10% and 90% of Guild.
Microorganisms 08 01385 g006
Table 1. Alpha diversity (Sobs, Shannon, and Chao 1 index) of bacteria and fungi.
KingdomSampleSobsChao 1Shannon
BacteriaAR1780 ± 390 a2218.8 ± 434.27 a8.12 ± 0.1 a
BR1392 ± 395 a1757.83 ± 330.26 abc7.31 ± 0.74 ab
CR1727 ± 116 a2165.43 ± 222.65 ab7.72 ± 0.44 ab
DR1271 ± 398 a1540.55 ± 410.06 c7.97 ± 0.24 a
AN1422 ± 159 a1857.35 ± 83.64 abc7.69 ± 0.42 ab
BN1641 ± 314 a1973.68 ± 340.82 abc7.62 ± 0.82 ab
CN1265 ± 324 a1672.15 ± 199.73 bc7.6 ± 1.05 ab
DN609 ± 99 b882.488 ± 105.93 d6.64 ± 0.74 b
FungusAR497 ± 113 ab683.65 ± 67.99 ab4.34 ± 1.41 bc
BR609 ± 109 a803.52 ± 94.73 a5.81 ± 0.45 ab
CR423 ± 84 abc597.05 ± 54.6 abc3.24 ± 2.31 c
DR417 ± 25 abc584.27 ± 22.39 abcd5.29 ± 0.17 abc
AN389 ± 80 abc538.32 ± 114.33 bcd5.08 ± 0.1 bc
BN620 ± 133 a759.81 ± 154.94 ab6.36 ± 0.05 a
CN213 ± 32 c315.57 ± 26.62 d3.85 ± 1.56 bc
DN299 ± 21 bc451.79 ± 6.08 cd3.16 ± 0.27 c
AR, BR, CR, and DR indicates rhizosphere soil sample in spring, summer, autumn, and winter, respectively. AN, BN, CN, and DN indicates non-rhizosphere soil sample in spring, summer, autumn, and winter, respectively. Numbers before and behind “±” are mean value (n = 3) and SE, respectively. Lowercases behind numbers indicate a significant difference.
Table 2. Correlations between bacterial alpha-diversity and environmental factors based on Pearson correlation coefficients with the two-tail test.
Environmental FactorsRhizosphereNon-Rhizosphere
SobsChao 1ShannonSobsChao 1Shannon
AP0.0680.098−0.1500.3880.4520.260
TP−0.130−0.1970.1190.4370.3510.211
AK0.0690.1050.5120.5320.5210.281
TK0.2520.1400.303−0.198−0.1870.017
AMN0.2730.2520.276−0.436−0.492−0.180
NN−0.161−0.159−0.099−0.788 **−0.822 **−0.379
AHN−0.471−0.485−0.296−0.229−0.169−0.258
TN−0.117−0.018−0.1710.5400.617 *0.357
TOC−0.097−0.0410.2200.1630.168−0.054
pH0.2670.3150.1180.2700.2820.471
SWC0.3600.4570.356−0.556−0.491−0.358
Tem−0.121−0.1660.1370.849 **0.866 **0.491
C/N−0.110−0.1260.272−0.336−0.402−0.372
C/P−0.0960.017−0.015−0.148−0.073−0.237
N/P−0.089−0.013−0.2300.3470.4540.282
“*” and “**” indicate the significant correlations at 0.05 and 0.01 level, respectively. AP, available phosphorous; TP, total phosphorous; AK, available potassium; TK, total potassium; AMN, ammonium nitrogen; NN, nitrate nitrogen; AHN, alkaline hydrolyzable nitrogen; TN, total nitrogen; TOC, total organic carbon; SWC, soil water content; Tem, soil monthly mean temperature; C/N, ratio of total carbon to total nitrogen; C/P, ratio of total carbon to total phosphorous; N/P, ration of total nitrogen to total phosphorous. n = 12.
Table 3. Correlations between environmental factors and fungal alpha-diversity based on Pearson correlation coefficients with the two-tail test at 0.05 (*) and 0.01 (**) level.
Environmental FactorsRhizosphereNot-Rhizosphere
SobsChao 1ShannonSobsChao 1Shannon
AP0.2100.273−0.0060.2550.2770.414
TP0.760 **0.758 **0.1450.660 *0.586 *0.582 *
AK0.1830.2390.0570.4750.4710.464
TK−0.551−0.703 *−0.181−0.514−0.563−0.510
AMN−0.432−0.555−0.391−0.507−0.561−0.543
NN−0.521−0.620 *0.099−0.479−0.387−0.696 *
AHN−0.411−0.4400.219−0.411−0.412−0.259
TN−0.229−0.122−0.0410.1970.2660.289
TOC−0.339−0.2530.1630.3890.4340.226
pH0.3110.3480.000−0.071−0.0910.003
SWC−0.419−0.432−0.242−0.683 *−0.603 *−0.776 **
Tem0.5500.654 *−0.0120.5410.4480.738 **
C/N−0.296−0.2340.1870.2050.200−0.056
C/P−0.550−0.4920.010−0.0250.099−0.198
N/P−0.637 *−0.601 *−0.123−0.108−0.0270.023
“*” and “**” indicate the significant correlations at 0.05 and 0.01 level, respectively. AP, available phosphorous; TP, total phosphorous; AK, available potassium; TK, total potassium; AMN, ammonium nitrogen; NN, nitrate nitrogen; AHN, alkaline hydrolyzable nitrogen; TN, total nitrogen; TOC, total organic carbon; SWC, soil water content; Tem, soil monthly mean temperature; C/N, ratio of total carbon to total nitrogen; C/P, ratio of total carbon to total phosphorous; N/P, ration of total nitrogen to total phosphorous. n = 12.

