Article

Population Genetics of Phlebotomus papatasi from Endemic and Nonendemic Areas for Zoonotic Cutaneous Leishmaniasis in Morocco, as Revealed by Cytochrome Oxidase Gene Subunit I Sequencing

1
Laboratory of Biotechnology and Valorisation of Plant Genetic Resources, Faculty of Sciences and Techniques, University of Sultan Moulay Slimane, Béni Mellal B. P 523, Morocco
2
IRD, Université de Montpellier, MIVEGEC, 34000 Montpellier, France
3
Sidi Mohamed Ben Abdellah University, Fes 30000, Morocco
4
Department of Biological Sciences, Al-Quds University, Jerusalem P.O. BOX 51000, Palestine
5
IRD, Université de Montpellier, InterTryp, 34 000 Montpellier, France
*
Authors to whom correspondence should be addressed.
Microorganisms 2020, 8(7), 1010; https://doi.org/10.3390/microorganisms8071010
Submission received: 4 May 2020 / Revised: 30 June 2020 / Accepted: 2 July 2020 / Published: 6 July 2020
(This article belongs to the Special Issue Epidemiology of Vector-Borne Diseases)

Abstract

:
Zoonotic cutaneous leishmaniasis (ZCL) caused by Leishmania major Yakimoff & Shokhor and transmitted by Phlebotomus papatasi (Scopoli) is a public health concern in Morocco. The disease is endemic mainly in pre-Saharan regions on the southern slope of the High Atlas Mountains. The northern slope of the High Atlas Mountains and the arid plains of central Morocco remain non-endemic and are currently considered high risk for ZCL. Here we investigate and compare the population genetic structure of P. papatasi populations sampled in various habitats in historical foci and non-endemic ZCL areas. A fragment of the mtDNA cytochrome oxidase I (COI) gene was amplified and sequenced in 59 individuals from 10 P. papatasi populations. Haplotype diversity was probed, a median-joining network was generated (FST) and molecular variance (AMOVA) were analyzed. Overall, we identified 28 haplotypes with 32 distinct segregating sites, of which seven are parsimony informative. The rate of private haplotypes was high; 20 haplotypes (71.4%) are private ones and exclusive to a single population. The phylogenetic tree and the network reconstructed highlight a genetic structuration of these populations in two well defined groups: Ouarzazate (or endemic areas) and Non-Ouarzazate (or nonendemic areas). These groups are separated by the High Atlas Mountains. Overall, our study highlights differences in terms of population genetics between ZCL endemic and non-endemic areas. To what extent such differences would impact the transmission of L. major by natural P. papatasi population remains to be investigated.

1. Introduction

The Leishmaniases are a group of parasitic diseases caused by various species of protozoa belonging to the genus Leishmania (Trypanosomatida, Kinetoplastidae) and transmitted by several species of phlebotomine sand fly vectors (Diptera, Psychodidae) [1,2,3]. Phlebotomus papatasi (Scopoli, 1786) is the proven vector of L. major Yakimoff & Shokhor 1914, which causes zoonotic cutaneous leishmaniasis (ZCL) in North Africa and other geographic areas, with rodents acting as reservoir hosts [4,5]. In Morocco, L. major zymodeme MON 25 is transmitted by P. papatasi [6,7], and Meriones shawi grandis is the reservoir host [8]. The first registered historical outbreak of ZCL was in the 1970s throughout the south of the High Atlas Mountains, from Ouarzazate to Errachidia (Figure 1). Data from the health ministry [9] pinpoint that ZCL is increasing but still remains mainly subordinated to the pre-Saharan zone on the southern slope of the High Atlas Mountains, despite the presence of the proven vector and reservoir for L. major as well as favorable eco-climatic conditions. These areas should therefore be classified as at high risk for ZCL [10,11].
Phlebotomus papatasi present a wide geographical distribution [12] and adapt to diverse habitats including highly disturbed ones [13,14,15,16]. Strikingly, the distribution of P. papatasi exceeds that of L. major and its reservoir hosts, extending to southern Europe and the eastern regions of the Indian subcontinent, where it is often abundant in domestic and peri-domestic biotopes far from rodent colonies [4,17]. It is hypothesized that two cryptic populations are involved in the transmission of L. major between rodents and from rodents to humans [17]. The underlying population structure and genetic variability within and among geographically distant populations may influence vectoral capacity, thus having epidemiological implications warranting assessment of control strategies to prevent transmission of CL. Overall population genetics analysis with cytochrome b mtDNA sequences showed that Phlebotomus papatasi populations are relatively homogeneous [18] despite pockets of genetic variation [19,20,21,22,23]. Such molecular homogeneity in diverse geographical populations of P. papatasi is also demonstrated with another molecular marker, the second internal transcribed spacer ribosomal DNA (rDNA ITS2) [24]. Microsatellite markers applied to P. papatasi populations from the North African and the Mediterranean subregions have provided evidence for genetic differentiation [25,26] and have also revealed genetic differentiation in Sudanese P. papatasi populations at a microgeographic scale [27].
In Morocco, P. papatasi are one of the most frequently trapped sandfly species [12,28,29,30]; they express a preference for arid and perarid bioclimates [29] and their distribution is limited by elevation [31]. High densities of P. papatasi are recorded in urban areas and in unhealthy suburbs of large cities such as Marrakech and Agadir, particularly in wild dumps and areas of sewage application, far away from human dwellings [16]. Phenotypic variations or “abnormalities” in the male genitalia of P. papatasi are frequently recorded, with symmetrical anomalies being observed in the lateral lobes, along with abnormal styles, which correlate with environmental human-caused disturbances [15]. Here, using the cytochrome c oxidase I gene as a molecular marker, we investigated the genetic structure of wild P. papatasi populations sampled in endemic and non-endemic areas for ZCL in Morocco.

2. Materials and Methods

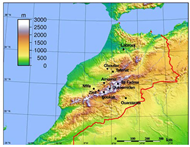
2.1. Origins and Sampling of Sand Flies

Sand fly specimens were collected between April and November from 2006 to 2008. They were captured using CDC-miniature light traps placed in houses and sticky traps (castor oil papers) placed in intra-domestic, peri-domestic, and sylvatic habitats (Table 1). Collected sand flies were stored in 96% ethanol. Sampling was performed in two geographic areas (Figure 1). The first one corresponded to the historical focus of ZCL due to L. major in Ouarzazate, southern Morocco. The second one, in central and southwestern Morocco, is a non-endemic area for L. major. The two areas are separated by the High Atlas Mountains (Figure 1).

2.2. Morphological Identification

The head and the abdominal Terminalia of each specimen were dissected with sterilized microneedles and mounted on a slide in Canada balsam [32]. Morphological identification at the species level was performed by the examination of the external genitalia and pharyngeal armatures for males. The rest of the body was used for DNA extraction.

2.3. DNA Extraction, Cytochrome Oxidase Subunit I (COI) Amplification, and DNA Sequencing

Total DNA was extracted using the QIAmp kit (Qiagen, Manchester, England), according to the manufacturer’s protocol.
Polymerase chain reaction (PCR) was performed in a total volume of 50 µL. The primers LepF (5′-ATTCAACCAATCATAAAGATATTGG-3′) and LepR (5′-TAAACTTCTGGATGTCCAAAAAATCA-3′) were used to amplify a 681 bp fragment of the COI gene [33]. Each amplification reaction contained 4 µL of DNA, each primer at 0.5 µM final concentration, 0.2 mM dNTPs and 0.02 U of Phusion DNA Polymerase (Finnzyme). Amplification was performed according to the following cycling conditions: an initial denaturation step at 98 °C for 45 s; followed by 35 cycles at 98 °C for 10 s, 57 °C for 30 s and 72 °C for 30 s; and a final extension at 72 °C for 7 min. The PCR products were directly sequenced in both directions using the primers used for DNA amplification.

2.4. Data Analysis

Sequences (681 bp) were manually edited and aligned with the online service Multalin [34] (http://ribosome.toulouse.inra.fr/multalin/multalin) using the cytochrome c oxidase I gene as a molecular marker. Gaps were treated as missing data. Sequence analysis and Kimura’s two-parameter genetic distance calculation were performed using MEGA v. 4.0 [35,36]. The estimation of nucleotide diversity between and within populations using the Φ [37,38] and π statistics [39] was performed with ARLEQUIN v. 3.0 [40]. ARLEQUIN v. 3.0 was also used for calculating Tajima’s D and Fu’s Fs, and molecular analysis of variance (AMOVA) was used to determine the genetic structure of populations and their differentiation (FST) [39]. Significance was tested by performing 1000 permutations. Fst values > 0.25 indicate strong genetic differentiation. The median-joining algorithm, implemented in the software package NETWORK v. 3.1 [41,42], was used to construct a median-joining network. Phylogenetic analysis was carried out using maximum likelihood analysis, using the default settings of the online phylogeny website (https://www.phylogeny.fr/) [43]. Alignments were done on the 654 bp of P. papatasi COI gene sequences from Morocco, or from Spain (LC090048.1), Serbia (KY848828.1), Turkey (MH780862.1), Cyprus (MF968974.1), and of P. ariasi (KJ1481169.1), P. sergenti (KC755398.1), or P. perniciosus (KJ1481136.1).

3. Results

3.1. Sequence Analysis

The PCR amplification of the 3′ end of the mitochondrial COI gene produced a band of approximately 700 bp in a 1% agarose gel. The 681 bp sequences were manually trimmed, resulting in good quality sequences with a length of 654 bp. Sequence alignment of the 654 bp COI sequences did not identify any nucleotide insertion/deletions (indels), and sequences can be fully translated with the Drosophila mitochondrial code. Seven parsimony-informative sites were recorded in more than one haplotype. All sequences are available in GenBank under accession numbers MT074053-054, MT075056-57, MT075059-61, MT075064-75, MT075057, and MT075078-85. Sequence analysis delineated the presence of 28 haplotypes with 32 distinct segregating sites (Table 2). A relatively low abundance of GC and an excess of AT (59.98%) is recorded. Twenty-nine substitutions are identified, including 17 A→G transitions and 12 T→C transversions; transitions outnumbered transversions. The average haplotype diversity (0.9381 +/− S.D = 0.0403) and nucleotide diversity (θS = 5.41756 +/− 0.59318; θπ = 4.86013 +/− 0.20454; π = 486,013 +/− 0.20454) are high. Finally, Tajima’s D and Fu’s Fs neutrality values are negative and significant in all sampled populations. These pinpoint probable episodes of population expansion (mean Tajima’s D = −0.36383, p = 0.39850; mean Fu’s Fs = −3.57473, p = 0.18700). See Supplementary Materials for more information on statistics (Table S1).

3.2. Haplotype Diversity and Distribution

The 28 haplotypes recorded within the 59 P. papatasi samples are presented in Table 2. Haplotype H8 is the most frequently recorded. It is present in seven populations from non-endemic areas. Other haplotypes are less frequent; H1 and H25 are present in three populations, and H14 is recorded in only two populations (Table 3). The haplotype H25 is the only shared haplotype between P. papatasi sampled in endemic and non-endemic areas. The other 24 of the 28 identified haplotypes (85.7%) are private ones. Thirty private haplotypes (H10–H13, H15, H17–H19, H22–H24, H26–H27) are associated with Ouarzazate, five (H2–H4, H7, H21) with Nfifa, one (H9) with Labrouj, and one with Taferiat (H5). The rate of private haplotypes is high in populations from the ZCL-endemic areas of Ouarzazate. Here, 13 of the 15 identified haplotypes (86.6%) are unique. In non-endemic areas, the corresponding rate is only of 42.8% (6 out of 14 haplotypes).

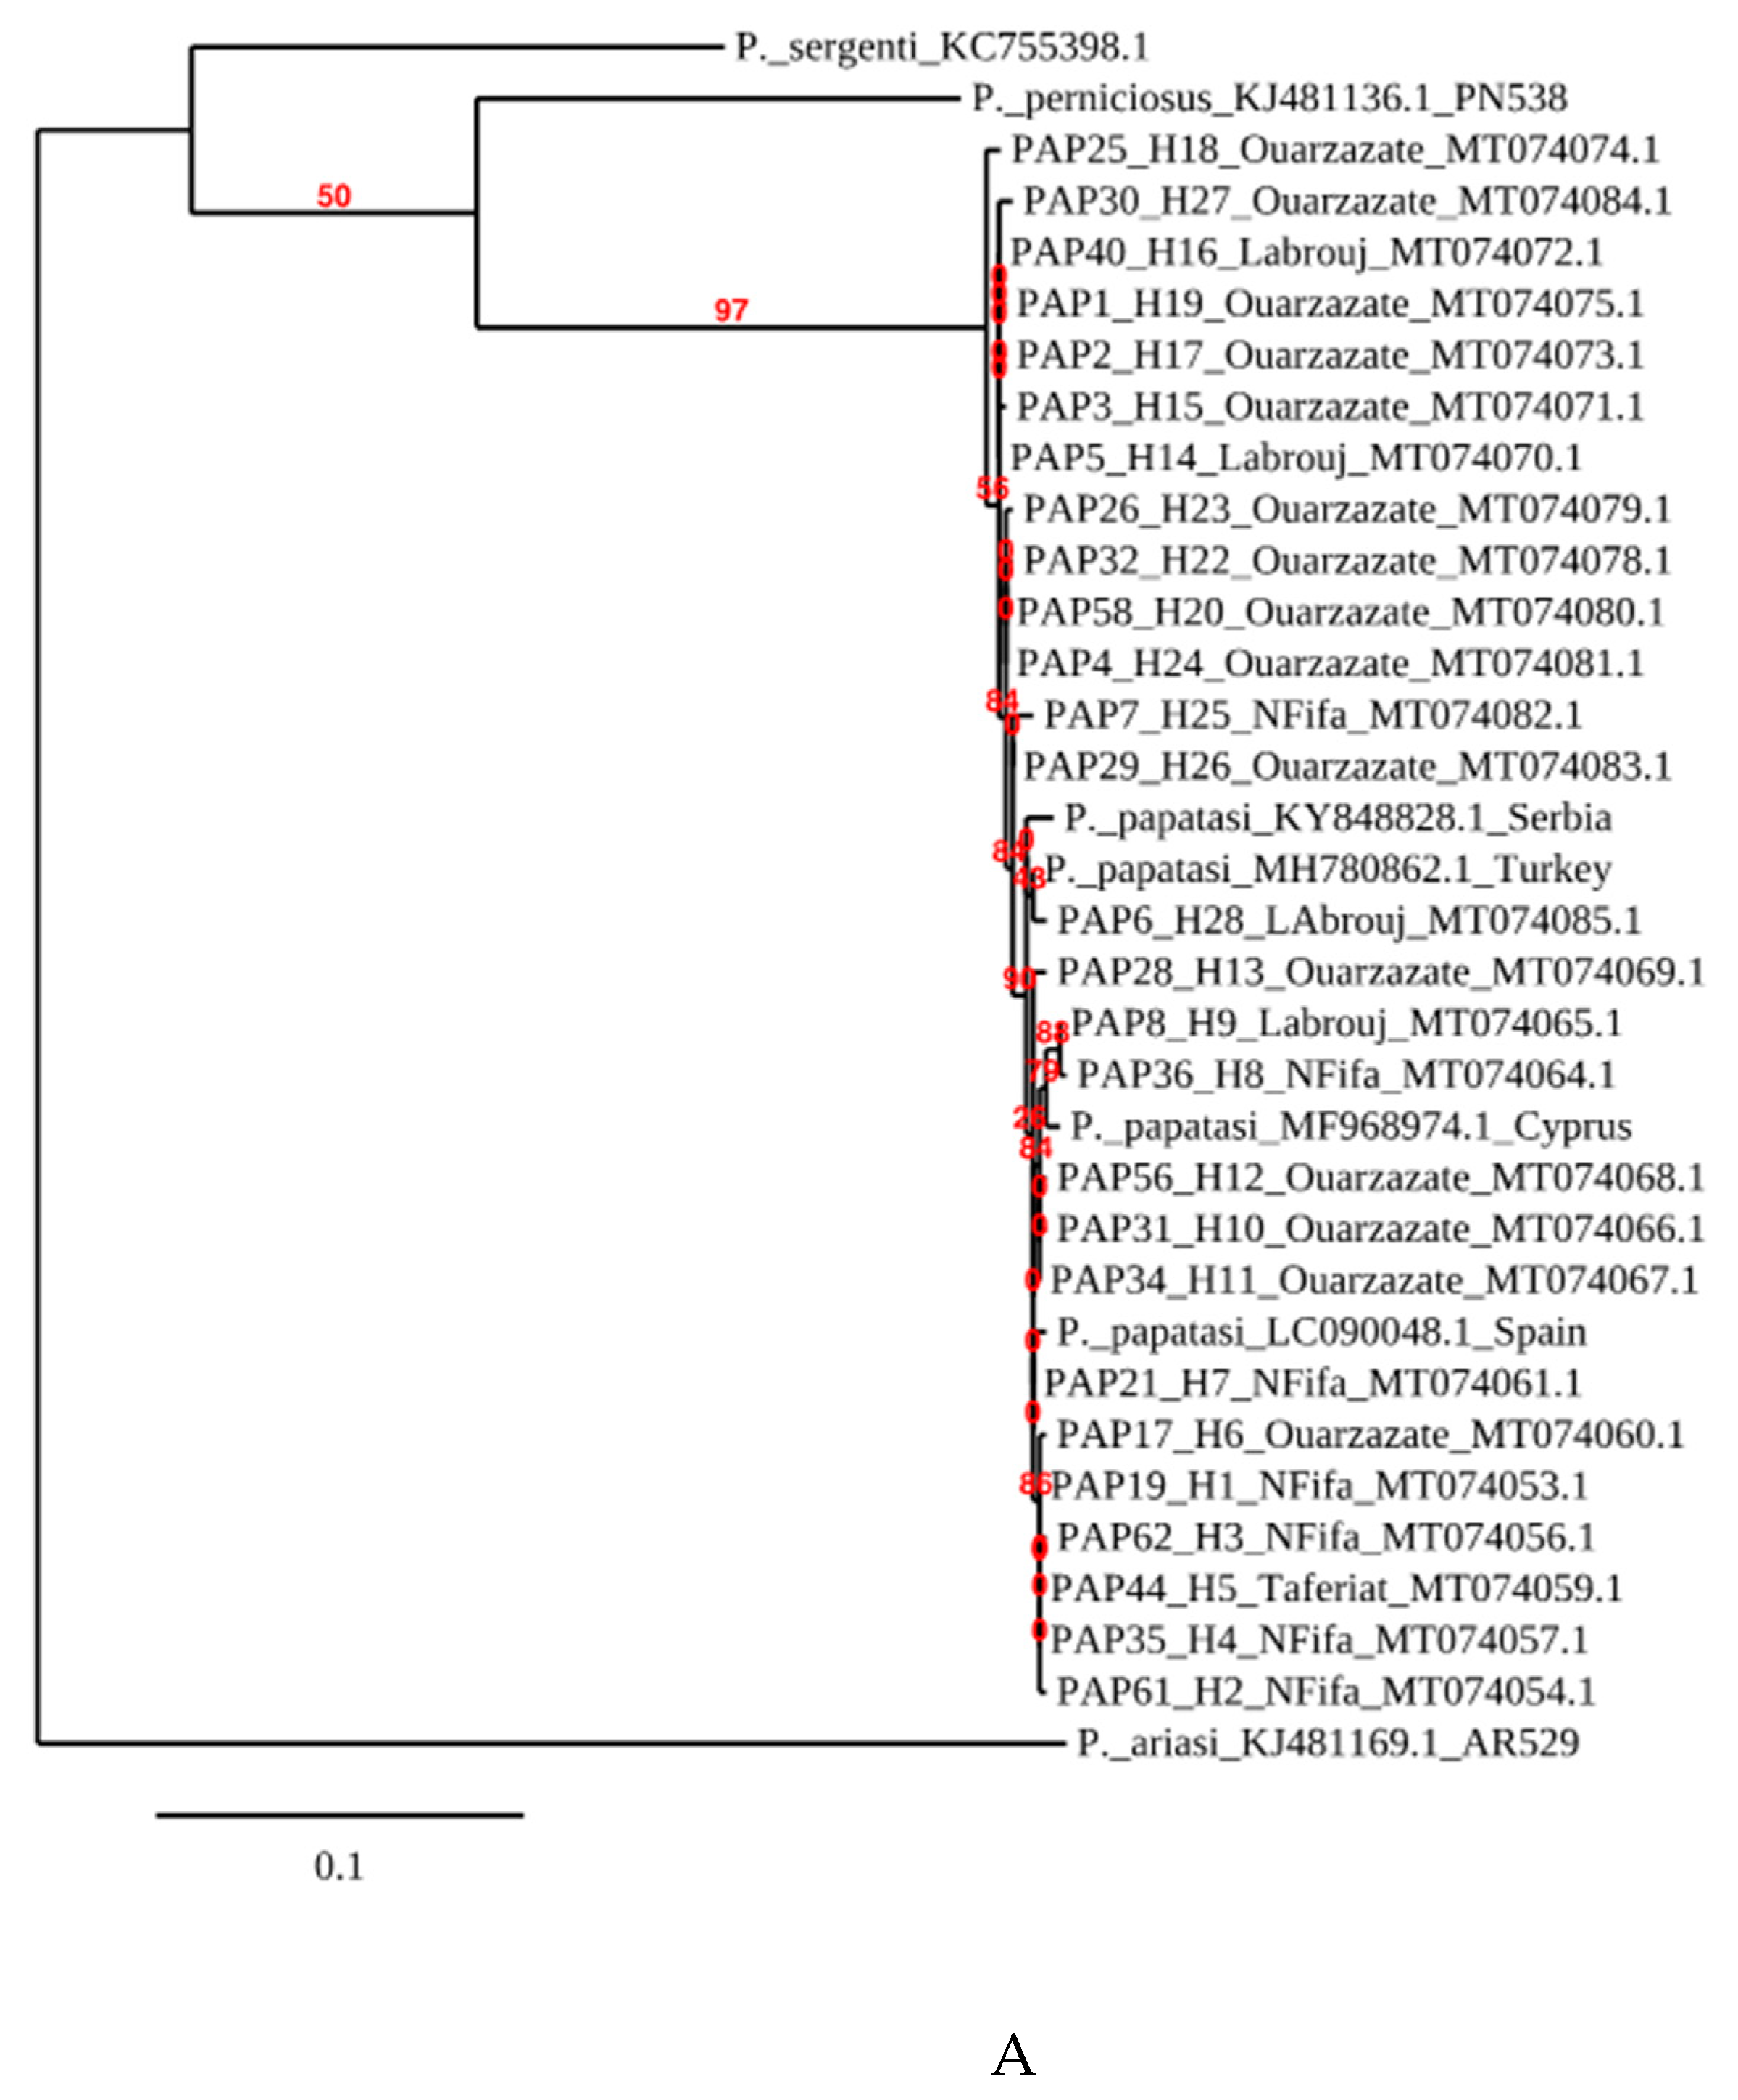
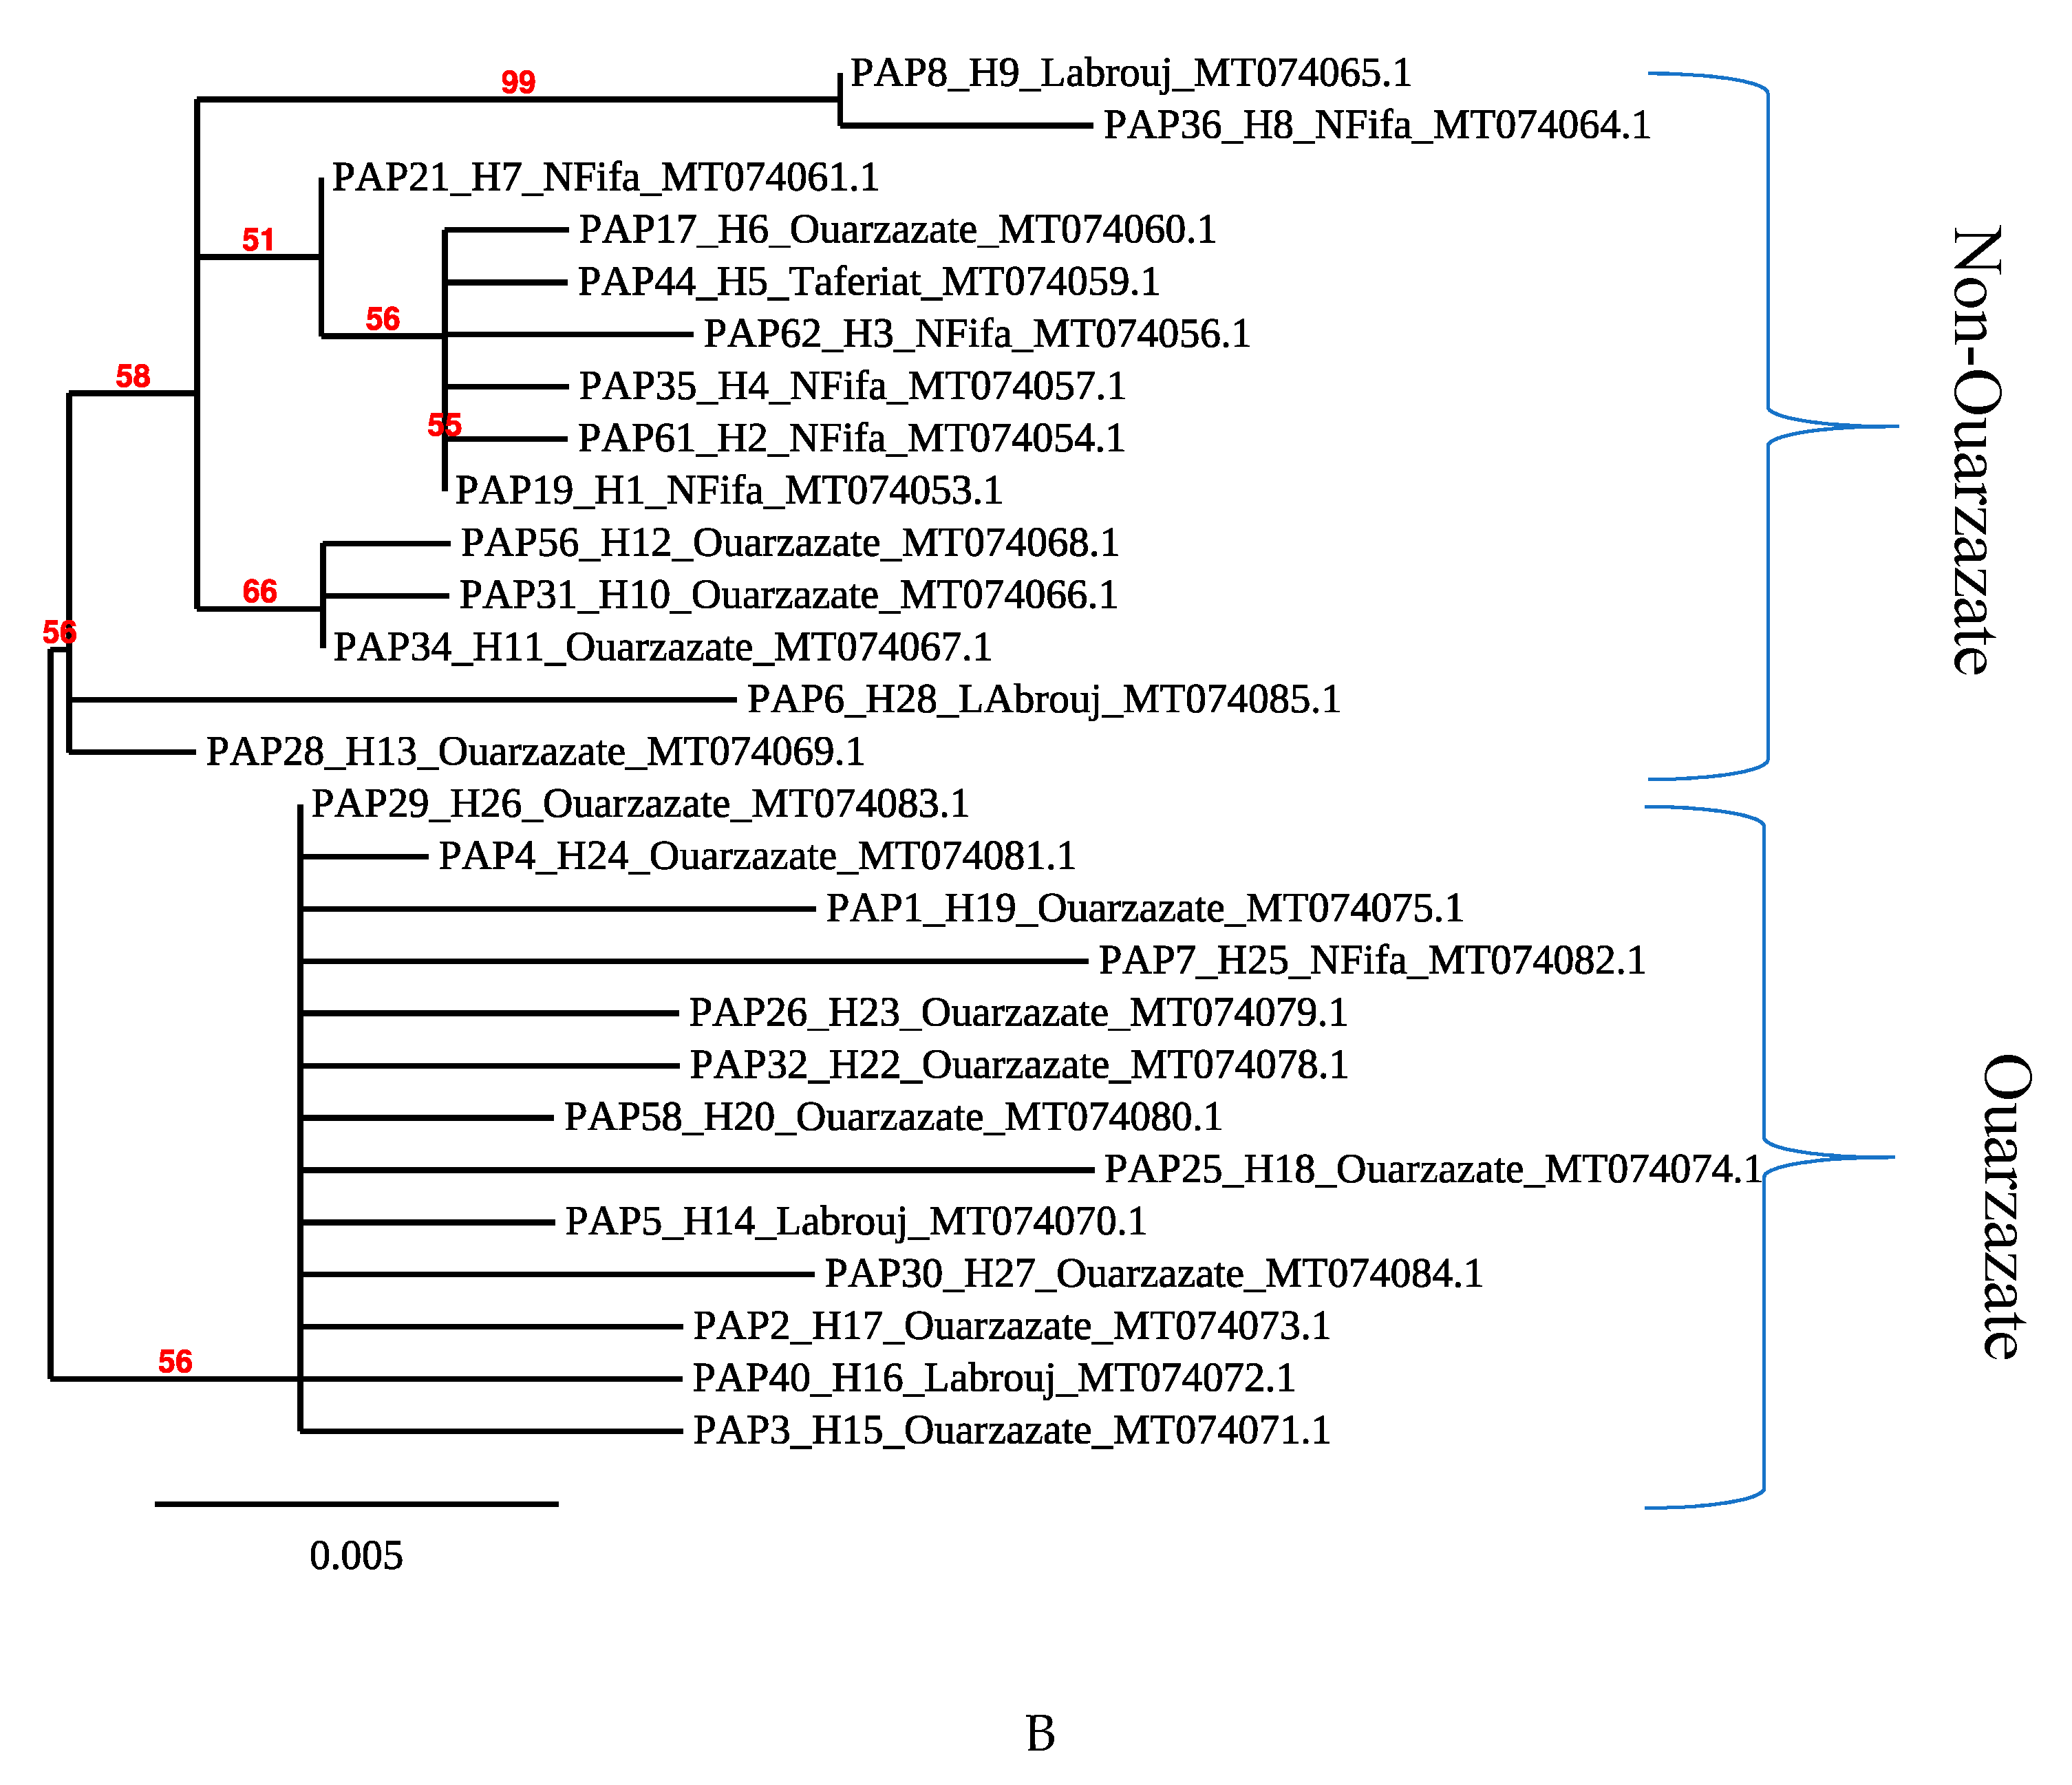
3.3. Phylogenetic Analysis

Phlebotomus papatasi belongs to the Phlebotomus subgenus. The consensus tree (Figure 2A) recovered displays that samples from Morocco fall within the clade of other P. papatasi samples collected in Turkey, Spain and Cyprus. They are clearly divergent from P. (Laroussius) ariasi, P. (Laroussius) perniciosus or P. (Transphlebotomus) sergenti which belong to the Laroussius and Transphebotomus subgenus. Overall, within P. papatasi samples collected in Morocco, the presence of at least two P. papatasi populations that fall into two groups which show some genetic relatedness is depicted (bootstrap support values above 50%). Most specimens sampled in the endemic area of Ouarzazate are grouped together and constitute the “Ouarzazate group”, with a bootstrap value of 56%. This group is interrupted by two individuals from Labrouj in the central Morocco area. The other specimens from non-endemic areas, or “Non-Ouarzazate” areas, constitute a geographically mixed group.

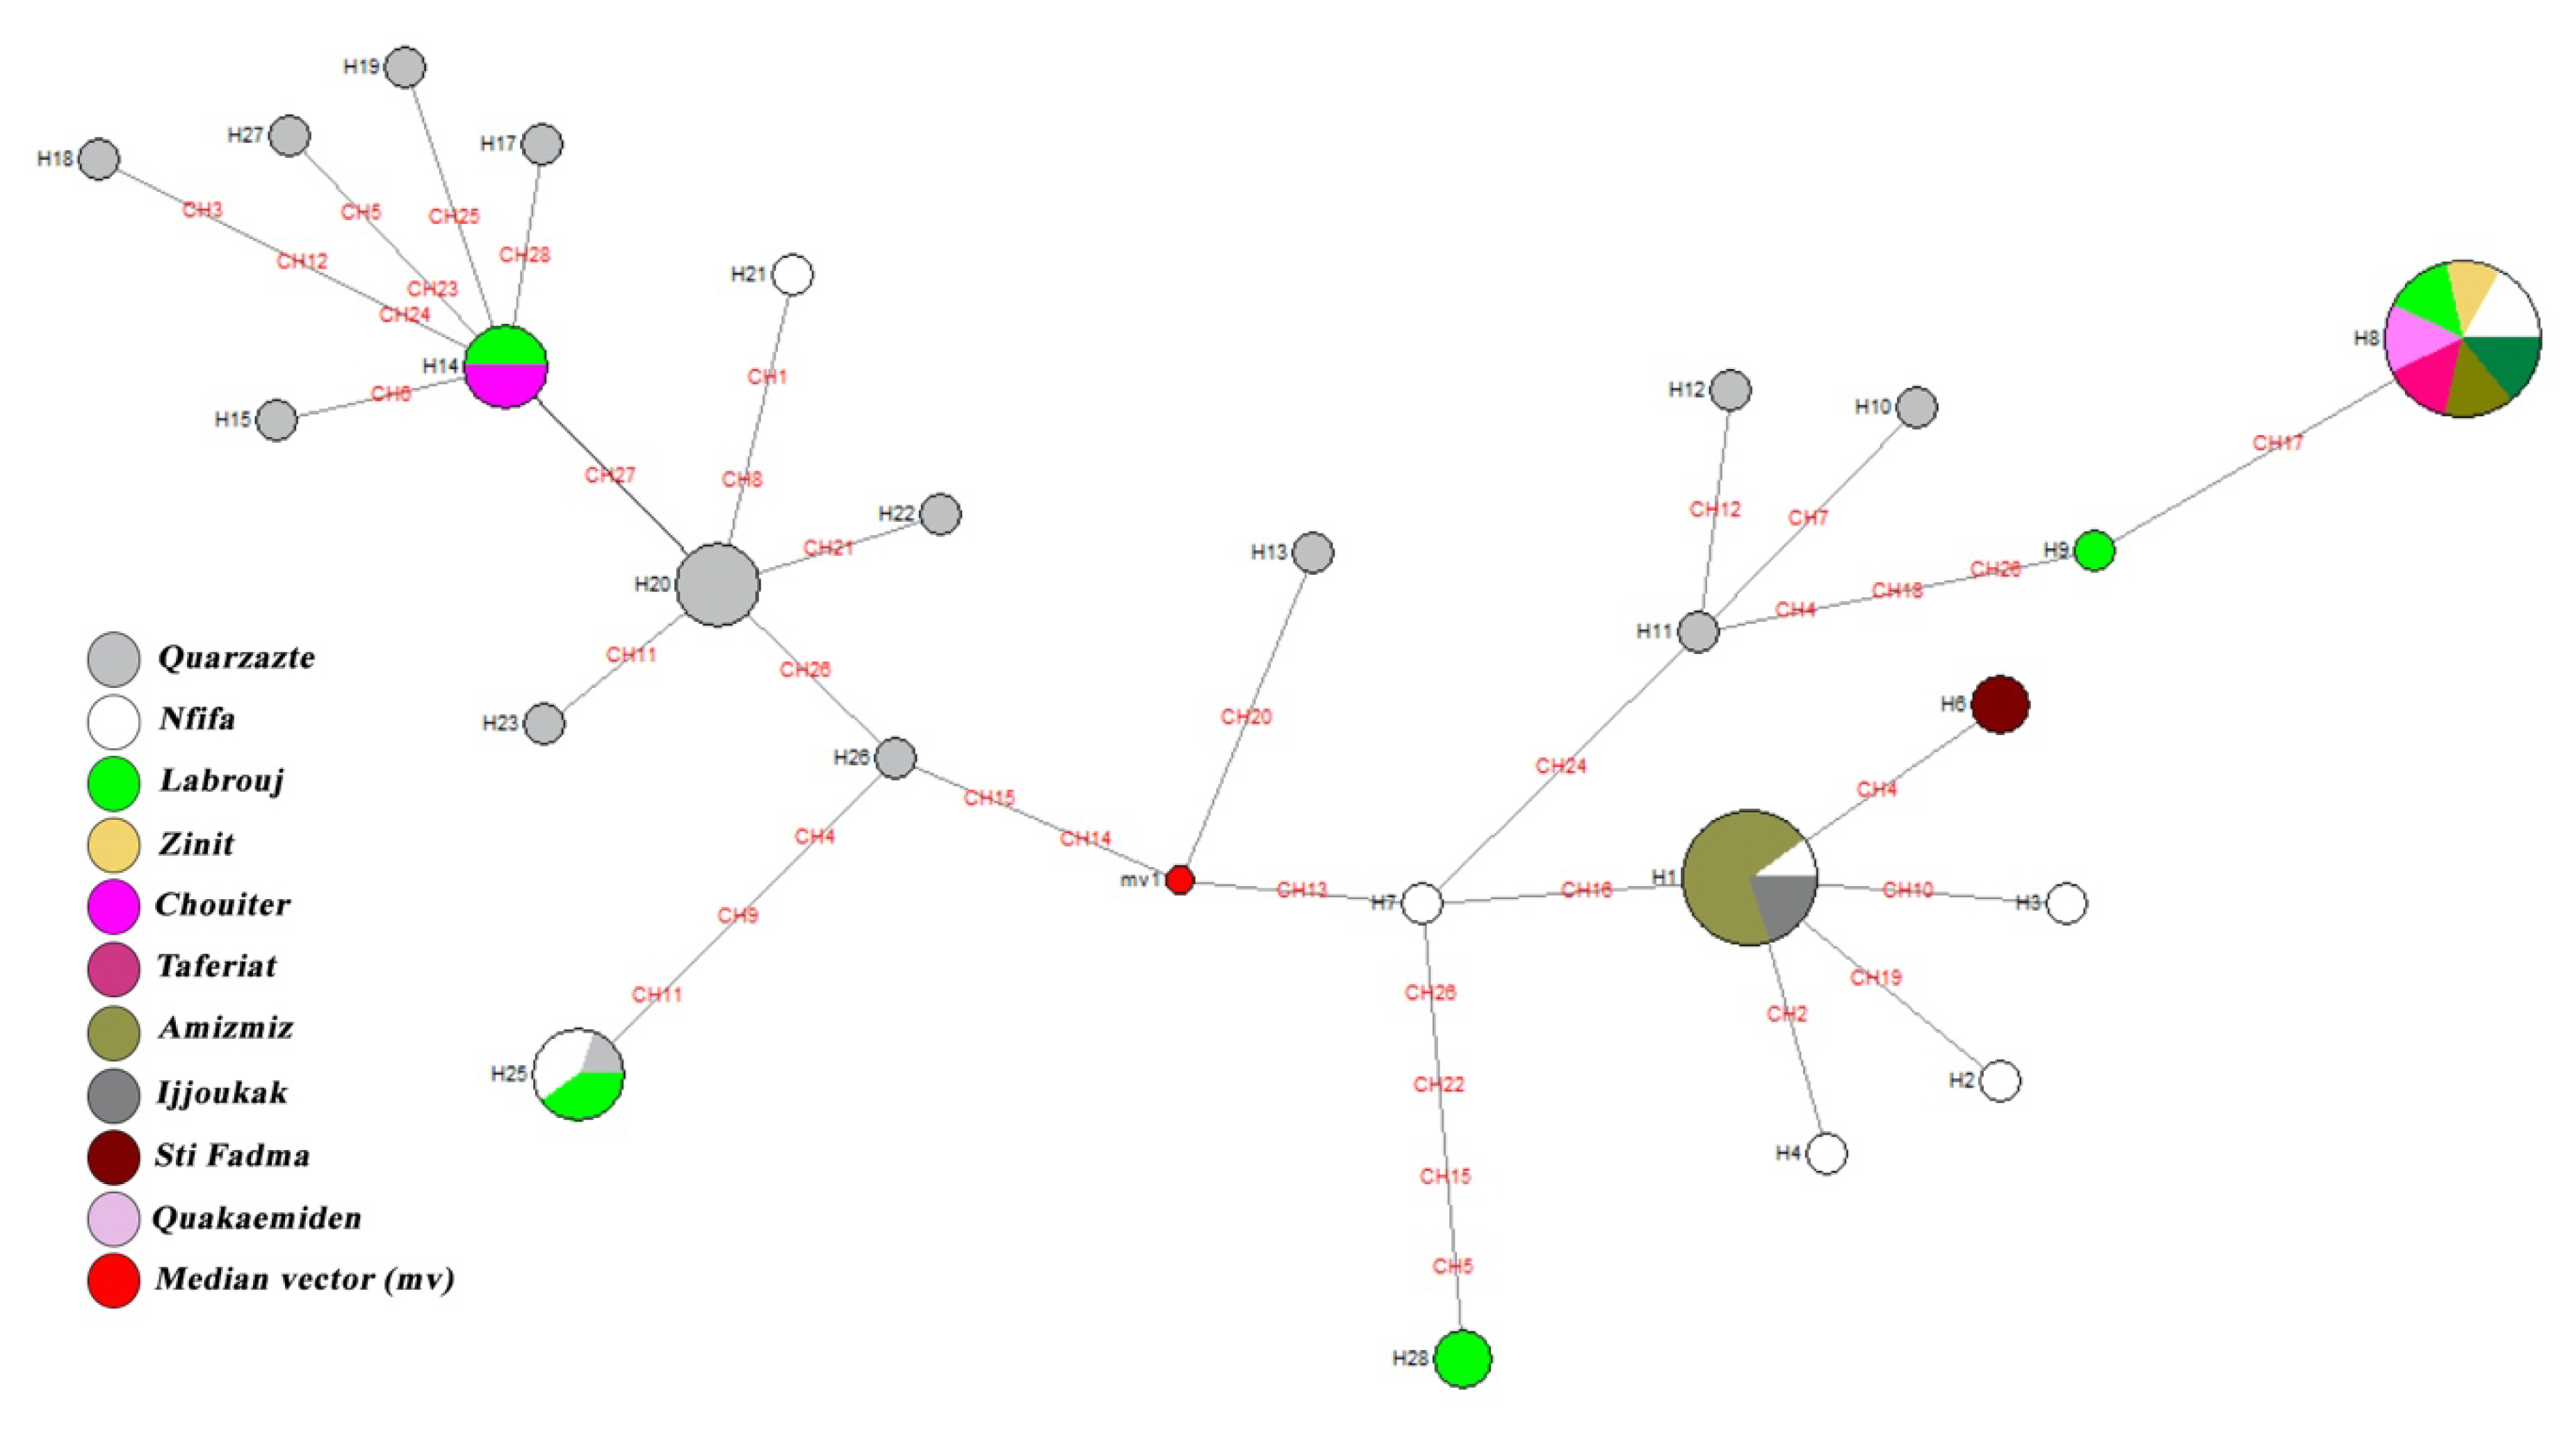
3.4. Median-Joining Network Analysis

The median-joining analysis displays a highly structured network. Within each major clade, the internal and terminal nodes can be interpreted as old and recently derived haplotypes. The network display places all haplotypes into two groups: “Ouarzazate” or endemic; and “Non-Ouarzazate” or non-endemic. Within the Non-Ouarzazate group, two groups (named Mix1 and Mix2) are distinguishable (Figure 3). These two groups encompass haplotypes from the Ouarzazate and Non-Ouarzazate areas. The Mix2 group is closer to the Ouarzazate group in term of haplotype composition than Mix1—it might be considered as a sister group of the latter. Overall, the clustering displayed by the median-joining network agrees well with the topology of the trees generated by the maximum likelihood analysis. The clear variation in clustering between haplotypes of endemic and non-endemic supports a genetic differentiation between these populations.

3.5. Population Differentiation

The genetic differentiation among populations of P. papatasi was defined by F statistics. AMOVA results presented in Table 4 confirm variation among and within populations; 31.03% and 68.97%, respectively (Table 4).
The FST values were calculated in a pairwise manner for the main populations (Ouarzazate and Non-Ouarzazate, encompassing Mix 1 and Mix2). With a FST value of 0.31026, the matrix of significance for 110 permutations reached p = 0.05, which highlights some genetic differentiation between the two groups that were analyzed using our 59 samples.

4. Discussion

Natural barriers like high mountains play an important role for limiting dispersal and isolating populations. The Atlas, a natural barrier, may have played a role in limiting the diffusion of zoonotic cutaneous leishmaniasis to the Saharan regions of Morocco. This Atlas consists of three parallel ranges: the Anti-Atlas in the southwest, which gives way to the High Atlas, where the country’s highest peak rises to 4165 m; the Middle Atlas is located northeast of the High Atlas. Rolling plateaus east of the mountains gradually lead into the Sahara, located in southeastern and southern Morocco. Here, in sub-Saharan areas, L. major is largely widespread. The central Moroccan plateaus overlooking the northern slope of the High Atlas, notably the Haouz plain and Chichaoua, remain non-endemic but, according to entomological data, is considered high risk.
We have investigated the genetic structure of 10 populations collected from both endemic and non-endemic areas for zoonotic cutaneous leishmaniasis using the cytochrome c oxidase subunit I (Cox1 or COI) as molecular marker to gather clues on the influence of the Atlas Mountains on the evolutionary history of P. papatasi populations in Morocco. The cytochrome c oxidase gene is used as a DNA barcode to guide the identification of new animal species and to delineate cryptic taxon and the association between their life stages [44,45,46]. The sequence polymorphism at this locus has been used to investigate the population genetic structure of Lutzomyia longipalpis [47], and to discriminate L. umbratilis sibling species [48]. In Old World sand fly species, COI in combination with the cytochrome b (Cytb) gene can differentiate two closely related species, P. chabaudi and P. riouxi [49]. Here, we observe a genetic diversity of the COI gene in Morocco, reminiscent of a genetic structuration in P. papatasi populations. Samples collected were indistinguishable by morphological observation and genomic analysis of the 18srRNA (data not shown). The haplotype distributions displayed in the median-joining network as well as the phylogenetic analysis supported the notion of a geographic clustering of P. papatasi, in Morocco. Two groups, with distinct genetic structures, can be differentiated. The first one encompasses P. papatasi samples from the ZCL endemic areas of Ouarzazate. The second one, designated the “Non-Ouarzazate” group, includes a mix of individuals from non-endemic areas sampled on the northern slope of the High Atlas Mountains and the arid plains of central Morocco, as well as samples from endemic areas.
The median-joining network, as well as nucleotide analyses, provide additional evidence of a probable demographic expansion of P. papatasi populations. A complex scenario of P. papatasi populations might have taken place in Morocco, with expansion events allowing the appearance of multiple haplotype subgroups. The Ouarzazate population of P. papatasi, which derives from the populations of the southern slope of the High Atlas Mountains, is expected to have experienced a period of isolation due to the physical barrier of the Atlas Mountains. Then, population expansion and genetic diversification might have occurred, maybe following a climatic shift. These assumptions are supported by the high rate of private haplotypes recorded in this group (87%), which could reflect some local adaptation. The diversity of the ecological conditions may affect the distribution and density of P. papatasi, including the bioclimate, anthropization, urbanization, and elevation [50]. The bioclimate is Saharan in Ouarzazate. At stations from central and southwestern Morocco, it varies from arid in Nfifa, Labrouj and Chouiter to semi-arid and sub-humid in Taferiat, Amizmiz, Zinit, Ijjoukak, Sti Fadma and Oukaemiden. In non-endemic areas, sampling was performed on plains where the P. papatasi density is high and in mountainous localities where P. papatasi is less frequent [31]. Despite the very high diversity in the ecological conditions, samples from non-endemic areas were always genetically intermingled, forming the Non-Ouarzazate group. This group includes Mix1, close to P. papatasi from endemic areas, and the more distant Mix2. The Mix1 and Mix2 populations are not geographically isolated by the High Atlas Mountains. It therefore appears that ecological habitats do not play a key role in shaping the genetic variation of P. papatasi populations. This finding agrees with other reports from Hamarsheh et al. [22,25,26] that highlight a genetic structure of P. papatasi linked to latitude rather than to ecological environment.
It will be now of interest to gather more precise information on the evolutionary scenarios that have governed the dispersal of P. papatasi populations and therefore have had an impact on the current and future ZCL incidence in Morocco. To this aim, the use of microsatellite markers may help to more precisely define the demographic history of Moroccoan P. papatasi populations.

5. Conclusions

This work, based on a maternally inherited marker (the COI gene), highlights clear differences in the genetic structure between P. papatasi populations living the L. major-endemic area of Ouarzazate and those of non-endemic areas of central Morocco. In addition, morphological differences have been reported in P. papatasi populations in Morocco [51]. Indeed, these populations sampled from both sides of the High Atlas Mountains also show genetic differences in another marker, the galectin gene [52], which plays a pivotal role in the recognition of L. major by its specific vector P. papatasi [53]. This study pinpoints a polymorphism in the galectin gene (PpGalec) with a mutation affecting an amino acid involved in substrate recognition. Although performed on a limited number of samples, this further highlights an unequal distribution of this mutation in populations from endemic and non-endemic areas for zoonotic cutaneous leishmaniasis [53]. All these reported observations question potential variation in the vectoral capacity/competence of P. papatasi populations from the southern and the northern slope of the High Atlas Mountains in Morocco.

Supplementary Materials

The following are available online at https://www.mdpi.com/2076-2607/8/7/1010/s1, Table S1A: Molecular diversity as computed with Arlequin, Table S1B: Neutrality test as computed by Arlequin.

Author Contributions

Conceptualization, D.S. and S.G.; methodology, D.G. and S.G.; writing—original draft preparation, S.G. and O.H.; writing—review and editing, D.S., S.G., O.H. and D.F. All authors have read and agreed to the published version of the manuscript.

Funding

This research received no external funding.

Acknowledgments

We thank the anonymous reviewers for their helpful suggestions, corrections and comments on a previous draft of the manuscript.

Conflicts of Interest

The authors declare no conflict of interest.

References

  1. Sereno, D. Leishmania (Mundinia) spp.: From description to emergence as new human and animal Leishmania pathogens. New Microbes New Infect. 2019, 11540. [Google Scholar] [CrossRef]
  2. Sereno, D.; Akhoundi, M.; Sayehmri, K.; Mirzaei, A.; Holzmuller, P.; Lejon, V.; Waleckx, E. Noninvasive Biological Samples to Detect and Diagnose Infections due to Trypanosomatidae Parasites: A Systematic Review and Meta-Analysis. Int. J. Mol. Sci. 2020, 21, 1684. [Google Scholar] [CrossRef] [PubMed] [Green Version]
  3. Akhoundi, M.; Kuhls, K.; Cannet, A.; Votýpka, J.; Marty, P.; Delaunay, P.; Sereno, D. A Historical Overview of the Classification, Evolution, and Dispersion of Leishmania Parasites and Sandflies. PLoS Negl. Trop. Dis. 2016, 10, e0004349. [Google Scholar] [CrossRef]
  4. Killick-Kendrick, R. Phlebotomine vectors of leishmaniasis: A review. Med. Vet. Entomol. 1990, 4, 1–24. [Google Scholar] [CrossRef]
  5. Killick-Kendrick, R. The biology and control of phlebotomine sand flies. Clin. Dermatol. 1999, 17, 279–289. [Google Scholar] [CrossRef]
  6. Maazoun, R.; Pratlong, F.; Lanotte, G.; Rioux, J.A. Le complexe Leishmania major. A propos de l’analyse numérique de 35 souches identifiées par la méthode enzymatique. In Leishmania: Taxonomie et Phylogenèse, Applications Écoépidémiologiques; Rioux, J.A., Ed.; CNRS/INSERM: Paris, France, 1984; IMEEE: Montpellier, France, 1986; pp. 139–142. [Google Scholar]
  7. Rioux, J.A.; Guilvard, E.; Dereure, J.; Lanotte, G.; Deniau, M.; Pratlong, F. Infestation naturelle de Phlebotomus papatasi (Scopoli, 1786) par Leishmania major MON-25. A propos de 28 souches isolées dans un foyer du Sud Marocain. In Leishmania: Taxonomie et Phylogenèse, Applications Eco-Epidémiologiques; Rioux, J.A., Ed.; CNRS/INSERM: Paris, France, 1984; IMEEE: Montpellier, France, 1986; pp. 471–480. [Google Scholar]
  8. Rioux, J.A.; Petter, F.; Akalay, O.; Lanotte, G.; Ouazani, A.; Séguignes, M.; Mohcine, A. Meriones Shawi (Duvernoy, 1842) [Rodentia, Gerbillidae], réservoir de Leishmania major Yakimoff et Shokhor, 1914 dans le Sud Marocain. Comptes Rendus Acad. Sci. Paris Sér. III 1982, 294, 515–517. [Google Scholar]
  9. MHM. Santé en Chiffres 2015; Direction de la Planification et des Ressources Financière, Division de la Planification et des Etudes, Service des Études et de L’information Sanitaire: Rabat, Morocco, 2016. [Google Scholar]
  10. Guernaoui, S. Les Leishmanioses dans les Zones Arides et Semi-Arides du Sud-Ouest Marocain. Ecologie, Épidémiologie, Modélisation et Aide à la Décision Pour la Lutte Anti-Vectorielle; Université Cadi Ayyad: Marrakech, Morocco, 2006. [Google Scholar]
  11. Kholoud, K.; Denis, S.; Lahouari, B.; El Hidan, M.; Souad, B. Management of Leishmaniases in the Era of Climate Change in Morocco. Int. J. Environ. Res. Public Health 2018, 15, 1542. [Google Scholar] [CrossRef] [PubMed] [Green Version]
  12. Lewis, D.J. A taxonomic review of the genus Phlebotomus (Diptera: Psychodidae). Bull. Br. Mus. Nat. Hist. 1982, 45, 121–209. [Google Scholar]
  13. Wasserberg, G.; Abramsky, Z.; Kotler, B.P.; Ostfeld, R.S.; Yarom, I.; Warburg, A. Anthropogenic disturbances enhance occurrence of cutaneous leishmaniasis in Israel deserts: Patterns and mechanisms. Ecol. Appl. 2003, 13, 868–881. [Google Scholar] [CrossRef]
  14. Kamhawi, S.; Abdel-Hafez, S.K.; Molyneux, D.H. Urbanization—How does it affect the behaviour of sandflies? Parassitologia 1991, 33, 299–306. [Google Scholar]
  15. Guernaoui, S.; Ramaoui, K.; Rahola, N.; Barnabe, C.; Sereno, D.; Boumezzough, A. Malformations of the genitalia in male Phlebotomus papatasi (Scopoli) (Diptera: Psychodidae). J. Vector Ecol. 2010, 35, 13–19. [Google Scholar] [CrossRef] [PubMed]
  16. Guernaoui, S.; Boumezzough, A. Habitat preferences of sand flies (Diptera: Psychodidae) in the southwestern Morocco. J. Med. Entomol. 2009, 46, 1187–1194. [Google Scholar] [CrossRef] [PubMed]
  17. Lysenko, A.J.; Bejaev, A.E. Some problems of primary importance concerning the epidemiology of leishmaniasis in the Mediterranean-Midlle Asian Region. In Proceedings of the Ecologie des Leishmanioses, Paris, France.
  18. Esseghir, S.; Ready, P.D.; Killick-Kendrick, R.; Ben-Ismail, R. Mitochondrial haplotypes and phylogeography of Phlebotomus vectors of Leishmania major. Insect. Mol. Biol. 1997, 6, 211–225. [Google Scholar] [CrossRef] [PubMed]
  19. Flanley, C.M.; Ramalho-Ortigao, M.; Coutinho-Abreu, I.V.; Mukbel, R.; Hanafi, H.A.; El-Hossary, S.S.; Fawaz, E.E.-D.Y.; Hoel, D.F.; Bray, A.W.; Stayback, G.; et al. Population genetics analysis of Phlebotomus papatasi sand flies from Egypt and Jordan based on mitochondrial cytochrome b haplotypes. Parasites Vectors 2018, 11, 214. [Google Scholar] [CrossRef] [PubMed]
  20. Parvizi, P.; Benlarbi, M.; Ready, P.D. Mitochondrial and Wolbachia markers for the sandfly Phlebotomus papatasi: Little population differentiation between peridomestic sites and gerbil burrows in Isfahan province, Iran. Med. Vet. Entomol. 2003, 17, 351–362. [Google Scholar] [CrossRef]
  21. Parvizi, P.; Ready, P.D. Molecular investigation of the population differentiation of Phlebotomus papatasi, important vector of Leishmania major, in different habitats and regions of Iran. Iran Biomed. J. 2006, 10, 69–77. [Google Scholar]
  22. Hamarsheh, O.; Presber, W.; Abdeen, Z.; Sawalha, S.; Al-Lahem, A.; Schönian, G. Genetic structure of Mediterranean populations of the sand fly Phlebotomus papatasi by mitochondrial cytochrome b haplotype analysis. Med. Vet. Entomol. 2007, 21, 270–277. [Google Scholar] [CrossRef]
  23. Raja, B.; Jaouadi, K.; Haouas, N.; Mezhoud, H.; Bdira, S.; Amor, S. Mitochondrial cytochrome b variation in populations of the cutaneous leishmaniasis vector Phlebotomus papatasi across eastern Tunisia. Int. J. Biodivers. Conserv. 2012, 4, 189–196. [Google Scholar]
  24. Depaquit, J.; Lienard, E.; Verzeaux-Griffon, A.; Ferte, H.; Bounamous, A.; Gantier, J.C.; Hanafi, H.A.; Jacobson, R.L.; Maroli, M.; Moin-Vaziri, V.; et al. Molecular homogeneity in diverse geographical populations of Phlebotomus papatasi (Diptera, Psychodidae) inferred from ND4 mtDNA and ITS2 rDNA Epidemiological consequences. Infect. Genet. Evol. 2008, 8, 159–170. [Google Scholar] [CrossRef]
  25. Hamarsheh, O.; Presber, W.; Yaghoobi-Ershadi, M.R.; Amro, A.; Al-Jawabreh, A.; Sawalha, S.; Al-Lahem, A.; Das, M.L.; Guernaoui, S.; Seridi, N.; et al. Population structure and geographical subdivision of the Leishmania major vector Phlebotomus papatasi as revealed by microsatellite variation. Med. Vet. Entomol. 2009, 23, 69–77. [Google Scholar] [CrossRef]
  26. Hamarsheh, O.; Karakus, M.; Azmi, K.; Jaouadi, K.; Yaghoobi-Ershadi, M.R.; Kruger, A.; Amro, A.; Kenawy, M.A.; Dokhan, M.R.; Abdeen, Z.; et al. Development of polymorphic EST microsatellite markers for the sand fly, Phlebotomus papatasi (Diptera: Psychodidae). Parasites Vectors 2018, 11, 160. [Google Scholar] [CrossRef] [PubMed] [Green Version]
  27. Khalid, N.M.; Aboud, M.A.; Alrabba, F.M.; Elnaiem, D.E.; Tripet, F. Evidence for genetic differentiation at the microgeographic scale in Phlebotomus papatasi populations from Sudan. Parasites Vectors 2012, 5, 249. [Google Scholar] [CrossRef] [PubMed] [Green Version]
  28. Bailly-Choumara, H.; Abonnenc, E.; Pastre, J. Contribution à l’étude des phlébotomes du Maroc (Diptera: Psychodidae). Données faunistiques et écologiques. Cahiers ORSTOM 1971, 9, 431–460. [Google Scholar]
  29. Rioux, J.A.; Rispail, P.; Lanotte, G.; Lepart, J. Relations Phlébotomes-bioclimats en écologie des leishmanioses Corollaires épidémiologiques. L’exemple du Maroc. Bull. Soc. Bot. Fr. 1984, 2–4, 549–557. [Google Scholar] [CrossRef]
  30. Rioux, J.A.; Akalay, O.; Perieres, J.; Dereure, J.; Mahjour, J.; Le Houerou, H.N.; Leger, N.; Desjeux, P.; Gallego, M.; Saddiki, A.; et al. L’évaluation écoépidémiologique du « risque leishmanien » au Sahara atlantique marocain. Intérêt heuristique de la relation « Phlébotomes-bioclimats ». Ecol. Mediterr. 1997, 23, 73–92. [Google Scholar] [CrossRef]
  31. Guernaoui, S.; Boumezzough, A.; Laamrani, A. Altitudinal structuring of sand flies (Diptera: Psychodidae) in the High-Atlas mountains (Morocco) and its relation to the risk of leishmaniasis transmission. Acta Trop. 2006, 97, 346–351. [Google Scholar] [CrossRef]
  32. Abonnenc, E. Les phlébotomes de la région éthiopienne (Diptera: Psychodidae). Mémoire ORSTOM 1972, 55, 289. [Google Scholar]
  33. Ratnasingham, S.; Hebert, P.D. Bold: The Barcode of Life Data System (http://www.barcodinglife.org). Mol. Ecol. Notes 2007, 7, 355–364. [Google Scholar] [CrossRef] [Green Version]
  34. Corpet, F. Multiple sequence alignment with hierarchical clustering. Nucleic Acids Res. 1998, 16, 10881–10890. [Google Scholar] [CrossRef]
  35. Kimura, M. A simple method for estimating evolutionary rates of base substitutions through comparative studies of nucleotide sequences. J. Mol. Evol. 1980, 16, 111–120. [Google Scholar] [CrossRef] [PubMed]
  36. Kumar, S.; Tamura, K.; Nei, M. MEGA3: Integrated software for Molecular Evolutionary Genetics Analysis and sequence alignment. Brief Bioinform. 2004, 5, 150–163. [Google Scholar] [CrossRef] [PubMed] [Green Version]
  37. Watterson, G.A. On the number of segregating sites in genetical models without recombination. Theor. Popul. Biol. 1975, 7, 256–276. [Google Scholar] [CrossRef]
  38. Tajima, F. Evolutionary relationship of DNA sequences in finite populations. Genetics 1983, 105, 437–460. [Google Scholar] [PubMed]
  39. Weir, B.S.; Cockerham, C.C. Group inbreeding with two linked loci. Genetics 1969, 63, 711–742. [Google Scholar] [PubMed]
  40. Excoffier, L.; Laval, G.; Schneider, S. Arlequin (version 3.0): An integrated software for population genetics data analysis. Evol. Bioinform. Online 2005, 1, 47–50. [Google Scholar] [CrossRef] [Green Version]
  41. Bandelt, H.J.; Forster, P.; Rohl, A. Median-joining networks for inferring intraspecific phylogenies. Mol. Biol. Evol. 1999, 16, 37–48. [Google Scholar] [CrossRef]
  42. Posada, D.; Crandall, K.A. Intraspecific gene genealogies: Trees grafting into networks. Trends Ecol. Evol. 2001, 16, 37–45. [Google Scholar] [CrossRef]
  43. Dereeper, A.; Guignon, V.; Blanc, G.; Audic, S.; Buffet, S.; Chevenet, F.; Dufayard, J.F.; Guindon, S.; Lefort, V.; Lescot, M.; et al. Phylogeny.fr: Robust phylogenetic analysis for the non-specialist. Nucleic Acids Res. 2008, 36, W465–W469. [Google Scholar] [CrossRef]
  44. Hebert, P.D.; Cywinska, A.; Ball, S.L.; deWaard, J.R. Biological identifications through DNA barcodes. Proc. Biol. Sci. 2003, 270, 313–321. [Google Scholar] [CrossRef] [Green Version]
  45. Erisoz Kasap, O.; Linton, Y.M.; Karakus, M.; Ozbel, Y.; Alten, B. Revision of the species composition and distribution of Turkish sand flies using DNA barcodes. Parasites Vectors 2019, 12, 410. [Google Scholar] [CrossRef] [Green Version]
  46. Kress, W.J.; Garcia-Robledo, C.; Uriarte, M.; Erickson, D.L. DNA barcodes for ecology, evolution, and conservation. Trends Ecol. Evol. 2015, 30, 25–35. [Google Scholar] [CrossRef] [PubMed]
  47. Arrivillaga, J.C.; Norris, D.E.; Feliciangeli, M.D.; Lanzaro, G.C. Phylogeography of the neotropical sand fly Lutzomyia longipalpis inferred from mitochondrial DNA sequences. Infect. Genet. Evol. 2002, 2, 83–95. [Google Scholar] [CrossRef]
  48. Scarpassa, V.M.; Alencar, R.B. Lutzomyia umbratilis, the main vector of Leishmania guyanensis, represents a novel species complex? PLoS ONE 2012, 7, e37341. [Google Scholar] [CrossRef] [Green Version]
  49. Lehrter, V.; Banuls, A.L.; Leger, N.; Rioux, J.A.; Depaquit, J. Phlebotomus (Paraphlebotomus) chabaudi and Phlebotomus riouxi: Closely related species or synonyms? Parasite 2017, 24, 47. [Google Scholar] [CrossRef] [Green Version]
  50. Sjostrand, A.E.; Sjodin, P.; Jakobsson, M. Private haplotypes can reveal local adaptation. BMC Genet. 2014, 15, 61. [Google Scholar] [CrossRef] [PubMed] [Green Version]
  51. Prudhomme, J.; Gunay, F.; Rahola, N.; Ouanaimi, F.; Guernaoui, S.; Boumezzough, A.; Bañuls, A.L.; Sereno, D.; Alten, B. Wing size and shape variation of Phlebotomus papatasi (Diptera: Psychodidae) populations from the south and north slopes of the Atlas Mountains in Morocco. J. Vector Ecol. 2012, 37. [Google Scholar] [CrossRef]
  52. Guernaoui, S.; Garcia, D.; Boumezzough, A.; Fontenille, D.; Sereno, D. Preliminary study on the galectin molecular diversity in Moroccoan Phlebotomus papatasi sandfly populations. J. Vector Borne Dis. 2011, 48, 67–71. [Google Scholar]
  53. Kamhawi, S.; Ramalho-Ortigao, M.; Pham, V.M.; Kumar, S.; Lawyer, P.G.; Turco, S.J.; Barillas-Mury, C.; Sacks, D.L.; Valenzuela, J.G. A role for insect galectins in parasite survival. Cell 2004, 119, 329–341. [Google Scholar] [CrossRef] [Green Version]
Figure 1. Geographical location of sites where P. papatasi were trapped.
Microorganisms 08 01010 g001
Figure 2. Phylogenetic tree reconstructed from (A) P. papatasi COI sequences from Morocco, Serbia, Turkey and Spain. P. ariasi was used as an outgroup. (B) P. papatasi samples from Morocco.
Microorganisms 08 01010 g002aMicroorganisms 08 01010 g002b
Figure 3. Median-joining network deduced from P. papatasi COI sequences sampled in Morocco. Circle size and color are indicative of the frequency and the geographical location of haplotypes. Haplotype identification is provided next to the corresponding circle. Nucleotide substitutions are highlighted in red.
Microorganisms 08 01010 g003
Table 1. Sampling stations in the study area.
StationsLatitudeLongitudeAltitude (m)Number of SpecimensTrapping Method
Ouarzazate31°23′19 N5°59′15 W164820CDC trap
Nfifa31°32′40 N8°45′58 W32210CDC trap
Labrouj32°30′0 N7°12′0 W3886CDC trap
Chouiter31°34′0 N7°49′0 W5292Sticky trap
Taferiat31°32′59 N7°36′29 W7555Sticky trap
Amizmiz31°13′0 N8°15′0 W10048Sticky trap
Zinit31°4′60 N8°41′60 W11482CDC trap
Ijjoukak31°0′0 N8°10′0 W12332CDC trap
Sti Fadma31°13′0 N7°42′0 W17722CDC trap
Oukaemiden31°12′21 N7°51′51 W26132CDC trap
Table 2. P. papatasi haplotypes within the 59 Moroccan P. papatasi specimens sampled.
HaplotypesSpecimen CodeNbVariant Character Position
H1PAP78,70,43,41, 19,13,11,10,99GGTCGCA CCTTGGGCGA TTAGGAGTAG CTATAT
H2PAP611....... .......... .C........ ......
H3PAP621....... ..A....... .......... ....G.
H4PAP351.A..... .......... .......... ......
H5PAP441....... .......... .......... ...C..
H6PAP79,172...T... .......... .......... ......
H7PAP211....... ........A. .......... ......
H8PAP80,77,76,75,71,55,47, 46,45,36,22,18,12,914...T... ........AG C.....A.G. ......
H9PAP81...T... ........A. C.....A.G. ......
H10PAP311......G ........A. ......A... ......
H11PAP341....... ........A. ......A... ......
H12PAP561....... ....A...A. ......A... ......
H13PAP281....... .....A..A. ..G....... ......
H14PAP5,492....... .....AATA. ........GA ......
H15PAP31.....T. .....AATA. ........GA ......
H16PAP72,402....... .....AATA. ........GA .....C
H17PAP21....... .....AATA. ........GA T.....
H18PAP251..C.... ....AAATA. ......A.GA .C....
H19PAP11....... .....AATA. .......GGA ..G...
H20PAP58,33,243....... .....AATA. ........G. ..G...
H21PAP371C...... T....AATA. ........G. ..G...
H22PAP321....... .....AATA. ...A....G. ..G...
H23PAP261....... ...C.AATA. ........G. ..G...
H24PAP41....... .....AATA. ........G. ......
H25PAP67,60,57,38,75...T... .T.A.AATA. .......... ..G...
H26PAP291....... .....AATA. .......... ......
H27PAP301....A.. .....AATA. .....G..GA ......
H28PAP73,62....A.. .......TA. ....A...T. ......
Alignment of variant nucleotide positions for the 654 bp of the mitochondrial COI gene. Only polymorphic positions are shown. Spaces represent identity with respect to the first reference sequence.
Table 3. Distribution of COI haplotypes within the Moroccan populations of P. papatasi included in this study. Unique haplotypes are underlined.
StationsCOI-HaplotypesUnique Haplotypes
OuarzazateH10, H11, H12, H13, H15, H17, H18, H19, H20, H22, H23, H24, H25, H26, H2713
NfifaH1, H2, H3, H4, H7, H8, H21, H255
LabroujH8, H9, H14, H16, H25, H281
ChouiterH8, H140
TaferiatH5, H81
AmizmizH1, H80
ZinitH80
IjjoukakH10
Sti FadmaH60
OukaemidenH80
Table 4. Molecular variance (AMOVA).
Source of Variation* d.fSum of SquaresVariance ComponentsVariation (%)
Among populations131.7161.08341 Va31.03
Within populations57137.2842.40850 Vb68.97
Total58169.0003.49190/
Fixation index (FST)0.31026///
* d.f: degree of freedom.

