Article

Frequency of Toxoplasma gondii and Risk Factors Associated with the Infection in Stray Dogs and Cats of Panama

1
Centro de Biología Celular y Molecular de Enfermedades, Instituto de Investigaciones Científicas y Servicios de Alta Tecnología (INDICASAT-AIP), Panamá 0801, Panama
2
Departamento de Clínicas y Cirugías Veterinarias, Facultad de Medicina Veterinaria, Universidad de Panamá, Campus Harmodio Árias Madrid (Curundu), Panamá 4, Apartado 3366, Panama
3
Sistema Nacional de Investigación–Secretaría Nacional de Ciencia, Tecnología e Innovasión (SNI-SENACYT), Ciudad del Saber (Clayton), Apartado 0816-02852, Panama
4
Complejo Hospitalario Veterinario de Corozal, Corregimiento de Ancón, calle Hospital, edificio 6553, 6554, 6555, Panamá 4, Apartado 3366, Panama
5
Parque Municipal Summit, Corregimiento de Ancón, Avenida Gaillard, Zona 1, Apartado 503, Panama
6
Fundación Spay Panamá. Bethania, Apartado 0818-00423, Panama
7
Centro Medico Veterinarius, Apartado 08001, Panama
8
Unidad de Sistema de Información Geográfica de la Dirección de Investigación y Desarrollo Tecnológico, Instituto Conmemorativo Gorgas de Estudios de la Salud (Calidonia), Apartado 0816-02593, Panama
*
Author to whom correspondence should be addressed.
These authors contributed equally to this work.
Microorganisms 2020, 8(6), 927; https://doi.org/10.3390/microorganisms8060927
Submission received: 1 May 2020 / Revised: 12 June 2020 / Accepted: 17 June 2020 / Published: 19 June 2020
(This article belongs to the Section Parasitology)

Abstract

:
Stray animals such as dogs and cats have an important role in maintaining the transmission cycles and dissemination of Toxoplasma gondii. Therefore, the objective of this study was to evaluate the frequency of T. gondii in stray dogs and cats in six different regions of Panama and determine risk factors associated with the dynamics of infection in each of the studied regions. Data were obtained using serological tests for the detection of anti-T. gondii IgG and IgM antibodies. The results of this study revealed an overall infection frequency of 23.73%. The infection frequencies found in dog and cat populations were 25.70% and 21.93% respectively, showing no statistically significant difference. Risk factor correlations suggested different infection dynamics depending on the region analyzed. The San Miguelito, North and West regions were more associated with positive cases in dogs with an age range greater than 13 months. Conversely, the Metro, Central and East regions were more associated with negative cases in cats with age ranging between 0 and 5 months. Infection of the parasite in stray animals can be influenced by intrinsic characteristics of each region, which can potentiate different risk factors associated with the different routes of transmission.

1. Introduction

Toxoplasma gondii is one of the best adapted and most prevalent parasites in the world. It has a wide geographical distribution due to its ability to infect and multiply asexually in a great diversity of vertebrate hosts, such as birds, mammals and reptiles [1]. However, its sexual phase can only be performed in the epithelial cells of the intestines of feline species [2]. In recent decades, this parasite has aroused special interest due to the serious pathologies that T. gondii infection can cause in humans from the congenital and chronic point of view [3,4]. In addition, T. gondii is an opportunistic parasite capable of causing severe pathologies in immunocompromised populations [5].
Some authors support the hypothesis that humans became infected with T. gondii when the domestication of animals occurred [6]. Interaction with domestic animals since ancient times promoted the emergence and maintenance of different transmission cycles of the parasite [6]. These transmission cycles have also been closely linked to the behaviors of different populations, environmental conditions and the evolutionary capabilities of the parasite. T. gondii uses various routes of transmission, the most important being the ingestion of food contaminated with oocysts or tissue cysts [7]. Of all the forms of transmission used by the parasite, this seems to be the simplest and most efficient at infecting a large number of hosts. The ingestion of cyst-contaminated meat from pigs, chicken, sheep and lamb is very common in countries with high frequencies of consumption of these animals and that have preferences for undercooked meat [8].
Other forms of transmission related to the mechanical interaction with domestic animals have been highlighted mainly in dogs and cats due to their close relationship with humans [9,10]. In dogs, the risk of transmission of the parasite has been associated with their coprophagic habits and rolling behavior over grass and/or feces possibly contaminated with parasite oocysts. The oocysts can be transported in the animal’s fur and transmitted by physical contact to the human. However, studies conducted so far in dogs are inconclusive and hardly suggest a potential risk of T. gondii infection through mechanical contact [11,12]. In the case of felines, the greatest risk occurs when cats are infected for the first time with the parasite; without prior developed immunity to protect them, the parasite quickly infects the cells of the small intestine and begins an asexual multiplication phase. After several asexual stages, the parasite starts the sexual reproduction phase, producing millions of oocysts which will be released into the environment in the cat’s feces. Once released, the oocysts remain immature until optimal temperature and humidity conditions help them sporulate and become infectious [7,13]. After a primary T. gondii infection occurs, these animals develop immunity, making it very rare for them to resume oocyst release. Nevertheless, recent studies have shown that in some cases, cats can resume oocysts release six years after the primary T. gondii infection, suggesting that previously acquired immunity does not persist for a lifetime [14,15]. From the epidemiological point of view, there is no doubt that cats play an important role in maintaining transmission cycles; however, many factors such as the behavior of cats, environmental conditions and the maturation time and viability of oocysts, can make difficult the transmission of the parasite through feces of this animal. Therefore, this transmission route may not be as effective as the transmission through the ingestion of food contaminated with parasite oocysts.
Epidemiological studies in Latin American countries have shown a high frequency of T. gondii infection in stray dogs and cats strongly associated with the region, the animal species and the type of diagnostic test used. Studies conducted in Brazil displayed variations in urban regions of the cities of São Paulo (dogs—50.5%, cats—40.0%), Rio de Janeiro (cats—18%) and Curitiba (dogs—48%), where a high percentage of positivity was observed in both dogs and cats [16,17,18]. In Argentina and Chile, the majority of the reports are studies carried out on pets. Different ranges of seroprevalences have been found in regions such as the Argentine Chaco (dogs—55.3%), Buenos Aires (cats—19.5% to 22.6%) and Northeast Argentina (dogs—13.1% to 23.0%) [19,20,21,22]. In Chile, the Valdivia and San Carlos regions yielded seroprevalence data of T. gondii infection in cats of 33.0% and 48.3%, respectively [23,24]. Another study in southern Chile showed a high prevalence for T. gondii infection in a population of domestic and feral cats (68%) [25]. Unfortunately, the data were not stratified; therefore, no inferences can be made about risk factors among these populations. Furthermore, in the cities of Bogota and Lima, the frequencies of T. gondii infection in abandoned dogs and domestic cats were 16.8% and 11.0–17.9% respectively [26,27,28].
In countries of the Caribbean, Central America and Mexico, few studies have been carried out on stray dogs and cats. However, high frequencies of infection in feral cats from an island of Puerto Rico (84.2%) have been reported [29]. In different regions of Mexico and Panama, seroprevalence data were only found in domestic animals, with ranges of 70.8–91.8% and 9.2–42.0% respectively [30,31,32,33]. Furthermore, a recent study carried out in regions of Panama City and Panama West reported high seroprevalences in domestic dogs and cats (30.73% of overall prevalence) without significant differences between the populations of both species [34].
Few studies have been developed to understand the role that stray cats and dogs play in the transmission of T. gondii in the Americas. Most studies have focused in domestic dogs and cats due to their close relationships with humans. Some of these studies have included samples of stray animals; however, the populations were not analyzed separately, which makes it difficult to assess the risk factors associated with the habitat of these animals and the transmission of T. gondii. Therefore, in this study, stray dog and cat populations from different urban regions of Panama City and West Panama were evaluated. The objectives were focused mainly on determining the frequency of T. gondii infection in stray dogs and cats and analyzing different risk factors associated with the T. gondii infection and maintenance of transmission cycles of the parasite.

2. Materials and Methods

2.1. Ethics Statement

The methodology used in this study for the sampling of serum in stray dogs and cats was reviewed and approved by the Institutional Animal Care and Use Committee of INDICASAT AIP (IACUC-17-002, 4 May 2017), and carried out in accordance with the norms and procedures established by international regulations and those established by INDICASAT AIP.

2.2. Experimental Design

The experimental design used was a cross-sectional study in six populations of feral dogs and cats with different urban characteristics.

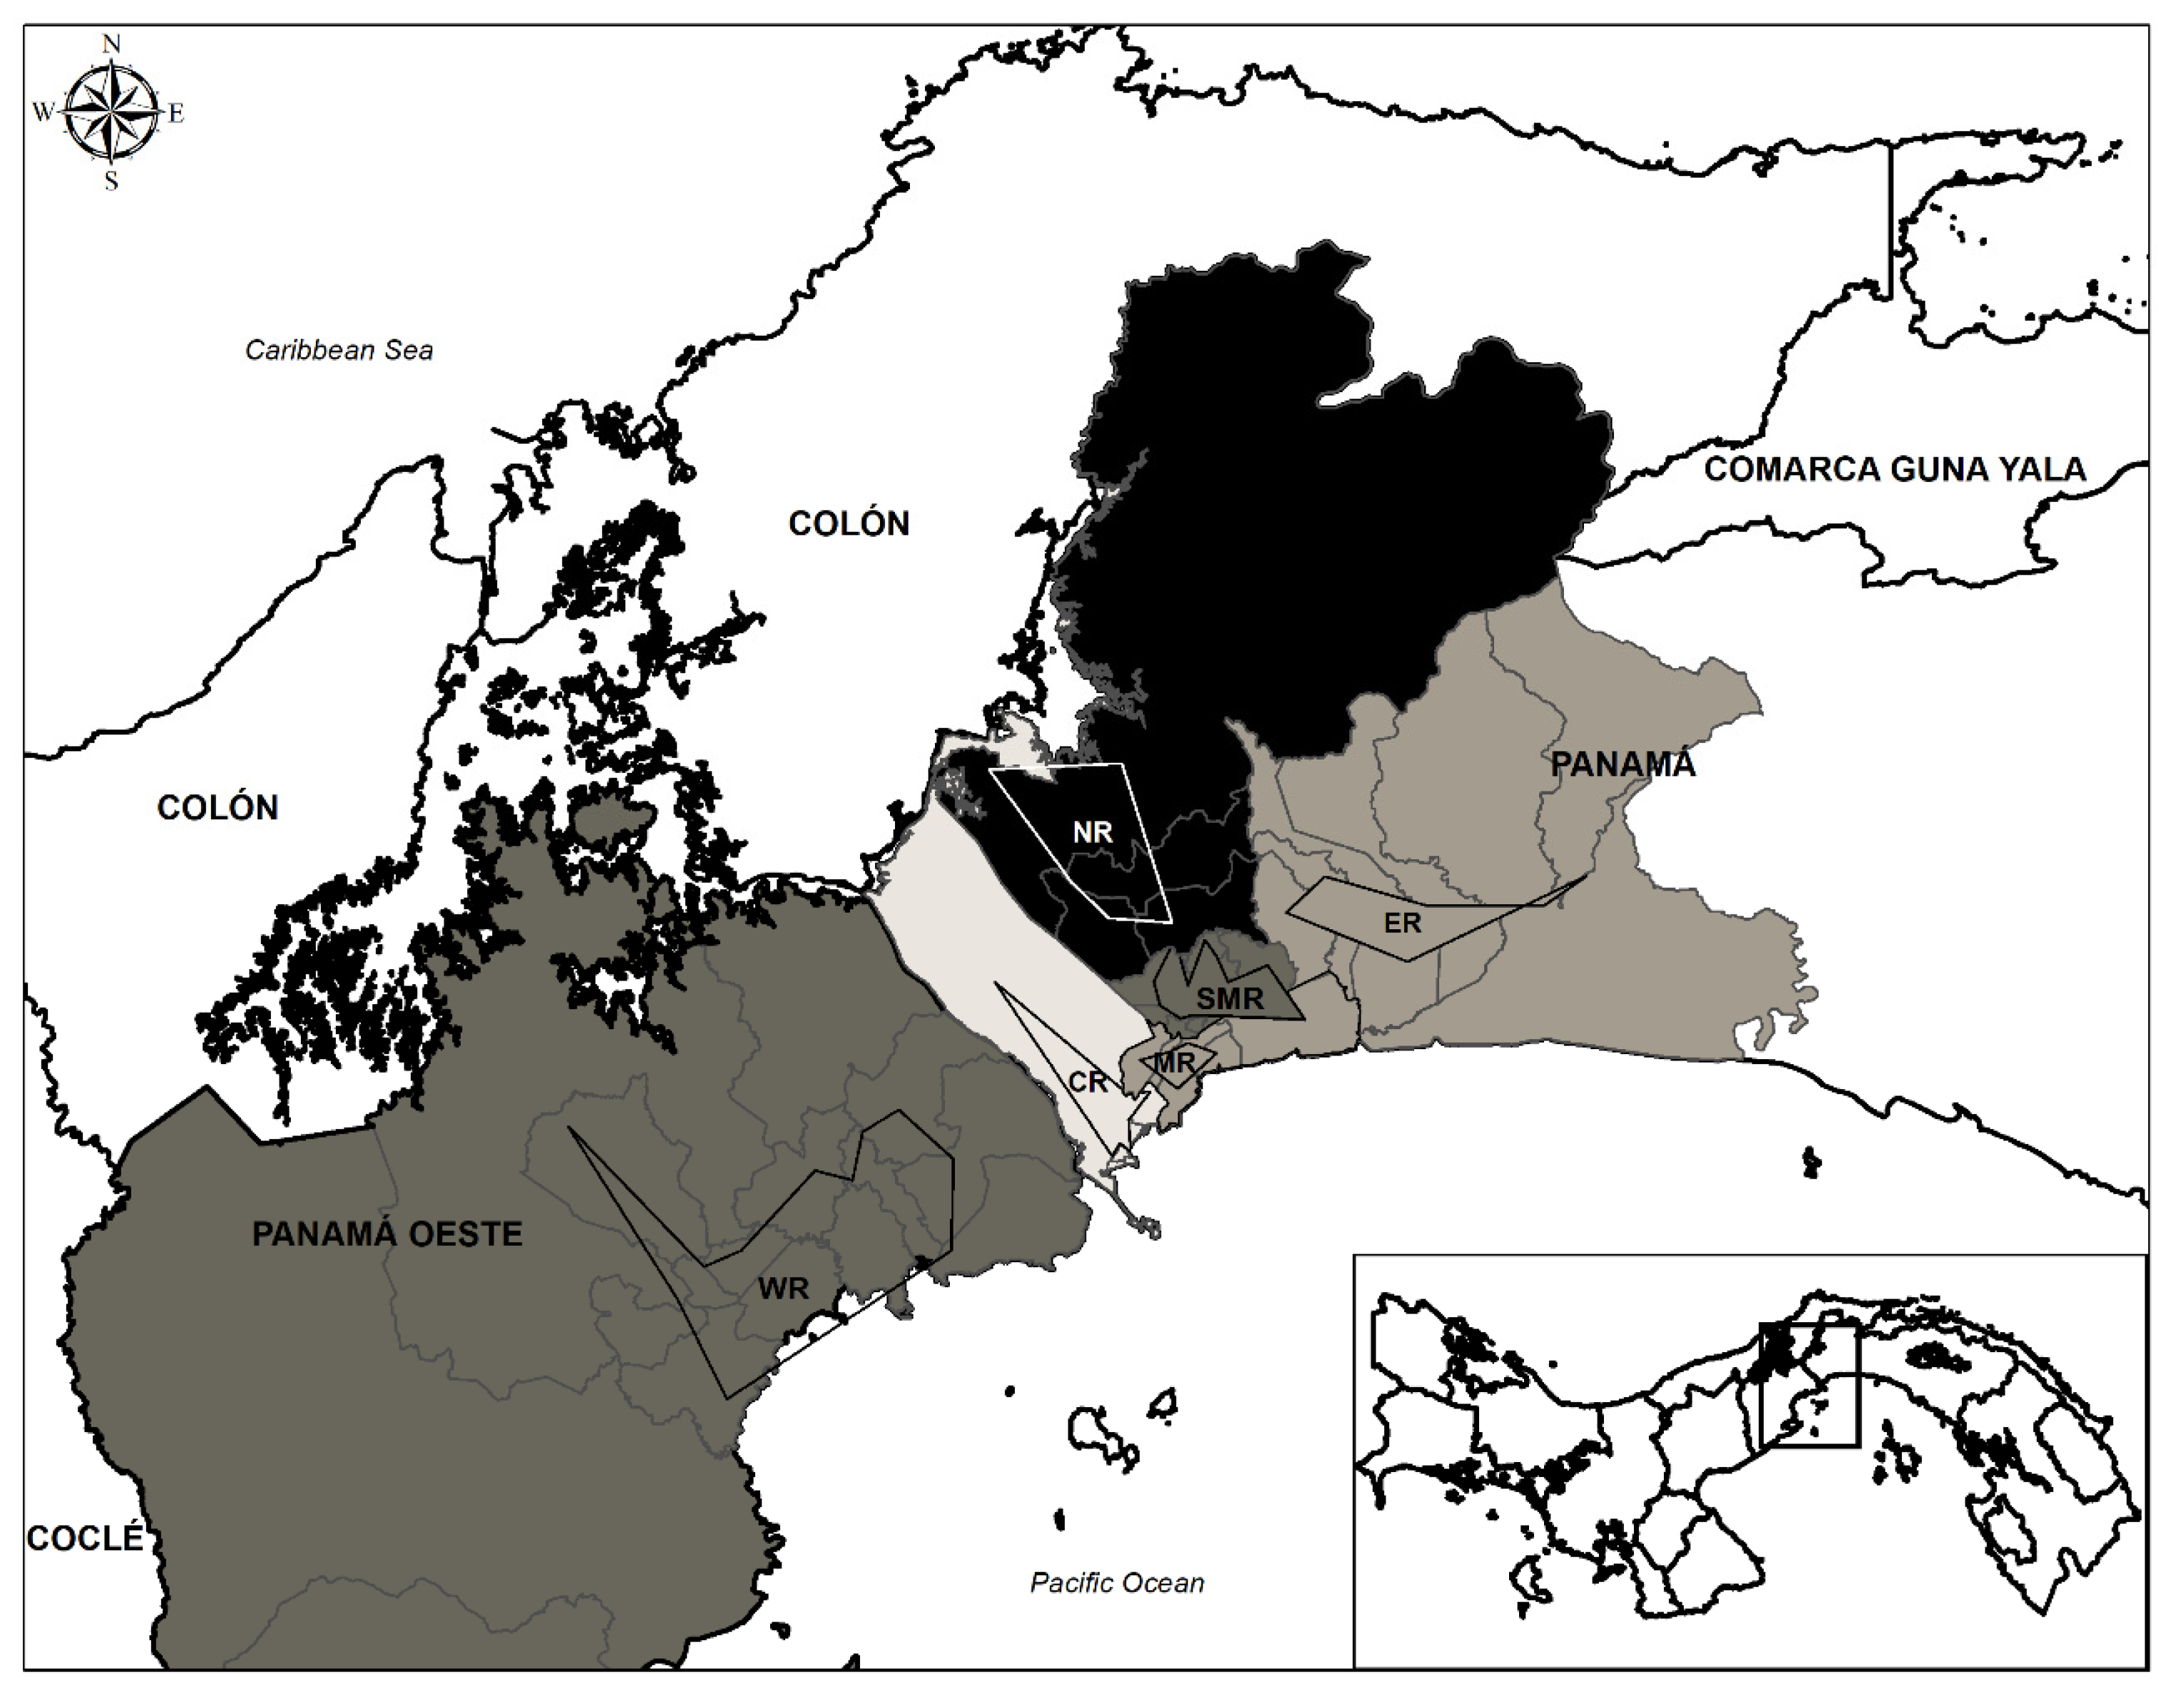
2.3. Geographic Area Studied

This study was conducted in different regions of the province of Panama defined as: the Central (9°0′3.86″N 79°34′12.60″O, area: 29,000 m2), Metro (9°0′14.66″N 79°30′30.93″O, area: 14,957 m2), East (9°5′34.47″N 79°21′9.73″O, area: 18,332 m2), North (9°5′35.79″N 79°33′24.55″O, area: 102,386 m2) and San Miguelito regions (9°3′19.99″N 79°29′14.12″O, area: 23,826 m2). The West region located in the Province of West Panama (8°47′40.84″N 79°45′36.16″O, area: 103,508 m2) was also included. These coordinates were defined and generated using the Google Earth Pro program version 7.3.2.5776 (Google Address; 1600 Amphitheatre Parkway, Mountain View, CA, USA). The area of each of the regions studied was delimited by drawing a point from each one of the districts sampled, thereby producing a polygon. From this polygon, the coordinate from a midpoint known as the centroid was obtained. It is possible to find these coordinates in Google Earth by clicking on the “add a placemark” icon, placing the first point as latitude and the second as longitude. Regions were colored according to the mean ± standard deviation percentage of infection of all communities within each region using the GeoDa software version 1.12 (Center for Spatial Data Science—University of Chicago, Chicago, IL, USA). For visualization of the studied regions, a final map was generated using the Arcgis software version 10.1 (Environmental Systems Research Institute, Redlands, CA, USA).
The samples collected in this study come from 46 communities distributed as follows: 7 communities in the Central region, 6 in the Metro region, 6 in the East region, 9 in the San Miguelito region, 12 in the West region and 6 in the North region. Some communities within the San Miguelito and West regions showed variations in their sample size. However, this did not affect inter-regional analysis given that the spatial distributions of the samples collected in each of the six analyzed regions remained homogeneous, and that the sampling was based on the areas with the highest human population density, where feral dogs and cats have the highest number of interactions. The communities described in Table 1 and Table 2 only reflect the provenance of the samples, and it is through the confidence intervals shown in the tables that it was possible to observe the range of variation of the percentages of positivity found in each of the studied regions.

2.4. Data Collection and Survey Application

The information for each of the variables analyzed was obtained from a data collection sheet, which was filled out by the veterinarians in charge of sampling. Animal data included: age, weight, sex, species and origin of the animal. All this information was collected over a period of one and a half years between September 2017 and March 2019. The chronological ages of the animals were estimated, considering the growth of different types of teeth (incisors, canines, premolars and molars) for younger animals, and the degree of wear to determine the ages of adult cats and dogs. This methodology was performed following previously established protocols [35,36,37]. A survey was also applied to the people responsible for the animals at that moment, or to the people who captured these animals. The questions focused on each animal’s behavior at the time of capture (interaction with other stray animals and whether ingestion of any type of food was observed before capture).

2.5. Sample Collection

A total of 3 mL of whole blood was collected from 319 feral dogs and 351 feral cats, using the venipuncture procedure through the femoral, jugular and cephalic veins. The samples were placed in tubes of the brand BD vacutainer®, without anticoagulant and with a separator gel formed of silica particles that helped separate the serum from the rest of the blood components. The transport of the sample to the Diagnosis Laboratories of INDICASAT AIP was carried out in a container (mini cooler) with small ice packs. The sera samples were separated by centrifugation for further serological tests for the detection of anti-T. gondii, anti-feline leukemia and anti-immunodeficiency virus IgG and IgM antibodies.

2.6. Serological Diagnosis

2.6.1. ELISA for the Detection of Anti-T. gondii IgG Antibodies

The detection of IgG antibodies against T. gondii, in samples of stray dogs and cats, was performed through indirect enzyme-linked immunosorbent assay (ELISA), using the commercial kit ID Screen Toxoplasmosis Indirect Multi species (ID.vet Innovative Diagnostics, Grabels, France), following the manufacturer’s instructions. Microplates were read at 450 nm using a Multiskan™ FC Microplate Photometer version 1.01.14 model 2 (Thermo Fisher Scientific, Waltham, MA, USA). Sera with an optical density greater than 0.350 were considered positive as described in the technical information of the kit’s manual.

2.6.2. Immunochromatography Assay for the Detection of Anti-T. gondii IgM Antibodies

The commercial test Nova®test (Atlas link technology Co., LTD, Beijing, China) based on sandwich lateral flow immunochromatography assay was used for the qualitative detection of anti-T. gondii IgM antibodies. Serum samples collected from all felines in the study were analyzed. The procedures and test results were performed and analyzed according to the manufacturer’s instructions.

2.6.3. Immunochromatography Assay for the Detection Anti-Feline Leukemia (FeLV) and Immunodeficiency Virus (FIV) Antibodies

Immunosuppressive diseases such as leukemia and feline AIDS were identified in cat sera using the Anigen Rapid FIV Ab/FeLV Ag Test kit (Bionote, Inc, Hwaseong, Gyeonggi, Korea) based on immunochromatography. This immunoassay was capable of detecting specific antibodies against the feline immunodeficiency virus and antigens secreted by the leukemia virus with high accuracy. The methodology used in this test was performed according to the manufacturer’s technical information.

2.7. Statistical Analysis

Prevalence values and basic descriptive statistics were calculated using built-in statistical functions of R version 4.0.0 (R Core Team, Vienna, Austria) [38]. The dimensionality of the dataset was reduced using a multiple correspondence analysis (MCA), which is an extension of correspondence analysis (CA) that allows for the evaluation of the pattern of relationships of several categorical variables using geometrical methods by locating each variable/unit of analysis as a point in a low-dimensional space. The MCA can be considered a generalization of principal component analysis (PCA) when the variables to be analyzed are categorical instead of quantitative [39]. Briefly, the data were reduced using the Burt’s method, as implemented in the R package FactoMineR version 1.34 [40]. Results were visualized using the factoextra R package version 1.0.5, which is based on ggplot2 for elegant visualization [41,42]. The relationships between variable categories are interpreted as follows: (1) variable categories that are grouped together share similar profiles and (2) negatively correlated variable categories are positioned on opposed quadrants.
For estimation of the associations between toxoplasmosis and immunosuppressive diseases, a chi-square (χ2) test was performed using GraphPad Prism version 6.1 (GraphPad Software Inc., San Diego, CA, USA). The chi-square test was also used to determine the likelihood that the difference in conversion rates between a given variation and the baseline is not due to random chance between the regions studied. The alpha value for statistical significance was set at 0.05.

3. Results

3.1. Frequency of T. gondii in Stray Dogs and Cats of Panama City and West Panama

The seroprevalence for T. gondii infection in the population of dogs and cats in the total studied area (Panama City and West Panama) was 23.73% (95% CI: 20.59–27.17). No significant difference in percentage of positivity was found between dogs (25.70%, 95% CI: 21.07–30.93) and cats (21.93%, 95% CI: 17.79–26.71) when the Chi-square test was applied with an alpha cut-off value of 0.05 (X2 = 0.0198, df = 1, p = 0.888). The mean ages estimated for the dog and cat populations were 15.69 ± 1.26 and 7.33 ± 0.44 months respectively. The highest seroprevalence of T. gondii infection was observed in the North region (28.86%, 95% CI: 20.34–39.09) followed by the West (26.66%, 95% CI: 17.42–38.34) and San Miguelito (26.45%, 95% CI: 19.85–34.24) regions. The Central, Metro and East regions showed lower seroprevalences with values of 17.39%, 21.73% and 23.33% respectively (95% CI: 11.67–24.97; 14.81–30.60; 15.33–33.65) (Table 1) (Figure 1). Statistical analysis showed a significant difference only between the Central (17.39%) and North (28.86%) regions (X2 = 4.353, df = 1, p = 0.037). When the percentages of infection in dogs and cats were compared within each region, no significant differences were found either (Table 1).

3.2. Early Infection of T. gondii in Stray Dogs and Cats

The overall percentages of early infection of toxoplasmosis for dogs (2.82%, 95% CI: 1.38–5.47) and cats (7.69%; 95% CI: 5.22–11.12) for the total area studied, showed a statistically significant difference when both populations were compared (X2 = 7.798, df = 1, p = 0.0052). However, the detection of IgM antibodies in the dog population was low or null in some of the analyzed regions. In contrast, almost all regions showed recent infection in the cat population, except the West region, in which early T. gondii infection was only detected in dogs. The San Miguelito and North regions were the only ones that showed cases of recent T. gondii infection in both species, cats being the species with the highest number of early-infected individuals. A statistically significant difference between early-infected dogs (2.10%, 95% CI: 0.36–8.12) and cats (18.33%, 95% CI: 9.93–30.85) was found for the San Miguelito region (X2 = 12.604, df = 1, P = 0.0003), but not for the North region (X2 = 0.074, df = 1, p = 0.785). In the latter region, the T. gondii early infection rates remained similar for both species (8.62% for dogs and 10.25% for cats) (95% CI: 3.22–19.72; 3.34–25.16). A high percentage of primary T. gondii infection was also observed in felines of the East region with 16.66% positivity (95% CI: 8.36–29.79). In the Central and Metro regions the percentages of primary infection were lower with values of 1.06% (95% CI: 0.05–6.62) and 2.66% (95% CI: 0.46–10.17) respectively.

3.3. T. gondii Infection and Its Association with Immunosuppressive Diseases

Cat samples were analyzed for the presence of feline immunodeficiency virus (FIV) and/or feline leukemia virus (FeLV): 11.39% (95% CI: 8.36–15.30) of the total number of evaluated cats were positive for immunosuppressive diseases (9.68% for FIV, 0.85% for FeLV and 0.85% for FIV/FeLV) (95% CI: 6.89–13.39; 0.20–2.69; 0.20–2.69), and 5.12% (95% CI: 3.16–8.13) presented coinfection of immunosupressive viruses with T. gondii. Statistical analyses showed that there is a strong association between infection by T. gondii and these diseases (χ2 = 14.02, df = 4, p = 0.007). The Central (7.44%, 95% CI: 3.30–15.24) and Metro (9.33%, 95% CI: 4.15–18.85) regions showed the highest percentages of positive cats for both infections (mean ages of 5.58 ± 0.49 and 7.16 ± 0.92 months for each region respectively). For the East, San Miguelito and West regions, lower percentages of positivity were observed with values of 1.85%, 3.33% and 3.44% respectively (95% CI: 0.09–11.18; 0.58–12.55; 0.18–19.63). The population of cats for the North region did not show any positive case of concomitant infection. When statistical analyses were performed individually for each of the immunosuppressive diseases (FIV and FeLV), and no association was observed with T. gondii infection (Table 2).

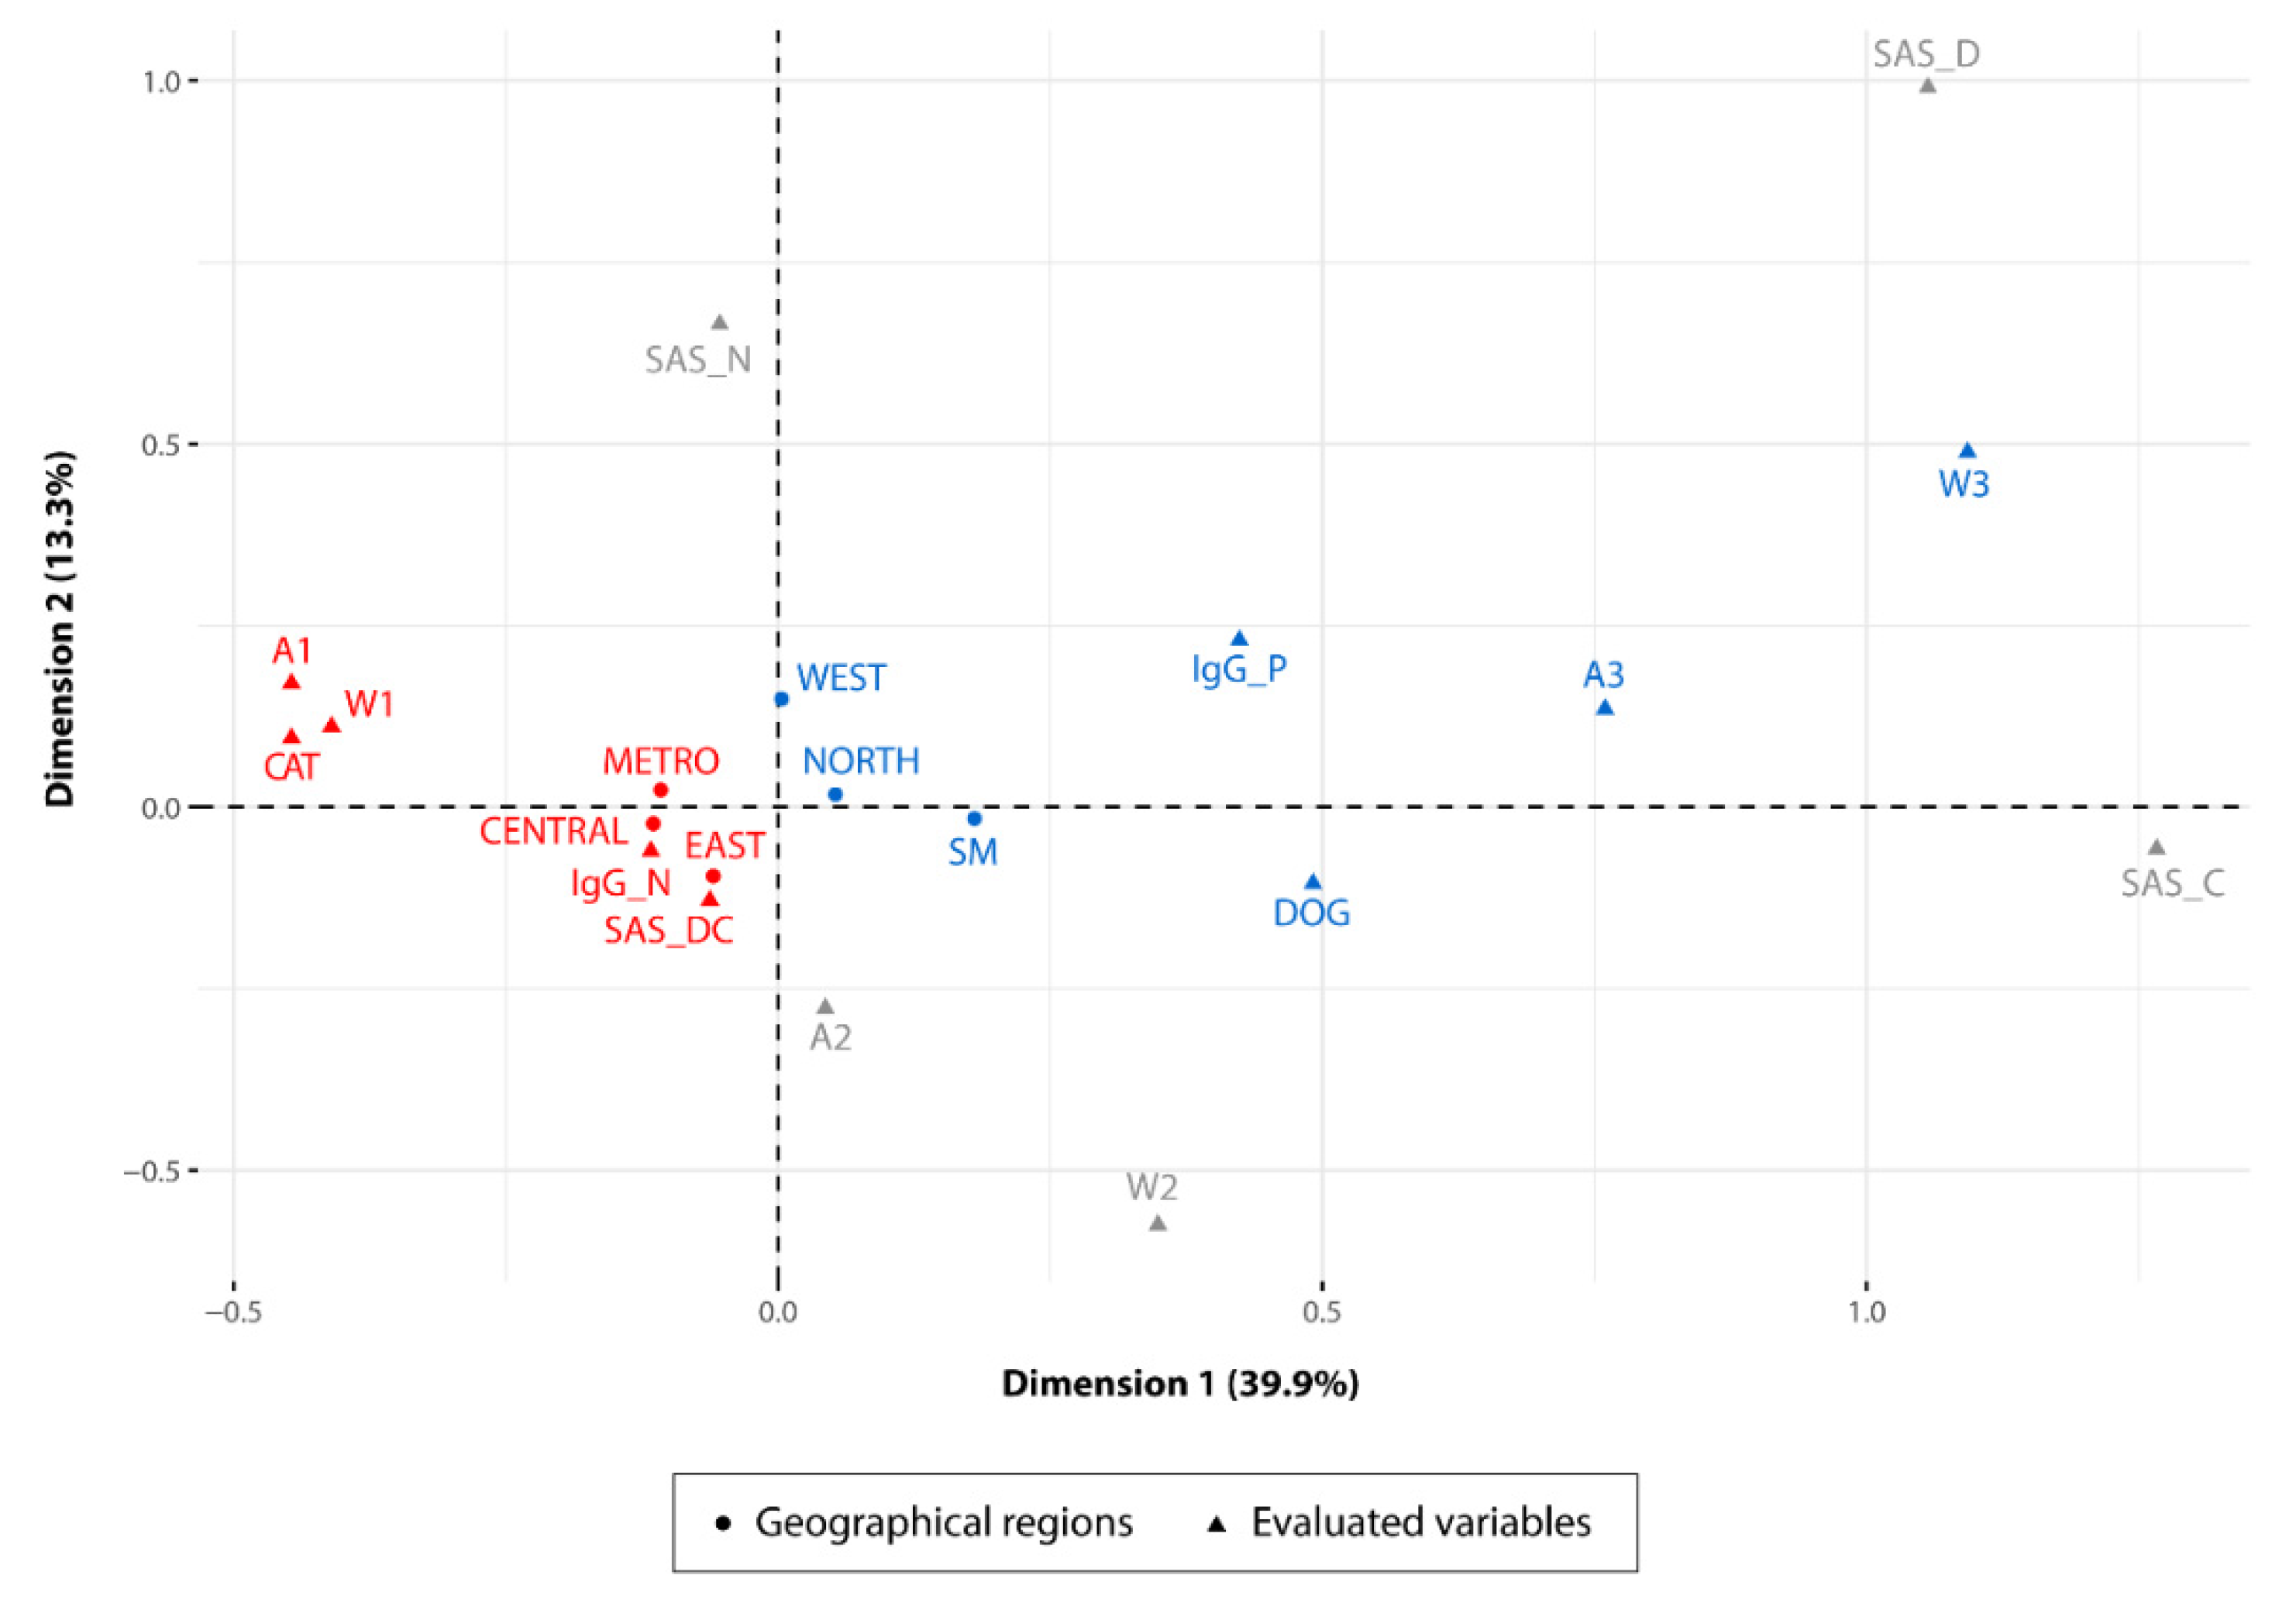
3.4. Risk Factors Associated with T. gondii Infection in the Different Regions

A set of variables, including intrinsic characteristics of dogs and cats (age and behavior) and factors related to their environment, were evaluated through multiple correspondence analysis (MCA). This analysis showed how some regions formed clusters associated with specific variables that could be associated with transmission dynamics in the different regions studied. For example: The West, North and San Miguelito regions were more associated with positive cases in dogs (IgG_P) and with the highest age and weight ranges observed in the sampled population. Conversely, the Central, Metro and East regions showed a higher level of association with the negative cases in juvenile cats and with the lowest weight range found in the population analyzed. Furthermore, cats in the latter regions were also associated with the interaction with other stray dogs and cats (Figure 2).

4. Discussion

Central American countries have a humid tropical climate which favors the maintenance of soils and water sources contaminated with T. gondii oocysts [43]. These factors together with the interaction between domestic and wild animals ensure the maintenance of transmission cycles. Therefore, studies in stray animals inhabiting these regions could aid in determining the level of parasite oocyst contamination in urban and rural regions. Unfortunately, in these regions of Latin America, little is known about the frequency of T. gondii infection in stray dogs and cats. Studies carried out over the 80s and 90s in urban and rural regions of Panama City showed high prevalence in domestic animals and in humans of different ages [33,44]. Currently, there are no updated reports on the level of environmental contamination by oocysts and the frequency of infection in humans or stray animals. Therefore, in this study, we focused on determining the frequency of T. gondii infection in stray dogs and cats in different urban regions of Panama City and West Panama, and analyzing different risk factors associated with the T. gondii infection and maintenance of transmission cycles of the parasite.
The frequencies of T. gondii infection in the total populations analyzed of dogs and cats were 25.70% and 21.93% respectively, which may be an indicator of high oocyst environmental contamination in the entire studied area. Additionally, we can suggest that both species may be exposed to similar risk factors, since there was no statistically significant difference between their T. gondii infection frequencies. Possibly, these factors are linked to the ingestion of food thrown in garbage cans and rubbish on the streets. Analysis of the stratified data by region indicated some differences in the frequency of T. gondii infection. In this sense, almost all regions under study (Metro (21.73%), East (23.33%), San Miguelito (26.45%) and West (26.66%) had a homogeneous infection frequency in the total population of animals analyzed with no statistically significant difference. However, two regions (Central (17.39%) and North (28.86%), characterized by having substantially different socioeconomic factors, showed a statistically significant difference [45]. The percentage of positives for the entire population of stray dogs and cats was 23.73%. This value was lower than the one found in a study carried out on pets (dogs and cats) from Panama City and West Panama, which showed an overall percentage of positives of 30.73% [34]. However, when comparing the percentages by region of both studies, very similar frequencies were observed in two of the studied regions (San Miguelito and West Panama). The Central region presented some discrepancies regarding the analyzed communities; therefore, no inference could be made between the animal populations. The East region presented a clear difference between T. gondii infection frequencies of the two populations, showing 23.33% for stray animals and 39.56% for pets. These variations are possibly due to differences in the timing of the studies and varying environmental conditions. However, a higher percentage of T. gondii infection in pets may be probably related to the habits of some owners of feeding their pets with raw meat. Conversely, a study in Bangkok described a higher T. gondii prevalence in stray dogs and cats than those in households [46]. The frequencies of T. gondii infection in stray animals are generally higher than those reported in pets [7]. Nonetheless, a high prevalence in pets has been shown in studies carried out in Asia (34.61–57.14%), Latin America (26.90–95.80%) and Europe (32.80–48.40%) [32,47,48,49,50].
The multiple correspondence analysis (MCA) was a tool used in this study to analyze the pattern of relationships of several risk factors involved in the different transmission pathways that may be occurring in each of the regions under study. The results obtained through the MCA showed the association of a set of specific variable categories for some regions. In San Miguelito, North and West regions, dogs 13 months old or older (A3) and weighing less than 12 pounds were more associated with the positive cases (IgG_P) for T. gondii infection (Figure 2). This association suggests that the transmission of the parasite in 50% of the dogs that were positive in these regions required an exposure time equal to or greater than 13 months. The remaining percentage of positivity in dogs was distributed between the age ranges of 1–5 months (A1; 18.1%) and 6–12 months (A2; 30.9%), displaying an increase of T. gondii infection closely related to the age of the animal. Adult dogs have a longer exposure time to different risk factors that may increase the chances of infection and contribute to the spread of the parasite in the environment [51]. These animals can ingest oocysts which are subsequently eliminated through the feces without any process of multiplication of the parasite occurring [52]. The ingestion of oocysts is closely related to the dog coprophagic habits and to an environment highly contaminated by oocysts. In fact, several authors suggest that the frequency of T. gondii infection in stray dogs can help to estimate the level of environmental contamination produced by the release of oocysts in the feces of cats. This alternative strategy has been adopted because so far there are no efficient methods to measure the level of environmental contamination by oocyst [16,53,54]. Furthermore, T. gondii infection in dogs could also be associated with the ingestion of leftover meat thrown into the street or in trash enclosures easily accessible to these animals. Unfortunately, these regions do not have an organized garbage collection system that operates efficiently in all their communities, which increases accessibility to leftover meat, thereby potentially enhancing transmission of the parasite mainly in dogs [55]. In addition, two of these regions (San Miguelito and West Panama) have a higher density of houses by area, which could promote a greater interaction between stray animals and humans [45,56]. Therefore, dogs can keep transmission cycles active and increase the frequency of T. gondii infection among stray animals.
The Metro, Central and East regions showed a different T. gondii infection dynamic. These regions were more associated with the negative cases for T. gondii infection in the cat population. From the total of negative cats, 56.75% were associated with the lower age (A1 = 1–5 months) and weight (W1 = 0–5 pounds) ranges, and with the interaction with other stray dogs and cats (SAS_DC) (Figure 2). These results suggest that cats under 5 months of age seem to have a lower risk of T. gondii infection when compared to cats of higher age ranges (A2 = 6–12 months). Therefore, exposure time is also an important risk factor in the cat population [57]. The chances of T. gondii infection in cats older than 6 months possibly increase due to the hunting skills acquired and perfected over time [58,59]. An experienced cat will be able to hunt a greater number of animals of different species. Conversely, the interaction of juvenile cats with other stray dogs and cats (SAS_DC), does not seem to be an important risk factor for the transmission of the parasite in these regions, which may be indicative of a lower environmental contamination by oocysts.
Prevalence of IgM antibodies in the total populations of dogs and cats studied was 2.82% and 7.69% respectively. These antibodies can help to estimate in some individuals the time range in which the infection occurred and the phase of the disease (acute or chronic). Unfortunately, some cats do not develop a detectable IgM response, but in those with detectable IgM titers, this response can persist for up to sixteen weeks after T. gondii infection [13]. In this sense, the animals that were positive for IgM and negative for IgG antibodies, were possibly in the most acute phase of a primary infection with T. gondii. In this study, cats were the only species in which IgM+/IgG- individuals were found, representing 3.98% of the total population of cats. It is possible that those cats are releasing cysts; however, the release of oocysts can only be confirmed by fecal flotation or by molecular techniques such as PCR (polymerase chain reaction). On the contrary, the highest percentage of IgM-positive animals was found in the age range of 0–5 months (A1) for both species. Statistical analyses did not show significant differences for the percentages found between dogs (2.5%) and cats (5.98%) (data not shown). Therefore, it is possible that both species are exposed to the same risk factors at an early age.
Another risk factor analyzed in this study was the association between T. gondii infection and immunosuppressive diseases (FIV and FeLV) in cats. The results of the chi-square statistic (χ2) demonstrated a strong association between toxoplasmosis and FIV. Except for a single individual, none of the coinfected cats had detectable IgM titers against T. gondii. In addition, almost all coinfected cats were in the age range between 0 and 12 months. The Central and Metro regions had the highest coinfection frequencies (7.44%–10.76%) when compared to the other regions (1.85%–3.44%). It is possible that in these regions, cat populations have greater interactions between each other, which can generate a greater number of fights that promote the transmission of FIV. Studies in cats with coinfections between T. gondii and FIV showed a decrease in CD4+ and CD8+ lymphocytes, a decrease in B cells and reactivation of the parasite. Pneumonia and hepatic necrosis are some of the most severe pathologies reported in these animals [60]. However, the release of oocysts in these animals has not yet been well defined. In the total population of cats analyzed for T. gondii and immunosuppressive diseases (FIV and FeLV), the infectious agent showing the highest frequency was T. gondii in 21.93% of the cases, followed by FIV (9.68%) and at a lower percentage was FeLV (0.85%). These variations in the frequency of these infections may indicate the effectiveness of T. gondii transmission cycles and the adaptive success of this parasite in urban regions.

5. Conclusions

The infection frequency with T. gondii is similar in populations of dogs and cats that are exposed to risk factors inherent to urban environments. Therefore, differences in the natural behavior of each species do not seem to have a significant effect in increasing T. gondii infection. The ingestion of food waste in regions with higher availability may be an important risk factor for both species. In this sense, socioeconomic and environmental factors specific to each geographic region seem to be associated with the increase or decrease in T. gondii infection frequencies. Uncontrolled proliferation of these animals and the lack of a good garbage collection system are factors that can promote the spread of T. gondii infection in both urban and rural regions. Moreover, in both species the risk of contracting the T. gondii infection increases with the age of these animals.

Author Contributions

Conceptualization, Z.C.E.; methodology, Z.C.E.; validation and formal analysis, Z.C.E., L.F. and C.M.R.; investigation, L.F., C.M.R., A.T., D.S., P.C., D.P., A.C. and Z.C.E.; writing—original draft preparation Z.C.E., L.F. and C.M.R.; writing—review and editing, L.F., C.M.R., A.T., D.S. and Z.C.E., funding acquisition Z.C.E. All authors have read and agreed to the published version of the manuscript.

Funding

This research was funded by the Secretaria Nacional de Ciencia, Tecnología e Innovación (SENACYT), Panamá, grant number 2017-4-ITE16-R2-012, and Sistema Nacional de Investigación (SNI), Panamá, number 214-2017.

Acknowledgments

The authors are very grateful to Secretaria Nacional de Ciencia, Tecnología e Innovación (SENACYT) and Sistema Nacional de Investigación (SNI) for financial support to this project. We specially thank Alejandro Llanes for his assistance in figure formatting and Delba Villalobos for their support with the preliminary maps used to define the regions studied.

Conflicts of Interest

The authors declare no conflict of interest.

References

  1. Ferreira Feitosa, T.; de Lima Brasil, A.W.; Nunes Parentoni, R.; Ribeiro Vilela, V.L.; Ferreira Lopes Nety, T.; Pena, H.F.D.J. Anti-Toxoplasma gondii antibodies in mammals, birds and reptiles at the zoological-botanical park in João Pessoa, Paraíba, Brazil. Arq. Inst. Biol. 2017, 84, e0022016. [Google Scholar] [CrossRef] [Green Version]
  2. Black, M.W.; Boothroyd, J.C. Lytic cycle of Toxoplasma gondii. Microbiol. Mol. Biol. Rev. 2000, 64, 607–623. [Google Scholar] [CrossRef] [PubMed] [Green Version]
  3. Flegr, J.; Prandota, J.; Sovickova, M.; Israili, Z.H. Toxoplasmosis—A Global Threat. Correlation of Latent Toxoplasmosis with Specific Disease Burden in a Set of 88 Countries. PLoS ONE 2014, 9, e90203. [Google Scholar] [CrossRef] [PubMed] [Green Version]
  4. Vera, C.N.; Linam, W.M.; Gadde, J.A.; Wolf, D.S.; Walson, K.; Montoya, J.G.; Rostad, C.A. Congenital Toxoplasmosis Presenting as Eosinophilic Encephalomyelitis with Spinal Cord Hemorrhage. Pediatrics 2020, 145, e20191425. [Google Scholar] [CrossRef]
  5. Pereira, I.S.; Maia, M.M.; da Cruz, A.B.; Telles, J.P.M.; Vidal, J.E.; Gava, R.; Meira-Strejevitch, C.S.; Pereira-Chioccola, V.L. Plasma extracellular microRNAs are related to AIDS/cerebral toxoplasmosis co-infection. Parasite Immunol. 2020, 42, e12696. [Google Scholar] [CrossRef]
  6. Lindsay, D.S.; Dubey, J.P. Toxoplasmosis in Wild and Domestic Animals. In Toxoplasma gondii, 2nd ed.; Weiss, L.M., Kim, K., Eds.; Academic Press: London, UK, 2007; pp. 133–152. [Google Scholar]
  7. Tenter, A.M. Toxoplasma gondii in animals used for human consumption. Mem. Inst. Oswaldo Cruz 2009, 104, 364–369. [Google Scholar] [CrossRef] [Green Version]
  8. Robert-Gangneux, F.; Darde, M.L. Epidemiology of and Diagnostic Strategies for Toxoplasmosis. Clin. Microbiol. Rev. 2012, 25, 264–296. [Google Scholar] [CrossRef] [Green Version]
  9. Duan, G.; Tian, Y.M.; Li, B.F.; Yang, J.F.; Liu, Z.L.; Yuan, F.Z.; Zhu, X.Q.; Zou, F.C. Seroprevalence of Toxoplasma gondii infection in pet dogs in Kunming, Southwest China. Parasit. Vectors 2012, 5, 118. [Google Scholar] [CrossRef] [Green Version]
  10. Ding, H.; Gao, Y.M.; Deng, Y.; Lamberton, P.H.; Lu, D.B. A systematic review and meta-analysis of the seroprevalence of Toxoplasma gondii in cats in mainland China. Parasit. Vectors 2017, 10, 27. [Google Scholar] [CrossRef] [Green Version]
  11. Benitez, A.D.N.; Martins, F.D.C.; Mareze, M.; Santos, N.J.R.; Ferreira, F.P.; Martins, C.M.; Garcia, J.L.; Mitsuka-Breganó, R.; Freire, R.L.; Biondo, A.W.; et al. Spatial and simultaneous representative seroprevalence of anti-Toxoplasma gondii antibodies in owners and their domiciled dogs in a major city of southern Brazil. PLoS ONE 2017, 12, e0180906. [Google Scholar] [CrossRef]
  12. Cong, W.; Elsheikha, H.M.; Zhou, N.; Peng, P.; Qin, S.Y.; Meng, Q.F.; Qian, A.D. Prevalence of antibodies against Toxoplasma gondii in pets and their owners in Shandong province, Eastern China. BMC Infect. Dis. 2018, 18, 430. [Google Scholar] [CrossRef]
  13. Lappin, M.R. Update on the diagnosis and management of Toxoplasma gondii infection in cats. Top Companion Anim. Med. 2010, 25, 136–141. [Google Scholar] [CrossRef] [PubMed] [Green Version]
  14. Dubey, J.P. Duration of immunity to shedding of Toxoplasma gondii oocysts by cats. J. Parasitol. 1995, 81, 410–415. [Google Scholar] [CrossRef] [PubMed]
  15. Dubey, J.P.; Lappin, M.R.; Thulliez, P. Long-term antibody responses of cats fed Toxoplasma gondii tissue cysts. J. Parasitol. 1995, 81, 887–893. [Google Scholar] [CrossRef] [PubMed]
  16. Meireles, L.R.; Galisteo, A.J., Jr.; Pompeu, E.; Andrade, H.F., Jr. Toxoplasma gondii spreading in an urban area evaluated by seroprevalence in free-living cats and dogs. Trop. Med. Int. Health 2004, 9, 876–881. [Google Scholar] [CrossRef]
  17. Pereira, P.F.; Barbosa, A.D.S.; Santos, A.L.C.; Bolais, P.F.; Darde, M.L.; Amendoeira, M.R.R. Toxoplasma gondii: Infection among shelter and stray cats in Rio de Janeiro, Brazil. Rev. Bras. Parasitol. Vet. 2018, 27, 401–408. [Google Scholar] [CrossRef]
  18. De Almeida, J.C.; Frehse, M.S.; Navarro, I.T.; Garcia, J.L.; Biondo, A.W.; Freire, R.L. Comparison of indirect fluorescent antibody test and the modified agglutination test for the detection of Toxoplasma gondii antibodies in stray dogs from Southern Brazil. Acta Parasitol. 2016, 61, 694–696. [Google Scholar] [CrossRef]
  19. Enriquez, G.F.; Macchiaverna, N.P.; Argibay, H.D.; Lopez Arias, L.; Farber, M.; Gurtler, R.E.; Cardinal, M.V.; Garbossa, G. Polyparasitism and zoonotic parasites in dogs from a rural area of the Argentine Chaco. Vet. Parasitol. Reg. Stud. Reports 2019, 16, 100287. [Google Scholar] [CrossRef]
  20. Fernandez, F.; Ouvina, G.; Clot, E.; Fernandes Guido, R.; Codoni, C. Prevalence of Toxoplasma gondii antibodies in cats in the western part of Great Buenos Aires, Argentina, 1993. Vet. Parasitol. 1995, 59, 75–79. [Google Scholar] [CrossRef]
  21. Lopéz, C.; Daprato, B.; Zampolini, S.; Mazzeo, C.; Cardillo, N.; Sommerfelt, I. Risk factors and prevalence of IgG antibodies to Toxoplasma gondii in domestic cats. La Matanza, Buenos Aires, Argentina. Rev. Ibero. Latinoam. Parasitol. 2011, 70, 29–34. [Google Scholar]
  22. Alejandro Binda, J.; Beatriz Trova, G.; Alonso, M.J.; Pereyra, W.R.; Negrette, O.S. Presencia de infección por Trypanosoma cruzi y Toxoplasma gondii en perros domésticos de localidades rurales en el Noroeste Argentino. Revista de Patologia Tropical 2016, 45, 66–76. [Google Scholar] [CrossRef] [Green Version]
  23. Ovalle, F.; García, A.; Thibauth, J.; Lorca, M. Frecuencia de anticuerpos anti Toxoplasma gondii en gatos de la ciudad de Valdivia, Chile. Boletin Chileno de Parasitologia 2000, 55, 94–99. [Google Scholar] [CrossRef] [PubMed]
  24. Troncoso Toro, I.E.; Uribe Henríquez, P.A.; Arrué Brenet, K.C.; Valenzuela Contreras, A.A.; Fischer Wiethuchter, C. Seroprevalencia de Toxoplasma gondii en gatos (Felis catus, Linnaeus 1758) residentes en San Carlos, Chile. Rev. Med. Vet. 2015, 29, 23–31. [Google Scholar] [CrossRef]
  25. Barros, M.; Cabezón, O.; Dubey, J.P.; Almería, S.; Ribas, M.P.; Escobar, L.E.; Ramos, B.; Medina-Vogel, G. Toxoplasma gondii infection in wild mustelids and cats across an urban-rural gradient. PLoS ONE 2018, 13, e0199085. [Google Scholar] [CrossRef]
  26. Dubey, J.P.; Cortés-Vecino, J.; Vargas-Duarte, J.; Sundar, N.; Gopal Viswanthan, V.; Bandini, L.M.; Polo, L.J.; Mora, L.E.; Smith, T.; Su, C. Prevalence of Toxoplasma gondii in dogs from Colombia, South America and genetic characterization of T. gondii isolates. Vet. Parasitol. 2007, 145, 45–50. [Google Scholar] [CrossRef]
  27. Cerro, L.; Rubio, A.; Pinedo, R.; Mendes-de-Almeida, F.; Brener, B.; Labarthe, N. Seroprevalence of Toxoplasma gondii in cats (Felis catus, Linnaeus 1758) living in Lima, Peru. Rev. Bras. Parasitol. Vet. 2014, 23, 90–93. [Google Scholar] [CrossRef] [Green Version]
  28. Cerro, T.L.; Chávez, V.A.; Casas, A.E.; Suárez, A.F.; Rubio, V.A. Frecuencia de Toxoplasma gondii en gatos de Lima Metropolitana y concordancia entre las técnicas de inmunofluorescencia indirecta y hemaglutinación indirecta. Revista de Investigaciones Veterinarias del Perú 2009, 20, 285–290. [Google Scholar] [CrossRef]
  29. Dubey, J.P.; López-Torres, H.Y.; Sundar, N.; Velmurugan, G.V.; Ajzenberg, D.; Kwok, O.C.H.; Hill, R.; Dardé, M.L.; Su, C. Mouse-virulent Toxoplasma gondii Isolated from Feral Cats on Mona Island, Puerto Rico. J. Parasitol. 2007, 93, 1365–1369. [Google Scholar] [CrossRef]
  30. Galván Ramírez, M.D.L.L.; Sánchez Vargas, G.; Vielma Sandoval, M.; Soto Mancilla, J.L. Presence of anti-Toxoplasma antibodies in humans and their cats in the urban zone of Guadalajara. Rev. Soc. Bras. Med. Trop. 1999, 32, 483–488. [Google Scholar] [CrossRef] [Green Version]
  31. Alvarado-Esquivel, C.; Romero-Salas, D.; Cruz-Romero, A.; Garcia-Vazquez, Z.; Peniche-Cardena, A.; Ibarra-Priego, N.; Ahuja-Aguirre, C.; Perez-de-Leon, A.A.; Dubey, J.P. High prevalence of Toxoplasma gondii antibodies in dogs in Veracruz, Mexico. BMC Vet. Res. 2014, 10, 191. [Google Scholar] [CrossRef] [Green Version]
  32. Castillo-Morales, V.; Karla, Y.A.-V.; Guzmán-Marín, E.; Jimenez-coello, M.; Segura, J.; Aguilar-Caballero, A.; Ortega, A. Prevalence and Risk Factors of Toxoplasma gondii Infection in Domestic Cats from the Tropics of Mexico Using Serological and Molecular Tests. Interdiscip. Perspect. Infect. Dis. 2012, 2012, 529108. [Google Scholar] [CrossRef] [PubMed] [Green Version]
  33. Etheredge, G.D.; Frenkel, J.K. Human Toxoplasma infection in Kuna and Embera children in the Bayano and San Blas, eastern Panama. Am. J. Trop. Med. Hyg. 1995, 53, 448–457. [Google Scholar] [CrossRef]
  34. Rengifo-Herrera, C.; Pile, E.; Garcia, A.; Perez, A.; Perez, D.; Nguyen, F.K.; de la Guardia, V.; McLeod, R.; Caballero, Z. Seroprevalence of Toxoplasma gondii in domestic pets from metropolitan regions of Panama. Parasite 2017, 24, 9. [Google Scholar] [CrossRef] [PubMed]
  35. Gorrel, C.; Andersson, S.; Verhaert, L. Anatomy of the teeth and periodontium in Veterinary Dentistry for the General Practitioner, 2nd ed.; Elsevier: Amsterdam, The Netherlands, 2013; pp. 37–41. [Google Scholar]
  36. Barton, A. Age Determination in Dogs. Iowa State Univ. Vet. 1939, 2, 18–19. [Google Scholar]
  37. Kara, M.; Burns, L.R.-F. History taking and Physical Exams. In Textbook for the Veterinary Assistant, 1st ed.; Blackwell, W., Ed.; Wiley: Oxford, UK, 2014; p. 61. [Google Scholar]
  38. R: A language and environment for statistical computing. R Foundation for Statistical Computing. R Core Team: Vienna, Austria Version 4.0.0. Available online: https://www.R-project.org/ (accessed on 20 April 2020).
  39. Abdi, H.; Williams, L.J. Principal Component Analysis. Available online: http://staff.ustc.edu.cn/~zwp/teach/MVA/abdi-awPCA2010.pdf (accessed on 23 April 2020).
  40. Lê, S.; Josse, J.; Husson, F. FactoMineR: An R Package for Multivariate Analysis. J. Stat. Softw. 2008, 25, 18, Version 1.34. [Google Scholar] [CrossRef] [Green Version]
  41. Wickham, H. ggplot2: Elegant Graphics for Data Analysis, 2nd ed.; Springer: New York, NY, USA, 2009. [Google Scholar]
  42. Kassambra, A. Factoextra R Package: Easy Multivariate Data Analyses and Elegant Visualization. Version 1.0.5. Available online: http://www.sthda.com/english/wiki/factoextra-r-package-easy-multivariate-data-analyses-and-elegant-visualization#acknoweledgment (accessed on 24 April 2020).
  43. Sukthana, Y. Toxoplasmosis: Beyond animals to humans. Trends Parasitol. 2006, 22, 137–142. [Google Scholar] [CrossRef] [PubMed]
  44. Sousa, O.E.; Saenz, R.E.; Frenkel, J.K. Toxoplasmosis in Panama: A 10-Year Study. Am. J. Trop. Med. Hyg. 1988, 38, 315–322. [Google Scholar] [CrossRef]
  45. Pobreza y Desigualdad en Panamá; Ministerio de Economía y Finanzas de la República de Panamá y Banco Mundial: Panamá, 2015; pp. 61–63. Available online: http://fapobservatorioods.com/wp-content/uploads/2018/09/Pobreza-y-desigualdad-en-Panama-Mapas-a-nivel-de-Distritos-y-Corregimientos-2015.pdf (accessed on 24 April 2020).
  46. Jittapalapong, S.; Nimsuphan, B.; Pinyopanuwat, N.; Chimnoi, W.; Kabeya, H.; Maruyama, S. Seroprevalence of Toxoplasma gondii antibodies in stray cats and dogs in the Bangkok metropolitan area, Thailand. Vet. Parasitol. 2007, 145, 138–141. [Google Scholar] [CrossRef]
  47. Ahmad, F.; Maqbool, A.; Hayat, A. Serological survey of Toxoplasma gondii in dogs and cats. Pakistan Vet. J. 2001, 21, 31–35. [Google Scholar]
  48. Sedlak, K.; Bártová, E. The prevalence of Toxoplasma gondii IgM and IgG antibodies in dogs and cats from the Czech Republic. Vet. Med. 2006, 51, 555–558. [Google Scholar] [CrossRef] [Green Version]
  49. Jokelainen, P.; Simola, O.; Rantanen, E.; Näreaho, A.; Lohi, H.; Sukura, A. Feline toxoplasmosis in Finland: Cross-sectional epidemiological study and case series study. J. Vet. Diagn. Investig. 2012, 24, 1115–1124. [Google Scholar] [CrossRef] [PubMed] [Green Version]
  50. Langoni, H.; Fornazari, F.; da Silva, R.C.; Monti, E.T.; Villa, F.B. Prevalence of antibodies against Toxoplasma gondii and Neospora caninum in dogs. Braz. J. Microbiol. 2013, 44, 1327–1330. [Google Scholar] [CrossRef] [PubMed] [Green Version]
  51. Lopes, A.P.; Granada, S.; Oliveira, A.C.; Brancal, H.; Dubey, J.P.; Cardoso, L.; Vilhena, H. Toxoplasmosis in dogs: First report of Toxoplasma gondii infection in any animal species in Angola. Pathog. Glob. Health 2014, 108, 344–346. [Google Scholar] [CrossRef] [PubMed] [Green Version]
  52. Lindsay, D.S.; Dubey, J.P.; Butler, J.M.; Blagburn, B.L. Mechanical transmission of Toxoplasma gondii oocysts by dogs. Vet. Parasitol. 1997, 73, 27–33. [Google Scholar] [CrossRef]
  53. Yan, C.; Fu, L.L.; Yue, C.L.; Tang, R.X.; Liu, Y.S.; Lv, L.; Shi, N.; Zeng, P.; Zhang, P.; Wang, D.H.; et al. Stray dogs as indicators of Toxoplasma gondii distributed in the environment: The first report across an urban-rural gradient in China. Parasit. Vectors 2012, 5, 5. [Google Scholar] [CrossRef] [Green Version]
  54. Dumètre, A.; Dardé, M.-L. How to detect Toxoplasma gondii oocysts in environmental samples? FEMS Microbiol. Rev. 2003, 27, 651–661. [Google Scholar] [CrossRef] [Green Version]
  55. Recolección por Corregimiento. Mes-Enero 2019; Autoridad de Aseo Urbano y Domiciliario: Panamá, República de Panamá, 2019; Available online: http://www.aaud.gob.pa/ (accessed on 23 April 2020).
  56. Instituto Nacional de Estadística y Censo (INEC) de la Contraloria General de la República de Panamá. Censo Nacional de Población y Vivienda 2000. Superficie, población y densidad de población del distrito de San Miguelito, según corregimiento: Censos de 1990 a 2000. Resultados Finales Básicos, Distrito de San Miguelito – 2000, cuadro 2. Available online: https://www.inec.gob.pa/publicaciones/Default3.aspx?ID_PUBLICACION=16&ID_CATEGORIA=9&ID_SUBCATEGORIA=53 (accessed on 23 April 2020).
  57. Dubey, J.P. Feline toxoplasmosis and coccidiosis: A survey of domiciled and stray cats. J. Am. Vet. Med. Assoc. 1973, 162, 873–877. [Google Scholar]
  58. Little, S.E. The Cat: Clinical Medicine and Management; Elsevier: Amsterdam, The Netherlands, 2012. [Google Scholar]
  59. Fraser, A.F. Feline Behaviour and Welfare; CABI: Cambridge, MA, USA, 2012; p. 35. [Google Scholar]
  60. Davidson, M.G.; Rottman, J.B.; English, R.V.; Lappin, M.R.; Tompkins, M.B. Feline immunodeficiency virus predisposes cats to acute generalized toxoplasmosis. Am. J. Pathol. 1993, 143, 1486–1497. [Google Scholar]
Figure 1. Map of Panama and West Panama. The areas of sampled regions are delimited using polygons. Sampled regions are coded as follows: NR = North region, WR = West region, SMR = San Miguelito region, ER = East region, MR = Metro region and CR = Central region. Regions are colored in a gray scale according to their T. gondii infection percentages and mean ± standard deviation infection percentage ranges as follows: NR (27.94–31.62); WR, SMR (24.26–27.94); ER (20.58–24.26); and CR (16.89–20.57).
Microorganisms 08 00927 g001
Figure 2. Multiple correspondence analysis (MCA). The two-dimensional diagram helps to visualize the cluster of correlated variable categories in groups. Dimensions 1 and 2 constitute the space where variable categories are expressed and explain 53.2% of variance in the dataset. Variable categories analyzed: (IgG_P) IgG positivity; (IgG_N) IgG negativity; (DOG) animal species studied: dog; (CAT) animal species studied: cat; (A1) age group 1; (A2) age group 2; (A3) age group 3; (W1) weight group 1; (W2) weight group 2; (W3) weight group 3; (SAS_N) presence of other stray animal species: none; (SAS_D) presence of other stray animal species: dog; (SAS_C) presence of other stray animal species: cat; (SAS_DC) presence of other stray animal species: dog and cat; and regions sampled, (METRO) metropolitan region, (CENTRAL) central region, (SM) San Miguelito district, (WEST) west region, (NORTH) north region, (EAST) east region. Clusters of variables associated with IgG positivity or negativity are colored in blue and red respectively. Age and weight groups are coded as follows: age group 1 = 0–5 months, age group 2 = 6–12 months, age group 3 = 13 months or older, weight group 1 = 0–5 pounds, weight group 2 = 6–12 pounds, weight group 3 = 13 pounds or more.
Microorganisms 08 00927 g002
Table 1. Frequency of Toxoplasma gondii infection in stray dogs and cats of Panama City and West Panama 1,2.
Regions Communities Nº. of Stray Dogs and Cats TestedNº. (%) and (95% CI) of Positive Dogs and CatsSpecies Analyzed Nº. of Species Analyzed/Dogs and CatsNº. (%) and (95% CI) of Dogs and Cats withMean ± S.E.M. of Age (Months)
Antibodies against T. gondiiIgG + and IgM- IgG+ and IgM+ IgG- and IgM+ IgM+ Total
Central Bella Vista, Curundú, Ancón, Calidonia, San Felipe, Santa Ana, Chorrillo.13824 (17.39) *
(11.67–24.97)
Dogs4411 (25.00)
(13.70–40.65)
11 (25.00)
(13.70–40.65)
0 (0)
(0–10)
0 (0)
(0–10)
0 (0)
(0–10)
28.75 ± 5.96
Cats9413 (13.82)
(7.86–22.85)
12 (12.76)
(7.06–21.62)
1 (1.06)
(0.05–6.62)
0 (0)
(0–4.89)
1 (1.06)
(0.05–6.62)
5.58 ± 0.49
Metro San Francisco, Pueblo Nuevo, Betania, Rio Abajo, Parque Lefevre, Juan Díaz. 11525 (21.73)
(14.81–30.60)
Dogs4010 (25.00)
(13.24–41.52)
10 (25.00)
(13.24–41.52)
0 (0)
(0–10.91)
0 (0)
(0–10.91)
0 (0)
(0–10.91)
15.92 ± 3.51
Cats7515 (20.00)
(11.98–31.15)
13 (17.33)
(9.90–28.18)
2 (2.66)
(0.46–10.17)
0 (0)
(0–6.07)
2 (2.66)
(0.46–10.17)
7.16 ± 0.92
EastLas Mañanitas, Pacora, Tocumen, 24 de Diciembre, Pedregal, San Martin.9021 (23.33)
(15.33–33.65)
Dogs366 (16.67)
(6.96–33.47)
6 (16.67)
(6.96–33.47)
0 (0)
(0–12.01)
0 (0)
(0–12.01)
0 (0)
(0–12.01)
13.89 ± 3.21
Cats5415 (27.77)
(16.86–41.86)
6 (11.11)
(4.60–23.31)
4 (7.40)
(2.40–18.74)
5 (9.25)
(3.46-21.06)
9 (16.66)
(8.36–29.79)
8.55 ± 1.38
San MiguelitoMateo Iturralde, José Domingo Espinar, Victoriano Lorenzo, Amelia Denis de Icaza, Arnulfo Arias, Belisario Porras, Belisario Frias, Omar Torrijos, Rufina Alfaro.15541 (26.45)
(19.85–34.24)
Dogs9525 (26.31)
(18.05–36.52)
23 (24.21)
(16.26–34.28)
2 (2.10)
(0.36–8.12)
0 (0)
(0–4.84)
2 (2.10) *
(0.36–8.12)
14.07 ± 1.18
Cats6016 (26.66)
(16.45–39.89)
5 (8.33)
(3.11–19.12)
2 (3.33)
(0.58–12.55)
9 (15)
(7.50–27.08)
11 (18.33) *
(9.93–30.85)
7.57 ± 1.06
West Barrio Balboa, Barrio Colón, Guadalupe, Playa Leona, Arraiján, Burunga, Juan Demóstenes Arosemena, Veracruz, Vista Alegre, Campana, Herrera, Nuevo Chorrillo.7520 (26.66)
(17.42–38.34)
Dogs4614 (30.43)
(18.20–45.92)
12 (26.08)
(14.75–41.41)
2 (4.34)
(0.76–16.04)
0 (0)
(0–9.60)
2 (4.34)
(0.76–16.04)
14.35 ± 3.67
Cats296 (20.68)
(8.70–40.26)
6 (20.68)
(8.70–40.26)
0 (0)
(0–14.56)
0 (0)
(0–14.56)
0 (0)
(0–14.56)
7.96 ± 1.88
North Alcalde Díaz, Chilibre, Las Cumbres, Ernesto Córdoba Campos, Caimitillo.9728 (28.86) *
(20.34-39.09)
Dogs5816 (27.58)
(17.05–41.11)
11 (18.96)
(10.28–31.81)
5 (8.62)
(3.22–19.72)
0 (0)
(0–7.74)
5 (8.62)
(3.22–19.72)
10.43 ± 1.81
Cats3912 (30.76)
(17.55–47.73)
8 (20.51)
(9.87–36.94)
4 (10.25)
(3.34–25.16)
0 (0)
(0–11.17)
4 (10.25)
(3.34–25.16)
9.33 ± 1.65
Total 670159 (23.73)
(20.59–27.17)
Dogs31982 (25.70)
(21.07-30.93)
73 (22.88)
(18.47–27.97)
9 (2.82)
(1.38–5.47)
0 (0)
(0–1.48)
9 (2.82) *
(1.38–5.47)
15.69 ± 1.26
Cats35177 (21.93)
(17.79–26.71)
50 (14.24)
(10.85–18.44)
13 (3.70)
(2.07–6.41)
14 (3.98)
(2.28–6.76)
27 (7.69) *
(5.22–11.12)
7.33 ± 0.44
1 Values marked with asterisks (*) indicate statistically significant differences between the sampled regions. 2 Nº indicates the number of samples analyzed.
Table 2. Frequency of T. gondii in feral cats associated with co-infection with immunosuppressive diseases 1.
Regions Communities Nº. (%) and (95% CI) of Positive Cats with
Nº. of Cats AnalyzedAntibodies against T. gondiiImmunosuppressive DiseasesFIVFeLVFIV/FeLV Immunosuppressive Diseases and T.gondiiMean ± S.E.M. of Age (Months)
Central Bella Vista, Curundú, Ancón, Calidonia, San Felipe, Santa Ana, Chorrillo.9413 (13.82)
(7.86–22.85)
12 (12.76)
(7.06–21.62)
9 (9.57)
(4.74–17.85)
1 (1.06)
(0.05–6.62)
2 (2.12)
(0.37–8.21)
7 (7.44)
(3.30–15.24)
5.58 ± 0.49
Metro San Francisco, Pueblo Nuevo, Bethania, Rio Abajo, Parque Lefevre, Juan Díaz. 7515 (20.00)
(11.98–31.15)
13 (17.33)
(9.90–28.18)
12 (16.00)
(8.89–26.67)
0 (0)
(0–6.07)
1 (1.33)
(0.06–8.21)
7 (9.33)
(4.15–18.85)
7.16 ± 0.92
EastLas Mañanitas, Pacora, Tocumen, 24 de Diciembre, Pedregal, San Martin.5415 (27.77)
(16.86–41.86)
7 (12.96)
(5.80–25.52)
6 (11.11)
(4.60–23.31)
1 (1.85)
(0.09–11.18)
0 (0)
(0–8.27)
1 (1.85)
(0.09–11.18)
8.55 ± 1.38
San MiguelitoMateo Iturralde, José Domingo Espinar, Victoriano Lorenzo, Amelia Denis de Icaza, Arnulfo Arias, Belisario Porras, Belisario Frias, Omar Torrijos, Rufina Alfaro6016 (26.66)
(16.45–39.89)
4 (6.66)
(2.16–17.00)
3 (5.00)
(1.30–14.82)
1 (1.66)
(0.08–10.14)
0 (0)
(0–7.50)
2 (3.33)
(0.58–12.55)
7.57 ± 1.06
West Barrio Balboa, Barrio Colón, Guadalupe, Playa Leona, Arraiján, Burunga, Juan Demóstenes Arosemena, Veracruz, Vista Alegre, Campana, Herrera, Nuevo Chorrillo.296 (20.68)
(8.70–40.26)
3 (10.34)
(2.71–28.50)
2 (6.89)
(1.20–24.21)
0 (0)
(0–14.56)
0 (0)
(0–14.56)
1 (3.44)
(0.18–19.63)
7.96 ± 1.88
North Alcalde Díaz, Chilibre, Las Cumbres, Ernesto Córdoba Campos, Caimitillo.3912 (30.76)
(17.55–47.73)
1 (2.56)
(0.13–15.08)
2 (5.12)
(0.89–18.63)
0 (0)
(0–11.17)
0 (0)
(0–11.17)
0 (0)
(0–11.17)
9.33 ± 1.65
Total35177 (21.93)
(17.79-26.71)
40 (11.39)
(8.36–15.30)
34 (9.68)
(6.89–13.39)
3 (0.85)
(0.20–2.69)
3 (0.85)
(0.20–2.69)
18 (5.12) *
(3.16–8.13)
7.33 ± 0.44
1 Values marked with asterisks (*) indicate statistically significant differences between the sampled regions. Nº indicates the number of samples analyze.

