Article

Comparison of the Performance and Microbial Community Structure of Two Outdoor Pilot-Scale Photobioreactors Treating Digestate

1
Istituto Sperimentale Lazzaro Spallanzani, Localita’ La Quercia, 26027 Rivolta d’Adda (CR), Italy
2
Gruppo Ricicla labs., Dipartimento di Scienze Agrarie e Ambientali - Produzione, Territorio, Agroenergia (DiSAA), Università degli studi di Milano, Via Celoria 2, 20133 Milano, Italy
3
Dipartimento di Ingegneria Civile e Ambientale (DICA), Politecnico di Milano, P.zza L. da Vinci 32, 20133 Milano, Italy
*
Author to whom correspondence should be addressed.
Microorganisms 2020, 8(11), 1754; https://doi.org/10.3390/microorganisms8111754
Submission received: 24 October 2020 / Revised: 4 November 2020 / Accepted: 6 November 2020 / Published: 8 November 2020

Abstract

:
This study aimed at examining and comparing the nutrient removal efficiency, biomass productivity and microbial community structure of two outdoor pilot-scale photobioreactors, namely a bubble column and a raceway pond, treating the liquid fraction of an agricultural digestate. Bacterial and eukaryotic communities were characterized using a metabarcoding approach and quantitative PCR. The abundance, composition, diversity, and dynamics of the main microbes were then correlated to the environmental conditions and operational parameters of the reactors. Both photobioreactors were dominated either by Chlorella sp. or Scenedesmus sp. in function of temperature, irradiance and the nitrogen compounds derived by nitrification. Other species, such as Chlamydomonas and Planktochlorella, were sporadically present, demonstrating that they have more specific niche requirement. Pseudomonas sp. always dominated the bacterial community in both reactors, except in summertime, when a bloom of Calothrix occurred in the raceway pond. In autumn, the worsening of the climate conditions decreased the microalgal growth, promoting predation by Vorticella sp. The study highlights the factors influencing the structure and dynamics of the microbial consortia and which ecological mechanisms are driving the microbial shifts and the consequent reactor performance. On these bases, control strategies could be defined to optimize the management of the microalgal-based technologies.

1. Introduction

The water industry is facing a massive transition to transform wastewater treatment plants (WWTPs) into resource recovering factories [1]. In this light, the integration of microalgae-based technologies into WWTPs has gained attention because of their cost-effective bioremediation capability, the relatively low energy requirement, and the possibility to recover valuable biomass [2]. Microalgae-based processes have been successfully applied for the treatment and valorization of various municipal and industrial wastewaters, including secondary and tertiary effluents, piggery wastewater, digestate, and textile wastewater [3,4,5,6,7,8]. However, several drawbacks, including land requirement, uncompetitive harvesting and valorization costs, and a strict dependency on climatic and operational conditions still impede real implementation of algae-based wastewater treatment, especially in temperate zones [9].
Outdoor open systems (i.e., raceway ponds, bubble columns, flat panels) are considered so far as the most viable method of microalgal cultivation on wastewaters, though the treatment process is less controllable. Such systems are very susceptible to unavoidable environmental changes and contamination from the surrounding environments [10]. These conditions promote the development of complex and dynamic microbial consortia [11,12], which are composed not only of phototrophic organisms, but also of bacteria, protozoa, yeasts and fungi [13]. The community assembly, as well as the antagonistic and synergetic interactions within the organisms, competition for resources, and predation drive the system functions, namely nutrient removal rate and microalgal productivity. Therefore, understanding the biotic and abiotic mechanisms which favor the growth of desired microbial species or consortia might help to manipulate the community in a way to enhance treatment efficiency and productivity of valuable biomass.
Correlations between the composition, diversity and distribution of mixed microalgae-bacteria consortia and biotic, environmental and operational parameters have been the focus of several recent studies [10,14,15]. Light and temperature are reported to control the growth of species belonging to Scenedesmacae or Chlorellacae within a mixed consortia [16], while nutrient depletion (i.e., N, P and CO2) plays a role in the accumulation of valuable compounds, such as oils and pigments, in the microalgal cells [17]. Grazers could destroy a microalgae cultivation system in a few days, causing important environmental and economic consequences [13,18]. The presence of active nitrifying bacteria (both ammonia-oxidizing bacteria (AOB) and nitrite-oxidizing bacteria (NOB)), which compete with the microalgae for ammonium, phosphorus, and CO2, might impact the microalgal biomass productivity [19,20]. In addition, nitrifiers oxidize ammonium, which might have an inhibitory effect, to nitrate, which is reported to be less easily assimilable than ammonium by the microalgae [21]. On the contrary, several bacteria are beneficial for the microalgal growth and seem to help in facing environmental perturbations and parasites. Bacteria could provide microalgae with CO2 through aerobic respiration, macro-micronutrients via nitrogen fixation and mineralization, but also synthetize compounds which stimulate various responses, such as the algal growth (vitamin B12), spore germination, pathogen resistance and cell aggregation [22]. Thanks to these research activities, several ecological mechanisms have been elucidated, with consequent improvements in the functioning and control of microalgae-based technologies. However, such systems are still not operated at their maximum capability and are subjected to unexpected failures.
Further knowledge could be gained by fully characterizing the microbial community within the systems by advanced sequencing approaches. So far, the taxonomic identification of the dominant microalgal and zooplankton species was based on morphology through microscopic visualization [15,16], which is extremely time consuming and dependent on the operator’s skills. In addition, the characterization of the bacterial community structure in microalgal ponds is scarce and often performed with culturing-based techniques, which allow covering a limited portion of the biodiversity [23,24]. Amplicon-based metagenomics, also known as metabarcoding, targeting both eukaryotic and bacterial gene markers could provide deep insight into the complex community in the ponds and could help in elucidating the function and interaction between the different taxa. Such approach is still scarcely used in microalgal-based process [14,25,26,27], though frequently applied to unravel the microbial ecology mechanisms in engineered ecosystems treating waste and wastewater.
Given that, the goal of this study was to investigate how the structure and dynamics of the eukaryotic and bacterial communities in two types of outdoor photobioreactors, namely a raceway pond (RWP) and a column photobioreactor (PBR), treating the liquid fraction of centrifuged digestate, also known as centrate, change with seasonal and operational conditions and their impact on the photobioreactor functioning. A comprehensive characterization of the microbiome in the two reactors was assessed by a metabarcoding approach and compared. The composition, diversity and dynamics were then correlated with the operational parameters, meteorological conditions, and reactor performance (biomass productivity and nutrient removal rates). All data were then gathered to define the main drivers regulating the community assembly, as well as to provide useful information for the design, operation, and control of open real outdoor, open and non-sterile microalgal-based technologies.

2. Materials and Methods

2.1. Pilot Plant System and Operation

The pilot plant for microalgae culturing was located in a piggery farm in the Cremona province (Northern Italy). The system consisted of two bioreactors operated in parallel, a bubble column photobioreactor (PBR) and a raceway pond (RWP), as described in Pizzera et al., 2019 [28]. The bioreactors where placed outdoors, facing the south in order to maximize sun exposure (Figure 1).
Briefly, the RWP consisted of a main polypropylene tank 4 m long, 1 m wide, and 0.3 m deep (working volume = 880 L) with semi-circular edges and a contact cylinder for CO2 bubbling (named sump, height 0.8 m, diameter 0.44 m, volume 120 L). Mixing was ensured by a paddlewheel (20 rpm) and dissolved oxygen (DO) concentration, pH and temperature of the algal suspension were constantly monitored by two on-line probes connected to a control panel. CO2 was provided automatically from the bottom of the sump when the pH was above the set-point value of 7.5. The PBR consisted of a Plexiglass cylinder 131 cm high with an inner diameter of 29 cm (working volume of 75 L). Mixing and CO2 were provided by continuous air-bubbling (2.5 L h−1) through porous stones located at the bottom of the PBR. The pH was not controlled.
The PBR was initially inoculated with 8 L of undiluted centrate, 64 L of tap water and 0.5 L of a suspension of microalgae (2.5 × 10⁶ cell mL−1 of Chlorellaceae and 13 × 106 cell mL−1 of Scenedesmaceae) previously grown on centrate from the same farm. After two months of operation, 65 L of algal suspension was transferred to the RWP and diluted in 90 L of centrate and 680 L of tap water to reach the final working volume.
The centrate was derived from the full-scale anaerobic digester in the farm co-digesting piggery wastewater, energy crops and agricultural wastes. The main average characteristics of the centrate were: total Kjeldahl nitrogen (TKN) = 1290 mg L−1; NH4+-N = 1250 mg L−1; PO43−-P = 54 mg L−1; soluble Chemical Oxygen Demand (COD) = 1520 mg L−1; total suspended solids (TSS) = 470 mg L−1. Both systems were fed on centrate, diluted with tap water (centrate:tap water, 1:5 v/v; after 143 days the RWP was fed on a centrate:tap water with a dilution of 1:3 v/v) with a hydraulic retention time (HRT) of 11 ± 4 days. The main characteristics of the diluted centrate feeding the two bioreactors are reported in Table 1.
The functioning of the pilot plants had been monitored for 188 days, from May to November, when both reactors were in operation. Samples of the microalgal suspensions and centrate were collected ca. every two weeks from the PBR (for a total of 11 samples) and RWP (for a total of 12 samples) for physicochemical and biological analyses.

2.2. Analytical Methods

Filtered (0.45 μm) samples of the microalgal suspensions (10 mL) were used for the determination of the concentration of ammonium, nitrate, nitrite, orthophosphate phosphorus (PO4-P) and soluble COD by spectrophotometric test kits (Hach-Lange, DR6000TM UV VIS Spectrophotometer, Hach Lange LT200 Dry thermostat). Total and volatile suspended solids (TSS and VSS) were determined in duplicate according to Standard Methods (APHA, 2005). The pH was measured by a portable pH meter (Hach-Lange HQ40d) in the PBR and with the on-line probe in the RWP. Absorbance at 680 nm (OD680) and turbidity were measured spectrophotometrically (Hach-Lange, DR6000TM UV VIS Spectrophotometer) as described elsewhere [28]. Irradiation and temperature data were obtained from the website of Arpa Lombardia.

2.3. Operational Data Processing

The performance of the reactors was monitored by computing the volumetric production (pr, in mg L−1 d−1) of each relevant component (Cj with j = VSS, COD, N-forms, P) from the dynamic mass balance, which considers both the PBR and the RWP as completely stirred tank reactors, as follows:
p r j , t i = C j O U T , t i C j O U T , t i 1 t i t i 1 + ( C j O U T , t i + C j O U T , t i 1 2 ) H R T   C j I N , t i + C j I N , t i 1 2 H R T
where CIN and COUT are the concentration of the component in the feeding diluted centrate and in the algal suspension, at two consecutive sampling dates (time ti−1 and ti), and HRT is the average hydraulic retention time in the period, respectively.
Negative results indicate that the component is removed, therefore it is reported as removal rate (rr). This is valid for COD and ammoniacal nitrogen. The ammonium oxidation rate (prN-NOx) was calculated as the sum of the produced oxidized nitrogen forms (prNO2-N+ prNO3-N).
Finally, removal efficiencies were computed for each relevant contaminant (Cj) as follows:
η j , t i = C j , I N t i C j , O U T , t i C j , I N t i × 100
Free ammonia (mg/L) was computed by considering the concentration of the total ammoniacal nitrogen (TAN), temperature and pH, as described elsewhere [29].

2.4. DNA Extraction and Sequencing

For each sampling event, 2 mL of bulk suspensions of each photobioreactor were collected for DNA extraction. The samples were snap frozen in liquid nitrogen at the sampling location and then transported to the laboratory where they were processed. The material was lyophilized in a Christ Alpha 1-4 lsc lyophilizer at −20 °C and 0.520 mbar pressure. DNA was extracted with DNeasy Plant Kit (Qiagen, Milan Italy) according to the user’s manual. The resulting DNA was quantified with Qubit Fluorometer (Invitrogen, Monza, Italy) and sent to the IGATech sequencing center (IGA Technology Services s.r.l., Udine, Italy) to perform Illumina sequencing on the 16S rDNA gene for bacteria and the internal transcribed spacer (ITS) of nuclear DNA for eukaryotes. In particular, the V3-V4 region was chosen for the 16S rDNA gene (341F 5′-CCTACGGGNGGCWGCAG-3′; 805R 5′-GACTACHVGGGTATCTAATCC-3′ [30], while the ITS region (ITS1 5′-TCCGTAGGTGAACCTGCGG-3′; ITS4 5′-TCCTCCGCTTATTGATATGC -3′, [31]) was used for the eukaryotes.

2.5. Bacterial Quantification by Real-Time Polymerase Chain Reaction

The total bacteria and ammonia oxidizing bacteria (AOB) were quantified by real time or quantitative PCR (qPCR) using primer set by targeting the 16S rRNA (1055f 5′-ATGGCTGTCGTCAGCT-3′; 1392r 5′-ACGGGCGGTGTGTAC-3′ [32]) and AmoA (AmoA1F 5′-GGGGTTTCTACTGGTGGT-3′; AmoA2R 5′-CCCCTCKGSAAAGCCTTCTTC-3′ [33]) genes, respectively. Each PCR reaction (20 µL final volume) contained 1 × PowerUp SYBR Green Master Mix (Applied Biosystem, Monza, Italy) (10 µL), forward and reverse primers (100 nM each primer, see below), 0.4 mg mL−1 bovine serum albumine (BSA, Thermo Fisher, Monza, Italy), distilled water (RNase/DNase free, Thermo Fisher, Monza, Italy) and 2 µL of DNA (ten-fold diluted). The reactions were performed on a 7500 Fast Real-Time PCR system (Applied Biosystem, Monza, Italy) equipped with Applied Biosystems 7500/7500 Fast Real-Time PCR Software (7500/7500 Fast software). PCR reactions were performed as described in Marazzi et al., 2019 [34]. Standard DNA were constructed from purified PCR amplicons from pure cultures of Nitrosomonas communis (DSMZ 2843) for bacterial, and Nitrosomonas eutropha (DSMZ 101675) for AOB. All standards consisted of ten-fold dilutions ranging from 108 to 101 copies µL−1, and DNA samples were run in triplicate using the following cycling conditions: 95 °C denaturation for 10 min, followed by 40 cycles of 20 s at 95 °C, 15 s at 58 °C and 30 s at 72 °C (as described in Bani et al., 2019 [35]) and 95 °C for 2 min denaturation followed by 40 cycles of 45 s at 94 °C, 30 s at 56 °C and 60 s at 72 °C (as described by Bellucci et al., 2015, [36]). To check the amplicon quality and potential primer dimer formation, PCR runs were completed with a melting analysis starting from 65 to 95 °C with temperature increments of 0.25 °C and a transition rate of 5 s. The total number of bacteria was estimated from the 16S rRNA gene copy numbers, by assuming that an average of 4.2 rRNA operon exists per cell [37]. The AmoA gene copy number was converted in AOB cell number by assuming 2 copies of the gene in each cell [38]. The cell-specific ammonium oxidation rates (CSAOR) of the AOB were calculated by taking into consideration the amount of ammonium oxidized and the number of AOB as previously reported [39,40].

2.6. Bioinformatics

Amplicon sequences were analyzed as follows. Reads were demultiplexed based on Illumina indexing. For 16S sequences, reads were overlapped and the not overlapping discarded. Low quality sequences and sequences shorter than 200 bp were removed. QIIME open-source pipelines [41] were used for the following steps: chimera check, grouping replicate sequences and picking the operational taxonomic units (OTU). The OTU definition was based on the USEARCH algorithm [42] by setting a 97% similarity threshold. Taxonomy assignation was done on the classifier tool of the Ribosomal Database Project (RDP) with the default setting [43]. For the ITS sequences, a different approach was used due to the non-overlapping nature of reads. All sequences were filtered based on the quality and length of the reads (longer than 200 bp). Then, the same steps previously described for the 16S rRNA amplicon were applied, except for the taxonomic classification, which was performed by comparing the sequences with those presents on the National Center for Biotechnology Information (NCBI) database. Sequences were submitted in the NCBI SRA data archive under the code PRJNA634916.

2.7. Statistical Analysis

Statistical analyses were performed using available packages of R (version 3.6.0) [44]. Paired sample t-tests were carried out to compare the performance and efficiency between reactors, as well as the total and nitrifying bacterial abundances in the two systems. Matrices based on Pearson correlation were built to find correlations among physicochemical data and operational parameters of the reactors (temperature (Tr), pH, dissolved oxygen; inlet and outlet COD, NH4+-N, NO2--N, NO3--N, PO4, TSS, VSS, turbidity; N:P ratio in the influent; free ammonia (FA) in the microalgal suspensions; HRT), climatic conditions (averaged daily irradiance and temperature), reactor performance (rrCOD, rrTAN, prNOx-N, prNO2--N, prNO3--N, rrPO4, prVSS), and microbiological data (microalgal density (OD680), numbers of the total and nitrifying bacteria, species richness of the total bacteria, eukaryotes and microalgae).
The vegan package was used [45] for creating rarefaction curves to test the depth of the sequencing. Species richness of the bacterial (NBAC) and eukaryotic (NEK) communities were estimated by considering each OTU as a singular microbial species. As in Borruso et al., 2018 [46], the number of shared eukaryotic OTUs among PBR and RWP was calculated by considering only the OTUs with a relative abundance higher than 1%. Microalgal species richness was correlated with the biomass productivity, considered as prVSS, and stability, estimated by the standard deviation of three consecutive prVSS values (same sampling day, previous and successive sampling days).
Non-metric multidimensional scaling (NMDS) plots, combined with the function envfit of vegan, were used as preliminary assays to elucidate how the bacterial and eukaryotic communities were influenced by the physicochemical and operational parameters, and climatic conditions. The analyses were conducted by using the bacterial and eukaryotic patterns and the operational parameters and climatic conditions detected at the same sampling time.
Clustering analyses based on the Bray–Curtis similarity index, combined with SIMPROF to check for significance (p-value < 0.05), were performed with the package clustsig [47] in order to determine significant changes in the main eukaryotic (species level, threshold 1%) and bacterial (genus level, threshold 10%) populations. The heatmaps were built with the same pool of data using the package ggplot2 [48].
To elucidate which abiotic factors influenced the shape and evolution of the microbial communities, the relative abundance of the dominant eukaryotic (species level, threshold 1%) and bacteria (genus level, threshold 10%) was correlated to the mean of the physicochemical data, operational parameters and climatic conditions, which were detected over the 7 days preceding the sampling time. In this case, the Kendall rank correlation coefficient was used, and matrices were built with the package corrplot [49]. Only correlations with a p-value lower than 0.05 are reported.
OTUs with a relative abundance higher than 1% were also used for bipartite networks, which were created using CoNet function [50] inside the package Cytoscape [51]. Different correlation coefficients were used: Pearson and Spearman, and dissimilarity indices, Bray-Curtis and Kullback-Leibler, permutation and bootstrap score were based on 1000 interactions. All major network indices were calculated using the igraph package [52].

3. Results

3.1. Performance of the Bioreactors

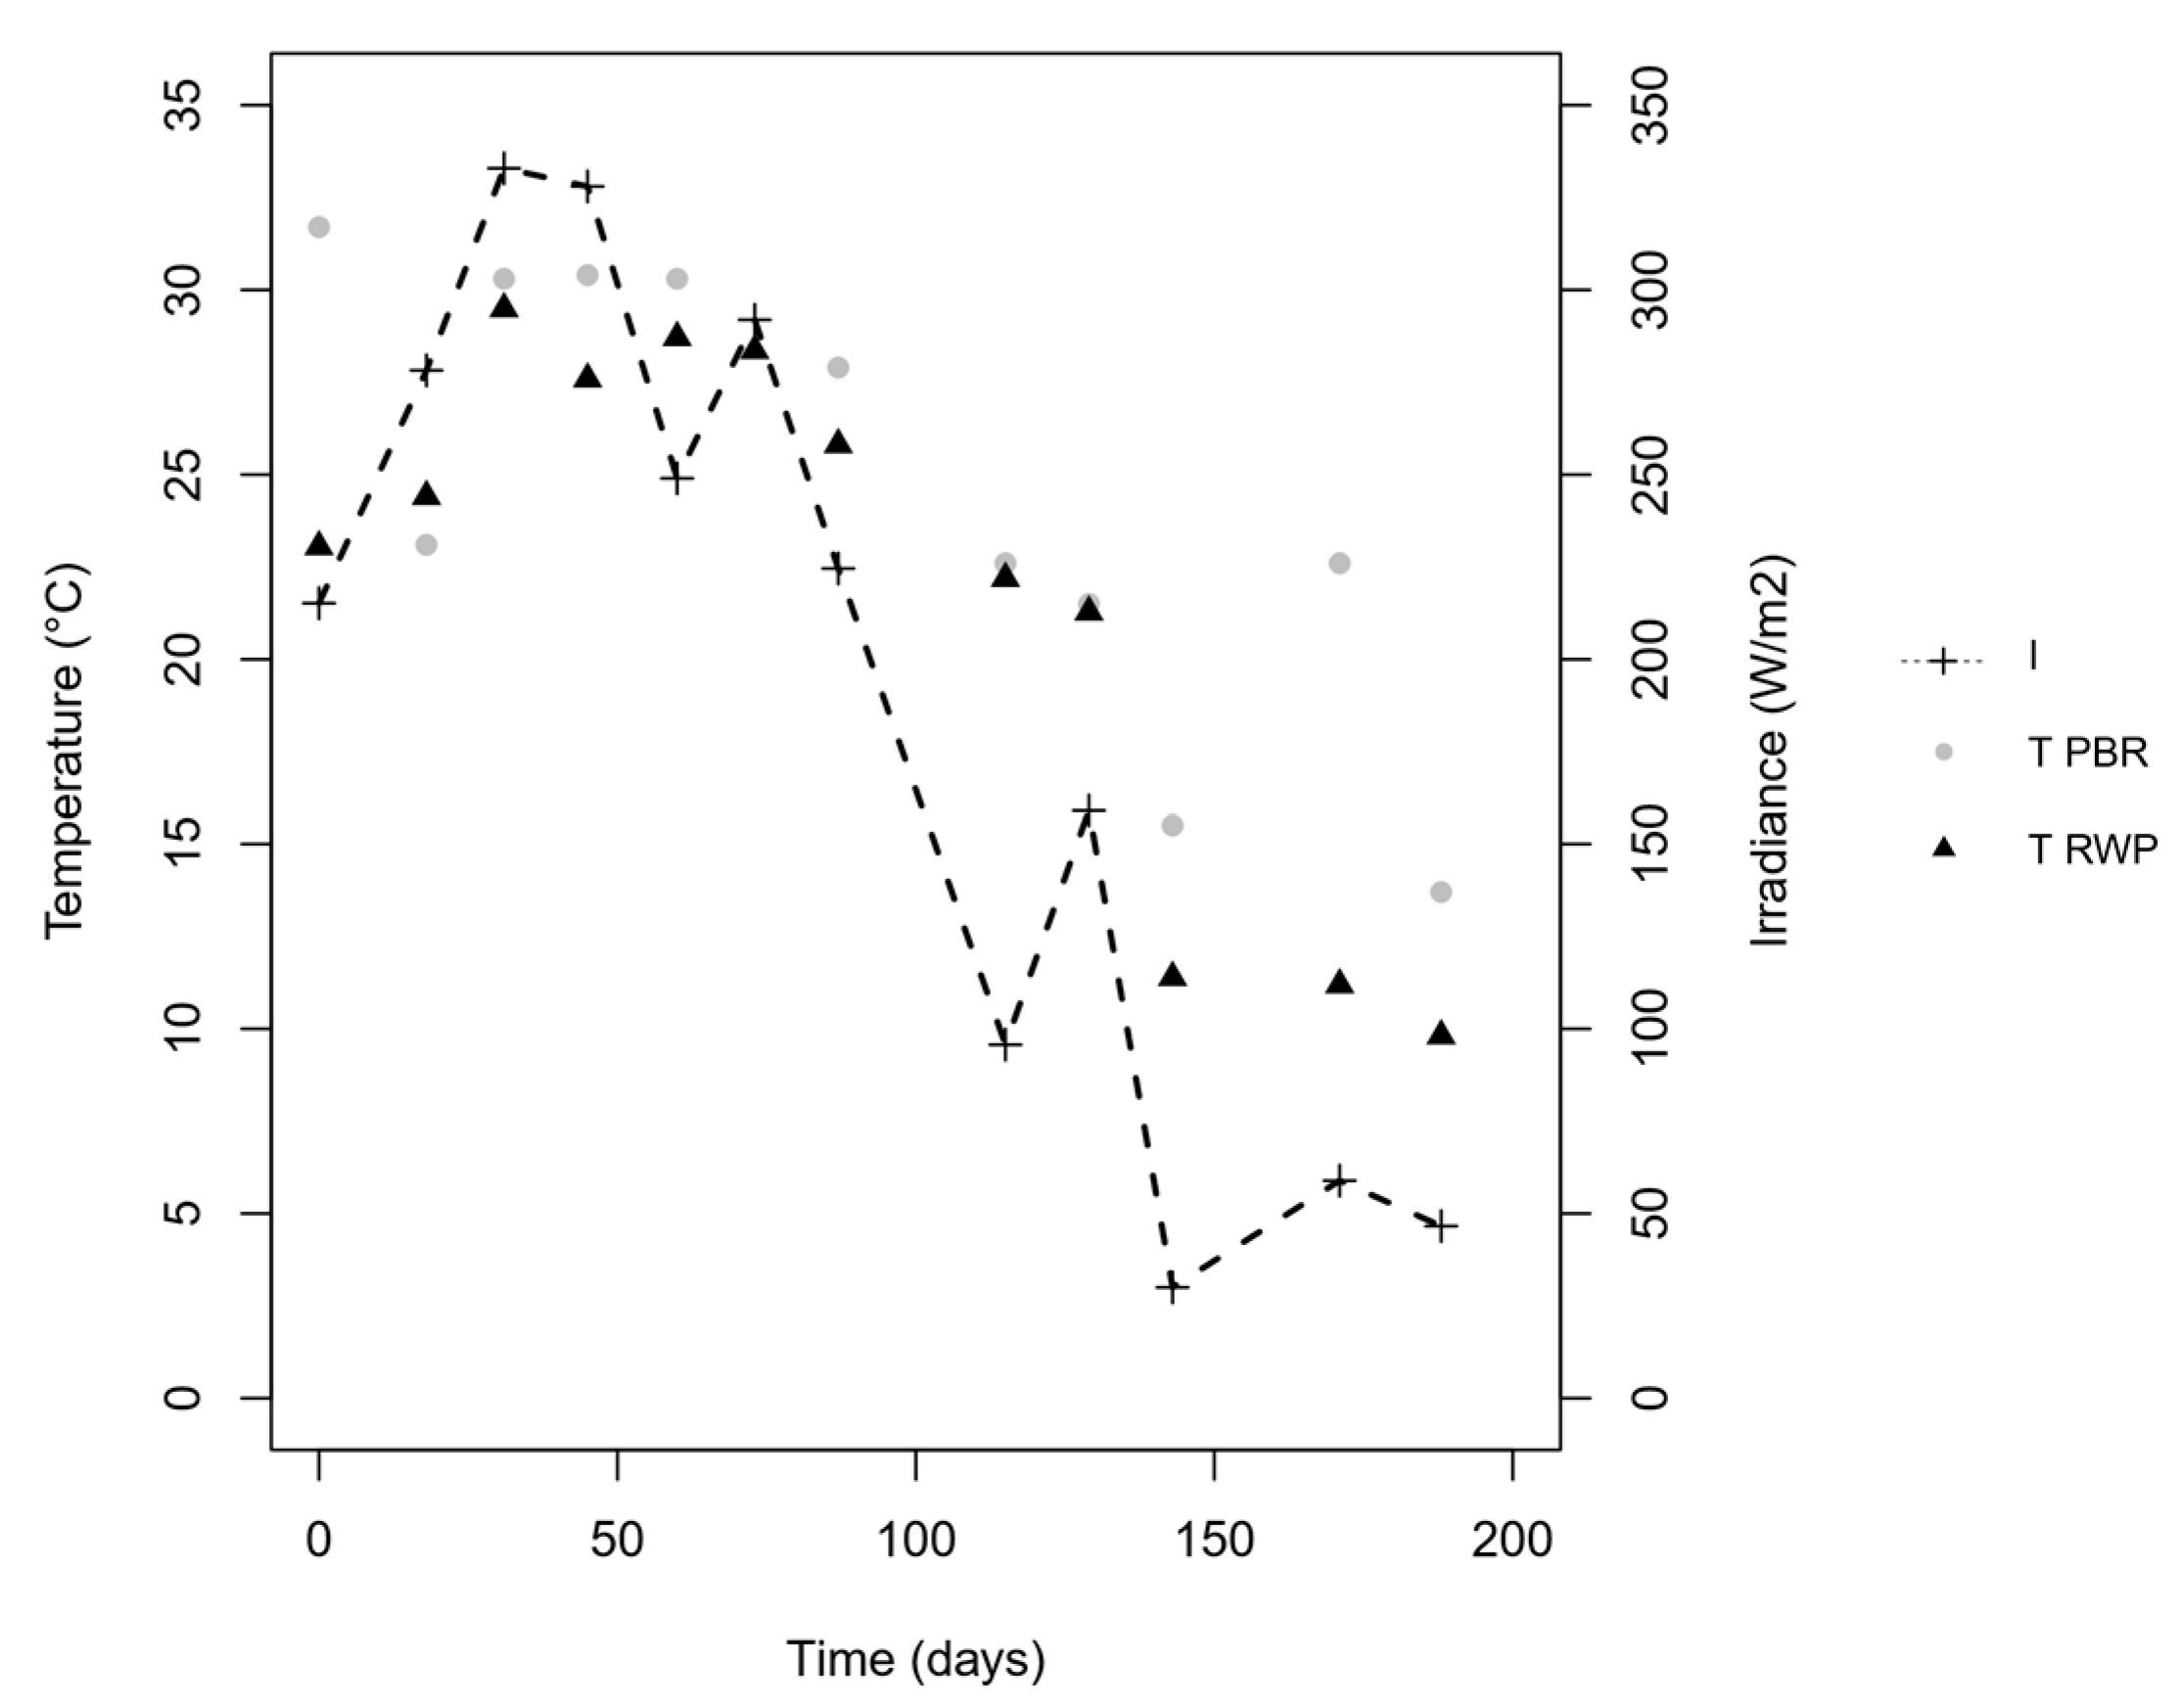
Irradiance and temperature values detected during the sampling campaign are reported in Figure 2.
The irradiance and temperature figures, which were high at the beginning of the trial (end of May), with peak at the end of June and July (day 31 and 45), and low in September (day 115), are typical of the continental temperate climate of the Padan Plain. The concentrations of ammonium, nitrate, and nitrite measured in the two reactors are shown in Figure 3A,B, while Table 2 summarizes the mean physicochemical parameters measured in the reactors, as well as the nutrient and COD removal and production rates.
The average pH in RWP was 7.2 ± 0.6, while the average pH in PBR was 8.5 ± 0.5, because the pH was not controlled by the addition of CO2 (p-value < 0.05, paired t-test). The ammoniacal nitrogen removal rates and efficiencies were similar in both reactors, averaging 20.6 ± 6.8 mg L−1 d−1 and 81.5% ± 14% (p-values > 0.1, t-paired test), respectively, indicating that the diverse configurations of the reactors did not impact on the overall NH4+-N removal. Most of the ammonium was oxidized (prNOx-N = 16 ± 9 mg L−1 d−1) through nitrification. However, the nitrate production rate in RWP was much higher than in PBR (prNO3--N = 1 ± 1 mg L−1 d−1 in the PBR and 16.7 ± 7.9 mg L−1 d−1 in the RWP), indicating that complete oxidation of ammonium to nitrate could be achieved only in the RWP, while partial nitrification to nitrite occurred in the PBR. No significant differences in the residual concentration of COD (Table 2) between reactors were found and the rrCOD was negligible.

3.2. Biomass Productivity and Abundance of the Microbial Populations

The microalgal density, which was measured as OD680, varied between 0.09 and 1.53, and the trend over time concurred with the concentrations of the TSS as shown in Figure 3C,D (r = 0.87, p-value < 0.01). The biomass productivity fluctuated, but the average value (25 ± 20 mg VSS L−1 d−1) was similar in both configurations (p-value = 0.26, paired t-test) and comparable with the range reported in the literature for microalgae culturing on the liquid fraction of digestate [8].
Figure 4A,B show that the total bacterial concentration ranged between 4.4 × 10¹⁰ and 2.8 × 10⁸ cell g VSS−1, significant differences between reactors (p-value > 0.1, paired t-test). However, a significant negative correlation between the bacterial number and microalgal density was observed (r = −0.72, p-value = 0.0001). The numbers of AOB, which were always two or three orders of magnitude lower than the total bacteria, were similar in the two reactors (p-value > 0.05, paired t-test), justifying the comparable ammonium oxidation rate observed. Nevertheless, the cell-specific ammonium oxidation rates (CSAOR, logCSAOR ranging between −0.2 and 5 fmol cell−1 h−1) were significantly higher than the ones reported for these types of bacteria [53], suggesting that the detected number of AOB was underestimated or other microorganisms contributed to the process.

3.3. Composition of the Eukaryotic and Bacterial Communities

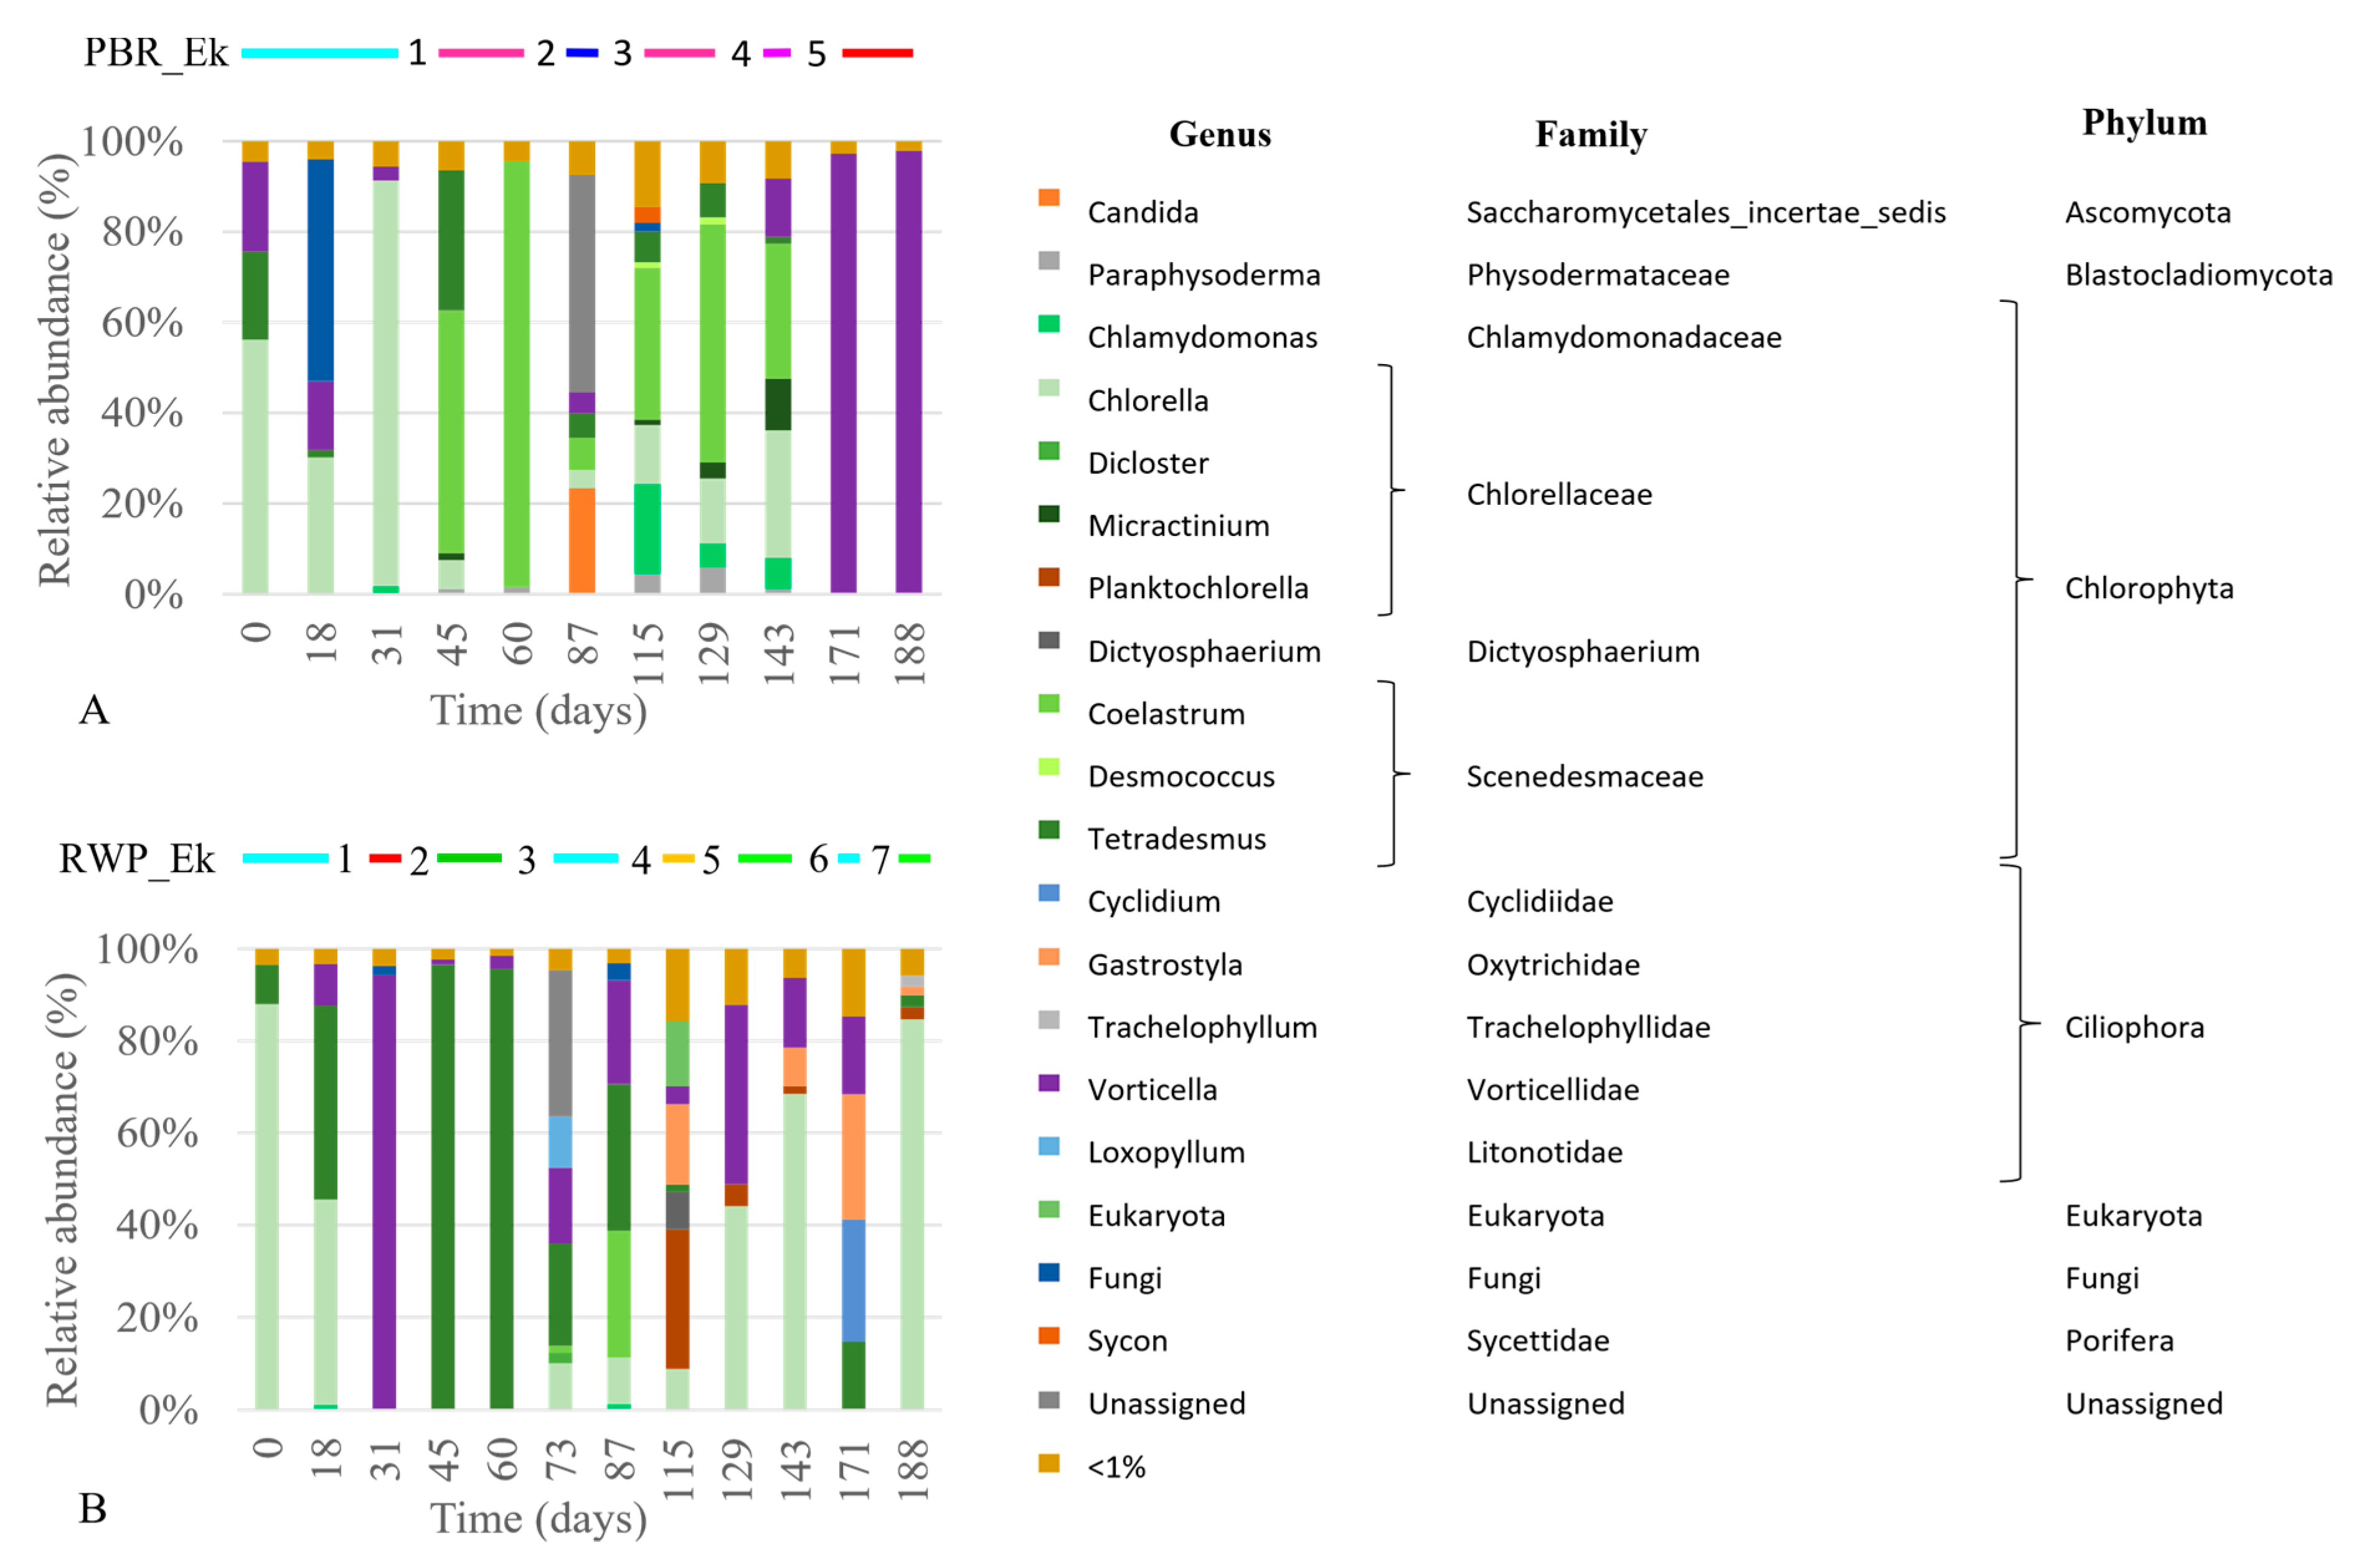
At the phylum level, the eukaryotic communities of both reactors were dominated by microorganism belonging to Chlorophyta (58% ± 38% in PBR and 63% ± 33% in RWP), Ciliophora (23% ± 38% in PBR and 26% ± 29% in RWP), and Fungi (5% ±15% in PBR). Chlorophyta are commonly found in outdoor cultivation systems fed on centrate because of their resistance to harsh cultivation conditions [54,55], while members of Ciliophora are algivorous and microalgal grazers, frequently reported in microalgal biomass culturing systems [13,18]. Their high relative abundance, the percentage of which is also negatively correlated with the microalgal one (r = −0.9, p-value < 0.001), is an indication of intense predation.
The dominant eukaryotic genera detected by the metabarcoding approach are reported in Figure 5, while in Figure S1 the main microalgae and Ciliophora identified by the optical microscope are shown.
In the PBR, the main microalgal genera were Chlorella (23%± 29%) and Coelastrum (26% ± 33%) (Figure 5A). Chlorella was dominant until day 45, when it was replaced by Coelastrum. Vorticella contributed to the 6.1±7.7% of the total eukaryotic community most of the time, but it was the sole genus detected in the last two samples. Differently, in the RWP (Figure 5B) the microalgal community was dominated by members belonging to Chlorella (31% ± 36%) and Tetradesmus (27% ± 36%). Chlorella was replaced by Tetradesmus between days 45 and 73, when Chlorella returned to be the dominant genus. Members closely related to the Coelastrum genus were barely detected in the RWP (3% ± 8%), while a severe bloom of Vorticella sp. occurred at day 31, when the system faced a drastic reduction in the microalgal density (Figure 3D).
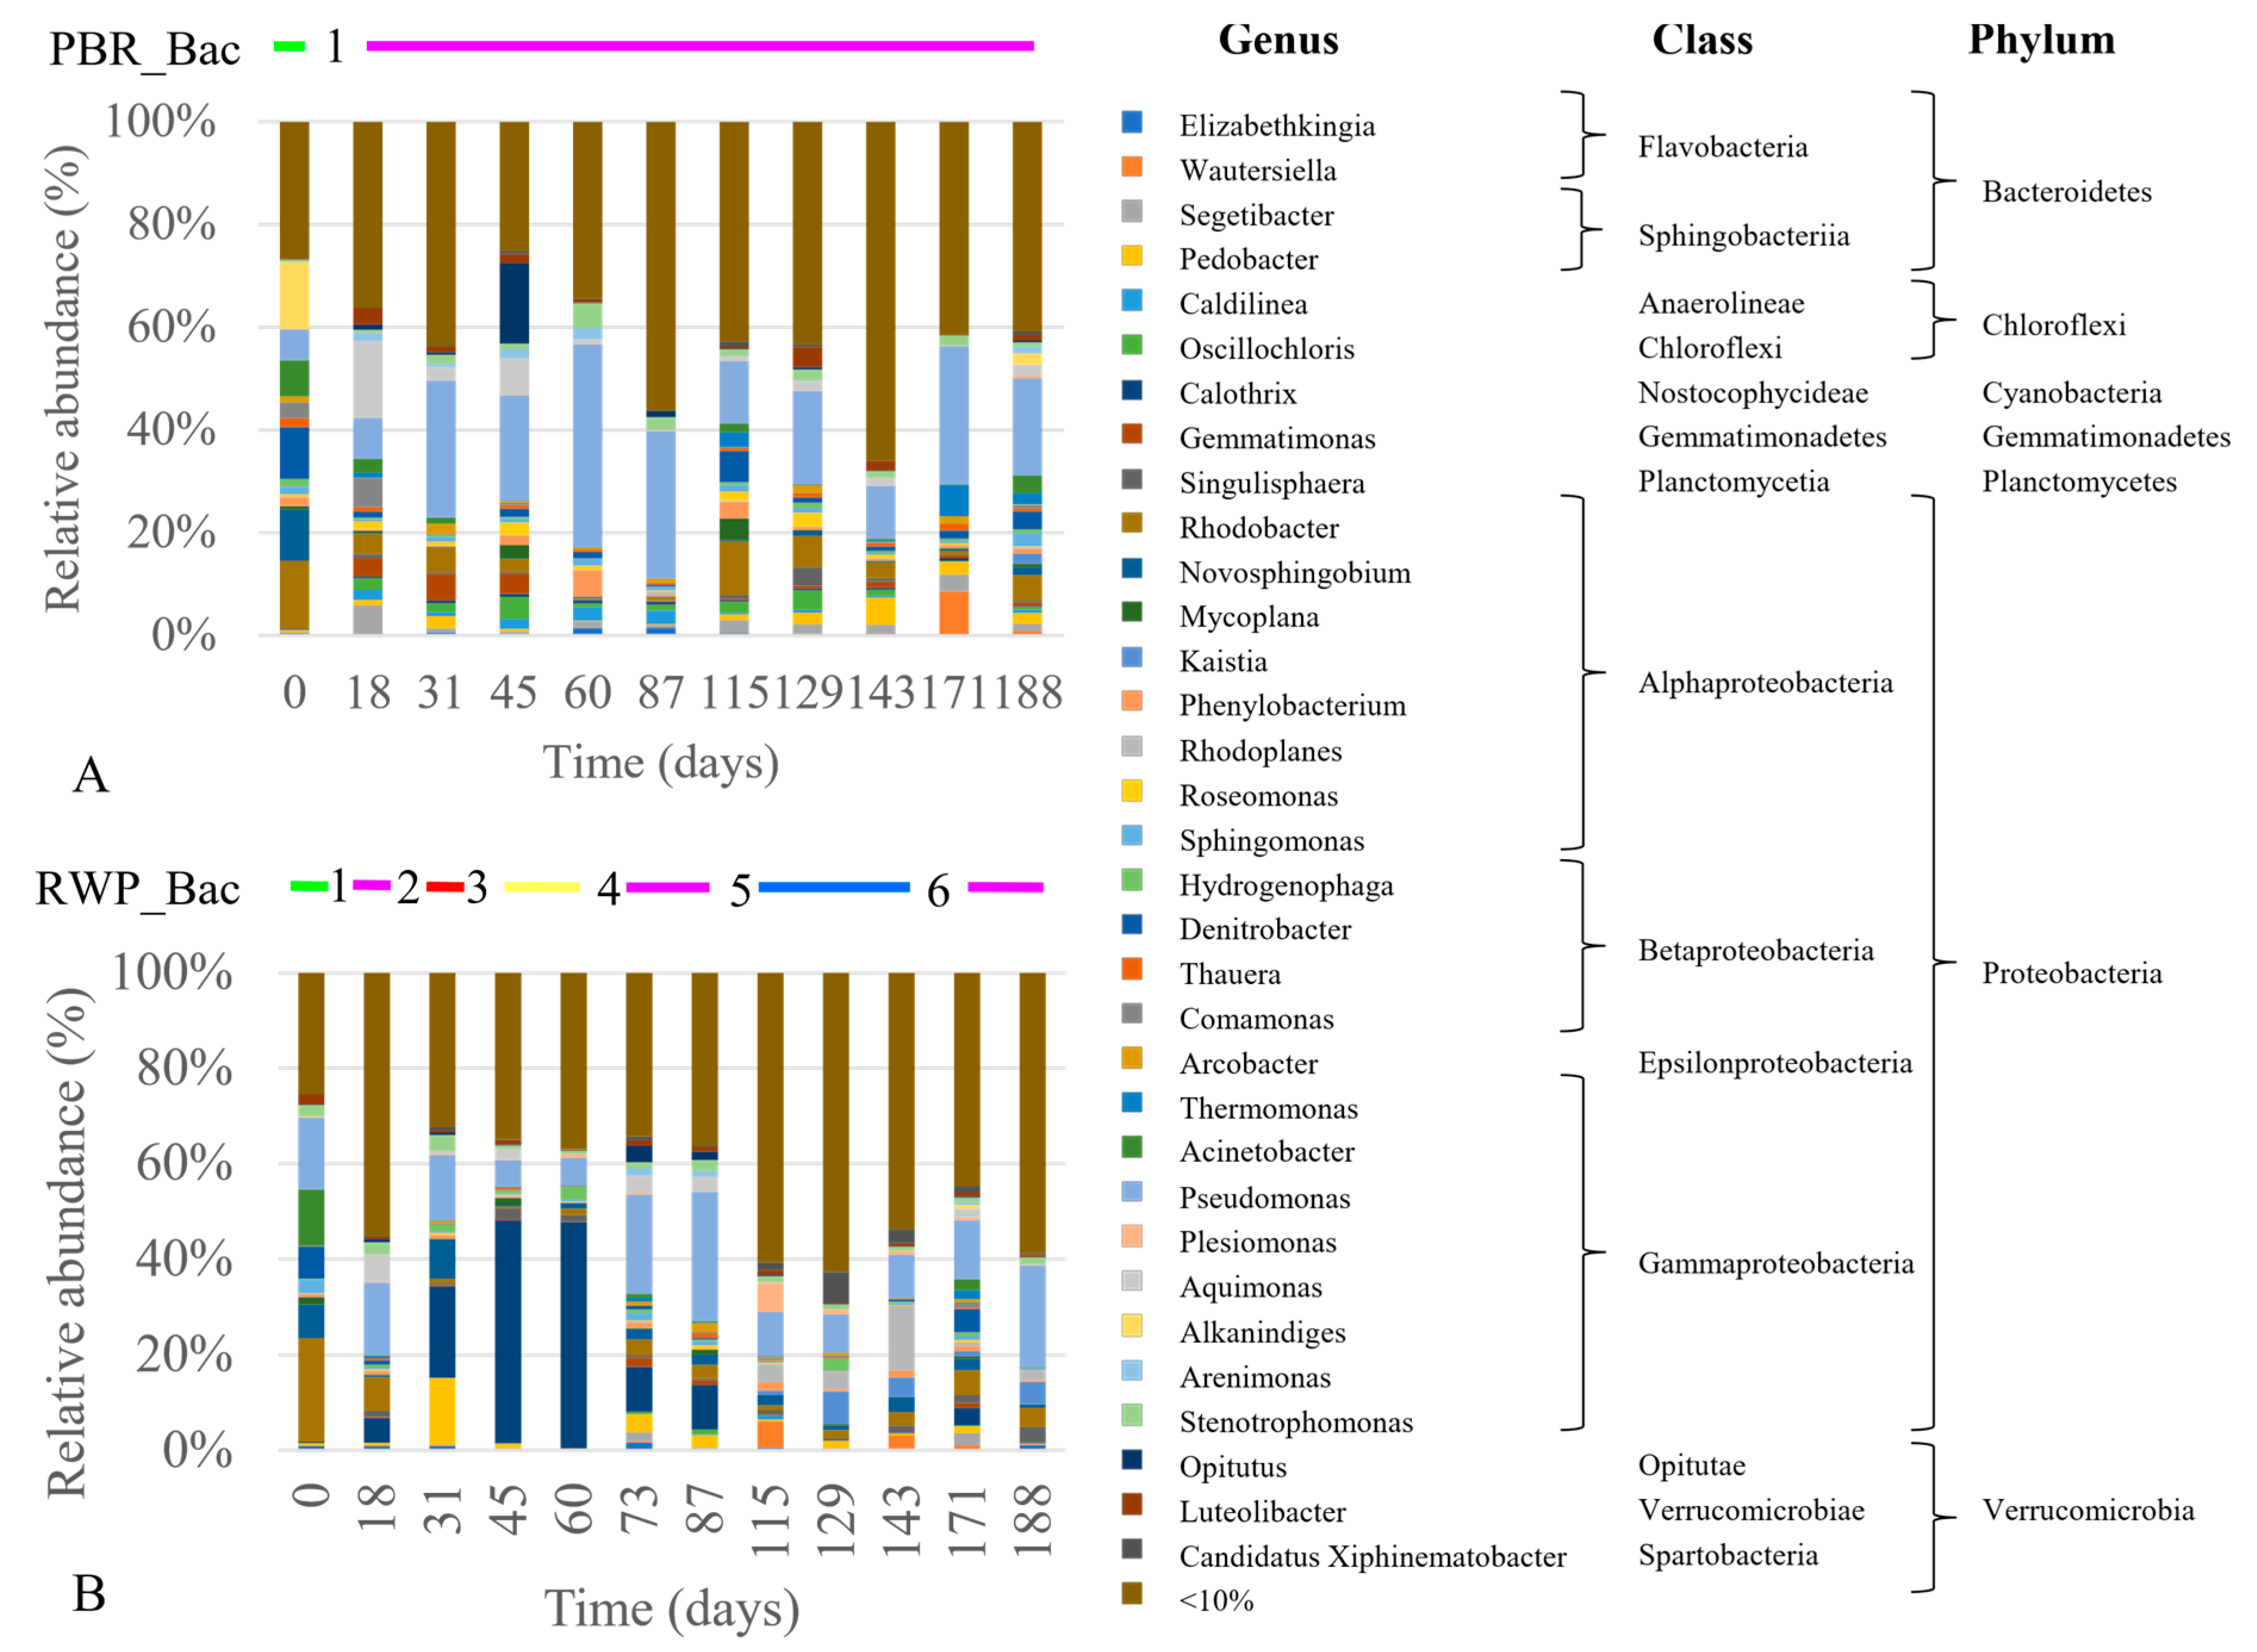
As for the bacterial community (Figure 6A,B), at phylum level, Proteobacteria were dominant in both reactors (59% ± 14% and 49% ± 16% in PBR and RWP respectively), followed by Cyanobacteria (13% ± 11% PBR and 28% ± 15% RWP), and Bacteroidetes (10% ± 5% in PBR and 13% ± 6% in the RWP). Proteobacteria and Bacteroidetes have been already acknowledged to be dominant in high-rate algae ponds [14], as well as in the phycosphere of freshwater microalgal strains [56], while cyanobacteria, being phototrophic, co-exist commonly with microalgae in photobioreactors treating wastewater [10,14]. As for class composition, the PBR was dominated by Gammaproteobacteria (31% ± 9%), followed by Alphaproteobacteria (16% ± 9%) and Nostocophycideae (13% ± 11%), while in the RWP, dominance of Nostocophycideae (26% ± 14%), Gammaproteobacteria (21% ± 9%) and Alphaproteobacteria (18% ± 10%) was revealed. At the genus level, members belonging to Pseudomonas were the most abundant in both reactors (20% ± 10% and 14% ± 7%). Their high number is not surprising, as Pseudomonas spp. are ubiquitous in freshwater and soil.
Other common genera found in the two photobioreactors were: Rhodobacter (4% ± 4% and 4% ± 6%), Pedobacter (1% ± 2% and 2% ± 4%), Opitutus (2% ± 5% and 0.4% ± 1%). For PBR, the most common genera were instead Aquimonas (3% ± 4%), Denitrobacter (2% ± 3%), Oscillochloris (2% ± 2%), Segetibacter (2% ± 2%) and Stenotrophomonas (1.5% ± 1%). In RWP, Calothrix (12% ±1 8%) became the dominant genera at days 45 and 60. Other specific genera found in the RWP were: Kaistia (2% ±3%), Novosphingobium (2% ±3%), Rhodoplanes (2% ±4%).

3.4. Diversity of the Eukaryotic and Bacterial Communities

The total species richness (N) of the bacteria (NBAC = 3224 ± 1589) was higher than the eukaryotic one (NEK = 574 ± 442) (Figure S2). Yet, a more diverse bacterial community was detected in PBR than in RWP (p-value = 0.02; paired-t test), while no differences in NEK could be observed between reactors. Both bacterial and eukaryotic species numbers varied over time. The highest values of NEK concurred with the mitigation of the irradiation and temperature conditions after days 87, suggesting that a low to intermediate amount of resources (i.e. irradiance) fosters diversity [57]. A more diverse community in a reactor should increase the productivity and functional stability, especially system resilience to perturbations. However, eukaryotes also include the microalgae predators, which perturbed the ecosystem. Therefore, to better understand the diversity–ecosystem function relationship in the reactors, microalgal and non-microalgal species richness should be differentiated.
The total number of Eukaryotic species with a relative abundance higher than 1% is reported in Table 3. A total of 63 species could be detected, 40 of which were not associated with microalgae, indicating that the reactors were colonized by diverse protozoa, fungi and yeast. Only two species (Vorticella microstoma and an undefined fungus) could be found in both reactors, while 11 and 27 species could be detected only in the PBR and RWP, respectively. The higher diversity of non-microalgal eukaryotes found in the RWP than in the PBR indicates that the raceway was more prone to contamination. Besides having a much more open surface than the PBR, sudden variations in the operational parameters, such as the sharp increase of TAN in the influent (between day 87 and 115) and changes in the dilution rate (between day 143 and 171), stressed the microalgal community favoring the growth of grazers and predators.
As for microalgae, a total of 23 species could be observed; 34.8% (8 out of 23) of them were shared among reactors. Species belonging to the genera of Chlamydomonas, Chlorella, Tetradesmus and Coelastrum were detected in both systems demonstrating their high versatility, while Desmococcus, Micractinium, Dicloster, Planktonchlorella and Dictyosphaerum were present either in the PBR or RWP, suggesting that they have more definite habitats.

3.5. Associations between the Microbial Community Structure and the Abiotic and Biotic Parameters

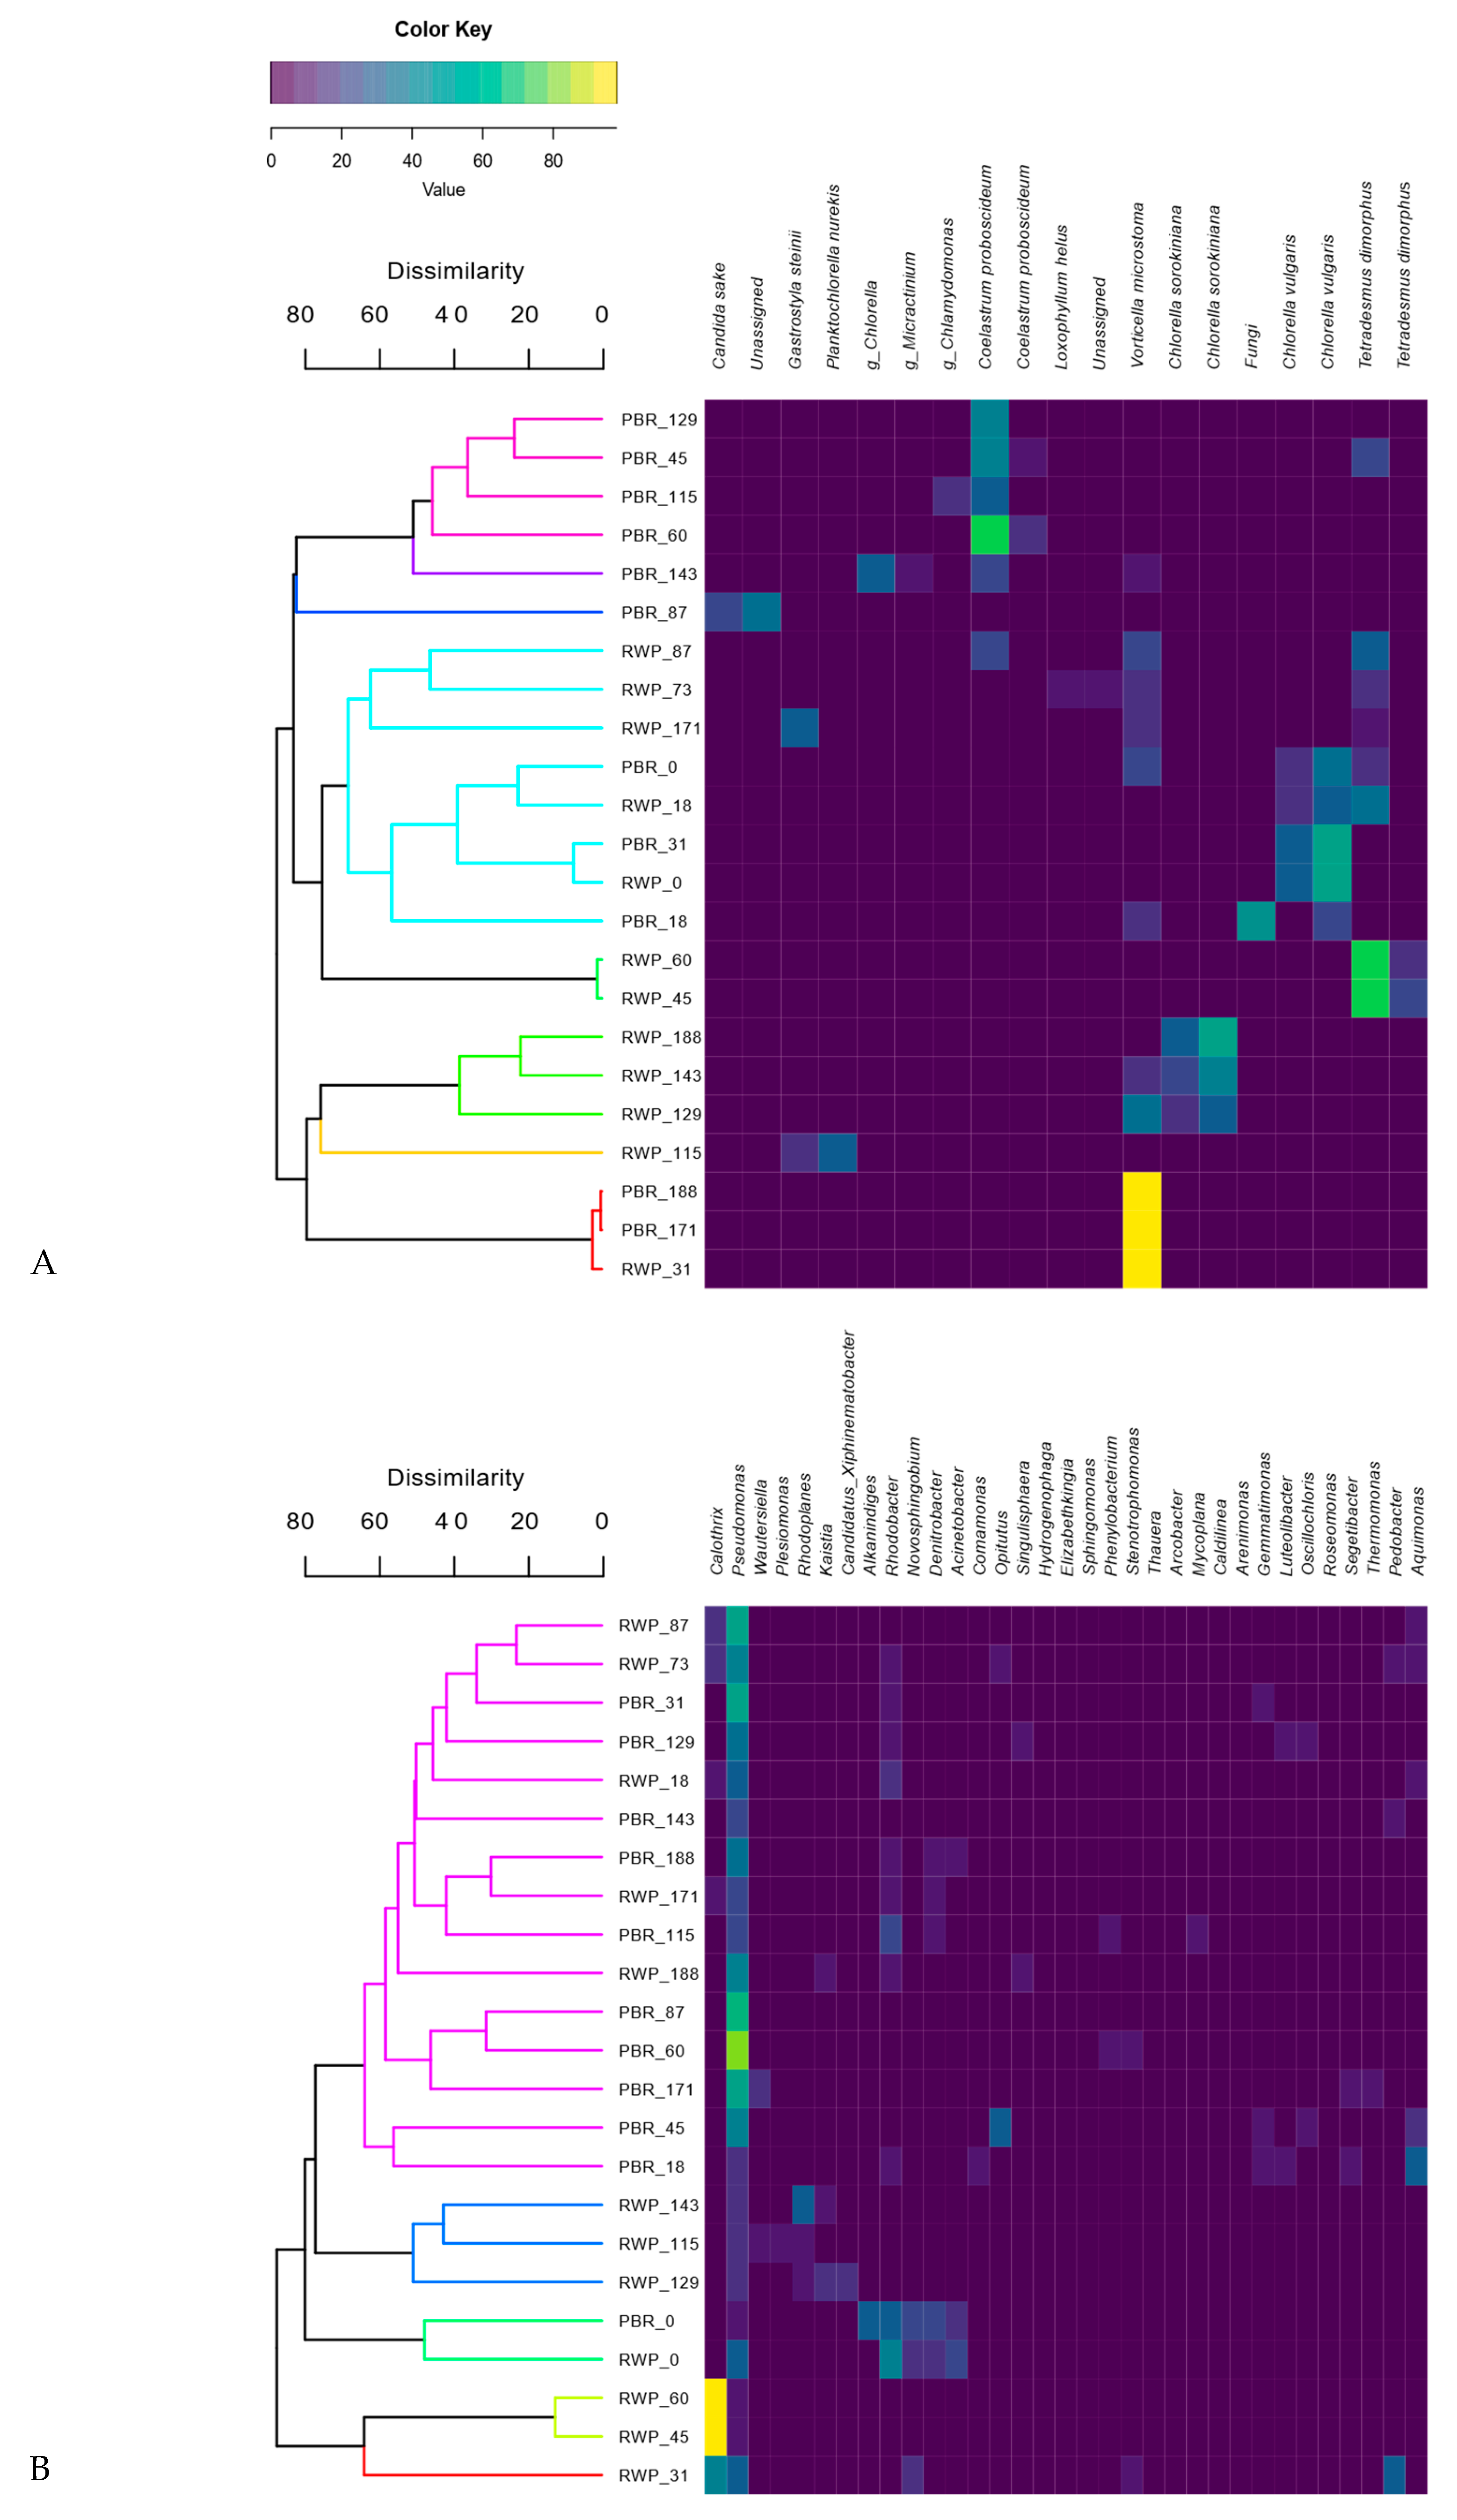
Clustering analyses show that the bacterial and eukaryotic patterns had grouped mostly according to the reactor configuration (Figure 7A,B).
This, together with the results of the NMDS analyses (Figure S3), indicates that the microbial community assembly was influenced not only by the meteorological conditions, but also by the geometry of the reactors, their different operational parameters and nitrification pathways. Indeed, the main factors affecting the eukaryotic community composition were irradiance, temperature, and the level of N compounds in the inlet and inside the reactors, whereas the bacterial community composition was mostly influenced by P, irradiance, temperature and level of TAN in the influent.
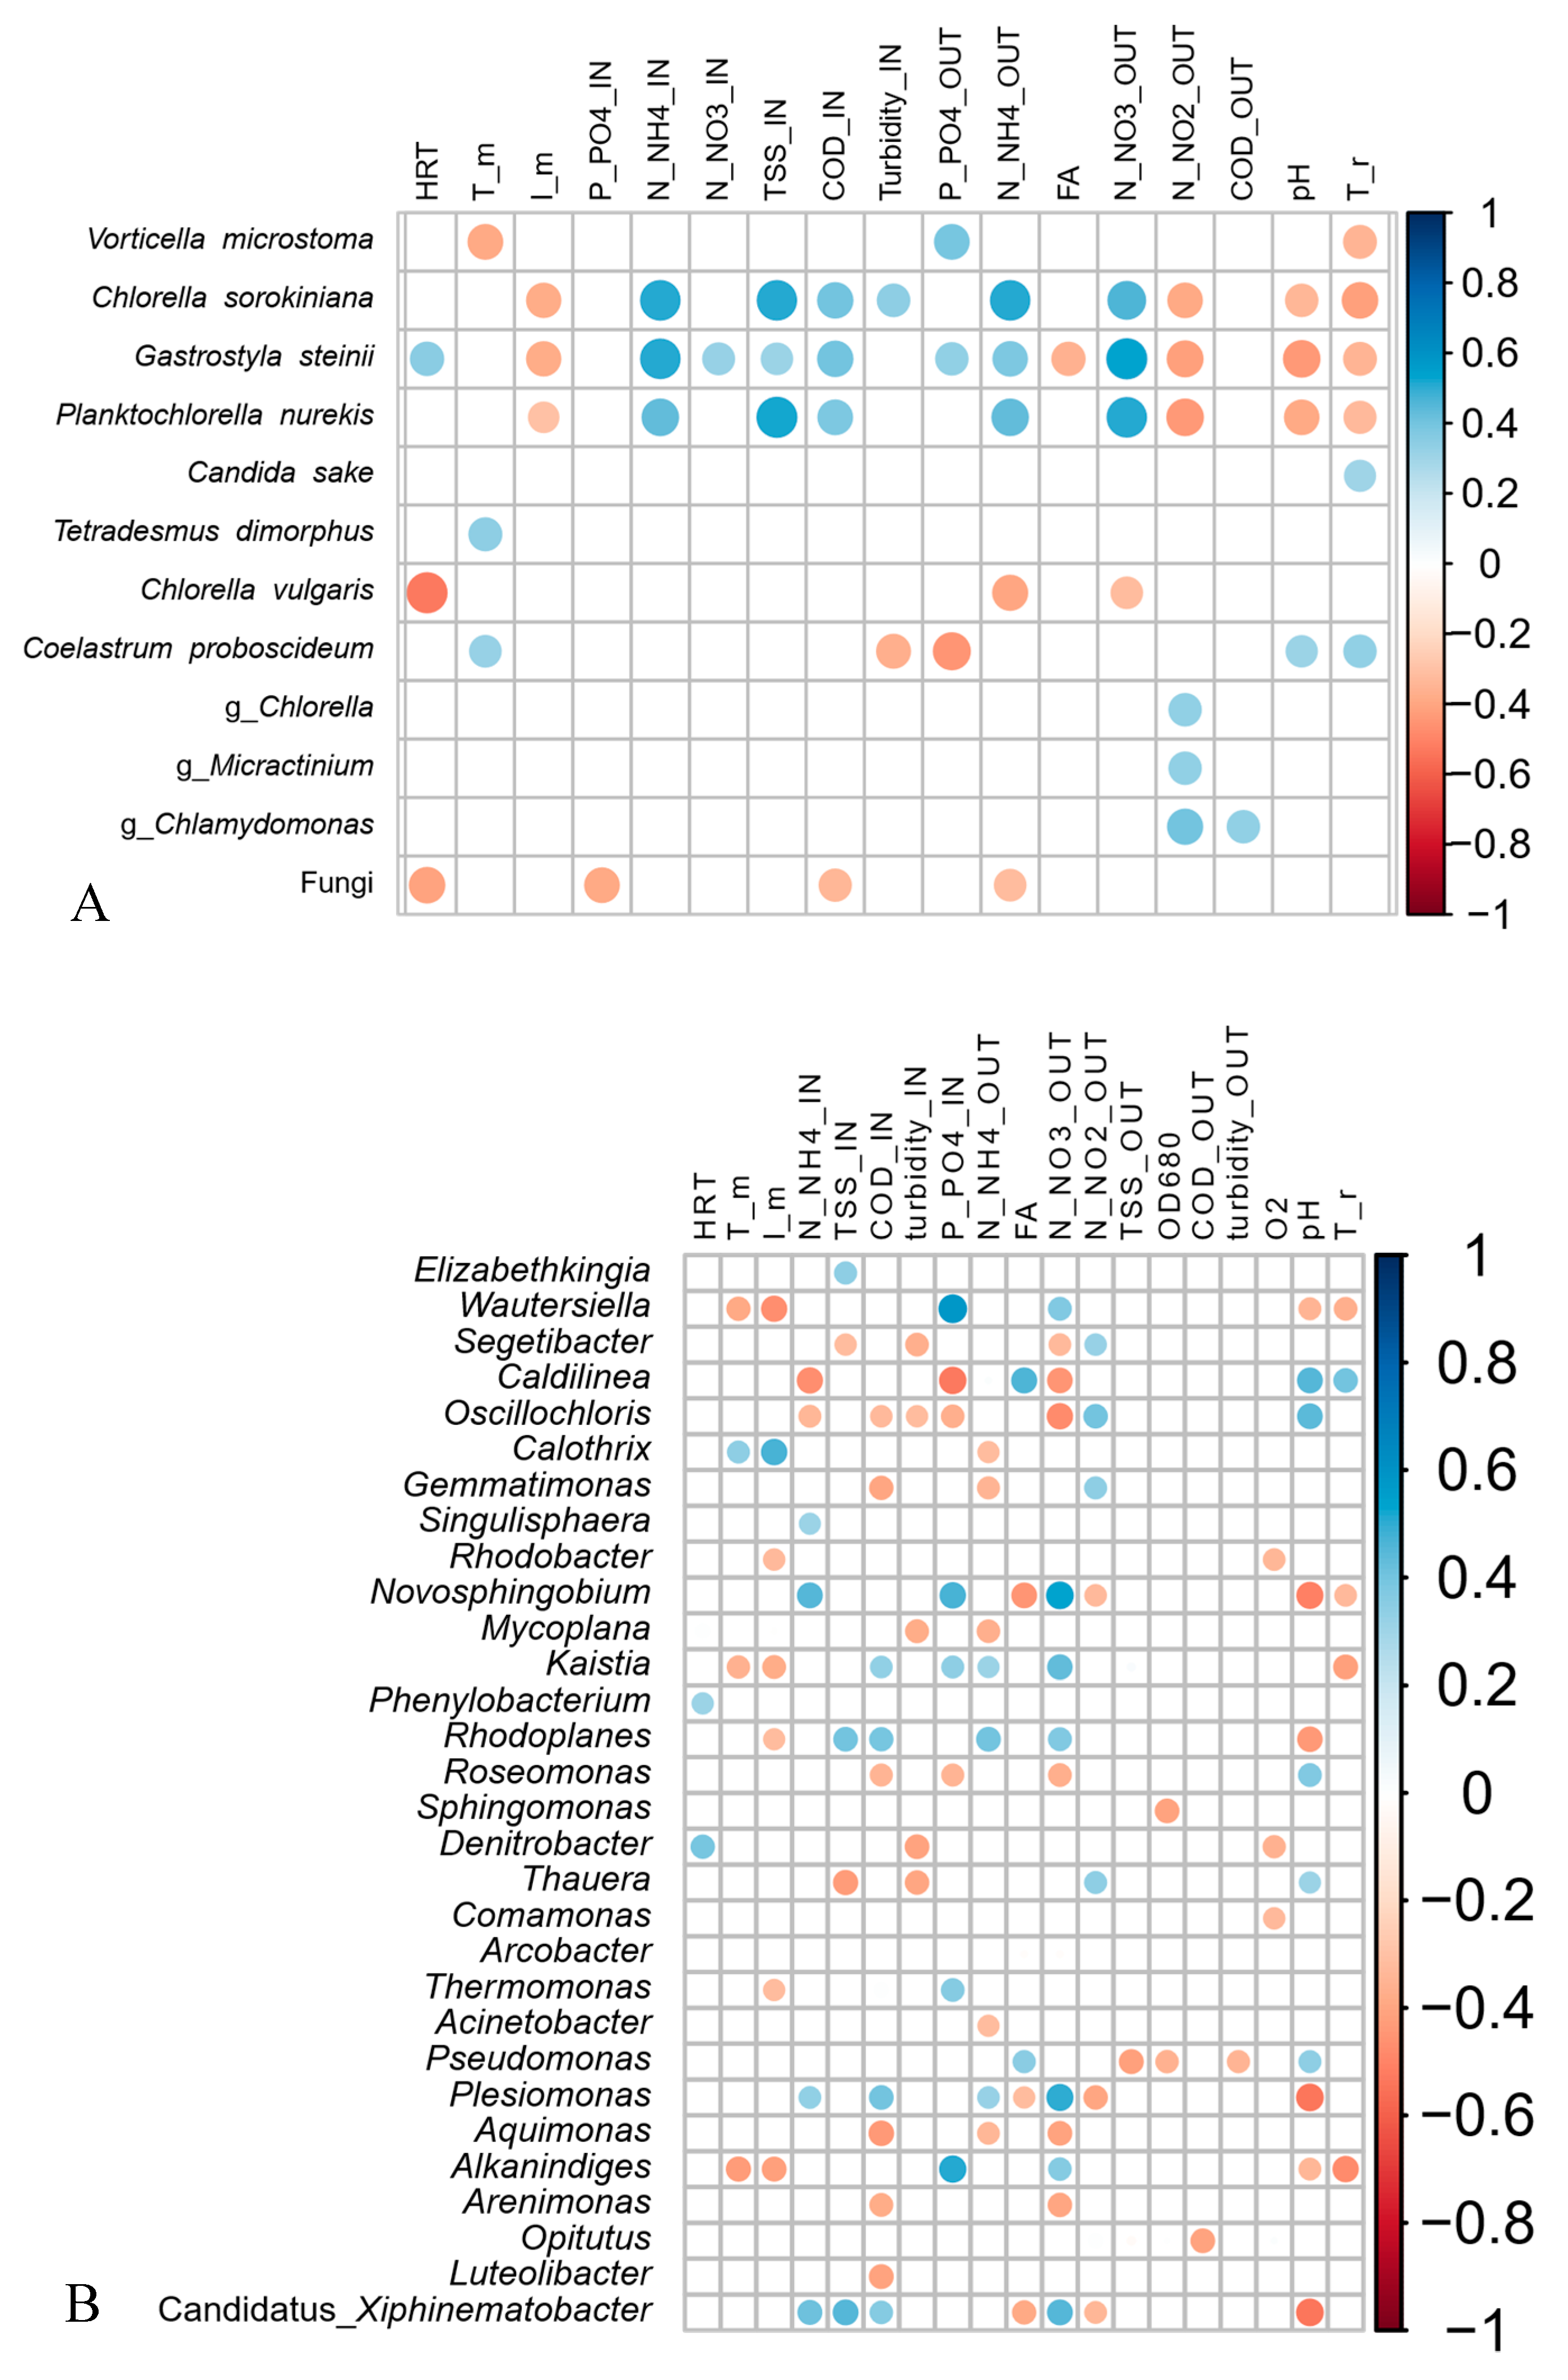
Nevertheless, several samples collected in the same reactor but at different times were found in statistically different groups, demonstrating significant changes in the communities. The eukaryotic community shifted five and seven times in PBR and RWP, respectively, while one significant change was observed in the bacterial community in PBR and six in the RWP. To establish which factors favored or inhibited the growth of the dominant bacteria, microalgae and predators in each group, giving rise to significant population changes or system failures, the relative abundance of the main microorganisms were evaluated for their correlation with the main operational parameters and meteorological conditions (Figure 8). As regards microalgae, shifts between Chlorellaceae and Scenedesmaceae in the reactors depended on the temperature, irradiance, concentration of solids in the centrate, which in turn affects light penetration, pH and concentration of N forms. High irradiance and T promoted the Scenedesmaceae (i.e., Tetradesmus and Coleastrum), which are more tolerant to high temperature and have effective quenching mechanisms and high photosynthetic capacity [58,59]. These physiological properties also might explain the significant negative correlation between the abundance of the member of this family with the concentration of solids in the influent. In addition, Coleastrum seemed to prefer more alkaline environment than Tetradesmus as it grew mainly in the PBR, where the pH was always higher than 8. Chlorella spp. exhibited a broad range of niche traits. Chlorella sorokiniana, rather than Chorella vulgaris, was favored in environments with high TAN, nitrate, and low irradiance, probably because of its more effective photoautotrophic specific growth rates [60]. On the contrary, Chlamydomonas sp. and Micractinium sp., exhibited higher tolerance toward nitrite. Contamination of Gastrostyla occurred in the RWP during the parallel worsening of the meteorological conditions and the increment of the concentration of COD. Such predators coexisted mainly with Chlorella sp., confirming that Chlorellaceae are more sensitive to grazing than Scenedesmus spp., for which colony formation and the presence of a spine provide a morphological defense against grazers [61].
As regards the cyanobacterial genera, Calothrix in the RWP was favored by high temperature as it has optimal growth rate at temperatures between 25 and 35 °C [62], as well as in low concentration of TAN being able to N2-fixation [63]. On the contrary, species belonging to the genera Oscillochloris and Caldilinea preferred an environment with low turbidity and low concentration of phosphorus. Several bacterial genera, such as Kaistia, Plesiomonas, Denitrobacter, Rhodoplanes and Wautersiella, were affected by the concentration of COD in the influent and the level of nitrate in the suspension, being heterotrophs and/or involved in the denitrification process.
All these findings were gathered to delineate the plausible mechanisms (biotic and abiotic) driving the microbial population shifts in the reactors (Table 4). The table highlights how the continuous changes in abiotic conditions and resource availability perturbed the ecosystems, allowing the growth of microalgae and bacteria with more favorable niche traits. Nevertheless, several population changes could not be explained, suggesting a strong role of the stochastic factors in the microbial community assembly [11,12].

3.6. Network Analyses

To untangle the relationship between the bacterial and eukaryotic communities, a bipartite network for each reactor type was constructed (Table 5 and Figure S4). Overall, the RWP had a larger number of interactions than the PBR (see number of interactions, i.e., the number of connected elements, Table 5), though the latter showed a higher complexity of the interactions given the higher network density and heterogeneity. The network heterogeneity is shown by the presence of hubs within the network, while network density is given by the average edges per node, so that a network with many isolated nodes will have a density closer to zero. Communities that are highly connected and have high modularity (i.e., a clustered structured as in the PBR reactor) could be more functionally unstable, since the loss of a node has a higher effect on them [64]. The bloom of predators has a significant impact on the community structure, as predators mutually exclude with almost every other eukaryote as they are microalgae grazers. In general, the PBR experienced less contamination than the RWP over the entire experiment, but once predators entered the reactor they led to a complete disruption of the eukaryotic community. Such fragility can be probably associated to the highly clustered structure of the community [64]. On the contrary, the RWP harbored constantly non-microalgae eukaryotes in the community and the entry of new contaminants was unable to produce drastic damages to the community like in the PBR. In this case, the high diversity and dynamics observed in the RWP (Table 3 and Table 4) might help in establishing a complex interactive community (Table 5, interactions number and connected elements) that contrasted the spread of predators over time.

4. Discussion

4.1. Environmental Parameters, Biomass Productivity and Nutrients Removal in the Photobioreactors

The biomass productivity and overall nutrient removal were comparable in the two photobioreactors, though influenced by the environmental conditions. Both systems reached a total ammoniacal nitrogen and PO43−-P removal rates of 21 and 0.45 mg L−1 d−1, respectively, which are in line with similar systems treating digestate located in the same geographical area. Low COD removal rate could be observed in the PBR and RWP, demonstrating that centrate was mainly composed of recalcitrant and not easily biodegradable compounds. This suggests that this type of wastewater is suitable for preventing the contamination of heterotrophic microbes (i.e., bacteria, fungi and protozoa) in outdoor microalgae cultivation. The microalgal growth and productivity (average 25 mg L−1 d−1) followed the variation of the temperature and light, which were typical of the area, and was impacted by erroneous operational strategies. The sudden drop in the microalgal biomass between day 60 and 73 in the RWP could be attributed to the coverage of the system with a shading net, which was placed to prevent photoinhibition. Meanwhile, the worsening of the meteorological conditions, such as low temperature and light at the end of the trial, led to a reduction in the microalgal growth. Overall, these finding suggest that, in suboptimal climate conditions, the performance of outdoor photobioreactors could be improved by the implementation of equipment to mitigate the irradiance and temperature variations, such as the use of external light and heating systems. Although the operational costs would increase, the system are expected to produce more biomass to valorize.
On the other hand, the biological nitrogen removal pathways in the systems were linked to the different configurations and operations of the reactors. Complete nitrification could be achieved only in the RWP, while partial nitrification occurred in the PBR. High ammonium oxidation is quite common in microalgae-based technologies treating municipal and agro-zootechnical digestate [34,54,55], especially if phosphorus is readily available [65]. The elevated P concentration in the centrate favored the activity of the AOB [66], which are the main responsible for ammonium oxidation. This hypothesis is supported also by the positive correlation between the ammonium oxidation rate and the concentration of PO43−-P (PO43−-P out = 0.86 prN-NOx + 6.8, R² = 0.3623, p-value = 0.0038). Nevertheless, the number of detected AOB was lower than expected if considering the ammonium oxidation rate. It is plausible that a fraction of AOB, which prefer growing in colonies, often attached on cellular aggregate and/or within biofilm developing on the reactor walls or on the paddlewheel in the case of the raceway pond [54], were not sampled. Another plausible reason is that other microorganisms contributed to the process. For instance, Pseudomonas veronii, which was the dominant bacterial species, might have a role, as it possesses the AmoA gene encoding for the oxygen monooxygenase [67,68,69], and its function as heterotrophic nitrifier was already observed in natural and engineered ecosystems. However, more studies are required to confirm this hypothesis.
Nitrite oxidation occurred in the RWP but it was seriously impaired in the PBR. Most likely, the higher pH of the column, shortage of CO2 and the slightly higher level of free ammonia than in the RWP prevented the NOB growth [28]. However, if complete nitrification is desired, the implementation of pH control systems and longer HRT might help in overcoming these issues.

4.2. Microbial Community Structure

Species belonging to Scenedesmaceae and Chlorellaceae were the dominant microalgae observed in both systems, confirming their suitability for the bioremediation of digestate [8]. The non-axenic and open conditions of the bioreactors allowed for the entry of protozoa and bacteria, which actively interacted with the microalgae. As commonly observed in microalgal cultivation systems, predation, synergistic, antagonist and competitive mechanisms could be detected [13,70]. In the RWP, algivorous and microalgal grazers, belonging to Ciliophora, constantly co-existed with the microalgae, while in the PBR, predators were mainly detected when the microalgal growth was impaired. Nitrifiers and cyanobacteria, which are known to compete with the microalgae for CO2 and ammoniacal nitrogen, colonized both reactors to different extent. Pseudomonas sp., which are known to be plant growth-promoting bacteria [71], were probably beneficial for the microalgae by producing siderophores for iron absorption, solubilize phosphate and synthetize phytohormones, such as indole-3-acetic acid (IAA) [72,73]. On the other hand, antagonist interactions between bacteria and microalgae occurred, as demonstrated by the negative correlation between the number of bacteria and microalgal counts. This evidence contrasts with the frequently stated symbiotic relationship between microalgae and bacteria in microalgae-based technology treating wastewaters [70,74]. However, most of the synergetic interaction concerns the exchange of O2 and CO2 during the photosynthetic activity and the aerobic degradation of the organic matter by the heterotrophic bacteria. In our systems, most of the COD in the centrate was not easily biodegradable, as shown by the negligible COD removal rate. Therefore, the growth of the heterotrophs was fostered only when organic compounds were available by microalgal cells’ decay.
The non-parallel evolution of the microbial populations in the two reactors indicates that the configuration and operational parameters had a key role in regulating the composition and dynamics of the microalgal and bacterial communities. Without a doubt, high irradiance and temperature were responsible for the shifts between Chlorellaceae and Scenedesmaceae in both reactors due to the more advantageous physiological traits of the latter in such conditions [58,59], but the diverse pH and concentrations of N compounds in each reactor promoted the selection of specific populations. In the RWP, the high level of nitrate, which was derived by complete nitrification, and the concentration of ammonium in the influent seems to favor C. sorokiniana, P. nurekis and their predator G. steinii, as well as denitrifiers. On the contrary, in the PBR, nitrite accumulation caused by the incomplete nitrification, promoted the growth of Chlamydomonas spp. and Micractinium sp., while the alkaline pH supported the establishment of members of Chloroflexi. Although not all the population shifts could be explained by the variations of the abiotic conditions because of the influence of stochastic factors [12], the association found between the microbes displaying specific functional traits and the environmental conditions established in each reactor might help to predict which populations are favored under various environmental and operational scenarios.
The communities in the RWP were more dynamic than those in the PBR, as demonstrated by the higher number of significant population shifts observed in both microalgal and bacterial communities. Nevertheless, the PBR was more subject to drastic events, while the RWP seemed to be more resilient to perturbations. In the RWP, the negative effect of the shading net on the microalgal composition could be barely detected, while a drastic increase in non-microalgal populations could be observed in the PBR. Yet, the microalgal community in the RWP recovered when the climate conditions got worse, but not in the PBR. The continuous perturbations of the ecosystems due to changes in the abiotic conditions and resource availability favored the growth of microalgae and bacteria with more favorable niche traits and migration of new microbes in both reactors. Nevertheless, the RWP constantly harbored non-algal eukaryotes suggesting more trophic interactions; the coexistence of predators and microalgae was more evident in the RWP than in the PBR, as well as predator diversity was higher in RWP than PBR (only one in PBR and three in RWP). It seems that the more complex community established in the RWP helped in contrasting the spread of the predators over time by maintaining the predator/prey dynamics under control, even if the raceway system has a wider open area and a design more prone to external contamination.
The establishment of a diversified microalgal community derived by the variable abiotic conditions seemed to play a role in maintaining the productivity of the reactors in agreement with other aquatic ecosystems [75,76] and microalgal cultivation systems [25,77]. The trends of microalgal density showed two peaks in both reactors. In the PBR, the highest and first peak corresponded to day 18 and 31, when the community was dominated by Chlorella. The extremely high temperature and irradiance of the following days led to a switch to the Scenedesmaceae, but a drastic decrement of the biomass. Biomass concentration and diversity increased again only with the mitigation of the climatic factors. Similarly, in the RWP, the initial biomass productivity was sustained by the Chlorellaceae and Scenedesmaceae; nevertheless, the highest concentration of biomass could be detected when the climatic and operational conditions were more variable. These findings endorse the use of microalgal polycultures for a more stable production of biomass in outdoor cultivation systems, especially if located in regions with a temperate climate where the environmental conditions are subject to seasonal variations

Supplementary Materials

The following are available online at https://www.mdpi.com/2076-2607/8/11/1754/s1, Figure S1: Images of the main microalgae, protozoa and cyanobacteria observed in the PBR and RWP over time; Figure S2: Number of the total eukariotic (NEK) (A) and bacterial species (NBAC) (B) detected in the column (PBR) and raceway pond (RWP) over time; Figure S3: Non-metric multidimensional scaling analyses of the eukaryotic (A and B) and bacterial OTU patterns (C and D) in the PBR (blue) and in the RWP (black). Numbers indicate the sampling date, while arrows represent directions of forcing of each environmental parameter measured in the influent (IN) and reactors (OUT). Torb is the turbidity. TPBR and TRWP is the temperature in the bubble column and in the raceway pond, respectively. I is the irradiance; Figure S4: Bipartite network based on the interaction between the most abundant (>1%) eukaryotic and bacterial OTUs in bubble columns and raceways pond (A and B).

Author Contributions

Conceptualization, K.P., E.F. and M.B.; Data curation, A.B., K.P., A.P. (Anna Pozzi), G.B., A.P. (Andrea Pizzera), E.F. and M.B.; Formal analysis, A.B., C.P., A.P. (Andrea Pizzera) and M.B.; Funding acquisition, K.P. and E.F.; Investigation, A.B., A.P. (Andrea Pizzera) and M.B.; Methodology, A.B., A.P. (Anna Pozzi), C.P. and M.B.; Project administration, K.P. and E.F.; Resources, K.P., G.B. and E.F.; Software, A.B.; Supervision, K.P., E.F. and M.B.; Validation, A.B., A.P. (Anna Pozzi), C.P. and M.B.; Visualization, A.B. and M.B.; Writing—original draft, A.B. and M.B.; Writing—review and editing, E.F. All authors have read and agreed to the published version of the manuscript.

Funding

This work was supported by Fondazione Cariplo within the project “Polo delle Microalghe”. A.B. was supported by SABANA Horizon 2020 grant (University of Milan, Grant No. 727874).

Acknowledgments

The authors would like to thank Davide Scaglione, Lorenzo Proietti, Luciano Foglio and Federico Castillo Cascino for their logistic help and the images taken through the microscope. The authors are also grateful to Luigimaria Borruso for fruitful discussion.

Conflicts of Interest

The authors declare no conflict of interest.

References

  1. Puyol, D.; Batstone, D.J.; Hülsen, T.; Astals, S.; Peces, M.; Krömer, J.O. Resource Recovery from Wastewater by Biological Technologies: Opportunities, Challenges, and Prospects. Front. Microbiol. 2017, 7, 1–23. [Google Scholar] [CrossRef] [PubMed] [Green Version]
  2. Subashchandrabose, S.R.; Ramakrishnan, B.; Megharaj, M.; Venkateswarlu, K.; Naidu, R. Consortia of cyanobacteria/microalgae and bacteria: Biotechnological potential. Biotechnol. Adv. 2011, 29, 896–907. [Google Scholar] [CrossRef] [PubMed]
  3. Bellucci, M.; Marazzi, F.; Naddeo, L.S.; Piergiacomo, F.; Beneduce, L.; Ficara, E.; Mezzanotte, V. Disinfection and nutrient removal in laboratory-scale photobioreactors for wastewater tertiary treatment. J. Chem. Technol. Biotechnol. 2019. [Google Scholar] [CrossRef]
  4. Marazzi, F.; Bellucci, M.; Fantasia, T.; Ficara, E.; Mezzanotte, V. Interactions between Microalgae and Bacteria in the Treatment of Wastewater from Milk Whey Processing. Water 2020, 12, 297. [Google Scholar] [CrossRef] [Green Version]
  5. Huy, M.; Kumar, G.; Kim, H.W.; Kim, S.H. Photoautotrophic cultivation of mixed microalgae consortia using various organic waste streams towards remediation and resource recovery. Bioresour. Technol. 2018, 247, 576–581. [Google Scholar] [CrossRef] [PubMed]
  6. Lim, S.L.; Chu, W.L.; Phang, S.M. Use of Chlorella vulgaris for bioremediation of textile wastewater. Bioresour. Technol. 2010, 101, 7314–7322. [Google Scholar] [CrossRef]
  7. Trentin, G.; Bertucco, A.; Sforza, E. Mixotrophy in Synechocystis sp. for the treatment of wastewater with high nutrient content: Effect of CO2 and light. Bioprocess Biosyst. Eng. 2019, 42, 1661–1669. [Google Scholar] [CrossRef]
  8. Xia, A.; Murphy, J.D. Microalgal cultivation in treating liquid digestate from biogas systems. Trends Biotechnol. 2016, 34, 264–275. [Google Scholar] [CrossRef]
  9. Lavrinovičs, A.; Juhna, T. Review on Challenges and Limitations for Algae-Based Wastewater Treatment. Constr. Sci. 2018, 20, 17–25. [Google Scholar] [CrossRef] [Green Version]
  10. Fulbright, S.P.; Dean, M.K.; Wardle, G.; Lammers, P.J.; Chisholm, S. Molecular diagnostics for monitoring contaminants in algal cultivation. Algal Res. 2014, 4, 41–51. [Google Scholar] [CrossRef]
  11. Ofiţeru, I.D.; Lunn, M.; Curtis, T.P.; Wells, G.F.; Criddle, C.S.; Francis, C.A.; Sloan, W.T. Combined niche and neutral effects in a microbial wastewater treatment community. Proc. Natl. Acad. Sci. USA 2010, 107, 15345–15350. [Google Scholar] [CrossRef] [PubMed] [Green Version]
  12. Van Der Gast, C.J.; Ager, D.; Lilley, A.K. Temporal scaling of bacterial taxa is influenced by both stochastic and deterministic ecological factors. Environ. Microbiol. 2008, 10, 1411–1418. [Google Scholar] [CrossRef] [PubMed]
  13. Day, J.G.; Gong, Y.; Hu, Q. Microzooplanktonic grazers—A potentially devastating threat to the commercial success of microalgal mass culture. Algal Res. 2017, 27, 356–365. [Google Scholar] [CrossRef]
  14. Mark Ibekwe, A.; Murinda, S.E.; Murry, M.A.; Schwartz, G.; Lundquist, T. Microbial community structures in high rate algae ponds for bioconversion of agricultural wastes from livestock industry for feed production. Sci. Total Environ. 2017, 580, 1185–1196. [Google Scholar] [CrossRef] [Green Version]
  15. Sutherland, D.L.; Turnbull, M.H.; Craggs, R.J. Environmental drivers that influence microalgal species in fullscale wastewater treatment high rate algal ponds. Water Res. 2017, 124, 504–512. [Google Scholar] [CrossRef]
  16. Cho, D.-H.; Choi, J.-W.; Kang, Z.; Kim, B.-H.; Oh, H.-M.; Kim, H.; Ramanan, R. Microalgal diversity fosters stable biomass productivity in open ponds treating wastewater. Sci. Rep. 2017, 7, 1979. [Google Scholar] [CrossRef] [Green Version]
  17. Rodolfi, L.; Chini Zittelli, G.; Bassi, N.; Padovani, G.; Biondi, N.; Bonini, G.; Tredici, M.R. Microalgae for oil: Strain selection, induction of lipid synthesis and outdoor mass cultivation in a low-cost photobioreactor. Biotechnol. Bioeng. 2009, 102, 100–112. [Google Scholar] [CrossRef] [PubMed]
  18. Wang, L.; Yuan, D.; Li, Y.; Ma, M.; Hu, Q.; Gong, Y. Contaminating microzooplankton in outdoor microalgal mass culture systems: An ecological viewpoint. Algal Res. 2016, 20, 258–266. [Google Scholar] [CrossRef]
  19. González-Camejo, J.; Aparicio, S.; Ruano, M.V.; Borrás, L.; Barat, R.; Ferrer, J. Effect of ambient temperature variations on an indigenous microalgae-nitrifying bacteria culture dominated by Chlorella. Bioresour. Technol. 2019, 290, 121788. [Google Scholar] [CrossRef]
  20. González-Camejo, J.; Montero, P.; Aparicio, S.; Ruano, M.V.; Borrás, L.; Seco, A.; Barat, R. Nitrite inhibition of microalgae induced by the competition between microalgae and nitrifying bacteria. Water Res. 2020, 172, 115499. [Google Scholar] [CrossRef] [Green Version]
  21. Xin, L.; Hong-ying, H.; Ke, G.; Jia, Y. Growth and nutrient removal properties of a freshwater microalga Scenedesmus sp. LX1 under different kinds of nitrogen sources. Ecol. Eng. 2010, 36, 379–381. [Google Scholar] [CrossRef]
  22. Lian, J.; Wijffels, R.H.; Smidt, H.; Sipkema, D. The effect of the algal microbiome on industrial production of microalgae. Microb. Biotechnol. 2018, 11, 806–818. [Google Scholar] [CrossRef] [PubMed] [Green Version]
  23. Krustok, I.; Odlare, M.; Shabiimam, M.A.; Truu, J.; Truu, M.; Ligi, T.; Nehrenheim, E. Characterization of algal and microbial community growth in a wastewater treating batch photo-bioreactor inoculated with lake water. Algal Res. 2015, 11, 421–427. [Google Scholar] [CrossRef] [Green Version]
  24. Lakaniemi, A.-M.; Hulatt, C.J.; Wakeman, K.D.; Thomas, D.N.; Puhakka, J. A Eukaryotic and prokaryotic microbial communities during microalgal biomass production. Bioresour. Technol. 2012, 124, 387–393. [Google Scholar] [CrossRef] [PubMed]
  25. Beyter, D.; Tang, P.; Becker, S.; Hoang, T.; Bilgin, D.; Lim, W.; Peterson, T.C.; Mayfield, S.; Haerizadeh, F.; Shurin, J.B.; et al. Diversity, Productivity, and Stability of an Industrial Microbial Ecosystem. Appl. Environ. Microbiol. 2016, 82, 2494–2505. [Google Scholar] [CrossRef] [Green Version]
  26. Eland, L.E.; Davenport, R.J.; dos Santos, A.B.; Mota Filho, C.R. Molecular evaluation of microalgal communities in full-scale waste stabilisation ponds. Environ. Technol. 2019, 40, 1969–1976. [Google Scholar] [CrossRef]
  27. Ferro, L.; Hu, Y.O.O.; Gentili, F.G.; Andersson, A.F.; Funk, C. DNA metabarcoding reveals microbial community dynamics in a microalgae-based municipal wastewater treatment open photobioreactor. Algal Res. 2020, 51, 102043. [Google Scholar] [CrossRef]
  28. Pizzera, A.; Scaglione, D.; Bellucci, M.; Marazzi, F.; Mezzanotte, V.; Parati, K.; Ficara, E. Digestate treatment with algae-bacteria consortia: A field pilot-scale experimentation in a sub-optimal climate area. Bioresour. Technol. 2019, 274, 232–243. [Google Scholar] [CrossRef] [PubMed]
  29. Anthonisen, A.; Loehr, R.; Prakasam, T.; Srinath, E. Inhibition of Nitrification by Ammonia and Nitrous Acid. J. Water Pollut. Control Fed. 1976, 48, 835–852. [Google Scholar]
  30. Herlemann, D.P.R.; Labrenz, M.; Jürgens, K.; Bertilsson, S.; Waniek, J.J.; Andersson, A.F. Transitions in bacterial communities along the 2000 km salinity gradient of the Baltic Sea. ISME J. 2011, 5, 1571. [Google Scholar] [CrossRef] [Green Version]
  31. White, T.; Bruns, T.; Lee, S.; Taylor, J. Amplification and direct sequencing of fungal ribosomal RNA genes for phylogenetics. In PCR Protocols: A Guide to Methods and Applications; Innis, M., Gelfand, D., Shinsky, J., White, T., Eds.; Academic Press: San Diego, CA, USA, 1990; pp. 315–322. [Google Scholar]
  32. Ferris, M.J.; Muyzer, G.; Ward, D.M. Denaturing gradient gel electrophoresis profiles of 16S rRNA-defined populations inhabiting a hot spring microbial mat community. Appl. Environ. Microbiol. 1996, 62, 340–346. [Google Scholar] [CrossRef] [Green Version]
  33. Rotthauwe, J.H.; Witzel, K.P.; Liesack, W. The ammonia monooxygenase structural gene amoA as a functional marker: Molecular fine-scale analysis of natural ammonia-oxidizing populations. Appl. Environ. Microbiol. 1997, 63, 4704–4712. [Google Scholar] [CrossRef] [PubMed] [Green Version]
  34. Marazzi, F.; Bellucci, M.; Fornaroli, R.; Bani, A.; Ficara, E.; Mezzanotte, V. Lab-scale testing of operation parameters for algae based treatment of piggery wastewater. J. Chem. Technol. Biotechnol. 2020, 95, 967–974. [Google Scholar] [CrossRef]
  35. Bani, A.; Borruso, L.; Matthews Nicholass, K.J.; Bardelli, T.; Polo, A.; Pioli, S.; Gómez-Brandón, M.; Insam, H.; Dumbrell, A.J.; Brusetti, L. Site-Specific Microbial Decomposer Communities Do Not Imply Faster Decomposition: Results from a Litter Transplantation Experiment. Microorganisms 2019, 7, 349. [Google Scholar] [CrossRef] [Green Version]
  36. Bellucci, M.; Ofiţeru, I.D.; Beneduce, L.; Graham, D.W.; Head, I.M.; Curtis, T.P. A preliminary and qualitative study of resource ratio theory to nitrifying lab-scale bioreactors. Microb. Biotechnol. 2015, 8, 590–603. [Google Scholar] [CrossRef]
  37. Klappenbach, J.A. rrndb: The Ribosomal RNA Operon Copy Number Database. Nucleic Acids Res. 2001, 29, 181–184. [Google Scholar] [CrossRef] [Green Version]
  38. McTavish, H.; Fuchs, J.A.; Hooper, A.B. Sequence of the gene coding for ammonia monooxygenase in Nitrosomonas europaea. J. Bacteriol. 1993, 175, 2436–2444. [Google Scholar] [CrossRef] [Green Version]
  39. Bellucci, M.; Ofiteru, I.D.; Graham, D.W.; Head, I.M.; Curtis, T.P. Low-dissolved-oxygen nitrifying systems exploit ammonia-oxidizing bacteria with unusually high yields. Appl. Environ. Microbiol. 2011, 77, 7787–7796. [Google Scholar] [CrossRef] [Green Version]
  40. Coskuner, G.; Ballinger, S.J.; Davenport, R.J.; Pickering, R.L.; Solera, R.; Head, I.M.; Curtis, T.P. Agreement between theory and measurement in quantification of ammonia-oxidizing bacteria. Appl. Environ. Microbiol. 2005, 71, 6325–6334. [Google Scholar] [CrossRef] [Green Version]
  41. Caporaso, J.G.; Kuczynski, J.; Stombaugh, J.; Bittinger, K.; Bushman, F.D.; Costello, E.K.; Fierer, N.; Peña, A.G.; Goodrich, J.K.; Gordon, J.I.; et al. QIIME allows analysis of high-throughput community sequencing data. Nat. Methods 2010, 7, 335–336. [Google Scholar] [CrossRef] [Green Version]
  42. Edgar, R.C. Search and clustering orders of magnitude faster than BLAST. Bioinformatics 2010, 26, 2460–2461. [Google Scholar] [CrossRef] [Green Version]
  43. Wang, Q.; Garrity, G.M.; Tiedje, J.M.; Cole, J.R. Naïve Bayesian Classifier for Rapid Assignment of rRNA Sequences into the New Bacterial Taxonomy. Appl. Environ. Microbiol. 2007, 73, 5261–5267. [Google Scholar] [CrossRef] [Green Version]
  44. R Core Team; R Development Core Team. R: A Language and Environment for Statistical Computing [Internet]; 2019. Available online: https://www.r-project.org/ (accessed on 20 October 2020).
  45. Oksanen, J.; Blanchet, F.G.; Friendly, M.; Kindt, R.; Legendre, P.; McGlinn, D.; Minchin, P.R.; O’Hara, R.B.; Simpson, G.L.; Solymos, P.; et al. Vegan: Community Ecology Package. R Packag Version 2.4-1. 2016. Available online: https://cran.r-project.org/web/packa (accessed on 20 October 2020).
  46. Borruso, L.; Sannino, C.; Selbmann, L.; Battistel, D.; Zucconi, L.; Azzaro, M.; Turchetti, B.; Buzzini, P.; Guglielmin, M. A thin ice layer segregates two distinct fungal communities in Antarctic brines from Tarn Flat (Northern Victoria Land). Sci. Rep. 2018, 8, 6582. [Google Scholar] [CrossRef]
  47. Whitaker, D.; Christman, M. Package ‘Clustsig’. R Top Doc. 2015; pp. 1–7. Available online: http://www.douglaswhitaker.com (accessed on 20 October 2020).
  48. Wickham, H. ggplot2: Elegant Graphics for Data Analysis; Springer: New York, NY, USA, 2016; ISBN 978-3-319-24277-4. [Google Scholar]
  49. Wei, T.; Simko, V. R Package “Corrplot”: Visualization of a Correlation Matrix. 2017. Available online: https://github.com/taiyun/corrplot (accessed on 20 October 2020).
  50. Faust, K.; Raes, J. CoNet app: Inference of biological association networks using Cytoscape. F1000Research 2016, 5, 1519. [Google Scholar] [CrossRef]
  51. Shannon, P.; Markiel, A.; Ozier, O.; Baliga, N.S.; Wang, J.T.; Ramage, D.; Amin, N.; Schwikowski, B.; Ideker, T. Cytoscape: A Software Environment for Integrated Models of Biomolecular Interaction Networks. Genome Res. 2003, 13, 2498–2504. [Google Scholar] [CrossRef]
  52. Csardi, G.; Nepusz, T. The igraph software package for complex network research. Inter J. Complex Syst. 2006, 1695, 1–9. [Google Scholar]
  53. Daims, H.; Ramsing, N.B.; Schleifer, K.H.; Wagner, M. Cultivation-independent, semiautomatic determination of absolute bacterial cell numbers in environmental samples by fluorescence in situ hybridization. Appl. Environ. Microbiol. 2001, 67, 5810–5818. [Google Scholar] [CrossRef] [PubMed] [Green Version]
  54. Mantovani, M.; Marazzi, F.; Fornaroli, R.; Bellucci, M.; Ficara, E.; Mezzanotte, V. Outdoor pilot-scale raceway as a microalgae-bacteria sidestream treatment in a WWTP. Sci. Total Environ. 2020, 710, 135583. [Google Scholar] [CrossRef] [PubMed]
  55. Marazzi, F.; Bellucci, M.; Rossi, S.; Fornaroli, R.; Ficara, E.; Mezzanotte, V. Outdoor pilot trial integrating a sidestream microalgae process for the treatment of centrate under non optimal climate conditions. Algal Res. 2019, 39, 101430. [Google Scholar] [CrossRef] [Green Version]
  56. Krohn-molt, I.; Alawi, M.; Förstner, K.U.; Wiegandt, A.; Burkhardt, L.; Indenbirken, D.; Thieß, M.; Grundhoff, A.; Kehr, J.; Tholey, A.; et al. Insights into Microalga and Bacteria Interactions of Selected Phycosphere Biofilms Using and Proteomic Approaches. Front. Microbiol. 2017, 8, 1–14. [Google Scholar] [CrossRef]
  57. Tilman, D. Resource Competition between Plankton Algae: An Experimental and Theoretical Approach. Ecology 1977, 58, 338–348. [Google Scholar] [CrossRef]
  58. Hodaifa, G.; Martínez, M.E.; Sánchez, S. Influence of temperature on growth of Scenedesmus obliquus in diluted olive mill wastewater as culture medium. Eng. Life Sci. 2010, 10, 257–264. [Google Scholar] [CrossRef]
  59. Masojídek, J.; Torzillo, G.; Koblížek, M.M.; Kopecký, J.; Bernardini, P.; Sacchi, A.; Komenda, J. Photoadaptation of two members of the Chlorophyta (Scenedesmus and Chlorella) in laboratory and outdoor cultures: Changes in chlorophyll fluorescence quenching and the xanthophyll cycle. Planta 1999, 209, 126–135. [Google Scholar] [CrossRef]
  60. Rosenberg, J.N.; Kobayashi, N.; Barnes, A.; Noel, E.A.; Betenbaugh, M.J.; Oyler, G.A. Comparative analyses of three Chlorella species in response to light and sugar reveal distinctive lipid accumulation patterns in the Microalga C. sorokiniana. PLoS ONE 2014, 9, e92460. [Google Scholar] [CrossRef] [Green Version]
  61. Mayeli, S.M.; Nandini, S.; Sarma, S.S.S. The efficacy of Scenedesmus morphology as a defense mechanism against grazing by selected species of rotifers and cladocerans. Aquat. Ecol. 2005, 38, 515–524. [Google Scholar] [CrossRef]
  62. Litchman, E.; Pinto, P.D.T.; Klausmeier, C.A.; Thomas, M.K.; Yoshiyama, K. Linking traits to species diversity and community structure in phytoplankton. Hydrobiologia 2010, 15–28. [Google Scholar] [CrossRef]
  63. Issa, A.; Mohamed, H.A.; Ohyama, T. Nitrogen fixing cyanobacteria: Future prospect. In Advances in Biology and Ecology of Nitrogen Fixation; Ohyama, T., Ed.; InTech: Leeds, UK, 2014; pp. 23–48. [Google Scholar]
  64. Yang, G.; Peng, M.; Tian, X.; Dong, S. Molecular ecological network analysis reveals the effects of probiotics and florfenicol on intestinal microbiota homeostasis: An example of sea cucumber. Sci. Rep. 2017, 7, 4778. [Google Scholar] [CrossRef] [Green Version]
  65. Marcilhac, C.; Sialve, B.; Pourcher, A.M.; Ziebal, C.; Bernet, N.; Béline, F. Control of nitrogen behaviour by phosphate concentration during microalgal-bacterial cultivation using digestate. Bioresour. Technol. 2015, 175, 224–230. [Google Scholar] [CrossRef]
  66. Bellucci, M.; Marazzi, F.; Ficara, E.; Mezzanotte, V. Effect of N:P ratio on microalgae/nitrifying bacteria community in agro-digestate treatment. Environ. Clim. Technol. 2020, 24, 136–148. [Google Scholar] [CrossRef]
  67. Montes, C.; Altimira, F.; Canchignia, H.; Castro, Á.; Sánchez, E.; Miccono, M.; Tapia, E.; Sequeida, Á.; Valdés, J.; Tapia, P.; et al. A draft genome sequence of Pseudomonas veronii R4: A grapevine (Vitis vinifera L.) root-associated strain with high biocontrol potential. Stand. Genom. Sci. 2016, 11, 76. [Google Scholar] [CrossRef]
  68. Liu, H.; Ding, Y.; Zhang, Q.; Liu, X.; Xu, J.; Li, Y.; Di, H. Heterotrophic nitrification and denitrification are the main sources of nitrous oxide in two paddy soils. Plant Soil 2019, 445, 39–53. [Google Scholar] [CrossRef]
  69. Trung Tran, T.; Bott, N.J.; Dai Lam, N.; Trung Nguyen, N.; Hoang Thi Dang, O.; Hoang Le, D.; Tung Le, L.; Hoang Chu, H. The Role of Pseudomonas in Heterotrophic Nitrification: A Case Study on Shrimp Ponds (Litopenaeus vannamei) in Soc Trang Province. Microorganisms 2019, 7, 155. [Google Scholar] [CrossRef] [Green Version]
  70. Ramanan, R.; Kim, B.-H.H.; Cho, D.-H.H.; Oh, H.-M.M.; Kim, H.-S.S. Algae-bacteria interactions: Evolution, ecology and emerging applications. Biotechnol. Adv. 2016, 34, 14–29. [Google Scholar] [CrossRef] [Green Version]
  71. Glick, B.R. Plant Growth-Promoting Bacteria: Mechanisms and Applications. Scientifica 2012, 2012, 963401. [Google Scholar] [CrossRef] [Green Version]
  72. Amavizca, E.; Bashan, Y.; Ryu, C.M.; Farag, M.A.; Bebout, B.M.; De-Bashan, L.E. Enhanced performance of the microalga Chlorella sorokiniana remotely induced by the plant growth-promoting bacteria Azospirillum brasilense and Bacillus pumilus. Sci. Rep. 2017, 7, 1–11. [Google Scholar] [CrossRef]
  73. Saranraj, P. Biocontrol potentiality of plant growth promoting bacteria (PGPR)—Pseudomonas fluorescens and Bacillus subtilis: A review. Afr. J. Agric. Res. 2014, 9, 1265–1277. [Google Scholar]
  74. Seymour, J.R.; Amin, S.A.; Raina, J.-B.; Stocker, R. Zooming in on the phycosphere: The ecological interface for phytoplankton–bacteria relationships. Nat. Microbiol. 2017, 2, 17065. [Google Scholar] [CrossRef]
  75. Cardinale, B.J. Biodiversity improves water quality through niche partitioning. Nature 2011, 472, 86–89. [Google Scholar] [CrossRef]
  76. Godwin, C.M.; Lashaway, A.R.; Hietala, D.C.; Savage, P.E.; Cardinale, B.J. Biodiversity improves the ecological design of sustainable biofuel systems. GCB Bioenergy 2018, 10, 752–765. [Google Scholar] [CrossRef]
  77. Stockenreiter, M.; Graber, A.K.; Haupt, F.; Stibor, H. The effect of species diversity on lipid production by micro-algal communities. J. Appl. Phycol. 2012, 24, 45–54. [Google Scholar] [CrossRef]
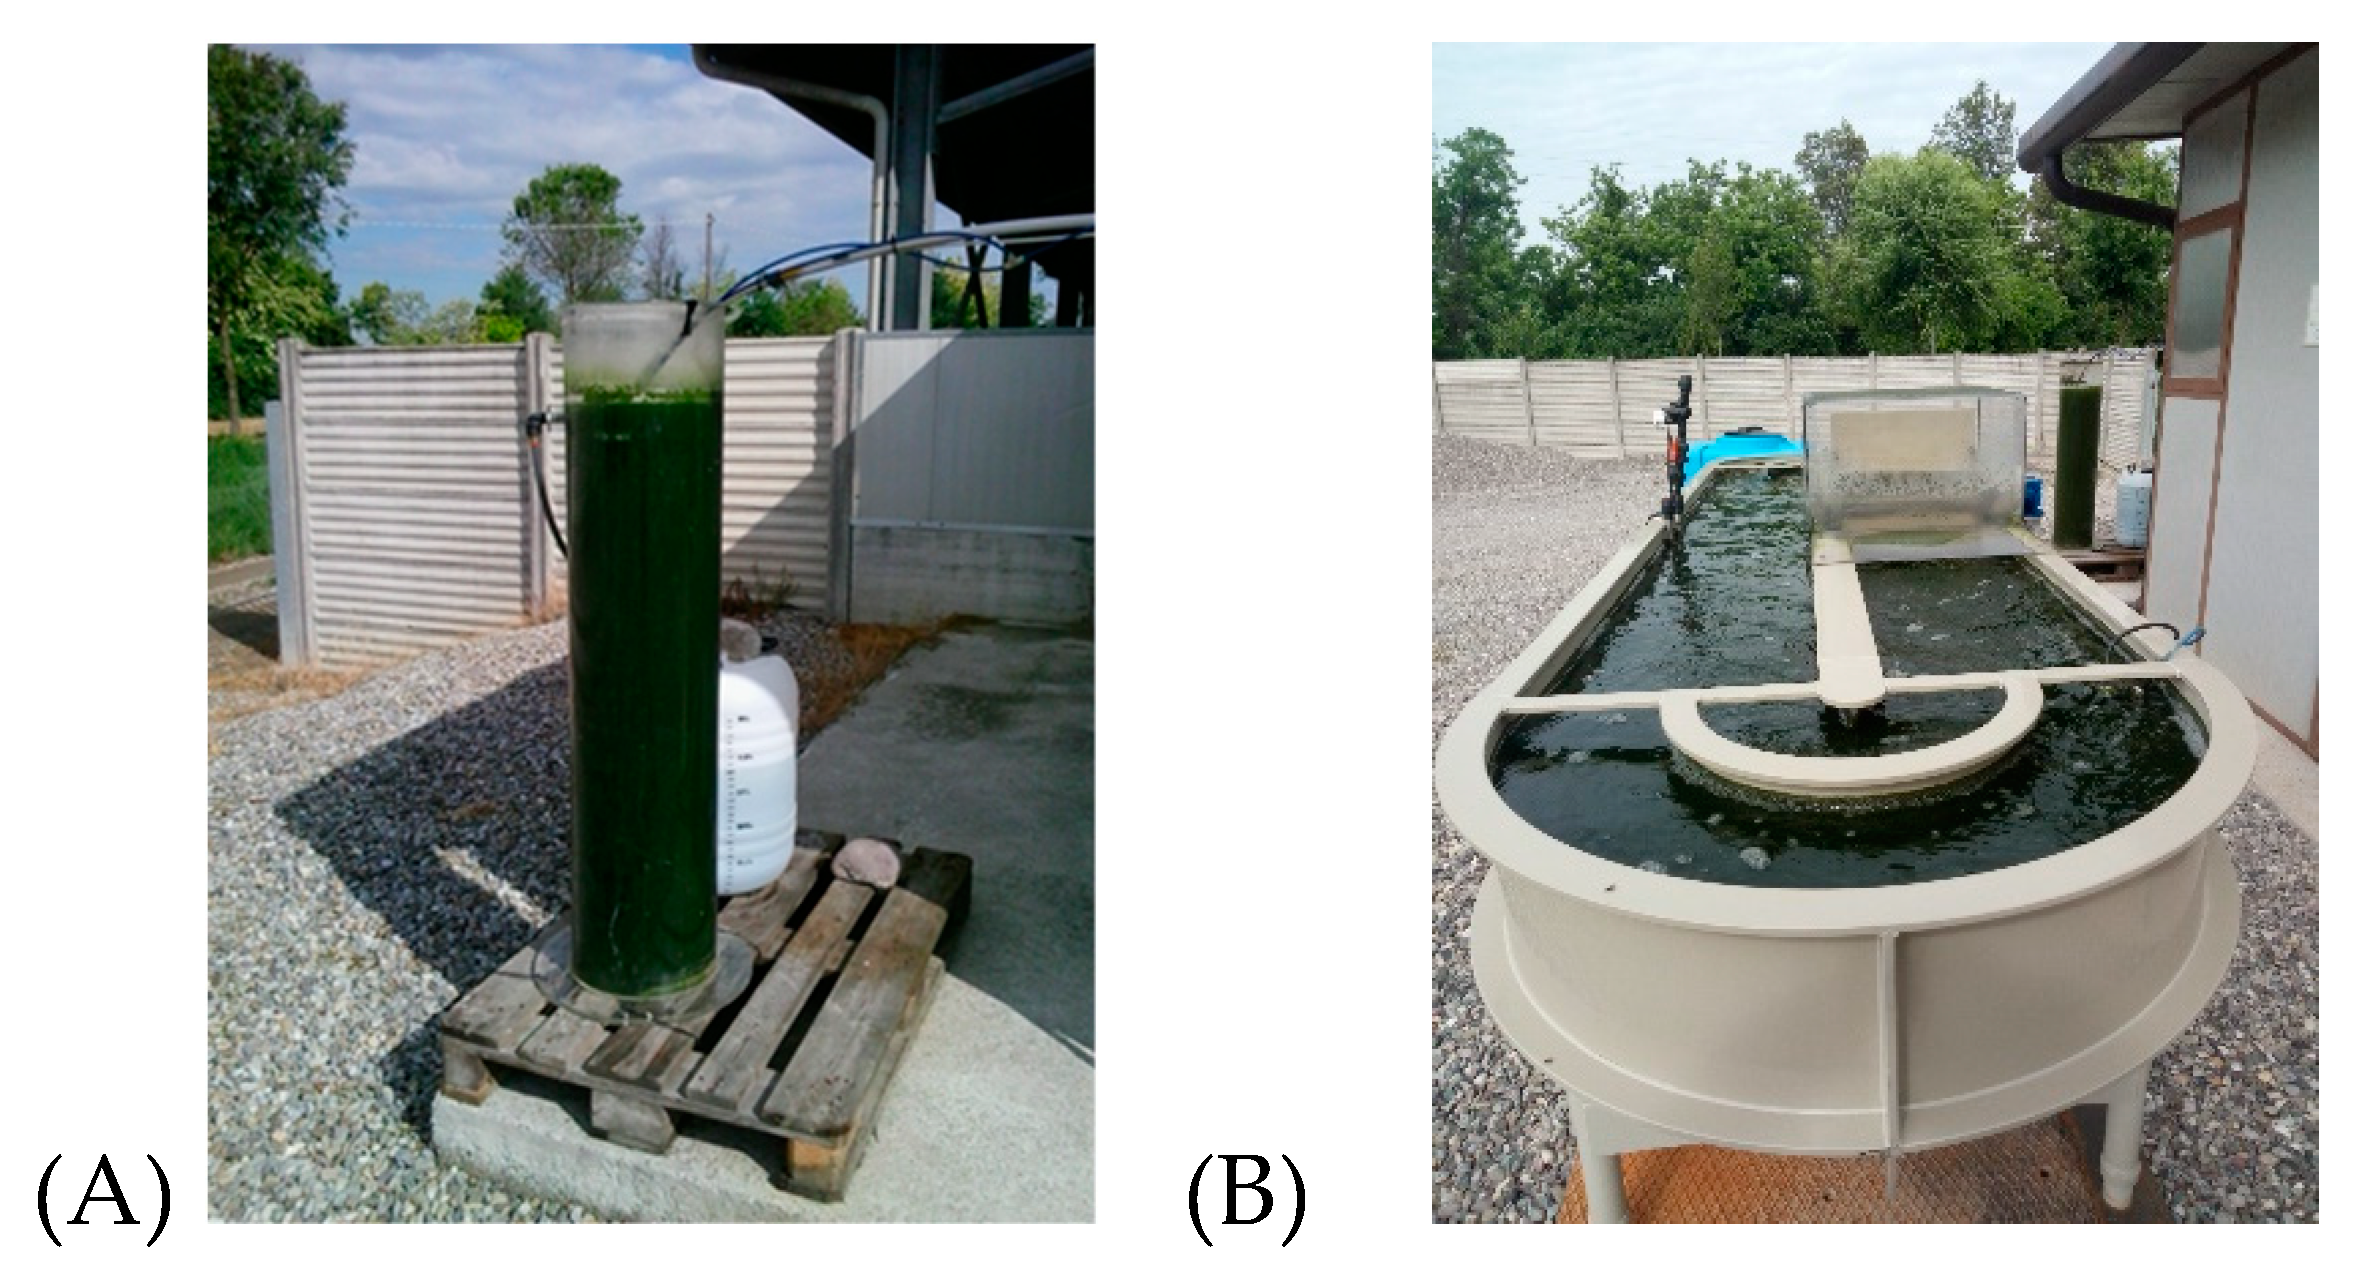
Figure 1. Bubble column photobioreactor (A) and a raceway pond (B).
Microorganisms 08 01754 g001
Figure 2. Temperature detected inside the PBR (grey) and RWP (black) and irradiance (dashed line).
Microorganisms 08 01754 g002
Figure 3. Concentration of the total nitrogen (TN) in the influent (dashed line), ammonium (solid black line), nitrite (solid dark grey line) and nitrate (solid light grey line) measured in PBR (A) and RWP (B). Microalgal density measured as optical density (OD680) (dashed line) and total suspended solid (TSS) concentration (solid line) detected over time into PBR (C) and RWP (D).
Microorganisms 08 01754 g003
Figure 4. Concentration of the total (dark grey) and ammonia oxidizing (light grey) bacteria detected over time into the PBR (A) and the RWP (B).
Microorganisms 08 01754 g004
Figure 5. Relative abundance of the main eukaryotic organisms (genus level higher than 1%) detected in the PBR (A) and RWP (B). Taxonomic ranks (Family and Phylum) are also provided. Above the bar plots, significant population shifts, which were assessed by the combined SIMPROF and clustering analyses, are reported. For line colors refer to the dendrogram in Figure 7A, while the numbers identified the codes in Table 4.
Microorganisms 08 01754 g005
Figure 6. Relative abundance of the main bacterial genera (>10%) detected in the RWP (A) and PBR (B). Taxonomic ranks (Class and Phylum) are also provided. Above the bar plots, significant shifts of the bacterial communities, assessed by the combined SIMPROF and clustering analyses, are reported. For line colors refer to the dendrogram in Figure 7B, while the numbers identified the codes in Table 4.
Microorganisms 08 01754 g006
Figure 7. Heatmap and dendrogram based on Bray-Curtis similarity matrices identifying the main significant eukaryotic (species level) (A) and bacterial (genera level) (B) population changes detected by SIMPROF analyses. The colored clusters in the dendrogram are representative of statistically similar community patterns.
Microorganisms 08 01754 g007
Figure 8. Correlation patterns between the relative abundance of the main eukaryotic (species level, threshold 1%) (A) and bacterial (genus level, threshold 10%) (B) populations, which were detected in the two reactors, and the mean of the physicochemical and operational parameters measured in the influent (IN) and in the photobioreactors (OUT) the previous seven days based on the Kendall rank correlation coefficient. Only significant positive (blue) and negative (red) correlations are shown (p-value < 0.05) in the matrices. I_m and T_m are the average daily values of the solar irradiance and temperature, respectively; T_r is the temperature detected in the reactors, FA is the free ammonia and O2 is the dissolved oxygen concentration.
Microorganisms 08 01754 g008
Table 1. Average physicochemical characteristics of the diluted centrate, which was used to feed the column (PBR) and in the raceway pond (RWP). Significant differences between reactors are also evidenced (*) (Paired -t test, p-value < 0.05).
PBRRWPp-value
COD (mg L−1)298 ± 48.7376 ± 111*
NH4+-N (mg L−1)260.1 ± 61.9288.2 ± 86.7
NO3--N (mg L−1)7.9 ± 3.111.3 ± 5.1
PO43--P (mg L−1)14.6 ± 415 ± 9.8
Table 2. Average chemical-physical parameters in column (PBR) and in the raceway pond (RWP), as well as the Chemical Oxygen Demand (COD) and nutrient removal rate observed. Significant differences between reactors are also expressed (*) (Paired -t test, p-value < 0.05).
PBRRWPp-value
pH8.5 ± 0.57.2 ± 0.6*
Tr §24.5± 6.221.9 ± 7.2*
rrCOD (mg L−1 d −1)−4 ± 10.75.7 ± 6.1
rrTAN (mg L−1 d −1)21.9 ± 7.319.5 ± 6.6
rpNOx-N (mg L−1 d −1)14.4 ± 12.118.1 ± 6.9
rpNO2--N (mg L−1 d −1)13.5 ± 11.21.4 ± 2.2*
rpNO3--N (mg L−1 d −1)1 ± 1.316.7 ± 7.9*
Free Ammonia (mg L−1)5.7 ± 8.51.8 ± 3.3
ηTAN (%)84.1 ± 13.179 ± 14.8
rrPO43−-P (mg L−1 d −1)0.6 ± 0.90.3 ± 0.9
rpVSS (mg L−1 d −1)27 ± 20.323 ± 20.3
§ Tr is the temperature detected inside the reactors.
Table 3. Summary of the total number of Eukaryotic (non-microalgae and microalgae) operational taxonomic units (OTUs) with a percentage above 1%, number of shared OTUs between the column (PBR) and the raceway pond (RWP), and number of OTUs detected in the sole PBR or RWP.
TotalSharedOnly PBROnly RWP
Eukaryotes63101835
Non-microalgal4021127
Microalgae23878
Table 4. Plausible mechanisms of the evolution of the microbial populations in the column (PBR) and the race way pond (RWP). Codes are the same as those reported in Figure 5 and Figure 6, while in brackets the time when the shifts occurred are indicated.
Eukariotes
CodePBRCodeRWP
Inoculum
  • ✓ Coexistence of C. vulgaris and T. dimorphus
Inoculum
  • ✓ Coexistence of C. vulgaris and T. dimorphus
PBR_Ek_1
(31–45)
  • Scenedesmaceae (T. dimorphus and C. proboscideum) outcompeted C. vulgaris.
    Increase T and I
RWP_Ek_1
(18–31)
  • ✓ Bloom of Vorticella microstoma
    Undefined perturbation
PBR_Ek_2
(60–87)
  • ✓ Increase abundance of yeast and Vorticella microstoma.
    The reactor was covered with a shading net that killed the microalgae
RWP_Ek_2
(31–45)
  • ✓ Dominance of T. dimorphus
    Increase T and I
PBR_Ek_3
(87–115)
  • ✓ Most of the populations present before the crashed recovered; increase abundance of Chlamydomonas sp. and Chlorella sp.
    High NO2--N; decrease I and T
RWP_Ek_3
(60–73)
  • T. dimorphus co-existed with C. vulgaris and C. proboscideum. Presence of predators.
    Mitigation of I and T conditions
PBR_Ek_4
(129–143)
  • ✓ Increased abundance of Chlorella sp. and Micractinium sp. and Vorticella microstoma
    High level of NO2--N together with the decrease in NH4+-N and I
RWP_Ek_4
(87–115)
  • C. sorokiniana, P. nurekis and their predator G. steinii.
    Drastic increase in NH4+-N, NO3--N and COD, together with the decrease in I and T
PBR_Ek_5
(143–171)
  • ✓ Dominance of Vorticella microstoma
    Worsening of the climatic conditions reduced the microalgal growth favoring predation
RWP_Ek_5
(115–129)
  • ✓ Increase Chlorella sp. and Vorticella microstoma
    Decrease influent NH4+-N and NO3--N
RWP_Ek_6
(143–171)
  • ✓ Increase number of predators
    The change of dilution of the centrate disturbed the microalgal community
RWP_Ek_7
(171–188)
  • ✓ Microalgal community recovered after the system failure due to predation
Bacteria
CodePBRCodeRWP
Inoculum
  • ✓ Bacterial community of the inoculum
Inoculum
  • ✓ Bacterial community of the inoculum
PBR_Bac_1
(0_18)
  • ✓ Establishment of a mixed community with Pseudomonas spp. as dominant bacteria
RWP_Bac_1
(0_18)
  • ✓ Establishment of a mixed community with Pseudomonas spp. as dominant bacteria
RWP_Bac_2
(18_31)
  • ✓ Coexistence of Pseudomonas and Calothrix spp.
    Undefined perturbation decreased the number of microalgae; increase in I
RWP_Bac_3
(31_45)
  • ✓ Dominance of Cyanobacteria.Further increased of I and T
RWP_Bac_4
(60_73)
  • ✓ Recovery of the original communityMitigation of meteorological conditions
RWP_Bac_5
(87_115)
  • ✓ Increase abundance of denitrifiers, such as Kaistia and Rhodoplanes
    Increase NO3--N and COD in the influent, together with the reduction of T
RWP_Bac_6
(143_188)
  • ✓ Recovery of the previous community
Table 5. Properties of bipartite networks based on the interaction between the most abundant (>1%) bacterial and eukaryotic OTUs.
Network PropertiesPBRRWP
Modularity0.4150.508
Connected component101117
Average degree9.3738.048
Average path length1.9822.314
Network centralization0.20780.167
Network heterogeneity0.70140.590
Number nodes110125
Network diameter67
Network density0.0860.065
Interaction24802588
Co-occurrence14921488
Mutual exclusion9881100
Publisher’s Note: MDPI stays neutral with regard to jurisdictional claims in published maps and institutional affiliations.