Article

Presence of Mycobacterium avium Subspecies paratuberculosis Monitored Over Varying Temporal and Spatial Scales in River Catchments: Persistent Routes for Human Exposure

1
Biomedical and Life Sciences Division, Faculty of Health and Medicine, Lancaster University, Lancaster LA1 4YQ, UK
2
Division of Molecular and Clinical Medicine, University of Dundee, Mailbox 12, Ninewells Hospital and Medical School, Dundee DD1 9SY, UK
3
Lake Ecosystems Group, Centre for Ecology and Hydrology, Lancaster Environment Centre, Lancaster LA1 4AP, UK
4
Centre for Health Informatics, Computing and Statistics (CHICAS), Lancaster Medical School, Faculty of Health and Medicine, Lancaster University, Lancaster LA1 4YQ, UK
5
School of Biosciences, Cardiff University, Sir Martin Evans Building, Museum Avenue, Cardiff CF10 3AX, UK
*
Author to whom correspondence should be addressed.
Microorganisms 2019, 7(5), 136; https://doi.org/10.3390/microorganisms7050136
Submission received: 4 April 2019 / Revised: 2 May 2019 / Accepted: 9 May 2019 / Published: 15 May 2019
(This article belongs to the Special Issue Non-Tuberculous Mycobacteria: Emerging Diseases and Health Impacts)

Abstract

:
Mycobacterium avium subspecies paratuberculosis (Map) was monitored by quantitative PCR over a range of temporal and spatial scales in the River Tywi catchment. This study shows the persistence of Map over a 10-year period with little change, which correlates with the recognised levels of Johne’s disease in British herds over that period (aim 1). Map was quantified within the river at up to 108 cell equivalents L−1 and was shown to be consistently present when monitored over finer timescales (aim 4). Small wastewater treatment plants where the ingress of human-associated Map might be expected had no significant effect (aim 2). Map was found for the first time to be located in natural river foams providing another route for spread via aerosols (aim 5). This study provides evidence for the environmental continuum of Map from the grazing infected animal via rain driven runoff through field drains and streams into main rivers; with detection at a high frequency throughout the year. Should Map need to be monitored in the future, we recommend that weekly or monthly sampling from a fixed location on a river will capture an adequate representation of the flow dynamics of Map in a catchment (aim 3). The human exposure to Map during this process and its impact on human health remains unquantified.

Graphical Abstract

1. Introduction

Mycobacterium avium subspecies paratuberculosis (Map) is a very slow growing member of the Mycobacterium avium complex [1,2]. Map is recognised as a multi-host pathogen [3] and is now implicated in a wide range of diseases including Parkinson’s disease, rheumatoid arthritis, neuromyelitis optica spectrum disorder, multiple sclerosis and type 1 diabetes myelitis [4,5,6,7,8,9,10,11,12]. However, it is known to cause Johne’s disease which is a chronic inflammation of the intestine (JD) [3,13,14,15], which can affect many animal species including primates [3]. This enteric animal pathogen is also significantly associated with Crohn’s disease (CD), which also involves a chronic inflammation of the intestine in humans [12,16,17,18]. This association remains controversial. Appropriate laboratory methods have shown that most people with chronic inflammation of the intestine of the Crohn’s disease type are infected with this chronic enteric pathogen [19,20,21,22,23,24]. Like that of Johne’s disease, the incidence of Crohn’s disease continues to increase with consequential economic health costs [25,26,27,28,29], particularly in children. Both Northern and Central Europe and Australia showed an average 5-fold per decade increase in the disease in children under 16 [30,31,32].
M. avium subsp. paratuberculosis can exist in animals for long periods (years) without causing clinical disease. Johne’s disease has now spread worldwide [33,34], and is particularly prevalent in Europe and North America [34]. Subclinical infection is significant in domestic livestock, especially in cattle, sheep and goats [14]. It is estimated that the herd prevalence for JD in cattle in the USA is 68% [35] and is 34.7% in U.K. [36,37,38,39].
Both clinically and sub-clinically infected animals can shed Map in the faeces onto grass land and pastures. The numbers shed depends on the species of the animal, the Map strain involved and the severity of the disease [40]. Once in the environment, Map can survive for many months/years in agricultural slurry and in the wider environment [41,42,43]. Map is washed by rainfall from contaminated pastures via surface waters into rivers [41,43]. Previously, we showed that for Map in the River Taff (Cardiff, South Wales, UK), its presence was almost predictable from rainfall patterns and river flow [43] and it was present in 32% of the samples taken. This contrasts with the River Tywi, where its presence in 69% of the samples was predictable based on rainfall and river height parameters. [41]. Furthermore, as a consequence of the endemic presence of Map in cattle in the Taff/Tywi catchments, deposition and transport from the catchments was so extensive that Map was maintained in the river for periods of several weeks at a time [43]. Both of these studies were qualitative and recognised the need for quantitative data [41,43].
Previously, we modelled the main human exposure routes of Map and suggested that its presence and distribution was primarily driven by shedding from clinically and sub-clinically infected animals, but other factors, such as slurrying and soil redistribution from water treatment, that recycle Map back from the catchment to the river, also influenced its presence and distribution in the environment [41,43]. Water from these catchments is used for abstraction and public supply. We detected Map by aerosol samples collected above the River Taff. In addition, we detected Map in domestic showers from different regions in the U.K. The detection of Map in river aerosols and those from domestic showers, provided the first evidence that aerosols are an exposure route for Map to humans and may play a role in the epidemiology of CD [44].
Furthermore, in the first comprehensive geographical survey of its distribution in Great Britain [45], it was shown that the presence of Map significantly increased from North to South of Great Britain. Its presence was significantly associated with increasing numbers of cattle over the same longitudinal axis. Assessment of samples from differing land usages showed that Map was widely distributed in both farming and non-farming areas. We showed that Map is widely distributed within and outside the confines of the farming environment; its geographical distribution was wider than originally anticipated. However, we concluded that monitoring rivers better describes the Map status of catchment than individual soil samples [45].
In this study, we returned to the River Tywi catchment in Wales, UK [41], with the following aims:
  • to determine whether the overall distribution and presence of Map in the catchment has changed over time when farming practices and management of stock remain the same,
  • to test whether waste water treatment effluent is a significant input of Map in the river,
  • to assess whether presently used sampling regimes to detect Map in the environment underestimate its prevalence,
  • to quantify the presence of Map in rivers, and
  • to extend our catchment model [41].
Furthermore, we complemented our geographical study of Map distribution in the UK and Countryside Survey 2007 [45] by examining water samples from drains and steams around agricultural fields for Map from the River Eden catchment (England, UK), thus providing a sampling continuum from the clinically and sub-clinically infected cattle on the pasture to the estuaries which has provided new data for our original Map human exposure model [41].

2. Materials and Methods

2.1. Study Areas

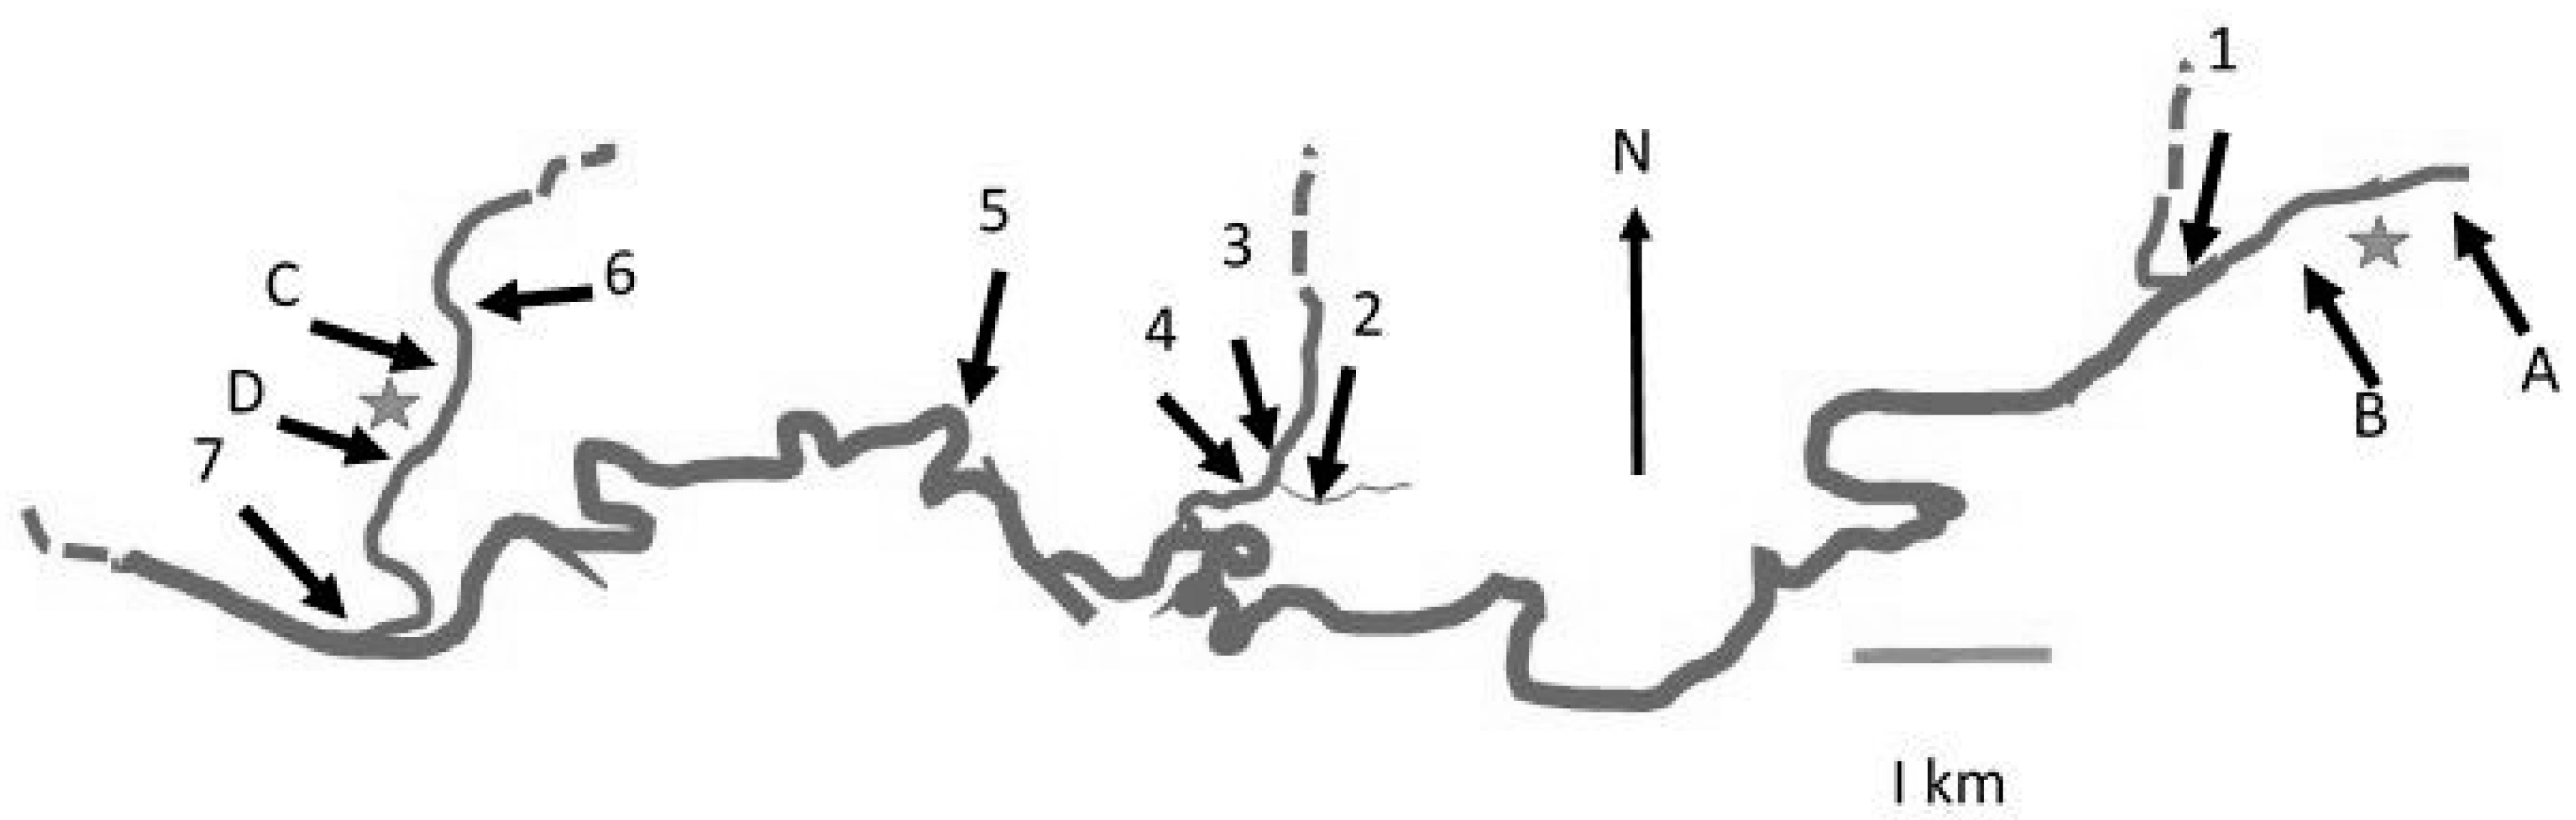
2.1.1. River Tywi, Wales, UK

The River Tywi is a major river in the South Wales region. Within its length of 75 miles, it has numerous tributaries including Cothi and Dulas with water fed from catchments of 302 km2 and 102 km2 respectively. It passes through areas of both cattle and sheep farming. The Tywi catchment is predominantly rural and comprises 1100 km2 containing 3188 agricultural units. Animal stocks comprise 108,142 mixed dairy and beef cattle and calves and 1,388,303 sheep and lambs, including 717,283 breeding ewes. River Tywi is subjected to water abstraction and is a major source of domestic supply. The source of the River Tywi lies in the afforested undulating moor land of the Cambrian Mountains of Mid Wales [41]. Llyn Brianne reservoir marks the start of the River Tywi, through a continual but flow-regulated release of water. The river falls steeply for 10 miles before it enters a flood plain near Llandovery. It meanders across a 1-mile-wide plain for 30 miles in a south-westerly direction to Carmarthe. It then enters a 12-mile-long tidal section which then enters the Bristol Channel in a broad estuary. Sample site 7 (Figure 1) represents the confluence of the Cothi and Tywi.

2.1.2. Eden Catchment, Cumbria, UK

The River Eden is located in Eden Valley, Cumbria, and encompasses a catchment area of 2288 km2 [46]. The river forms at the convergence of two streams, the Red Gill and the Little Grain merge to form Hell Gill Beck [46]. The river flows past Hell Gill Force to become the River Eden and then flows into the Irish Sea via the Solway Firth (Owen et al., [46]). Located in the Eden catchment are three 10-km2 sub-catchments: the Darce sub-catchment, the Morland sub-catchment and the Pow sub-catchment [46]. The Darce sub-catchment is located to the West in the Eden catchment and is less than 5 km from Ullswater. This catchment is representative of the upland of the Eden catchment and is used for improved and rough grazing by livestock including sheep and cattle [46]. The Morland sub-catchment is located in the east of the Eden catchment and is used for both dairy farming and meat production [46]. The Pow sub-catchment is located 4 km south of Carlisle and, compared to the other two sub-catchments, is intensively farmed with diary, beef, sheep, pig and poultry.

2.1.3. Sampling Sites

Water, sediment and foam samples were taken from sites in the Tywi catchment (Wales, UK, comprising rivers Tywi, Cothi and Dulas) and from field drains in the Eden catchment, Cumbria, UK. Sampling comprised 3 regimes; firstly, weekly and monthly samples from the rivers Tywi and Cothi (Table 1 and Figure 1). Using a fresh disposable bucket, 10-L water samples were taken from the middle of the river. Samples were sealed in disposable screw-cap plastic containers and sent by fast post to Lancaster University where they were stored at 4 °C prior to processing. Secondly, hourly samples over a 6-h period were taken on 3 occasions from River Tywi with samples also taken from the rivers Cothi and Dulas tributaries and at their confluence (Nantgaredig Bridge) on each occasion (Table 2 and Figure 1) and transported on ice before processing; and, thirdly a number of samples were taken from field drains in the River Eden sub-catchments of Pow, Darce and Morland (Cumbria, UK; Table 3). Natural foam [47] from river water was collected in sterile bottle before processing.

2.2. Sample Processing

One litre of river water was filtered using a vacuum filtering unit with a 0.2-µm pore size polycarbonate filter (Supor-200 Pall Life Sciences, Portsmouth, UK). The filter was removed aseptically and placed into a sterile McCartney bottle containing 2 mL Tris-HCl (0.1 M) (Sigma Aldrich Ltd., Gillingham, UK) and cells re-suspended by vortexing (5 min at full power). This sample was divided equally between two sterile 1.5-mL microcentrifuge tubes (Anachem Ltd., Leicester, UK) and centrifuged for 20 min at 13,000× g. The supernatant from one of the tubes was discarded while in the second, 800 μL supernatant was removed and the pellet was resuspended in the remaining 200 µL supernatant. Once mixed thoroughly, this was added to the first pellet and resuspended. Foam samples were resuspended in 1 mL sterile water and added to a bead beating tube. These samples then underwent DNA extraction as described previously [44].

2.3. Detection of Map by PCR

Map was detected by qPCR using single-tube duplex reactions that combined the previously described assays [48,49] to amplify Map-specific regions IS900 and F57 respectively as described previously [44]. Standard curves, constructed in accordance with methods previously outlined, were used to quantify DNA [50] based on a genome size of 4.83 Mbp for M. avium ssp. paratuberculosis K-10 (GenBank Accession No. NC002944) and an average number of gene copies per genome of 17 (IS900) and 1 (F57) [51,52]. Map was quantified and represented as cell equivalents per litre (CE L−1) [50].

2.4. Statistical Analysis of Map and the Tywi and Eden Catchments

Statistical analysis was performed as previously described [41,43,44]. All the rivers Tywi and Cothi catchment data including rainfall were provided by Natural Resources Wales. Briefly, a generalized linear model based approach [53] was implemented in the R statistical programming environment [54] using an analysis of variance (ANOVA) to assess the significance of river height and river flow and rainfall on the sampling day and 10 proceeding on the presence of Map. For each, a matrix was compiled compromising measurements of five variables, (sample date, presence/absence of Map IS900, presence/absence of Map F57, river flow, river height). Additionally, 11 rainfall variables were added to the matrix with rainfall on the sampling day and up to 10 days preceding the sampling date [41].
Furthermore, a linear discriminant analysis determined whether river characteristics and rainfall could be combined to form an index with which to predict the presence of IS900 [55]. A randomization method was used to test for clustering of IS900-positive days [41,43]). A simple Chi-squared test of association was implemented to see whether there was a significant difference in the number of Map-positive samples at the Tywi upstream sampling site and the Tywi downstream (Nantgaredig Bridge) sampling site. Similarly, for the Eden Catchment, the relationship between rainfall on day 0 and up to 10 proceeding sampling with the presence of Map was assessed using a generalized linear model approach followed by a simple ANOVA. A chi-squared test of association was performed to see whether there was a significant difference in the number of Map-positive samples for each of the three sub-catchments Morland, Darce and Pow. The Eden DTC Project provided all Eden catchment data.

3. Results and Discussion

3.1. Overview

In total, 316 water samples from the River Tywi catchment were analysed over a 2-year period with 39% being qPCR positive for IS900. Within these IS900-positive samples, 13% were F57 positive. Combined weekly and monthly samples (n = 248; Table 1 which excluded the fine sampling data) revealed that IS900 was detected 45% (F57, 13%), 63% (F57, 19%) and 48% (F57, 16%) in Cothi (site 6), Tywi (upstream, site 5) and Tywi (downstream, site 7), respectively (see Figure 1), with a combined detection rate of 52% (F57, 16%) over the sampling period.
Our previous study carried out 10 years ago and using a nested end-point PCR assay for IS900 showed that the presence of Map in the River Tywi was predictable based on river height, river flow and rainfall up to 10 days before [41]. Returning to the River Tywi catchment 10 years later, and using a qPCR approach, this study showed that Map was still detectable at high rates similar to those previously observed (63% compared to 68% for the comparable sampling at site 5; Pickup et al., 2006). In addition, the significant drivers for Map being present in the river remain as before, namely the high Johne’s disease rate in UK cattle [38] coupled to rainfall in the catchment (this study; [41]. We can conclude (Aim 1) that presence of Map in the catchment had not changed over time which reflects prevalence of Johne’s disease remaining high. Whether it has changed between 2012 and the present day remains to be determined but we conclude that it would remain the same unless farming practices and stock management have changed in response to reduce the prevalence of Johne’s disease

3.2. Temporal and Spatial Monitoring and Quantification of Map in Rivers

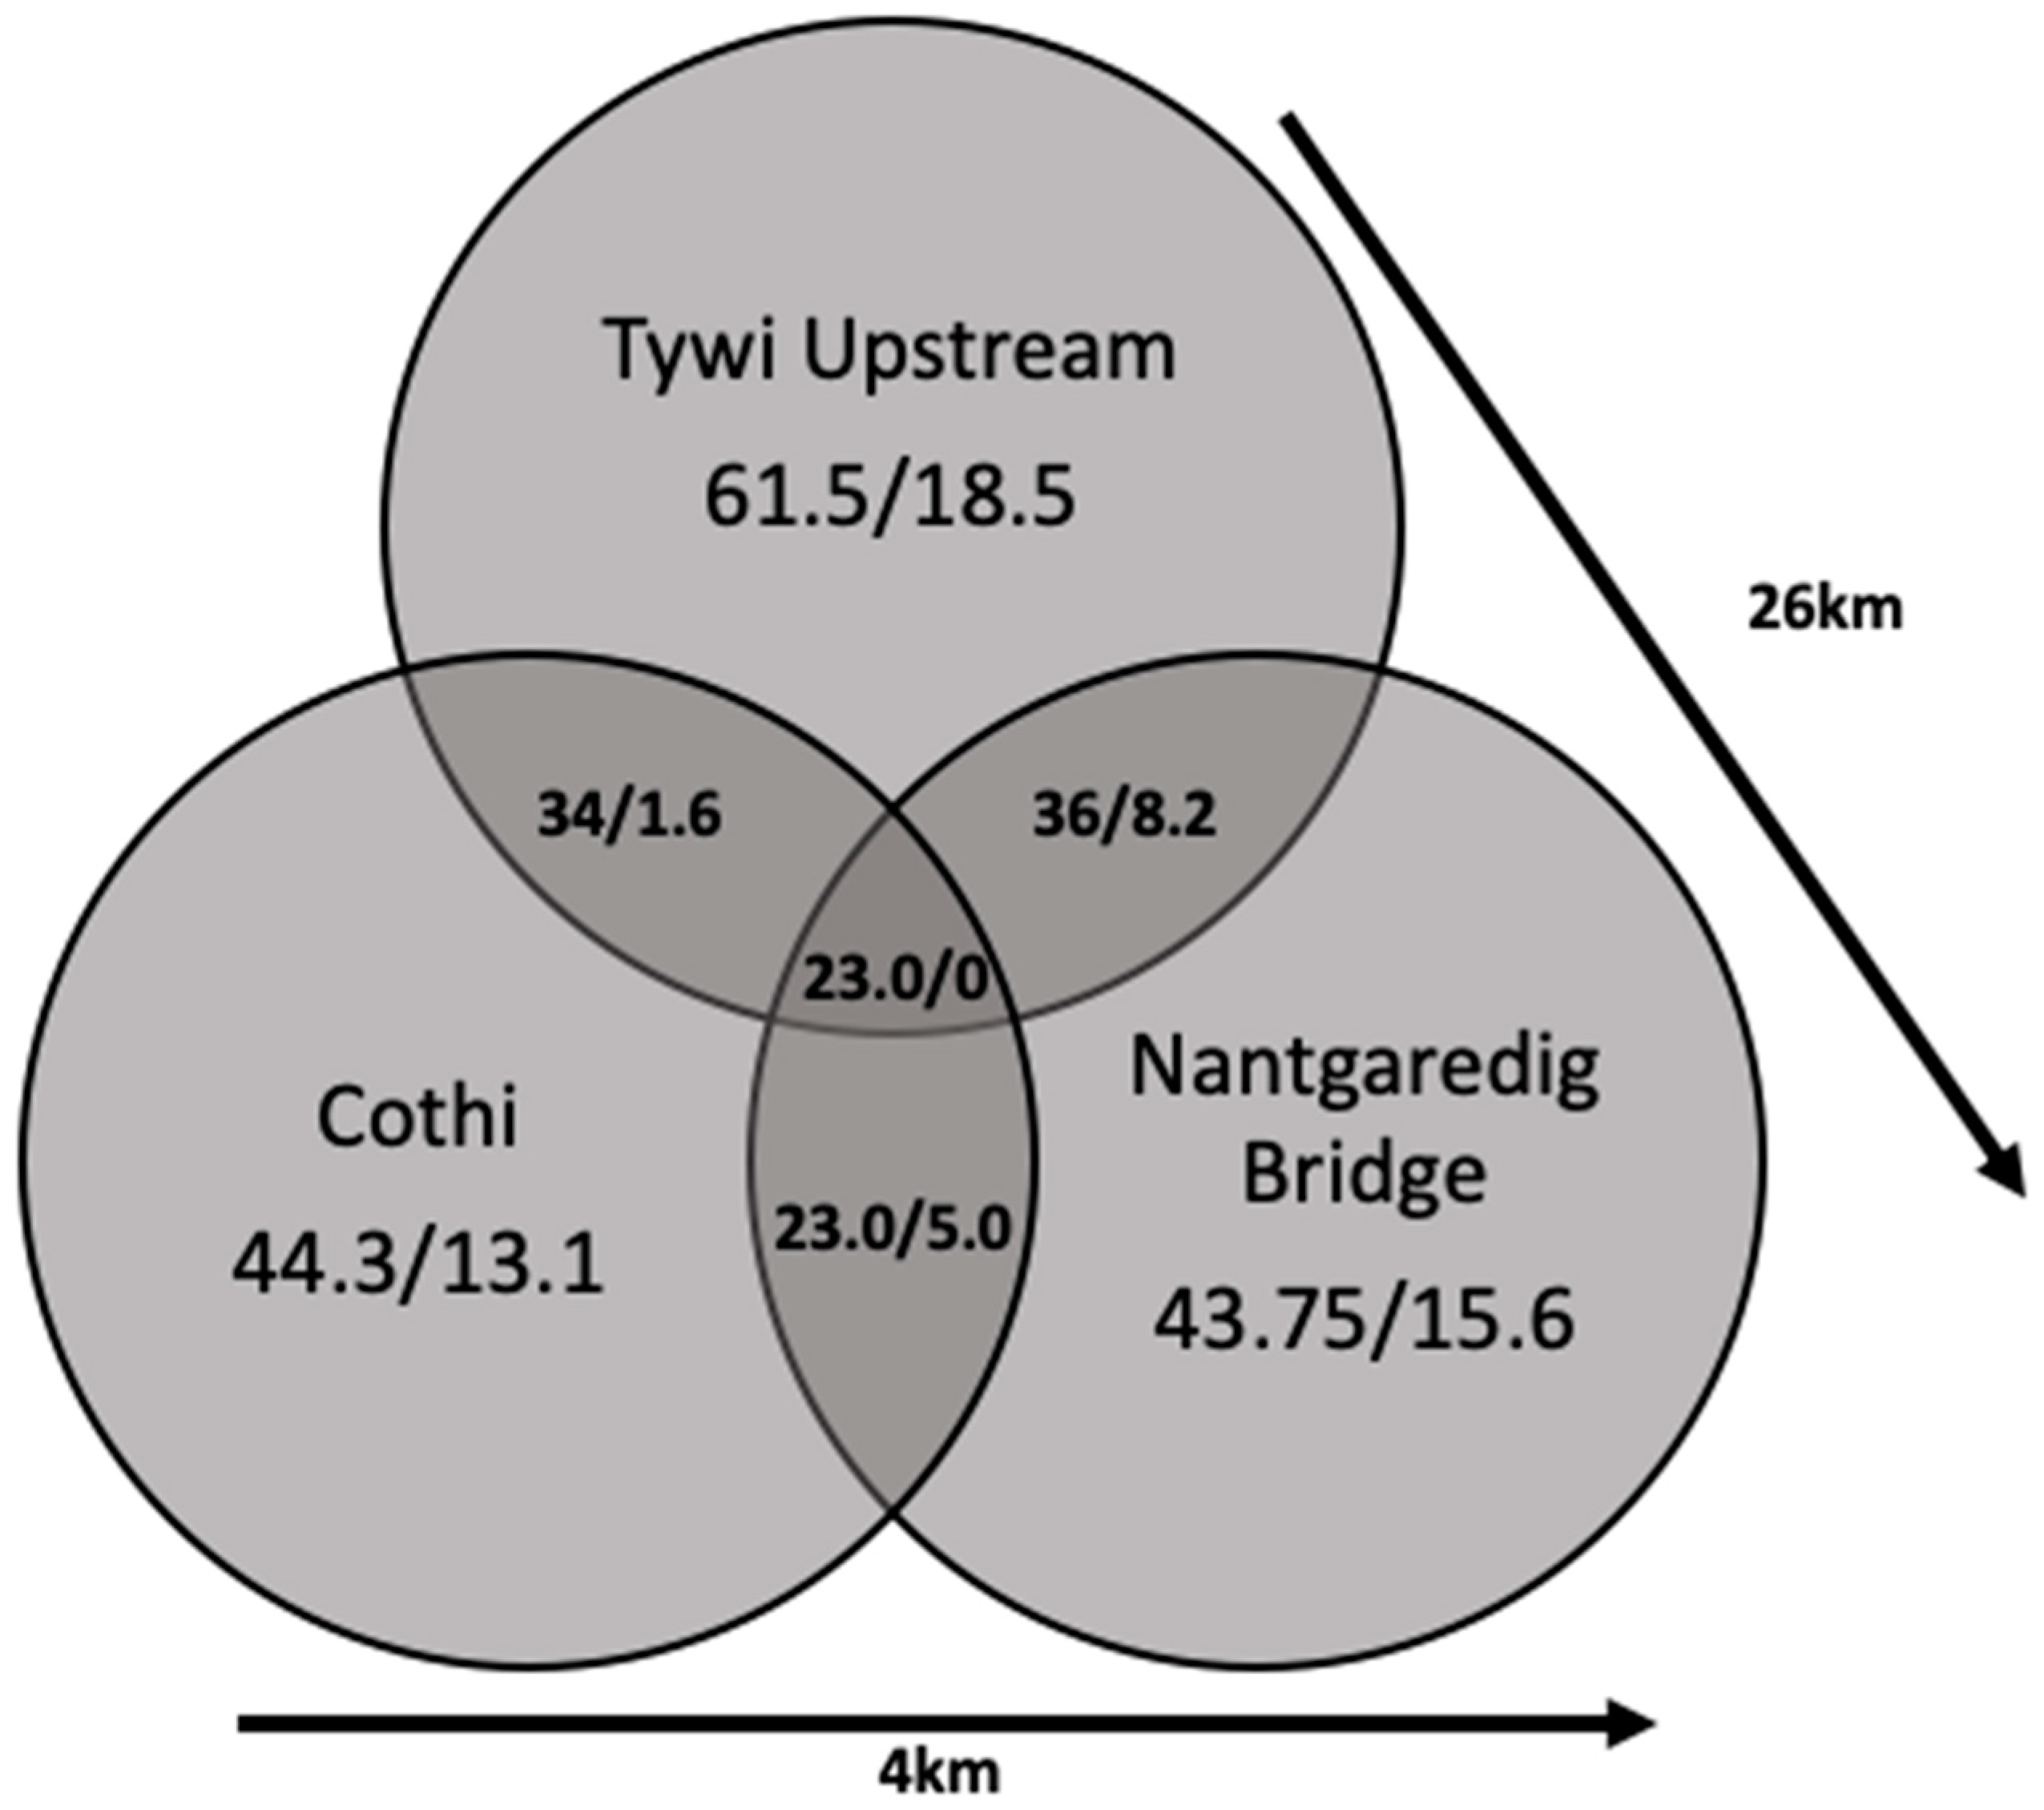
3.2.1. Weekly Monitoring of Map in the River Tywi Catchment

The presence of Map was assessed in water within the rivers Tywi and Cothi and at their confluence on a weekly basis. The hydrography of each river differed with the River Cothi having a height range during the sampling period of 0.4 to 2.0 m and the Tywi 0.5 to 3.8 m, with flows of 0.5 to 89 m3 s−1 and 6.9 to 271 m3 s−1, respectively.
Samples were collected from the three sites sampled on a weekly basis over a 70-week period, (Figure 1) namely, River Cothi (Site 6; n = 61) and River Tywi upstream (site 5; n = 65) and downstream (which represents the confluence of the rivers Tywi and Cothi, site 7; n = 64) (Figure 2).
Map IS900 was detected in 44% (F57, 13.1%), 62% (F57 19%) and 44% (15.6%) of river water samples collected from the River Cothi and upstream and downstream of River Tywi respectively. Detection was not continuous (Figure 2) with no detection in the River Cothi for a period of 9 weeks when the river parameters on average were 0.6 m height and 2.6 m3 s−1 but was present when the height and flow were higher (2.7 m, 17.6 m3 s−1). Map was absent from the River Tywi for 6 weeks in an overlapping but shorter period than found for the River Cothi, with the river height and flow of, on average, 0.8 m and 17.8 m3 s−1 respectively. Prolonged presence for a period of 8 weeks overlapped that of the Cothi with river height and flow elevating to 1.4 m and 50 m3 s−1. A further prolonged presence of 6 weeks was also associated with the height and flow of the River Tywi, of 1.8 m and 83.7 m3 s−1.
We tested the significance of river height and river flow on the presence Map using thresholds of 0.8 m and 8.9 m3 s−1 for the River Cothi and 1.1 m and 33.1 m3 s−1 for the River Tywi and the significance of rainfall up to 9 days prior to sampling using parameters determined previously [41] (Table 2).
For the River Cothi, the height and flow significantly indicated the presence of Map. In addition, rainfall preceding sampling was significant on the day before and 3 and 9 days before sampling. A similar pattern was observed upstream on the River Tywi with river height and flow significantly influencing the presence of Map with rainfall being significant on days 1, 2, 3 and 6 prior to sampling. The height and flow were also significant factors in the downstream sampling on the River Tywi with rainfall 1, 2 and 6 prior to sampling being significant.
In addition, Figure 3 shows that IS900 was detected simultaneously in 34, 23 and 36% of the samples in site 5/site6, site 6/site7 and site5/site7, with 23% of the IS900-positive samples detected simultaneously at all sample points. F57 showed a similar pattern apart from it not being detected simultaneously at all sites. The detection rate for all three sites was not significantly different.
Overall, the presence of Map was confirmed to be significantly associated with river height, flow, and rainfall preceding sampling and was found to be entering the main flow from tributaries of the sub-catchments, indicating widespread Map deposition within the catchment.

3.2.2. The Contribution of Waste Water Treatment Works (WWTWs) to the Presence of Map in Rivers

Sample sites A/B and C/D which are upstream and downstream of WWTWs on the Cothi and Tywi respectively (Figure 1) were sampled on a monthly basis for 15 months to examine whether the presence of small WWTWs increased the detection of Map in river water. For the Tywi, IS900 was detected in 67% (F57, 20%) of the water samples collected upstream of the WWTW (A) and in 67% (F57, 20%) of those collected downstream of the WWTW (B) IS900 was detected upstream and downstream on the same day on 70% of the sampling dates. Map cell equivalents in river water upstream and downstream of the WWTW was 1–104 CE L−1 (IS900).
In the River Cothi, Map IS900 was detected in 50% (F57, 29%) of river water collected upstream of the WWTW and at site D in 43% (F57, 7.1%) of river water samples collected downstream of the WWTW. Map cell equivalents in river water upstream and downstream of the WWTWs were estimated to be 1–103 CE L−1 (IS900) and 1–104 CE L−1 (IS900) respectively.
The detection rate of Map upstream and downstream of both WWTWs was not significantly different showing no influence over the sampling period even at low flow when Map from the catchment entering the rivers would be reduced (Aim 2). Unlike the River Taff, where the influence of the larger urban wastewater outflows was significant during periods of low flow, the size of these rural systems did not influence the dynamics of Map in the river showing for the River Tywi that the catchment field runoff was the significant factor determining the numbers of Map detected. We previously showed that Map was detected in sewage outflows from waste water treatment plants [41] and showed that the presence of Map in periods of low river flow were probably due to Map entering the river from large urban waste water treatment plants [43].

3.2.3. Increased Resolution ‘Fine’ Sampling Over a Short Time Period

Half-hourly samples were taken over a 6-h period taken on three occasions from River Tywi from site 5. Additional single time point samples were taken on the same day around the catchment (River Cothi (Site 6), River Tywi (site 1) and Dulus tributaries (sites 2, 3 and 4) and at their confluence (Nantgaredig Bridge; site 7; Figure 1 and Table 3)). This sampling regime resulted in a total of 37 samples collected on three sampling dates with Map IS900 being detected in 32% of the samples in the range of 1–103 CE L−1. The detection of IS900 at site 5 for the April sample date was 1 out of 12 (8%); for July it was 3 out of 13 (23%) with two samples being consecutive. In November, IS900 was detected in 11 out of 12 samples (92%) with three samples being positive for F57. On each occasion, five single samples were collected from within the catchment: For November, when fine sampling revealed a 91% detection rate, IS900 was detected in all five sites compared with 60% of additional sites at a fine sampling detection rate of 23%. No additional sites were positive when the Tywi fine sampling detection rate was 8%.

3.2.4. Sampling Period and Map Presence

Sampling regimes were monthly, weekly or a single day (fine sampling) with IS900 detection rates of 38% (n = 58), 34% (n = 190) and 41% (n = 29), respectively, showing comparable detection rates over the three sampling regimes. Therefore, we can conclude that should Map need to be monitored in the future, then weekly or monthly sampling from a fixed location on a river will capture an adequate representation of the flow dynamics of Map in a catchment (Aim 3).

3.3. Quantification of Map

For the first time, the presence of Map was quantified from 192 of the river water samples using qPCR for IS900 and F57 (Aim 4). Map was detected in the range of 0 (not detected) to 105 CE L−1. The samples compared with the corresponding river height and river flow at the time of sampling. This showed that as river height increased, it was significantly associated with higher numbers of Map for both the Tywi upstream and downstream (p = 5.2 × 10⁻⁸ and <2 × 10⁻¹⁶ respectively) and significantly associated with increased numbers of Map in the River Cothi (p = 0.0003). Due to strong collinearity between river height and river flow (correlation 0.98), quadratic discriminant analysis was applied which confirmed that higher pathogen concentrations are associated with the increase in the average river flow and river height. This would therefore account for the river carrying between 0 and 108 Map per m3 of river water which was measured in the range of 0–105 CE L−1 with the upper numbers relating period of higher rainfall which generates higher flow/height parameters for the river.
Map was detected in river samples using qPCR for both IS900 and F57. F57 was only detected in samples that were IS900 positive but, in a number of samples Map was only revealed by the presence of IS900. The relationship between the concentrations of Map, as measured using IS900, were assessed in relation to the concurrent detection of F57. Of the 192 weekly samples tested, 97 samples were IS900 positive, of which 29 were coincidentally F57 positive (30%). The relationship between the concentration of IS900-positive samples and the concurrent detection of F57 was shown to be significantly associated with Map numbers at and above the range of 10–100 CE L−1, which equates to the IS900:F57 ratio of approximately 17:1 in Map [56,57]. Pickup and co-workers previously showed that Map, identified by IS900, was present in rivers in Welsh catchments at a frequency of 36% for the River Taff and 68% for the River Tywi, taken from single points over a year in 2002 [41,43]. The lower frequency detection of F57 is, as previously reported, linked to approximate 17:1 ratio of IS900: F57 which creates a concentration threshold below which F57 in Map is not detected in environmental samples.

3.4. Overview Map in Welsh River Catchments

We undertook three temporal regimes for sampling water of the River Tywi over monthly, weekly and every 30 min over a 7-h period with confirmatory samples taken around the area. Through the combined data of the three sampling regimes, a real time appreciation of Map presence was realised, showing that Map was regularly present in both rivers, each fed by independent catchments. Overall, Map was present upstream and downstream in the rivers Tywi and Cothi at the same sample time point over a period of a year in 23% of the samples, which indicated the widespread deposition of Map on the Tywi catchment. The Tywi downstream site at Nantgaredig Bridge represents the confluence of the two rivers, where the Tywi upstream and Cothi join. It was apparent that Map was commonly present in Tywi downstream and Cothi in roughly 50% of the samples taken in each river system.
The short-period high-frequency sampling on three different occasions in summer, winter and spring showed high variability driven by differences in river parameters with the average high height/flow river for the day (2.4 m/89 m3 s−1) showing 91% detection rate in 13 half-hourly samples taken in the winter compared to 32 and 8% in both sets of 12 samples taken in spring and summer when the river parameters were lower at approximately 1 m height and 24 m3 s−1. The high winter frequency may reflect higher rainfall and increased slurry spreading despite in some areas the animals being housed inside. Although Map was detected in each seasonal sample period not all samples within that 6-h period were positive demonstrating that even when sampling at fine resolution that patchiness of sampling with both negative and positive samples will be detected.
The different temporal sampling regimes have shown that Map is widespread in the catchment. It enters the catchment rivers simultaneously from different geographical locations in the same river continuum and can be detected as such by samples taken at different points on the same day within the catchment but also at times in continuously present in samples taken over a period of time. Our detection of Map is still considered to be an underestimate due to the variability in sampling (e.g., high frequency regime (91% vs. 8%)) coupled with limitation imposed by environmental sampling such as patchiness of samples and inhibition [43]. Despite these limitations, if monitoring schemes needed to be implemented to assess the presence of Map in the environment, then this study would recommend that rivers in catchments are better indicators than terrestrial-based sampling [45] and that weekly sampling at a single site, which fits many non-governmental water testing procedures, would generate an acceptable profile of Map in a catchment. As in previous studies, F57 is detected only in samples that are IS900 positive and at a frequency enough to give confidence that all IS900-positive samples represent the detection of Map [43].

3.5. Sampling Map in New Locations

3.5.1. Estuarine Samples

Sediment samples (n = 4) were taken in the Tywi estuary but all were negative for IS900 (data not presented).

3.5.2. Eden Catchment Field Beck Samples

A total of 47 samples from beck water and field drains were collected from Eden catchment, Cumbria, UK from February 2012 to March 2013 from three different sites within each of the three sub-catchments, Darce, Morland and Pow. (Table 4). Overall Map IS900 was detected in 21% of the beck water samples with 4% being positive for F57 as well. Map was detected at a higher frequency in the Darce catchment (42.8%) compared to 17% and 6.6% in the Morland and Pow catchments. The presence of Map was shown to be significantly associated with rainfall from 7 and 10 days prior to sampling (p = 0.002 and p = 0.049 respectively). Map was found in the range of 0–103 CE L−1.
Map distribution has already been described at a national, catchment scale and river scales [41,43,45]. Sampling of Eden catchment beck water and field drains (Cumbria, UK), although a geographically independent catchment, provided an insight into the presence of Map at the field scale of a catchment which has not been previously tested. The Eden catchment provides intensive grazing for cattle and sheep and Map was detected that the field drains and becks surrounding the fields in all three sub-catchments at frequencies probably reflected by the herd intensity in those areas but each was significantly associated with rainfall that washed Map from the field into the field drains and becks. Furthermore, the propensity of cattle to stand in streams and introduce chemical and faecal contamination is well documented [58,59], with Map also detected in stagnant streambeds in farm units in USA [59].

3.5.3. Natural River Foam

Foam accumulating in the river was collected on one occasion from the River Dulas (site 4) and from the upper Tywi tributary (Site 1). Single samples were taken from two close sites on the River Dulus. One was positive for both IS900 and F57 and the other positive for IS900 only. This study provides the first report of Map, or other any pathogens, being present in natural river foam lines. Foams, although problematic in waste water treatment works [60], are ubiquitous in the environment, commonly seen as discoloured patches on streams, rivers, lakes and sea water. Although assumed to be of man-made origin as they are visually unpleasant, they are often observed in pristine environments which indicates a natural origin [47]. The stability of foams, particularly those in waste treatment works, is often associated with hydrophobic particles such as bacteria cells [60]. River foams indicate that bacteria, protozoa and/or algae are major contributors to organic matter in foams [61]. The majority of species present in foam were found to be either benthic or periphytic rather than planktonic [62]. Maynard (1968) considered foam to be an important habitat, which has been ignored previously, and it remains so. The break of foam bubbles may cause an increased risk of human exposure to pathogens [47] and provide a new route for human exposure reinforcing the observation of aerosolisation of Map from directly from rivers may be implicated in Crohn’s Disease clusters [43,44]. In this case, Map was detected in sufficient numbers in the samples to be positive for both IS900 and F57 (>14 per sample).

4. Conclusions

From our aims (1–5), as stated in the introduction, we have shown that:
  • the overall distribution and presence of Map in the catchment has not changed over a 10-year period and that associated farming practices and management of stock have remained the same;
  • that the effluent small waste water treatment works does not significantly input of Map into the river, but large city-based waste treatment works do have a significant input;
  • using a variety of temporal and spatial sampling regimes from monthly single sample points to fine sampling every 30 min, that weekly monitoring from a single carefully chosen location, adequately describes the presence of Map in rivers emerging from defined catchments or sub-catchments. Monitoring due to regulatory policy could become mandatory if Map is confirmed as a human pathogen and we suggest a monitoring scheme that is feasible;
  • for the first time, Map concentration in rivers has been assessed and numbers ranged up to 108 cell equivalents L−1;
  • the detection of Map in dust [63], domestic showers (drinking water supplies as these supply showers) [44], river aerosols [44] and, in this study for the first time, in river foams, has extended our human exposure model further (Figure 4) [41].
Given that climate conditions and the disease status of the UK herd is unlikely to change in the foreseeable future, our model shows that Map exposure may continue to impact communities as previously described [43]. Furthermore, its persistence in rivers, where abstraction occurs, is likely to sustain human exposure through domestic water supply, with potential health consequences of this animal pathogen which is linked to a number a number of possible health outcomes in addition to Crohn’s disease [41,44,45]. These include Parkinson’s disease, rheumatoid arthritis, neuromyelitis optica spectrum disorder, multiple sclerosis and type 1 diabetes myelitis [4,5,6,8,9,10,11,12,64,65] and given the broad range of diseases, and the possible impact on human health, then monitoring human exposure could be crucial in disease control.

Author Contributions

Formal analysis, P.H., L.S. and R.W.P.; Investigation, H.R., G.R., A.J.W. and R.W.P.; Supervision, G.R. and R.W.P.; Writing—original draft, R.W.P.; Writing—review and editing, H.R. and G.R.

Funding

This research was funded by UK-NERC (NE/F014791/1; R.W.P.) and the studentship was sponsored by Morecambe Bay NHS Trust (H.R.).

Conflicts of Interest

The authors declare no conflict of interest.

References

  1. Thorel, M.F.; Krichevsky, M.; Levyfrebault, V.V. Numerical taxonomy of mycobactin-dependent mycobacteria, emended description of mycobacterium avium, and description of mycobacterium avium subsp avium subsp-nov, mycobacterium avium subsp paratuberculosis subsp-nov, and mycobacterium avium subsp silvaticum subsp-nov. Int. J. Syst. Bact. 1990, 40, 254–260. [Google Scholar]
  2. Chacon, O.; Bermudez, L.E.; Barletta, R.G. Johne’s disease, inflammatory bowel disease, and mycobacterium paratuberculosis. Annu. Rev. Microbiol. 2004, 58, 329–363. [Google Scholar] [CrossRef]
  3. Over, K.; Crandall, P.G.; O’Bryan, C.A.; Ricke, S.C. Current perspectives on mycobacterium avium subsp. Paratuberculosis, johne’s disease, and crohn’s disease: A review. Crit. Rev. Microbiol. 2011, 37, 141–156. [Google Scholar] [PubMed]
  4. Arru, G.; Caggiu, E.; Paulus, K.; Sechi, G.P.; Mameli, G.; Sechi, L.A. Is there a role for mycobacterium avium subspecies paratuberculosis in parkinson’s disease? J. Neuroimmunol. 2016, 293, 86–90. [Google Scholar] [CrossRef] [PubMed]
  5. Bo, M.; Erre, G.L.; Niegowska, M.; Piras, M.; Taras, L.; Longu, M.G.; Passiu, G.; Sechi, L.A. Interferon regulatory factor 5 is a potential target of autoimmune response triggered by epstein-barr virus and mycobacterium avium subsp. Paratuberculosis in rheumatoid arthritis: Investigating a mechanism of molecular mimicry. Clin. Exp. Rheumatol. 2018, 36, 376–381. [Google Scholar]
  6. Bo, M.; Niegowska, M.; Arru, G.; Sechi, E.; Mariotto, S.; Mancinelli, C.; Farinazzo, A.; Alberti, D.; Gajofatto, A.; Ferrari, S.; et al. Mycobacterium avium subspecies paratuberculosis and myelin basic protein specific epitopes are highly recognized by sera from patients with neuromyelitis optica spectrum disorder. J. Neuroimmunol. 2018, 318, 97–102. [Google Scholar] [CrossRef] [PubMed]
  7. Niegowska, M.; Wajda-Cuszlag, M.; Stępień-Ptak, G.; Trojanek, J.; Michałkiewicz, J.; Szalecki, M.; Sechi, L.A. Anti-herv-wenv antibodies are correlated with seroreactivity against mycobacterium avium subsp. Paratuberculosis in children and youths at t1d risk. Sci. Rep. 2019, 9, 6282. [Google Scholar]
  8. Mameli, G.; Cocco, E.; Frau, J.; Arru, G.; Caggiu, E.; Marrosu, M.G.; Sechi, L.A. Serum baff levels, methypredsinolone therapy, epstein-barr virus and mycobacterium avium subsp paratuberculosis infection in multiple sclerosis patients. Sci. Rep. 2016, 6, 29268. [Google Scholar] [CrossRef]
  9. Niegowska, M.; Delitala, A.; Pes, G.M.; Delitala, G.; Sechi, L.A. Increased seroreactivity to proinsulin and homologous mycobacterial peptides in latent autoimmune diabetes in adults. PLoS ONE 2017, 12, e0176584. [Google Scholar] [CrossRef] [PubMed]
  10. Slavin, Y.N.; Bo, M.; Caggiu, E.; Sechi, G.; Arru, G.; Bach, H.; Sechi, L.A. High levels of antibodies against ptpa and pkng secreted by mycobacterium avium ssp paratuberculosis are present in neuromyelitis optica spectrum disorder and multiple sclerosis patients. J. Neuroimmunol. 2018, 323, 49–52. [Google Scholar] [CrossRef]
  11. Zamani, S.; Zali, M.R.; Aghdaei, H.A.; Sechi, L.A.; Niegowska, M.; Caggiu, E.; Keshavarz, R.; Mosavari, N.; Feizabadi, M.M. Mycobacterium avium subsp paratuberculosis and associated risk factors for inflammatory bowel disease in iranian patients. Gut Pathog. 2017, 9, 1. [Google Scholar] [CrossRef] [PubMed]
  12. Kuenstner, J.T.; Naser, S.; Chamberlin, W.; Borody, T.; Graham, D.Y.; McNees, A.; Hermon-Taylor, J.; Hermon-Taylor, A.; Dow, C.T.; Thayer, W.; et al. The consensus from the mycobacterium avium ssp. Paratuberculosis (map) conference 2017. Front. Public Health 2017, 5, 208. [Google Scholar] [PubMed]
  13. Buergelt, C.D.; Hall, C.; McEntee, K.; Duncan, J.R. Pathological evaluation of para-tuberculosis in naturally infected cattle. Vet. Path. 1978, 15, 196–207. [Google Scholar] [CrossRef]
  14. Nielsen, S.S.; Toft, N. A review of prevalences of paratuberculosis in farmed animals in europe. Prev. Vet. Med. 2009, 88, 1–14. [Google Scholar] [CrossRef] [PubMed]
  15. Rathnaiah, G.; Zinniel, D.K.; Bannantine, J.P.; Stabel, J.R.; Grohn, Y.T.; Collins, M.T.; Barletta, R.G. Pathogenesis, molecular genetics, and genomics of mycobacterium avium subsp. Paratuberculosis, the etiologic agent of johne’s disease. Front. Vet. Sci. 2017, 4, 187. [Google Scholar] [CrossRef] [PubMed]
  16. Feller, M.; Huwiler, K.; Stephan, R.; Altpeter, E.; Shang, A.; Furrer, H.; Pfyffer, G.E.; Jemmi, T.; Baumgartner, A.; Egger, M. Mycobacterium avium subspecies paratuberculosis and crohn’s disease: A systematic review and meta-analysis. Lancet Infect. Dis. 2007, 7, 607–613. [Google Scholar] [CrossRef]
  17. Chiodini, R.J.; Chamberlin, W.M.; Sarosiek, J.; McCallum, R.W. Crohn’s disease and the mycobacterioses: A quarter century later. Causation or simple association? Crit. Rev. Microbiol. 2012, 38, 52–93. [Google Scholar] [CrossRef]
  18. Timms, V.J.; Daskalopoulos, G.; Mitchell, H.M.; Neilan, B.A. The association of mycobacterium avium subsp paratuberculosis with inflammatory bowel disease. PLoS ONE 2016, 11, e0148731. [Google Scholar] [CrossRef] [PubMed]
  19. Khan, I.A.; Pilli, S.; Surendranath, A.; Rampal, R.; Chauhan, S.K.; Tiwari, V.; Mouli, V.P.; Kedia, S.; Nayak, B.; Das, P.; et al. Prevalence and association of mycobacterium avium subspecies paratuberculosis with disease course in patients with ulcero-constrictive ileocolonic disease. PLoS ONE 2016, 11, e0152063. [Google Scholar] [CrossRef]
  20. Singh, S.V.; Kuenstner, J.T.; Davis, W.C.; Agarwal, P.; Kumar, N.; Singh, D.; Gupta, S.; Chaubey, K.K.; Kumar, A.; Misri, J.; et al. Concurrent resolution of chronic diarrhea likely due to crohn’s disease and infection with mycobacterium avium paratuberculosis. Front. Med. 2016, 3, 49. [Google Scholar] [CrossRef]
  21. Waddell, L.A.; Rajic, A.; Stark, K.D.C.; McEwen, S.A. The potential public health impact of mycobacterium avium ssp. Paratuberculosis: Global opinion survey of topic specialists. Zoonoses Public Health 2016, 63, 212–222. [Google Scholar] [CrossRef]
  22. Bull, T.J.; McMinn, E.J.; Sidi-Boumedine, K.; Skull, A.; Durkin, D.; Neild, P.; Rhodes, G.; Pickup, R.; Hermon-Taylor, J. Detection and verification of mycobacterium avium subsp. Paratuberculosis in fresh ileocolonic mucosal biopsy specimens from individuals with and without crohn’s disease. J. Clin. Microbiol. 2003, 41, 2915–2923. [Google Scholar]
  23. Naser, S.A.; Ghobrial, G.; Romero, C.; Valentine, J.F. Culture of mycobacterium avium subsp. Paratuberculosis from the blood of patients with crohn’s disease. Lancet 2004, 364, 1039–1044. [Google Scholar]
  24. Naser, S.A.; Schwartz, D.; Shafran, I. Isolation of mycobacterium avium subsp paratuberculosis from breast milk of crohn’s disease patients. Am. J. Gastroenterol. 2000, 95, 1094–1095. [Google Scholar] [CrossRef]
  25. Norgard, B.M.; Nielsen, J.; Fonager, K.; Kjeldsen, J.; Jacobsen, B.A.; Qvist, N. The incidence of ulcerative colitis (1995-2011) and crohn’s disease (1995-2012)—Based on nationwide danish registry data. J. Crohns Colitis 2014, 8, 1274–1280. [Google Scholar] [CrossRef]
  26. Studd, C.; Cameron, G.; Beswick, L.; Knight, R.; Hair, C.; McNeil, J.; Desmond, P.; Wilson, J.; Connell, W.; Bell, S. Never underestimate inflammatory bowel disease: High prevalence rates and confirmation of high incidence rates in australia. J. Gastroenterol. Hepatol. 2016, 31, 81–86. [Google Scholar] [CrossRef]
  27. Wilson, J.; Hair, C.; Knight, R.; Catto-Smith, A.; Bell, S.; Kamm, M.; Desmond, P.; McNeil, J.; Connell, W. High incidence of inflammatory bowel disease in australia: A prospective population-based australian incidence study. Inflamm. Bowel Dis. 2010, 16, 1550–1556. [Google Scholar] [CrossRef]
  28. Galeone, C.; Pelucchi, C.; Barbera, G.; Citterio, C.; La Vecchia, C.; Franchi, A. Crohn’s disease in italy: A critical review of the literature using different data sources. Dig. Liver Dis. 2017, 49, 459–466. [Google Scholar] [CrossRef] [PubMed]
  29. Floyd, D.N.; Langham, S.; Severac, H.C.; Levesque, B.G. The economic and quality-of-life burden of crohn’s disease in europe and the united states, 2000 to 2013: A systematic review. Dig. Dis. Sci. 2015, 60, 299–312. [Google Scholar] [CrossRef] [PubMed]
  30. Schwarz, J.; Sykora, J.; Cvalinova, D.; Pomahacova, R.; Kleckova, J.; Kryl, M.; Vcelak, P. Inflammatory bowel disease incidence in czech children: A regional prospective study, 2000-2015. World J. Gastroenterol. 2017, 23, 4090–4101. [Google Scholar] [CrossRef]
  31. Lehtinen, P.; Ashorn, M.; Iltanen, S.; Jauhola, R.; Jauhonen, P.; Kolho, K.L.; Auvinen, A. Incidence trends of pediatric inflammatory bowel disease in finland, 1987-2003, a nationwide study. Inflamm. Bowel Dis. 2011, 17, 1778–1783. [Google Scholar] [CrossRef]
  32. Pozler, O.; Maly, J.; Bonova, O.; Dedek, P.; Fruhauf, P.; Havlickova, A.; Janatova, T.; Jimramovsky, F.; Klimova, L.; Klusacek, D.; et al. Incidence of crohn disease in the czech republic in the years 1990 to 2001 and assessment of pediatric population with inflammatory bowel disease. J. Pediatr. Gastroenterol. Nutr. 2006, 42, 186–189. [Google Scholar] [CrossRef]
  33. Olsen, I.; Siguroardottir, O.G.; Djonne, B. Paratuberculosis with special reference to cattle—A review. Vet. Q. 2002, 24, 12–28. [Google Scholar] [CrossRef]
  34. Sorensen, O.; Rawluk, S.; Wu, J.; Manninen, K.; Ollis, G. Mycobacterium paratuberculosis in dairy herds in alberta. Can. Vet. J. 2003, 44, 221–226. [Google Scholar]
  35. United States Department of Agriculture. Johne’s Disease on U. S. Dairies. Available online: http://www.aphis.usda.gov/animal_health/nahms/dairy/downloads/dairy07/Dairy07_is_Johnes.pdf (accessed on 9 May 2019).
  36. Caldow, G.; Strain, S.A.J.; Chapman, Z.; Kemp, R.; Cook, A.J. A survey to estimate the herd level prevalence of paratuberculosis in the dairy herd of the united kingdom. Cattle Pract. 2007, 15, 169–171. [Google Scholar]
  37. Kemp, R.; Caldow, G.; Strain, S. Herd prevalence of johne’s disease. Vet. Rec. 2006, 159, 572. [Google Scholar] [CrossRef] [PubMed]
  38. Velasova, M.; Damaso, A.; Prakashbabu, B.C.; Gibbons, J.; Wheelhouse, N.; Longbottom, D.; Van Winden, S.; Green, M.; Guitian, J. Herd-level prevalence of selected endemic infectious diseases of dairy cows in great britain. J. Dairy Sci. 2017, 100, 9215–9233. [Google Scholar] [CrossRef]
  39. DEFRA, Department of the Environment Food and Rural Affairs (UK). An Integrated Strategy to Determine the Herd Level Prevalence of Johne’s Disease in the UK Dairy Herd. Available online: http://archive.defra.gov.uk/foodfarm/farmanimal/diseases/atoz/documents/johnes-report0911.pdf (accessed on 9 May 2019).
  40. Clarke, C.J. The pathology and pathogenesis of paratuberculosis in ruminants and other species. J. Comp. Pathol. 1997, 116, 217–261. [Google Scholar] [CrossRef]
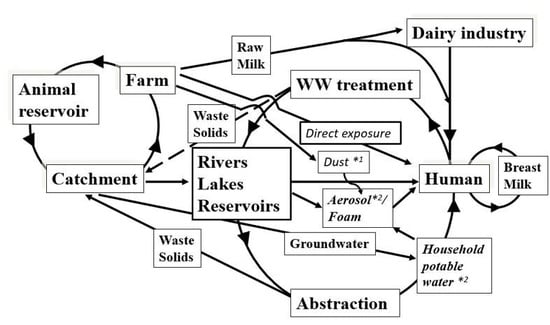
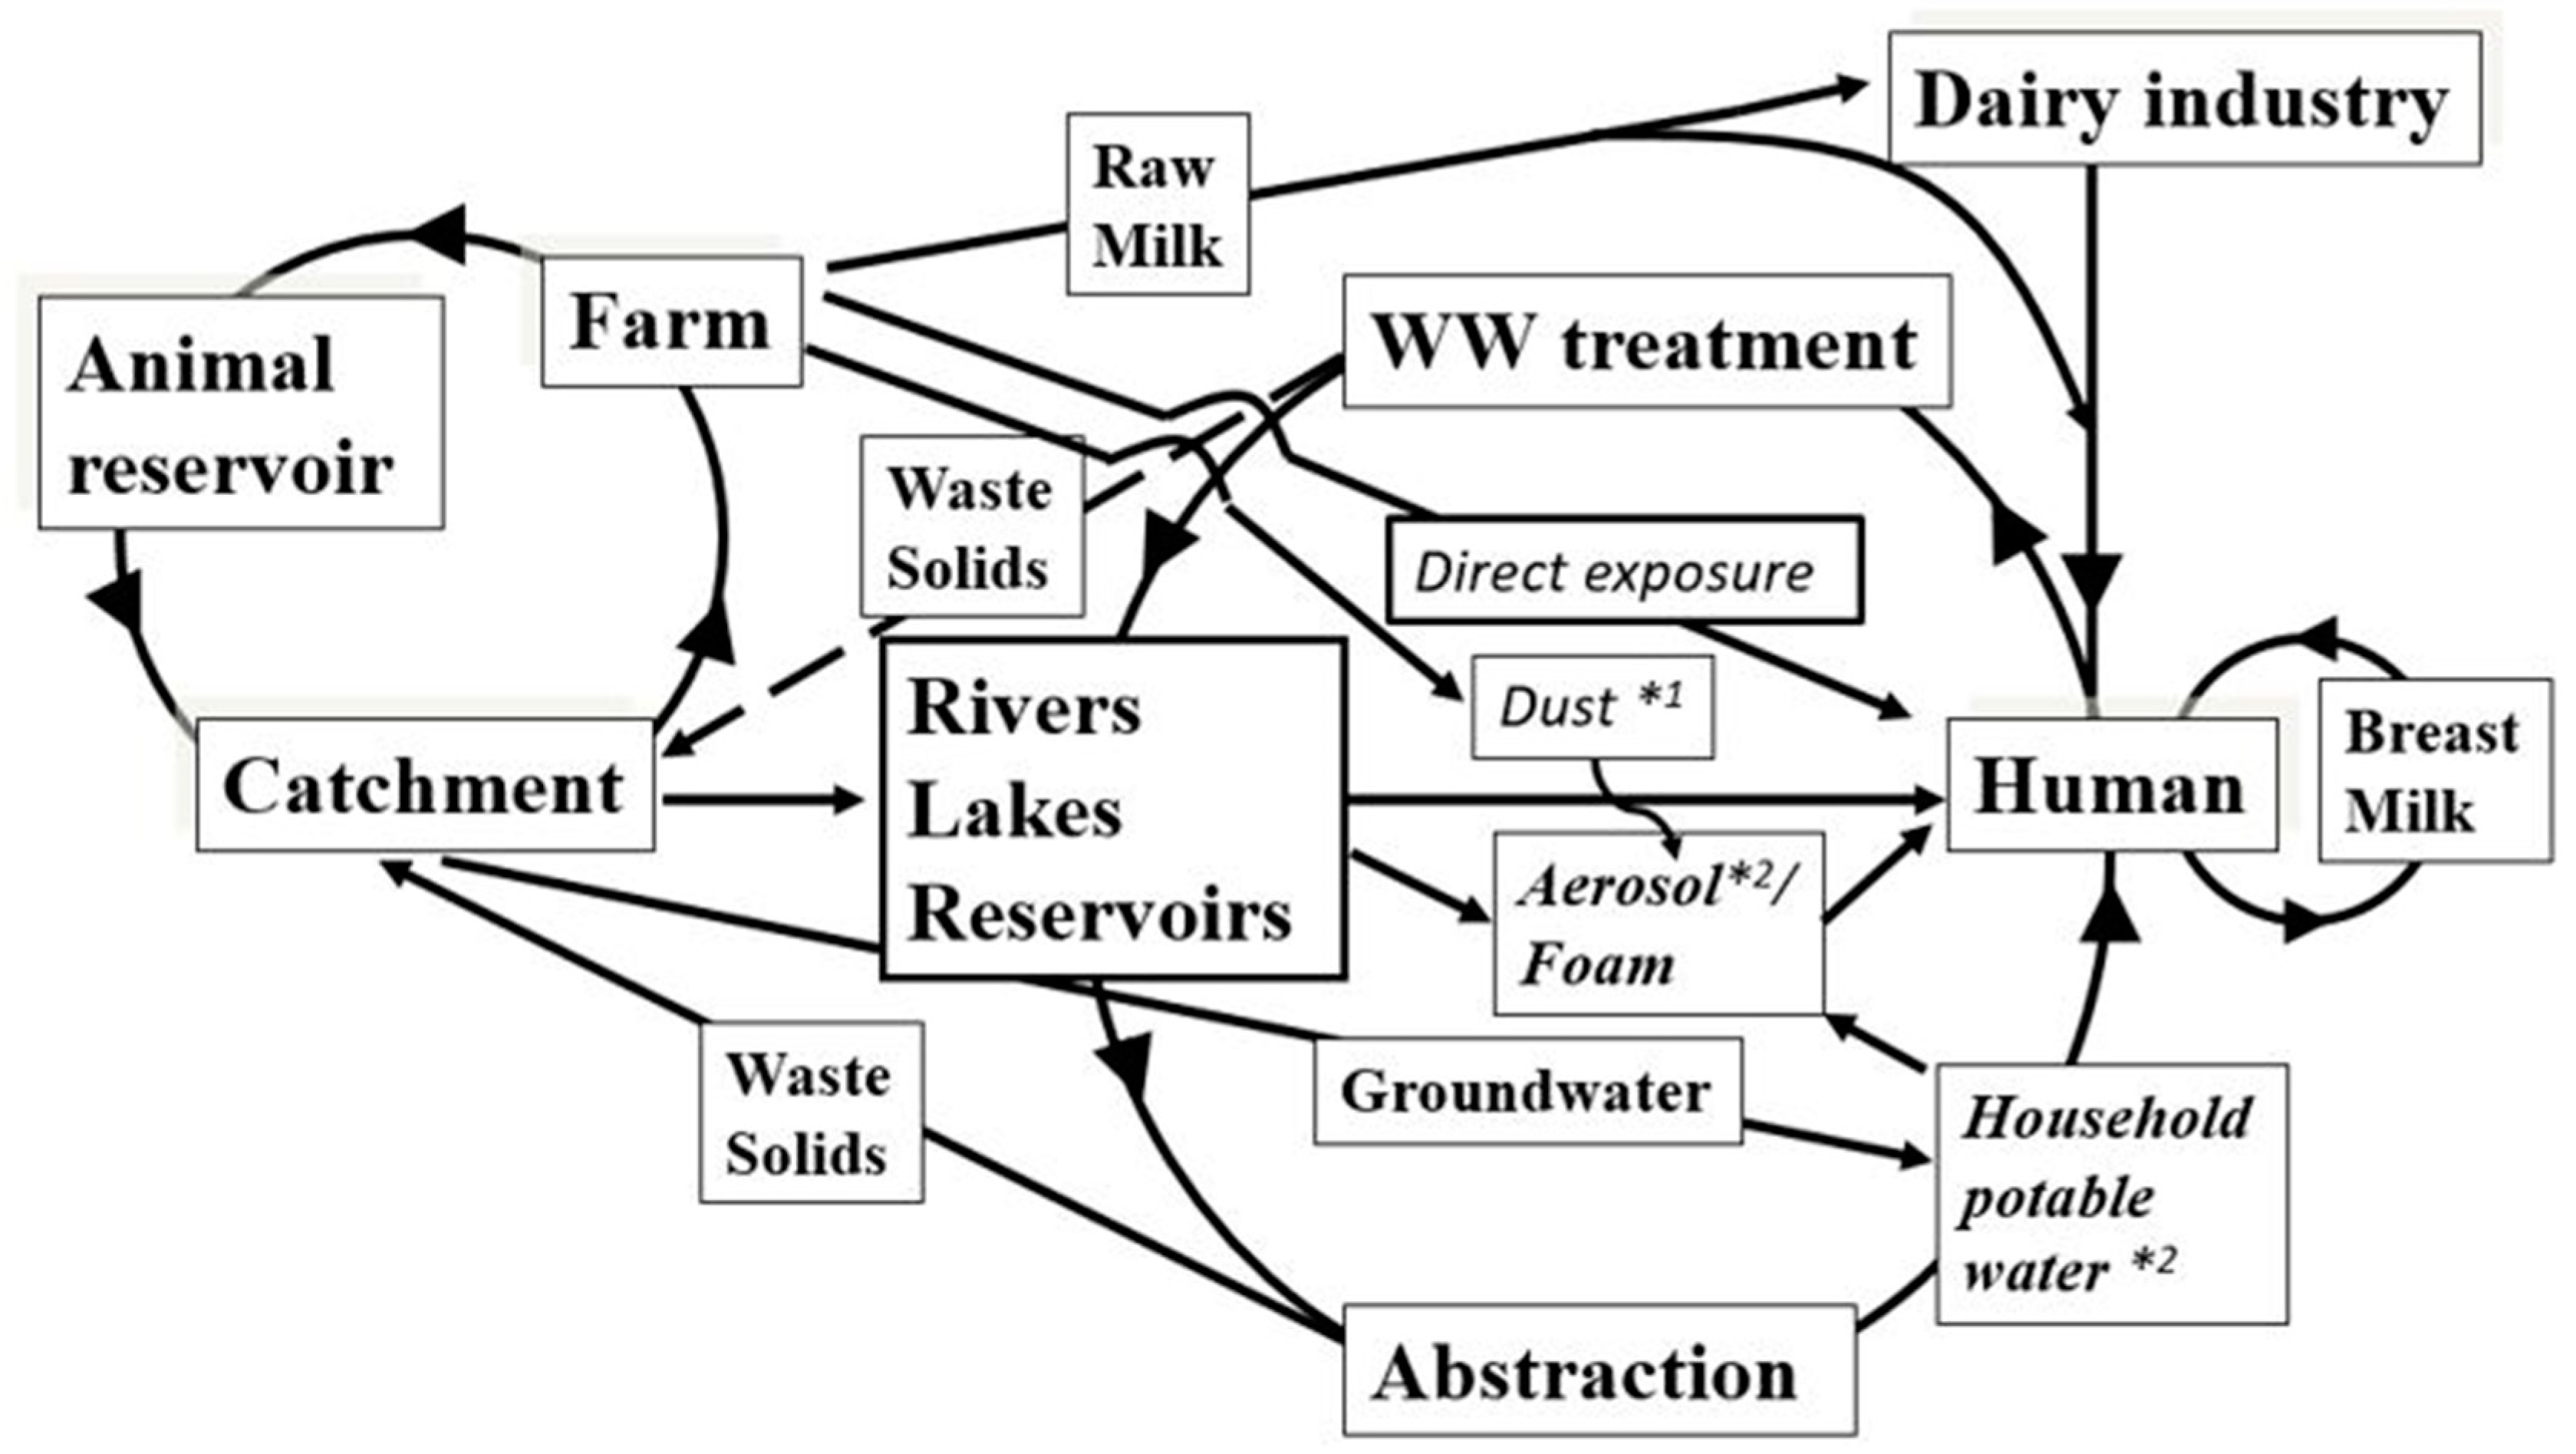
  41. Pickup, R.W.; Rhodes, G.; Bull, T.J.; Arnott, S.; Sidi-Boumedine, K.; Hurley, M.; Hermon-Taylor, J. Mycobacterium avium subsp. Paratuberculosis in lake catchments, in river water abstracted for domestic use, and in effluent from domestic sewage treatment works: Diverse opportunities for environmental cycling and human exposure. Appl. Environ. Microbiol. 2006, 72, 4067–4077. [Google Scholar] [CrossRef]
  42. Whittington, R.J.; Marsh, I.B.; Reddacliff, L.A. Survival of mycobacterium avium subsp paratuberculosis in dam water and sediment. Appl. Environ. Microbiol. 2005, 71, 5304–5308. [Google Scholar] [CrossRef]
  43. Pickup, R.W.; Rhodes, G.; Sidi-Boumedine, K.; Arnott, S.; Bull, T.; Weightman, A.J.; Hermon-Taylor, J. Mycobacterium avium subspecies paratuberculosis in the catchment and water of the river taff in South Wales, UK and its potential relationship to clustering of crohn’s disease in the city of cardiff. Appl. Environ. Microbiol. 2005, 71, 2130–2139. [Google Scholar] [CrossRef]
  44. Rhodes, G.; Richardson, H.; Hermon-Taylor, J.; Weightman, A.; Higham, A.; Pickup, R. Mycobacterium avium subspecies paratuberculosis: Human exposure through environmental and domestic aerosols. Pathogens 2014, 3, 577–595. [Google Scholar] [CrossRef] [PubMed]
  45. Rhodes, G.; Henrys, P.; Thomson, B.C.; Pickup, R.W. Mycobacterium avium subspecies paratuberculosis is widely distributed in british soils and waters: Implications for animal and human health. Envir. Microbiol. 2013, 15, 2761–2774. [Google Scholar]
  46. Owen, G.J.; Perks, M.T.; Benskin, C.M.H.; Wilkinson, M.E.; Jonczyk, J.; Quinn, P.F. Monitoring agricultural diffuse pollution through a dense monitoring network in the river eden demonstration test catchment, cumbria, UK. Area 2012, 44, 443–453. [Google Scholar] [CrossRef]
  47. Schilling, K.; Zessner, M. Foam in the aquatic environment. Water Res. 2011, 45, 4355–4366. [Google Scholar] [CrossRef] [PubMed]
  48. Schoenenbrucher, H.; Abdurnawjood, A.; Failing, K.; Buelte, M. New triplex real-time pcr assay for detection of mycobacterium avium subsp paratuberculosis in bovine feces. Appl. Environ. Microbiol. 2008, 74, 2751–2758. [Google Scholar] [CrossRef] [PubMed]
  49. Slana, I.; Kralik, P.; Kralova, A.; Pavlik, I. On-farm spread of mycobacterium avium subsp paratuberculosis in raw milk studied by is900 and f57 competitive real time quantitative pcr and culture examination. Int. J. Food Microbiol. 2008, 128, 250–257. [Google Scholar] [CrossRef]
  50. Rhodes, G.; Fluri, A.; Gerber, M.; Henderson, A.; Ruefenacht, A.; Pickup, R.W. Detection of mycobacterium immunogenum by real-time quantitative taqman pcr. J. Microbiol. Meth. 2008, 73, 266–268. [Google Scholar] [CrossRef]
  51. Poupart, P.; Coene, M.; Vanheuverswyn, H.; Cocito, C. Preparation of a specific rna probe for detection of mycobacterium paratuberculosis and diagnosis of johnes disease. J. Clin. Microbiol. 1993, 31, 1601–1605. [Google Scholar]
  52. Li, L.L.; Bannantine, J.P.; Zhang, Q.; Amonsin, A.; May, B.J.; Alt, D.; Banerji, N.; Kanjilal, S.; Kapur, V. The complete genome sequence of mycobacterium avium subspecies paratuberculosis. Proc. Natn. Acad. Sci. USA 2005, 102, 12344–12349. [Google Scholar] [CrossRef] [PubMed]
  53. McCullagh, P.; Nelder, J.A. Generalized Linear Models, 2nd ed.; Monographs on Statistics and Applied Probability 37; Chapman and Hall/CRC: Boca Raton, FL, USA, 1989. [Google Scholar]
  54. Team, R.D.C. R: A Language and Environment for Statistical Computing. Available online: http://www.R-project.org (accessed on 9 May 2019).
  55. Mardia, K.V.; Kent, J.T.; Bibby, J.M. Multivariate Analysis; Academic Press: Cambridge, MA, USA, 1979. [Google Scholar]
  56. Herthnek, D.; Englund, S.; Willemsen, P.T.J.; Bolske, G. Sensitive detection of myobacterium avium subsp paratuberculosis in bovine semen by real-time pcr. J. Appl. Microbiol. 2006, 100, 1095–1102. [Google Scholar] [CrossRef] [PubMed]
  57. Pavlik, I.; Horvathova, A.; Dvorska, L.; Bartl, J.; Svastova, P.; du Maine, R.; Rychlik, I. Standardisation of restriction fragment length polymorphism analysis for mycobacterium avium subspecies paratuberculosis. J. Microbiol. Meth. 1999, 38, 155–167. [Google Scholar] [CrossRef]
  58. Terry, J.A.; Benskin, C.M.H.; Eastoe, E.F.; Haygarth, P.M. Temporal dynamics between cattle in-stream presence and suspended solids in a headwater catchment. Environ. Sci. Process. Impacts 2014, 16, 1570–1577. [Google Scholar] [CrossRef]
  59. Toth, J.D.; Aceto, H.W.; Rankin, S.C.; Dou, Z. Short communication: Survey of animal-borne pathogens in the farm environment of 13 dairy operations. J. Dairy Sci. 2013, 96, 5756–5761. [Google Scholar] [CrossRef]
  60. Petrovski, S.; Dyson, Z.; Quill, E.; SJ, M.; Daniel Tillett, D.; Seviour, R. An examination of the mechanisms for stable foam formation in activated sludge systems. Water Res. 2011, 45, 2146–2154. [Google Scholar] [CrossRef]
  61. Napolitano, G.E.; Richmond, J.E. Enrichment of biogenic lipids, hydrocarbons and pcbs in stream-surface foams. Environ. Toxicol. Chem. 1995, 14, 197–201. [Google Scholar] [CrossRef]
  62. Maynard, N.G. Aquatic foams as an ecological habitat. Z. Allg. Mikrobiol. 1968, 8, 119–127. [Google Scholar] [CrossRef]
  63. Wolf, R.; Donate, K.; Khol, J.L.; Barkema, H.W.; Kastelic, J.; Wagner, P. Detection of mycobacterium avium subspecies paratuberculosis infected cattle herds using environmental samples: A review. Berl. Munch. Tierarztl. Wochenschr. 2017, 130, 4–12. [Google Scholar]
  64. Thirunavukkarasu, S.; Plain, K.M.; de Silva, K.; Marais, B.J.; Whittington, R.J. Applying the one health concept to mycobacterial research overcoming parochialism. Zoonoses Public Health 2017, 64, 401–422. [Google Scholar] [CrossRef] [PubMed]
  65. Sechi, L.A.; Dow, C.T. Mycobacterium avium ss. Paratuberculosis—Zoonosis the hundred year war—Beyond crohn’s disease. Front. Immunol. 2015, 6, 1–8. [Google Scholar] [CrossRef]
Figure 1. Sampling sites on the rivers Tywi, Cothi and Dulas (Sites 5, 6 and 7 represent weekly sample points; Monthly samples comprised Tywi upstream of Waste water treatment Works (WWTW *) (A); Tywi downstream of WWTW * (B); Cothi upstream of WWTW (C); Cothi downstream of WWTW * (D); Sites 1, 2, 3, 4, 6 and 7 represent sites sampled on the same day as the fine sampling site, (5) sites which were sampled on three occasions every 30 min, and the remaining sites were sampled once on each occasion).
Microorganisms 07 00136 g001
Figure 2. The presence of Map in the rivers Tywi and Cothi (Wales, UK) compared to their respective river heights (m).
Microorganisms 07 00136 g002
Figure 3. Detection of Map in the rivers Tywi and Cothi and at the confluence. (Arrow denotes distance from furthest sampling site (see Figure 1.) Data show detection of Map in individual rivers and when detected in others on the same sampling date.)
Microorganisms 07 00136 g003
Figure 4. Revised model Map transmission and human exposure based on Pickup et al. [41] accounting for additional routes via potable water, natural foam and aerosols. *1 [63] *2 [44].
Microorganisms 07 00136 g004
Table 1. Sampling sites for weekly/monthly samples (2010–2011).
Sample SiteUK OSGRSample TypeDateSamples n =
Tywi upstream of WWTW * (A)SN616212River waterMonthly15
Tywi downstream of WWTW * (B)SN614211River waterMonthly15
Tywi upstream (5)SN533212River waterWeekly65
Cothi (6)SN505217River waterWeekly61
Cothi upstream of WWTW * (C)SN506214River waterMonthly14
Cothi downstream of WWTW * (D)SN502210River waterMonthly14
Tywi downstream (Nantgaredig; 7)SN491203River waterWeekly64
Sampling sites: location and dates, (weekly/monthly samples (2010–2011); WWTW *—waste water treatment plant).
Table 2. Influence (p values) of river height, river flow (at the time of sampling) and rainfall (on days preceding sampling) on the presence of Map in rivers Tywi and Cothi. (ns: not significant).
RiverHeight (m)Flow (m3 s−1)Rainfall (Days before Sampling)
12369
Cothi0.00260.00190.003 ns0.01ns0.018
Tywi upstream0.00013 0.000080.02 0.0000060.010.034ns
Tywi downstream0.037 0.0290.030.00002ns0.011ns
Table 3. Sample sites for Fine sampling (2012–2013).
Sample Site OSGR Sample TypeSampling Date
Ford (1)SN595222Foam 24.07.2012
Field drain water23.04.2013
River water24.07/20/11.2012
River water23.04.2013
Dulus pre-tributary (2)SN550212River water24.07/20.11.2012
River water23.04.2013
Dulas side tributary (3)SN550212River water24.07/20.11.2012
River water23.04.2013
Dulas downstream (4)SN550212River water24.07/20.11.2012
River water23.04.2013
Sediment23.04.2013
Foam24.07.2012
Tywi upstream (5)SN533212Sediment24.07.2012
Sediment23.04.2013
River water (FS)24.07/20.11.2012
River water (FS)23.04.2013
Cothi (6)SN505217River water24.07/20.11.2012
River water23.04.2013
Nantgaredig bridge (7)
Tywi downsteam
SN494204River water
River water
24.07/20.11.2012
23.04.2013
Fine sampling (FS; 2012–2013) fine sample comprising hourly samples over a 6-h period in a day (FS-Fine sampling).
Table 4. Biweekly sampling of Field Beck Water from the Eden Catchment (2012–2013).
Sub-CatchmentsSample SiteOSRG
MorlandLong SikeNY581196
Sleagill BeckNY596190
Newby BeckNY597212
DarceLowthwaite BeckNY409236
Thackthwaite Beck at NabendNY411253
Mell Fell BeckNY407244
PowPow Beck at Beckhouse BridgeNY422469
Unnamed tributary Pow BeckNY386500
Pow Beck at Green LaneNY386500
Biweekly sampling of Field Beck Water from the Eden Catchment (2012–2013, n = 13). (OSRG—UK Ordnance Survey Grid Reference).

