
Evaluation of Potential Effects of NaCl and Sorbic Acid on Staphylococcal Enterotoxin A Formation


Abstract
:1. Introduction
2. Experimental Section
2.1. Bacterial Strains and Cultivation Conditions
2.1.1. Bioreactor Setup
2.1.2. Batch Culture Setup

2.2. DNA Extraction
2.3. Quantification of RF and sea Gene Copies

| Target | Primer/Probe | Sequence (5′ T 3′) |
|---|---|---|
| sea gene | ESA-1 | 5-ATGAGTTGGGCAAGATGGTT-3 |
| Tox A reverse | 5-GGACTTGTTGTCCACGTTAGG-3 | |
| Tox A-Fluo 1 | CCTTTGGAAACGGTTAAAACGAATAAGAA-FL | |
| Tox A-Red 1 | LC-R640-TGTAACTGTTCAGGAGTTGGATCTTCA p * | |
| RF | forward | AAAATATAGCAATAACTACATCCG |
| reverse | AAGTCCCTAAAAAGTCCCTA | |
| FL | ATGTTAAAAGTCTCCAGTTTGGATACA-FL | |
| LC | LC-R640-AgAAACCTTGTAACAACAGTATTTATTGGG p * | |
| recA gene | recA forward | ATGCTCAAGCATTAGGCGTA |
| recA reverse | TTAGGTGTTAAAGCAGCAACTGA | |
| recA FL | ACAAGGTCTTGAAATCGCCG-FL | |
| recA LC | LC-R640-AGCATTTGTTAGAAGTGGTGCAGT-PH |
2.4. RNA Extraction
2.5. cDNA Synthesis
2.6. ELISA
3. Results and Discussion
3.1. Response of Sa17 Steady State Cells to NaCl and Sorbic Acid

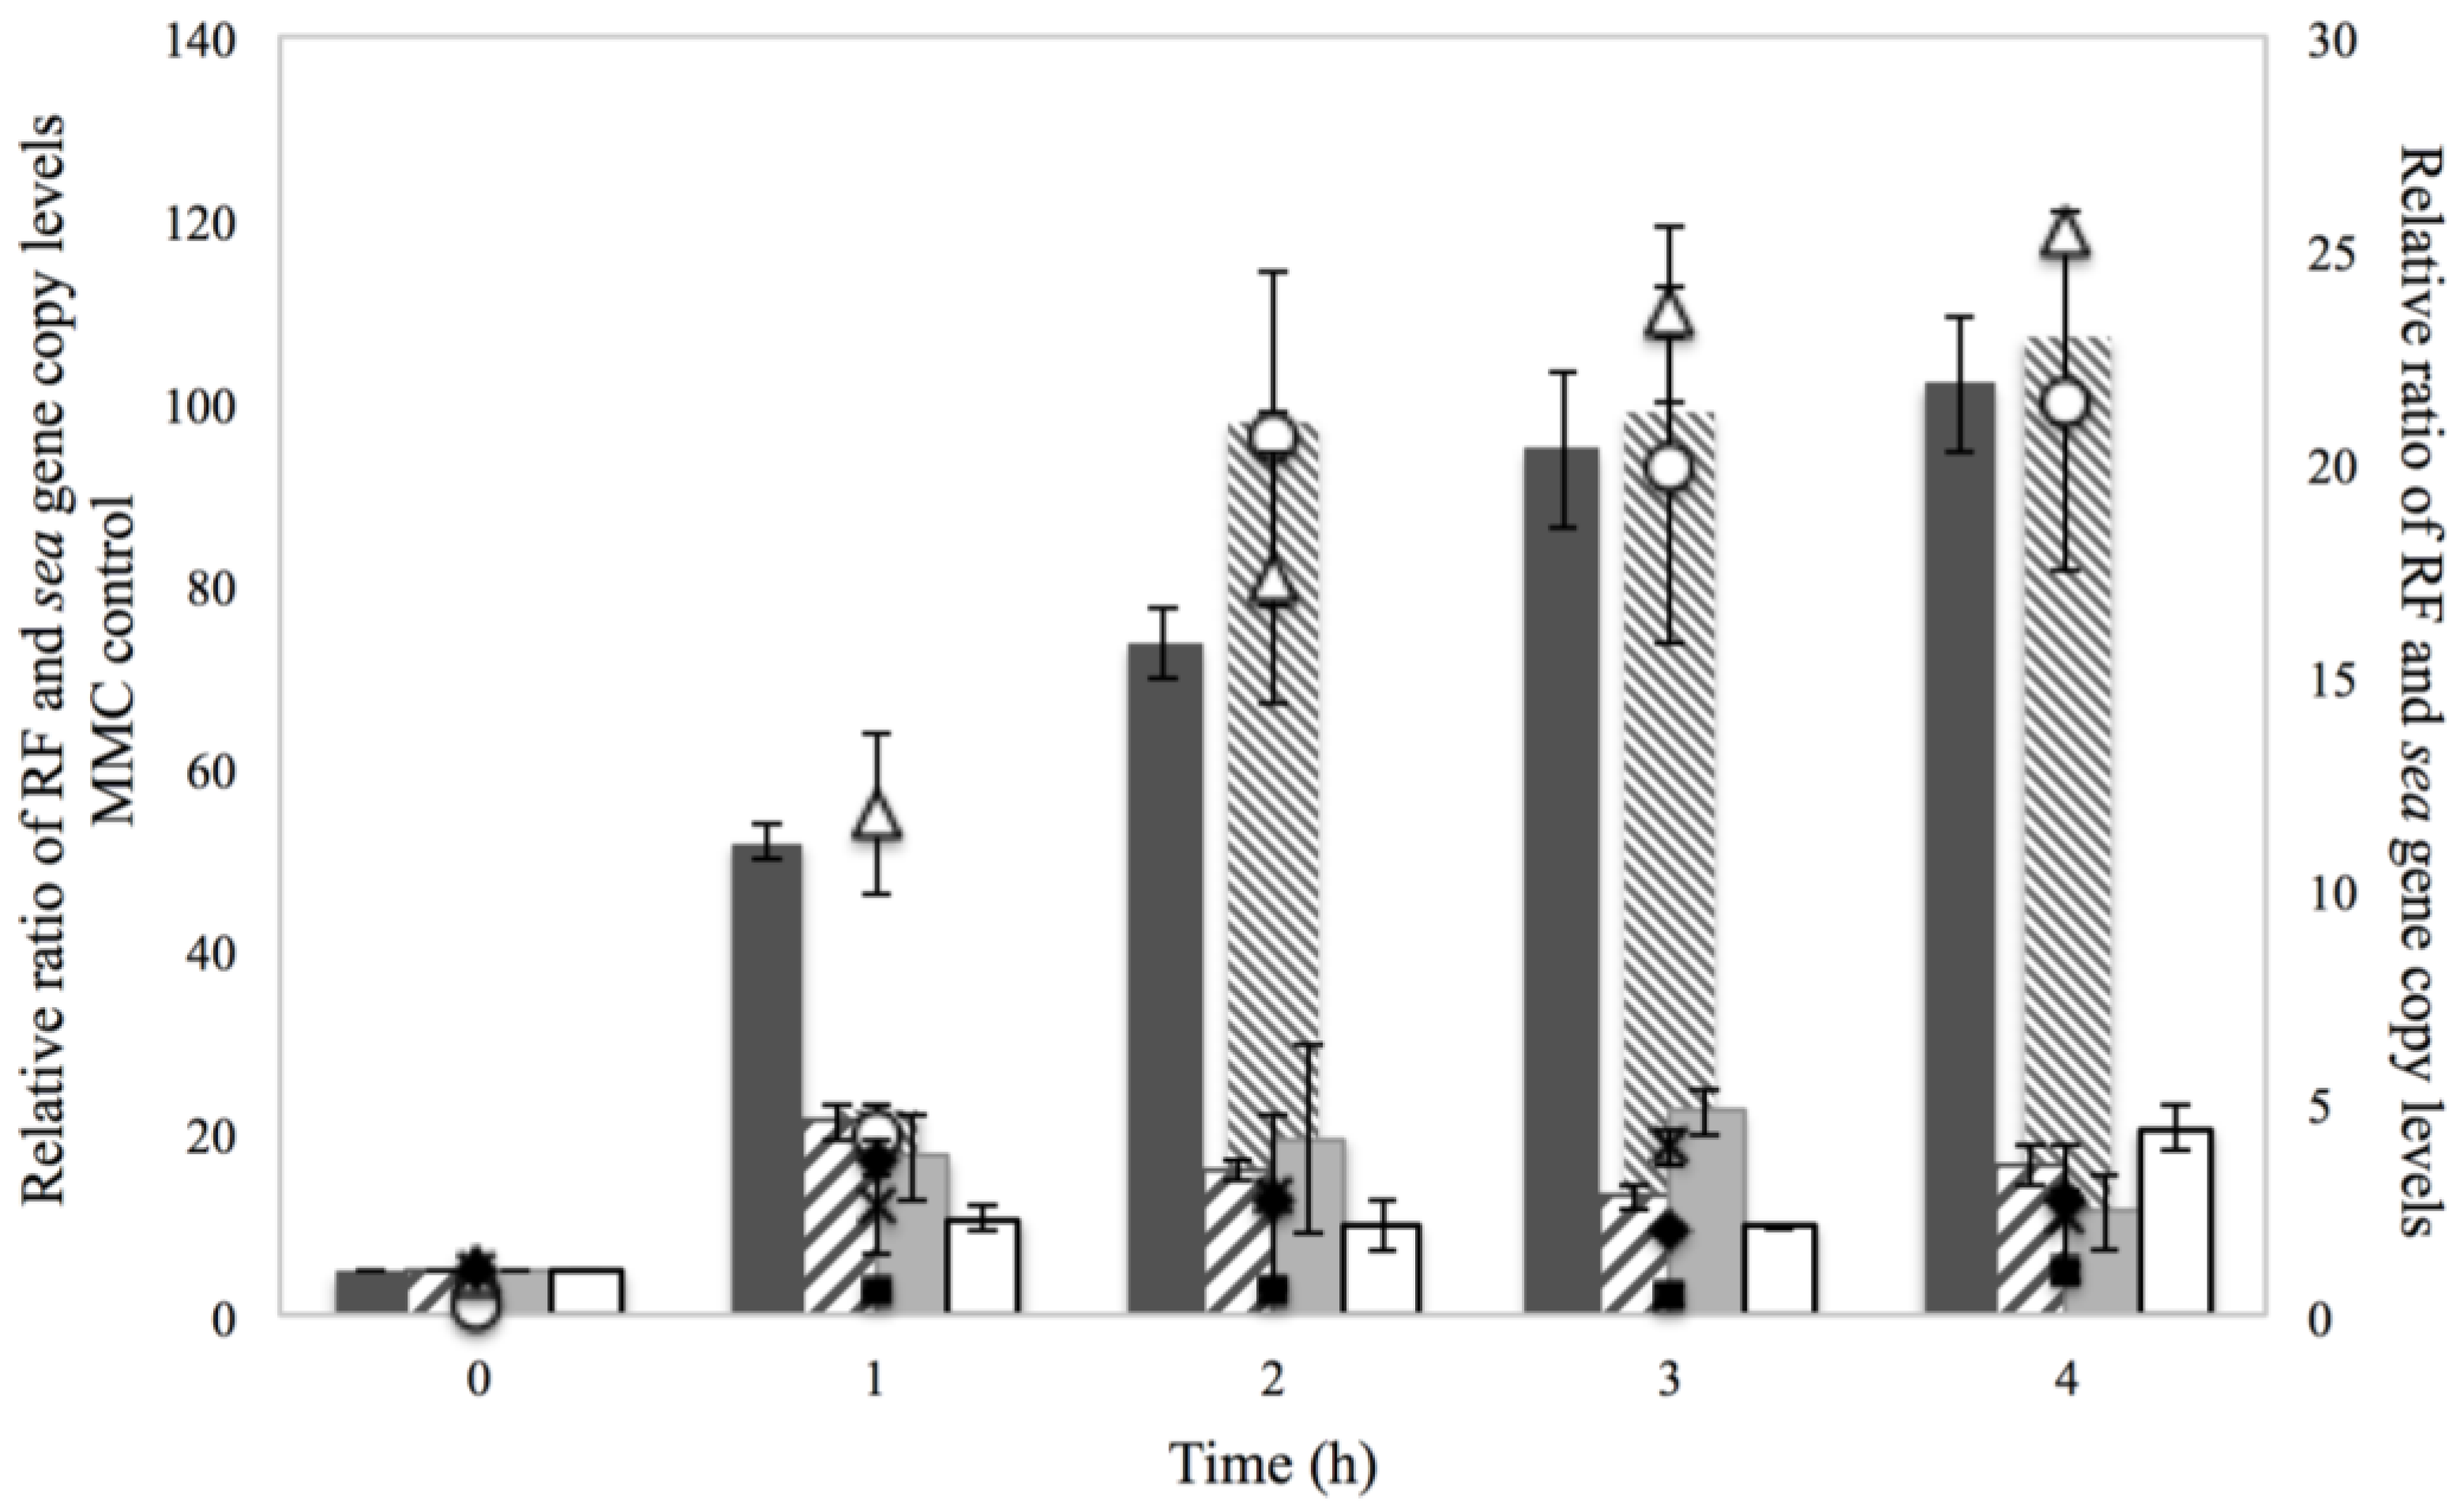
 ) and (Δ), 0.15% sorbic acid (
  ) and (♦), 2% NaCl + 0.15% sorbic acid (
  ) and (×) and the controls of MMC (
  ) and (○) and BHI with no additives (□) and (■), obtained from two independent experiments. The left Y axis represents the relative ratio levels, as calculated from Cq values, of RF and sea gene for MMC control while the right Y axis represents the relative ratio of RF and sea gene for NaCl, sorbic acid, NaCl + sorbic acid and BHI with no additives. The X axis represents the time in hour.
) and (Δ), 0.15% sorbic acid ( ) and (♦), 2% NaCl + 0.15% sorbic acid ( ) and (×) and the controls of MMC ( ) and (○) and BHI with no additives (□) and (■), obtained from two independent experiments. The left Y axis represents the relative ratio levels, as calculated from Cq values, of RF and sea gene for MMC control while the right Y axis represents the relative ratio of RF and sea gene for NaCl, sorbic acid, NaCl + sorbic acid and BHI with no additives. The X axis represents the time in hour.
) and (○) and BHI with no additives (□) and (■), obtained from two independent experiments. The left Y axis represents the relative ratio levels, as calculated from Cq values, of RF and sea gene for MMC control while the right Y axis represents the relative ratio of RF and sea gene for NaCl, sorbic acid, NaCl + sorbic acid and BHI with no additives. The X axis represents the time in hour.
) and (Δ), 0.15% sorbic acid ( ) and (♦), 2% NaCl + 0.15% sorbic acid ( ) and (×) and the controls of MMC ( ) and (○) and BHI with no additives (□) and (■), obtained from two independent experiments. The left Y axis represents the relative ratio levels, as calculated from Cq values, of RF and sea gene for MMC control while the right Y axis represents the relative ratio of RF and sea gene for NaCl, sorbic acid, NaCl + sorbic acid and BHI with no additives. The X axis represents the time in hour.
3.2. Activation of the SOS Response
), 0.15% sorbic acid ( ), 2% NaCl + 0.15% sorbic acid ( ) and the control of MMC ( ), obtained from two independent experiments. The Y axis represents the recA relative ratio levels as calculated from Cq values and the X axis the time in h. Values below/above 1 in relative ratio demonstrate down- or up-regulation of recA in relation to the control condition of BHI with no additives (value of 1).
), 0.15% sorbic acid ( ), 2% NaCl + 0.15% sorbic acid ( ) and the control of MMC ( ), obtained from two independent experiments. The Y axis represents the recA relative ratio levels as calculated from Cq values and the X axis the time in h. Values below/above 1 in relative ratio demonstrate down- or up-regulation of recA in relation to the control condition of BHI with no additives (value of 1).
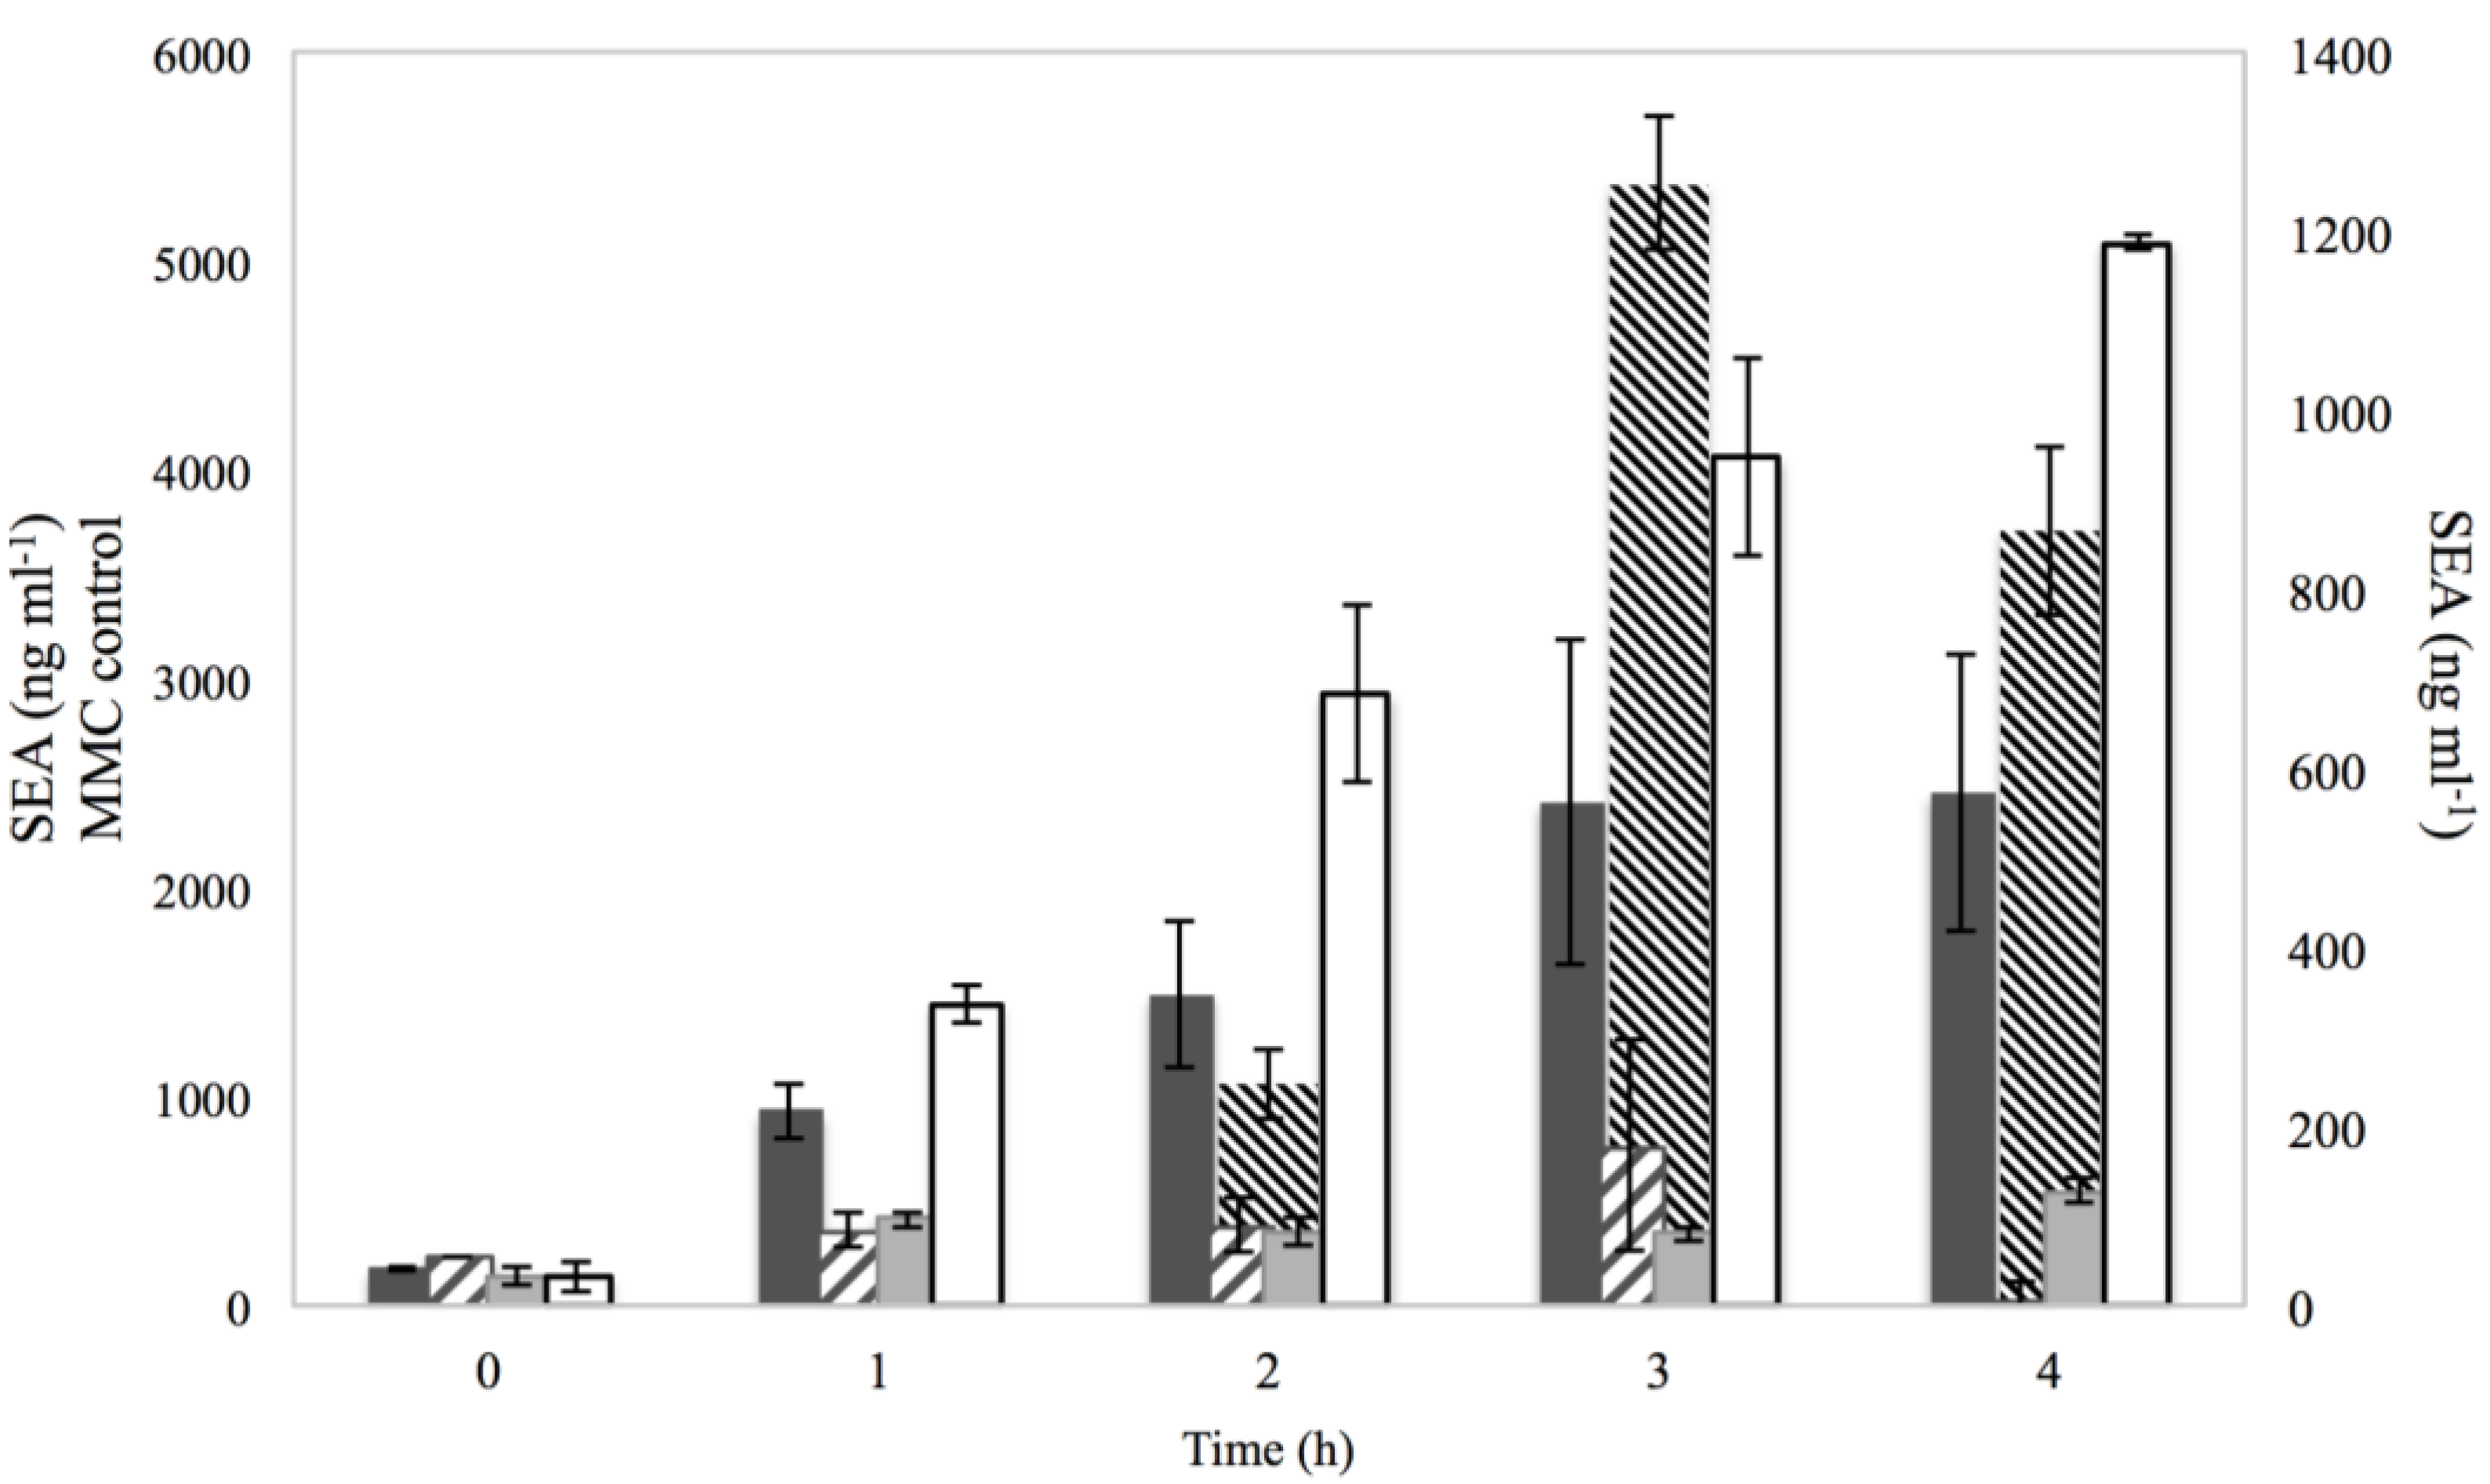
3.3. SEA production
), 0.15% sorbic acid ( ), 2% NaCl + 0.15% sorbic acid ( ) and the controls of MMC ( ) and BHI with no additives (□), obtained from two independent experiments. The left Y axis represents the SEA in ng·ml−1 for MMC control, while the right Y axis represents the SEA in ng·ml−1 for NaCl, sorbic acid, NaCl + sorbic acid and BHI with no additives. The X axis represents the time in h.
), 0.15% sorbic acid ( ), 2% NaCl + 0.15% sorbic acid ( ) and the controls of MMC ( ) and BHI with no additives (□), obtained from two independent experiments. The left Y axis represents the SEA in ng·ml−1 for MMC control, while the right Y axis represents the SEA in ng·ml−1 for NaCl, sorbic acid, NaCl + sorbic acid and BHI with no additives. The X axis represents the time in h.
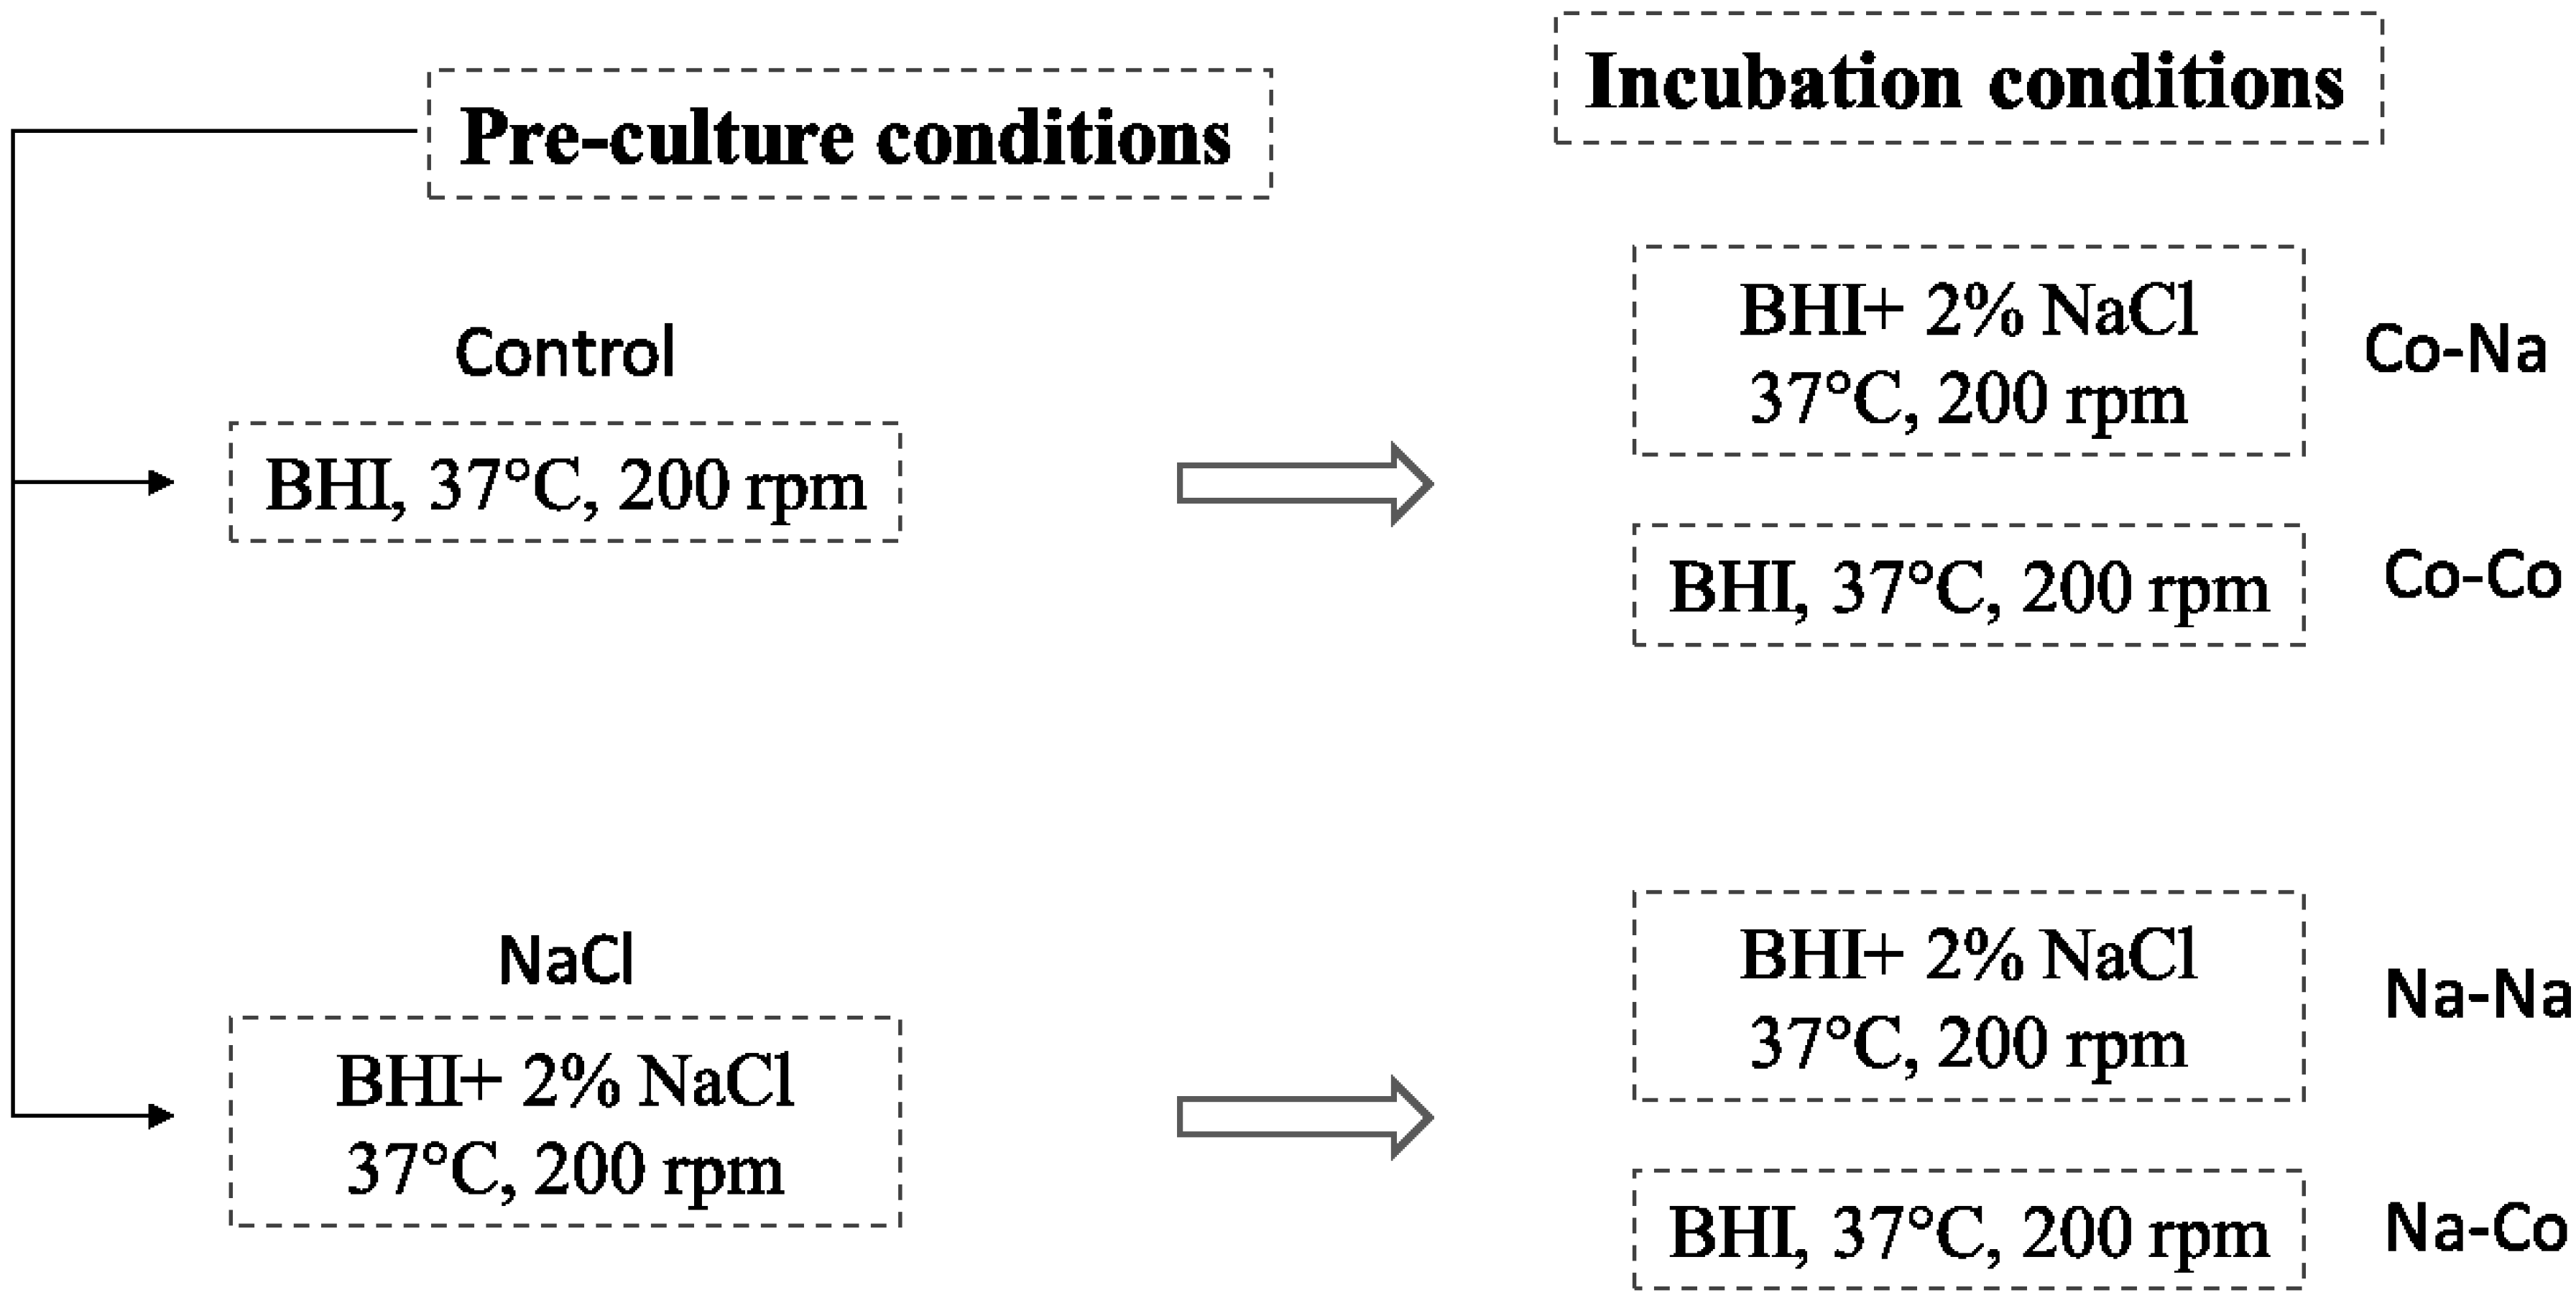
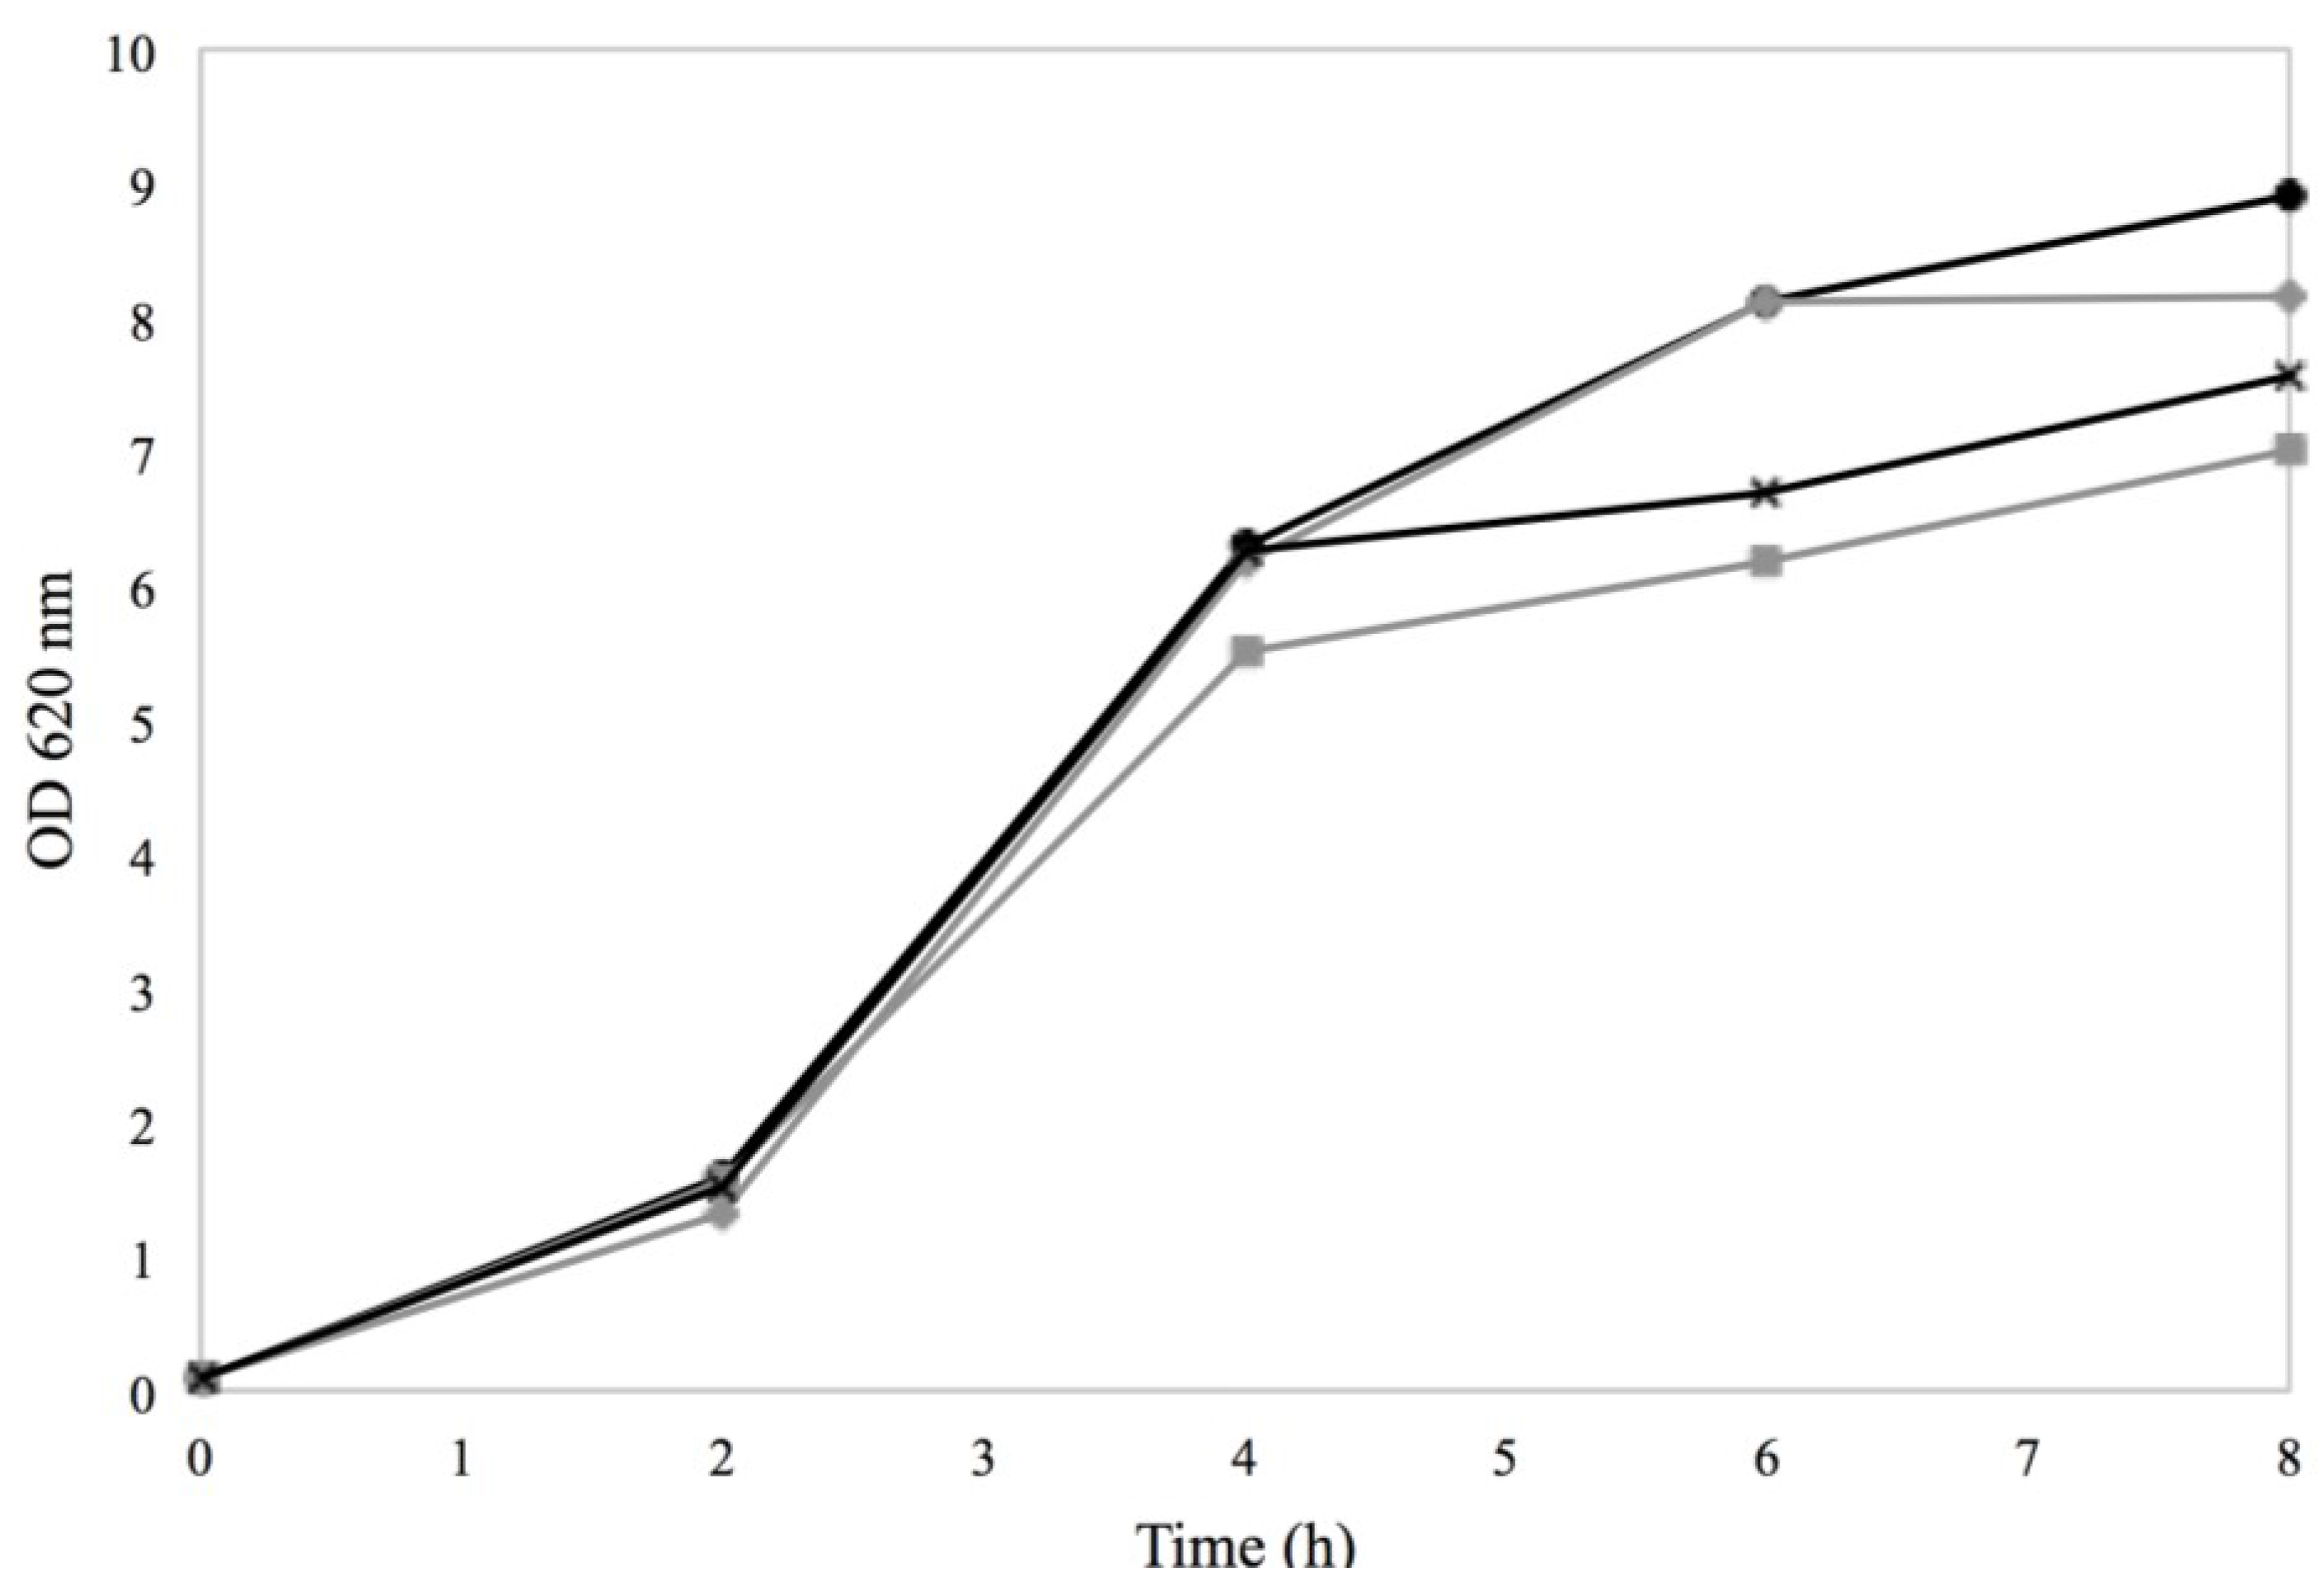
3.4. The Impact of Physiological Cell History on Prophage Induction
), Na–Co with (  ) and Na–Na with (×). The results are obtained from one experiment.
), Na–Co with ( ) and Na–Na with (×). The results are obtained from one experiment.
) and Na–Na with (×). The results are obtained from one experiment.
), Na–Co with ( ) and Na–Na with (×). The results are obtained from one experiment.
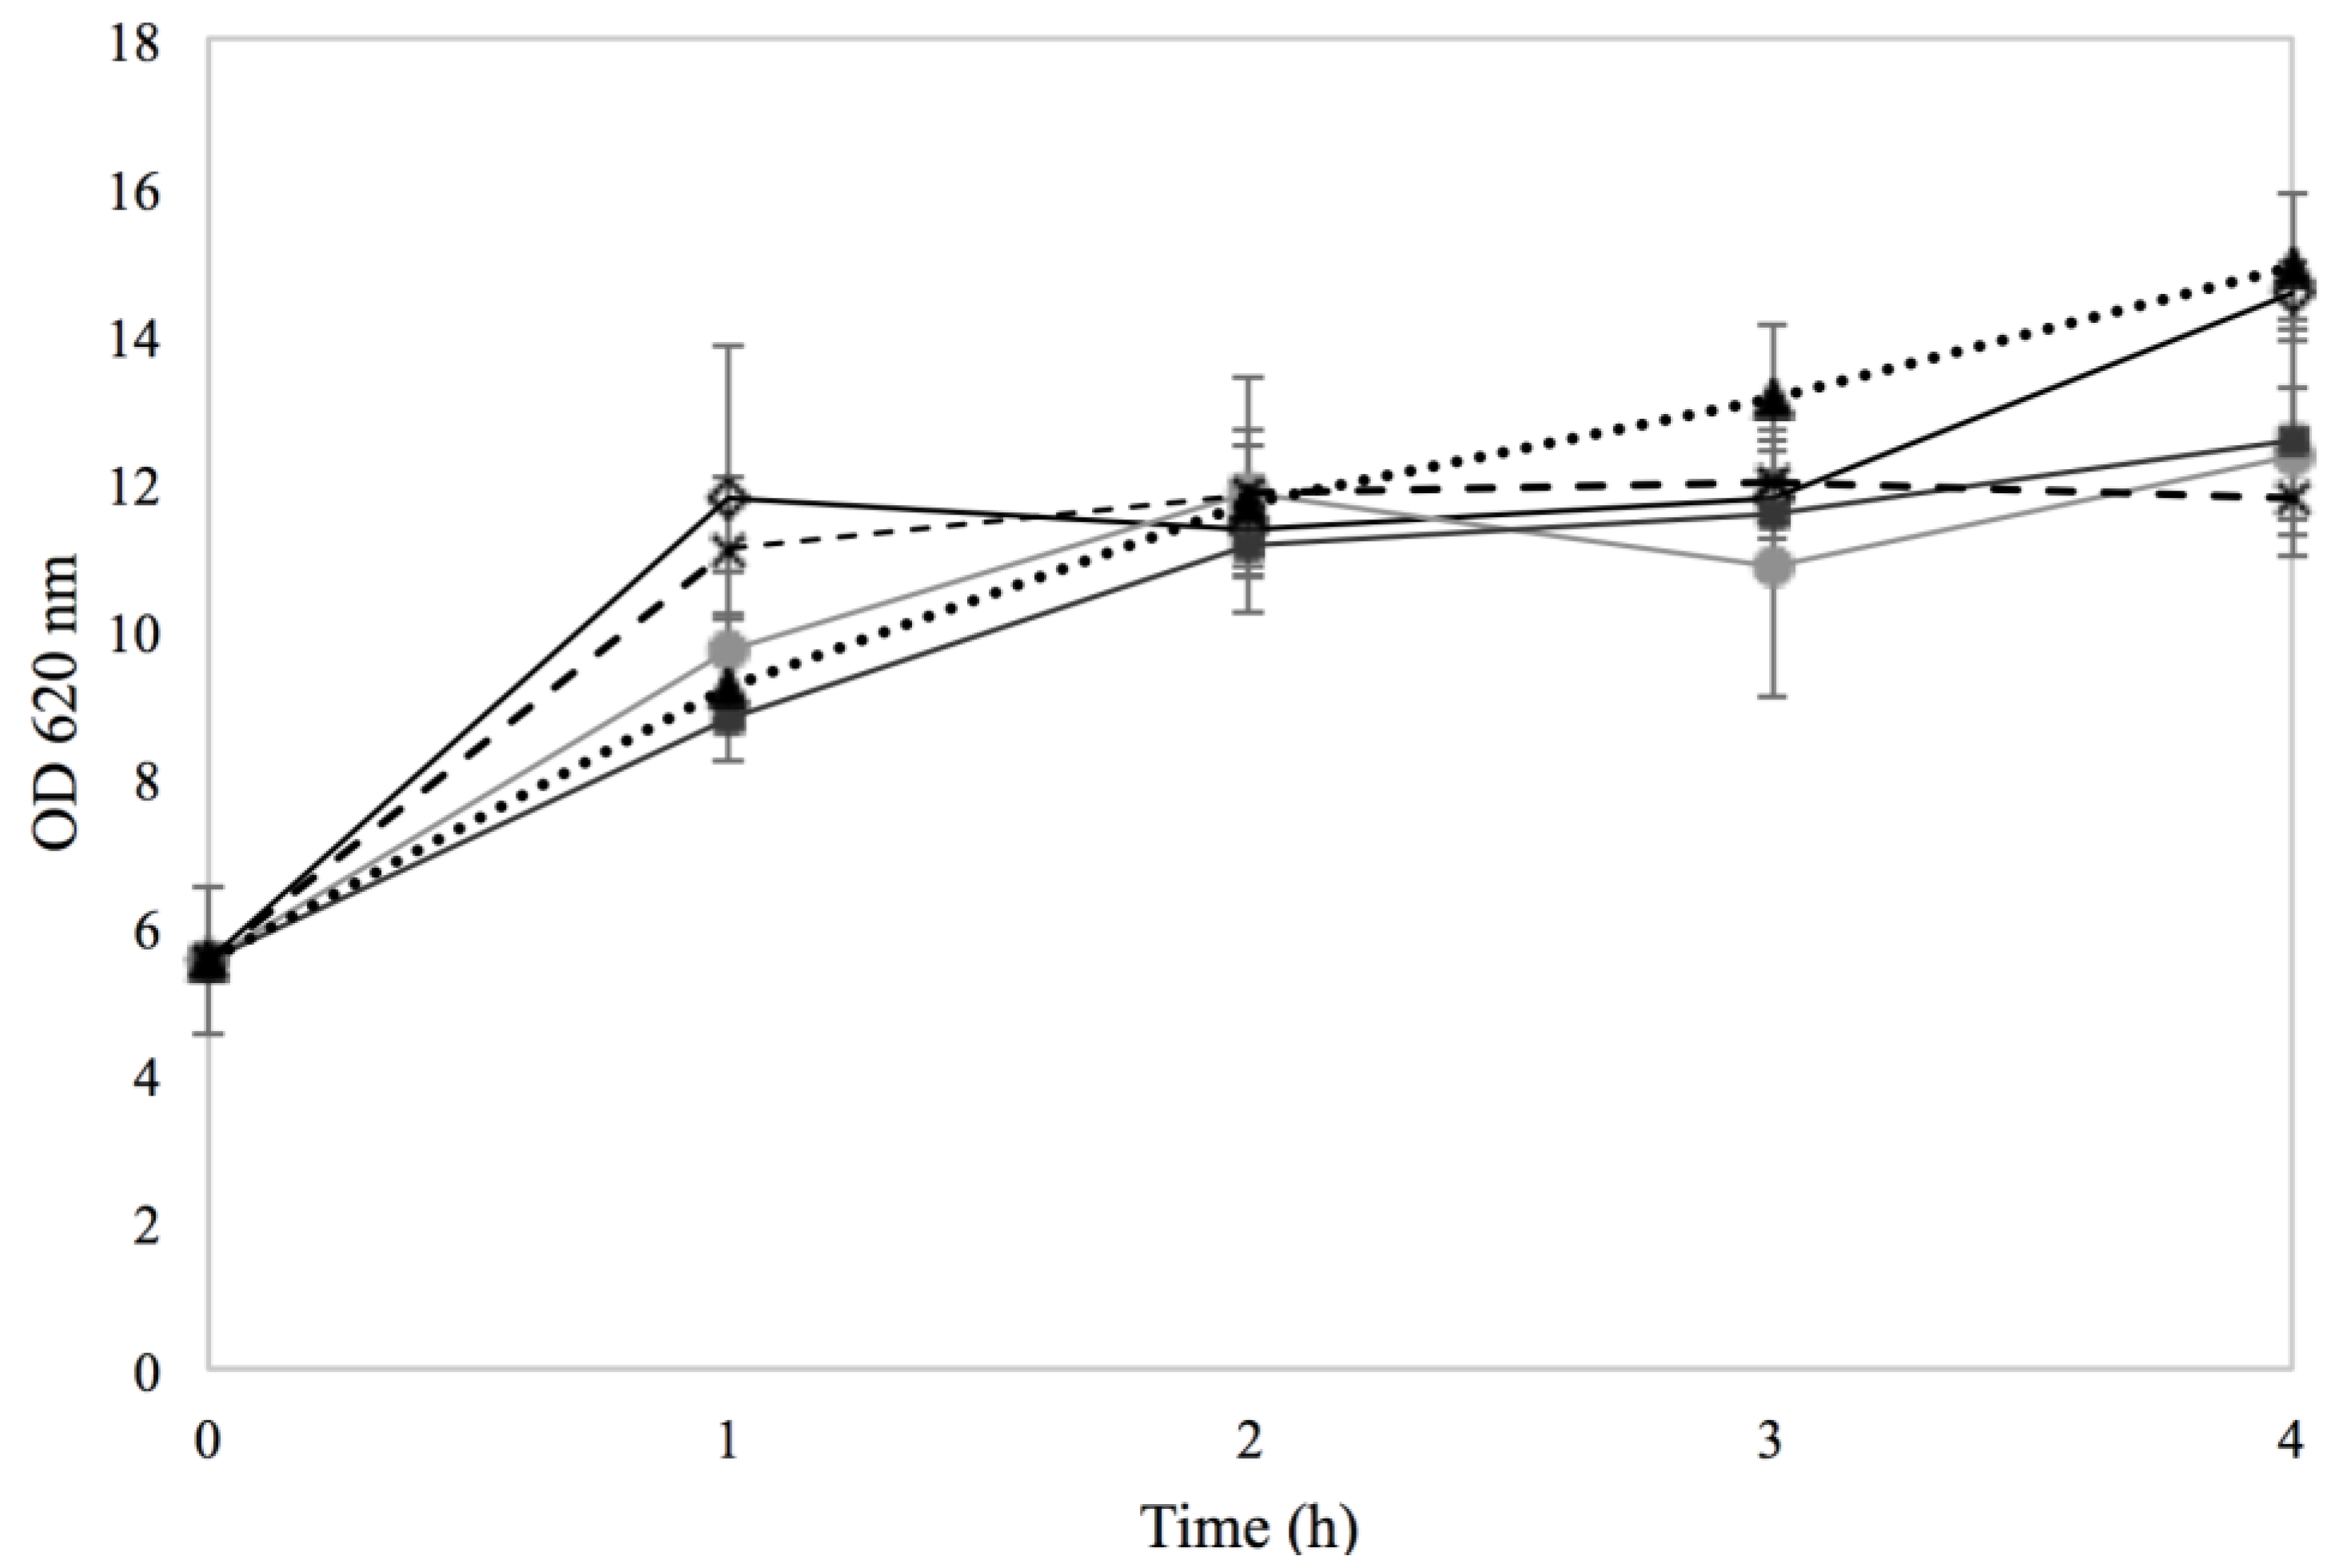
 ) and (
  ), Co–Na with (
  ) and (
  ), Na–Co with (
  ) and (×) and Na–Na with ( ) and ( ).
) and ( ), Co–Na with ( ) and ( ), Na–Co with ( ) and (×) and Na–Na with ( ) and ( ).
) and (×) and Na–Na with ( ) and ( ).
) and ( ), Co–Na with ( ) and ( ), Na–Co with ( ) and (×) and Na–Na with ( ) and ( ). ), Na–Co ( ) and Na–Na ( ).
), Na–Co ( ) and Na–Na ( ).
), Na–Co ( ) and Na–Na ( ).
4. Conclusions
Acknowledgments
Author Contributions
Conflicts of Interest
References
- Hennekinne, J.A.; de Buyser, M.L.; Dragacci, S. Staphylococcus aureus and its food poisoning toxins: Characterization and outbreak investigation. FEMS Microbiol. Rev. 2012, 36, 815–836. [Google Scholar] [CrossRef] [PubMed]
- Le Loir, Y.; Baron, F.; Gautier, M. Staphylococcus aureus and food poisoning. Genet. Mol. Res. 2003, 2, 63–76. [Google Scholar] [PubMed]
- European Food Safety Authority. European Centre for Disease Prevention and Control The European Union summary report on trends and sources of zoonoses, zoonotic agents and foodborne outbreaks in 2012. EFSA J. 2014. [Google Scholar] [CrossRef]
- Scallan, E.; Griffin, P.M.; Angulo, F.J.; Tauxe, R.V.; Hoekstra, R.M. Foodborne illness acquired in the USA—Unspecified agents. Emerg. Infect. Dis. 2011, 17, 16–22. [Google Scholar] [CrossRef] [PubMed]
- Adams, M.R.; Moss, M.O. Food Microbiology, 3rd ed.; RSC Publishing: Cambridge, UK, 2008; pp. 252–256. [Google Scholar]
- Schelin, J.; Wallin-Carlquist, N.; Cohn, M.; Lindqvist, R.; Rådström, P. The formation of Staphylococcus aureus enterotoxin in food environments and advances in risk assessment. Virulence 2011, 2, 580–592. [Google Scholar] [CrossRef] [PubMed]
- Fleurot, I.; Aigle, M.; Fleurot, R.; Darrigo, C.; Hennekinne, J.A.; Gruss, A.; Borezée-Durant, E.; Delacroix-Buchet, A. Following pathogen development and gene expression in a food ecosystem: The case of a Staphylococcus aureus isolate in cheese. Appl. Environ. Microbiol. 2014, 80, 5106–5115. [Google Scholar] [CrossRef]
- Fetsch, A.; Contzen, M.; Hartelt, K.; Kleiser, A.; Maassen, S.; Rau, J.; Kraushaar, B.; Layer, F.; Strommenger, B. Staphylococcus aureus food-poisoning outbreak associated with the consumption of ice-cream. Int. J. Food Microbiol. 2014, 187, 1–6. [Google Scholar] [CrossRef] [PubMed]
- Asao, T.; Kumeda, Y.; Kawai, T.; Shibata, T.; Oda, H.; Haruki, K.; Nakazawa, H.; Kozaki, S. An extensive outbreak of staphylococcal food poisoning due to low-fat milk in Japan: Estimation of enterotoxin a in the incriminated milk and powdered skim milk. Epidemiol. Infect. 2003, 130, 33–40. [Google Scholar] [PubMed]
- Sospedra, I.; Soriano, J.M.; Manes, J. Enterotoxinomics: The omic sciences in the study of staphylococcal toxins analyzed in food matrices. Food Res. Int. 2013, 54, 1052–1060. [Google Scholar] [CrossRef]
- Pinchuk, I.V.; Beswick, E.J.; Reyes, V.E. Staphylococcal enterotoxins. Toxins 2010, 2, 2177–2197. [Google Scholar] [CrossRef] [PubMed]
- Borst, D.W.; Betley, M.J. Phage-associated differences in staphylococcal enterotoxin A gene (sea) expression correlate with sea allele class. Infect. Immun. 1994, 62, 113–118. [Google Scholar] [PubMed]
- Sumby, P.; Waldor, M.K. Transcription of the toxin genes present within the staphylococcal phage phiSa3ms is intimately linked with the phage’s life cycle. J. Bacteriol. 2003, 185, 6841–6851. [Google Scholar] [CrossRef] [PubMed]
- Cao, R.; Zeaki, N.; Wallin-Carlquist, N.; Skandamis, P.; Schelin, J.; Rådström, P. Elevated enterotoxin a expression and formation in Staphylococcus aureus and its association with prophage induction. Appl. Environ. Microbiol. 2012, 78, 4942–4948. [Google Scholar] [PubMed]
- Abee, T.; Wouters, J.A. Microbial stress response in minimal processing. Int. J. Food Microbiol. 1999, 50, 65–91. [Google Scholar] [CrossRef]
- Van der Veen, S.; Abee, T. Bacterial SOS response: A food safety perspective. Curr. Opin. Biotechnol. 2011, 22, 136–142. [Google Scholar] [CrossRef] [PubMed]
- Archer, D.L. Preservation microbiology and safety: Evidence that stress enhances virulence and triggers adaptive mutations. Trends Food Sci. Technol. 1996, 7, 91–95. [Google Scholar] [CrossRef]
- Hill, C.; Cotter, P.D.; Sleator, R.D.; Gahan, C.G.M. Bacterial stress response in Listeria monocytogenes: Jumping the hurdles imposed by minimal processing. Int. Dairy J. 2002, 12, 273–283. [Google Scholar] [CrossRef]
- Rodriguez-Caturla, M.Y.; Valero Diaz, A.; Vallejo, J.L.; Garcia-Gimeno, R.M.; Cosano, G.Z. Effect of pre-incubation conditions on growth and survival of Staphylococcus aureus in sliced cooked chicken breast. Meat Sci. 2012, 92, 409–416. [Google Scholar] [CrossRef] [PubMed]
- Cebrián, G.; Sagarzazu, N.; Pagán, R.; Condón, S.; Mañas, P. Development of stress resistance in Staphylococcus aureus after exposure to sublethal environmental conditions. Int. J. Food Microbiol. 2010, 140, 26–33. [Google Scholar] [CrossRef] [PubMed]
- Pfaffl, M.W. A new mathematical model for relative quantification in real-time RT-PCR. Nucleic Acids Res. 2001, 29. [Google Scholar] [CrossRef]
- Lövenklev, M.; Holst, E.; Borch, E.; Rådström, P. Relative neurotoxin gene expression in Clostridium botulinum type B, determined using quantitative reverse transcription-PCR. Appl. Environ. Microbiol. 2004, 70, 2919–2927. [Google Scholar] [CrossRef] [PubMed]
- Wallin-Carlquist, N.; Cao, R.; Marta, D.; da Silva, A.S.; Schelin, J.; Rådström, P. Acetic acid increases the phage-encoded enterotoxin A expression in Staphylococcus aureus. BMC Microbiol. 2010, 10, 147. [Google Scholar] [CrossRef] [PubMed]
- Harris, S.M.; Yue, W.F.; Olsen, S.A.; Hu, J.; Means, W.J.; McCormick, R.J.; Du, M.; Zhu, M.J. Salt at concentrations relevant to meat processing enhances shiga toxin 2 production in Escherichia coli O157:H7. Int. J. Food Microbiol. 2012, 159, 186–192. [Google Scholar] [CrossRef] [PubMed]
- Weinrick, B.; Dunman, P.M.; McAleese, F.; Murphy, E.; Projan, S.J.; Fang, Y.; Novick, R.P. Effect of mild acid on gene expression in Staphylococcus aureus. J. Bacteriol. 2004, 186, 8407–8423. [Google Scholar] [CrossRef] [PubMed]
- Davis, M.J.; Coote, P.J.; O’Byrne, C.P. Acid tolerance in Listeria monocytogenes: The adaptive acid tolerance response (ATR) and growth-phase-dependent acid resistance. Microbiology 1996, 142, 2975–2982. [Google Scholar] [CrossRef] [PubMed]
- Csonka, L.N. Physiological and genetic responses of bacteria to osmotic stress. Microbiol. Rev. 1989, 53, 121–147. [Google Scholar] [PubMed]
- Graham, J.E.; Wilkinson, B.J. Staphylococcus aureus osmoregulation: Roles for choline, glycine betaine, proline, and taurine. J. Bacteriol. 1992, 174, 2711–2716. [Google Scholar] [PubMed]
- Onoue, Y.; Mori, M. Amino acid requirements for the growth and enterotoxin production by Staphylococcus aureus in chemically defined media. Int. J. Food Microbiol. 1997, 36, 77–82. [Google Scholar] [CrossRef]
© 2015 by the authors; licensee MDPI, Basel, Switzerland. This article is an open access article distributed under the terms and conditions of the Creative Commons Attribution license (http://creativecommons.org/licenses/by/4.0/).
Share and Cite
Zeaki, N.; Rådström, P.; Schelin, J. Evaluation of Potential Effects of NaCl and Sorbic Acid on Staphylococcal Enterotoxin A Formation. Microorganisms 2015, 3, 551-566. https://doi.org/10.3390/microorganisms3030551
Zeaki N, Rådström P, Schelin J. Evaluation of Potential Effects of NaCl and Sorbic Acid on Staphylococcal Enterotoxin A Formation. Microorganisms. 2015; 3(3):551-566. https://doi.org/10.3390/microorganisms3030551
Chicago/Turabian StyleZeaki, Nikoleta, Peter Rådström, and Jenny Schelin. 2015. "Evaluation of Potential Effects of NaCl and Sorbic Acid on Staphylococcal Enterotoxin A Formation" Microorganisms 3, no. 3: 551-566. https://doi.org/10.3390/microorganisms3030551
APA StyleZeaki, N., Rådström, P., & Schelin, J. (2015). Evaluation of Potential Effects of NaCl and Sorbic Acid on Staphylococcal Enterotoxin A Formation. Microorganisms, 3(3), 551-566. https://doi.org/10.3390/microorganisms3030551