Abstract
The gut microbiota plays a pivotal role in host health. Dietary components such as waxy maize starch (WMS) and malate-debranched WMS (MADBS) may serve as modulators of microbial composition and function. In this study, the effects of WMS and MADBS on murine gut microbiota in vivo and human fecal in vitro fermentation were investigated. The results of gut microbiota in mice revealed that WMS increased the abundance of Muribaculaceae and Bifidobacterium, while MADBS enriched Ileibacterium, Muribaculaceae, and Dubosiella. The in vitro fermentation model demonstrated that WMS increased the abundance of Bifidobacterium, Lactobacillus, Megamonas, and Megasphaera, whereas MADBS enhanced Weissella, Lactobacillus, and Prevotella. Both compounds decreased the levels of Escherichia-Shigella. Metabolically, compared to the control group, WMS improved the production of acetic, propionic, butyric, and valproic acids, while MADBS decreased the concentrations of all short-chain fatty acids (SCFAs). Compared to the control group, WMS reduced the production of CH4, NH3, and H2S while increasing CO2 yield. MADBS reduced the generation of CH4, NH3, H2S, and CO2. These findings suggest that WMS and MADBS can modulate the gut ecosystem by selectively promoting probiotics, inhibiting pathogens, and altering metabolic profiles.
1. Introduction
Starch is a renewable and biodegradable plant resource. The processing of food, cosmetics, and feed extensively utilizes starch and its derived compounds. Corn starch accounts for a high proportion of the global starch market. Waxy maize starch (WMS) exhibits significantly different physical and chemical properties compared with ordinary corn starch, including paste stability, transparency, and retrogradation tendency [1]. However, there are certain drawbacks to using natural waxy corn starch, such as heat resistance, acidity, and shear resistance, including its susceptibility to aging and retrogradation. It is unable to satisfy the processing and storage requirements of certain products due to these limitations [2]. Furthermore, starch is the most important carbohydrate and the main energy source in human life. However, long-term consumption of starchy products is associated with various chronic diseases [3]. Therefore, researchers have attempted to modify natural starch through different methods to improve its properties [4,5].
Debranching is a common technique for starch modification. Numerous novel qualities are possessed by debranched starch, including excellent hydrogel characteristics [6], barrier properties [7], and good mobility [8]. The unique properties allow for its use in coating and the controlled release of pharmaceuticals. In earlier research, we prepared malate-debranched WMS (MADBS) through debranching and malate esterification, which demonstrated a greater degree of substitution (DS), a higher content of resistant starch (RS) with more amorphous regions, and molecular aggregation [9]. MADBS exhibits a significantly increased RS content compared to native and singly modified starches due to its enhanced resistance to enzymatic hydrolysis. MADBS also shows superior resistance to thermal processing, acid conditions, and mechanical shear, making it more stable and suitable for industrial food applications. Due to the waxy maize origin, MADBS retains a soft texture and favorable mouthfeel, unlike high-amylose RS, which often yields firmer, less palatable textures. These unique features support the novelty and functional superiority of MADBS over conventional resistant starches.
MADBS represents a newly developed form of resistant starch, pioneered by our research team, with no existing studies evaluating its efficacy. The potential of its novel structure to impart superior or unique prebiotic functions remains uncertain, particularly in terms of modulating specific bacterial taxa such as Bifidobacterium and Lactobacillus, and reducing harmful metabolites like ammonia or certain short-chain fatty acids (SCFAs). To assess whether MADBS enhances the abundance of beneficial bacteria and promotes the production of advantageous SCFAs, we employed an in vitro fermentation model to compare the effects of MADBS with those of wheat maize starch (WMS) on microbial composition and metabolomic profiles. The in vitro fermentation bioassay is a well-established methodology for assessing the impact of dietary components on gut microbiota, offering a valuable alternative to in vivo studies and facilitating the exploration of interactions between gut microbiota and dietary substrates. Comprehensive analyses were conducted on changes in gut microbiota, gas production, and SCFA levels. Additionally, the effects of WMS and MADBS on the intestinal microbiota of mice were investigated. The primary aim of this study was to provide insights into the application and potential benefits of MADBS.
2. Experimental Section
2.1. Fermentation Medium
WMS and malate MADBS were prepared according to the previously published method [9]. The anaerobic yeast extract–casein hydrolysate–fatty acid (YCFA) medium served as the fermentation medium for control [10]. The YCFA medium contains tryptone (1%), yeast extract (0.25%), L-cysteine (0.1%), heme solution (0.01%), NaCl (0.09%), KH2PO4 (0.045%), K2HPO4 (0.045%), MgSO4·7H2O (0.09%), CaCl2·6H2O (0.006%), vitamin I solution (200 µL), resazurin solution (1.0 mL), and pH 6.5. Instead, 8 g/L of WMS or MADBS was used in the respective cultures. Due to their limited solubility, WMS and MADBS were added to the medium prior to autoclaving. The autoclaved mixtures were then incubated in an anaerobic workstation for 24 h. The medium was autoclaved for 20 min at 121 °C.
2.2. Collection of Human Fecal Samples
This study included nine healthy adults aged between 23 and 43. All donors had a normal diet and had not taken any medications for the last four months before sample collection. Nine healthy adult donors provided fecal samples following a standardized protocol. Donors were instructed to collect fresh samples in sterile containers, which were immediately transported to the laboratory and processed to make the bacteria suspension within 1 h to minimize microbial community changes. Each sample (1.0 g) was resuspended separately in 10 mL PBS buffer (phosphate-buffered saline, pH 7.0), and the fecal slurry was filtered through 200 mesh filter to remove debris. Samples from each donor were pooled and were injected into the fermentation bottle. The experiment complied with all the ethical requirements. Ethical approval for this study was granted by the Ethics Committee of the Zhejiang Academy of Agricultural Sciences (approval code: ZAASES [2024]01, and approval date: 25 November 2024).
2.3. In Vitro Fermentation
The fecal suspensions were inoculated into YCFA, WMS, and MADBS media. In vitro fermentation was performed at 37 °C for 24 h. In addition, 8 mg/mL of WMS and MADBS was used for the in vitro fermentation procedure. The concentration was selected in in vitro experiments based on our previous dose-gradient studies with other prebiotics. This concentration represented the maximum tolerable dose. In the anaerobic chamber, 500 μL of freshly prepared fecal suspension inoculum was introduced into a 15 mL anaerobic bottle containing 5.0 mL of YCFA medium or control medium, respectively, using sterile disposable syringes. Fermentation was carried out at 37 °C for 24 h. All experiments were performed in triplicate to ensure reproducibility. Throughout the fermentation process, oxygen was excluded, and the pH of the YCFA medium was maintained at 6.5. All fermentations were performed under static anaerobic conditions, with the anaerobic headspace maintained by pure nitrogen gas.
2.4. Determination of Gas Composition
After a 24 h fermentation period, the butyl rubber stopper was punctured inside a biological safety cabinet using a sterile syringe needle. As described in the literature, the gas generated during fermentation inside the vial was then introduced into the gas analyzer (Empaer gas detector, Shenzhen, China), which could measure the content of five gases simultaneously through the principle and working of a sensor. The infrared detector was used to determine methane (CH4) and carbon dioxide (CO2), while ammonia (NH3), hydrogen (H2) and hydrogen sulfide (H2S) were monitored using electrochemical sensors. A needle-tipped gas-impermeable syringe was inserted into the rubber cap of each vessel to measure the concentration of each gas produced after being incubated at 37 °C for 24 h. The results were expressed in liters of gas.
2.5. Short-Chain Fatty Acid (SCFA) Quantification
A solution of crotonic acid (0.6464 g) in 2.5% (w/v) metaphosphoric acid (100 mL) was prepared. Then, 0.5 mL of fermentation broth was added to 0.1 mL of crotonic acid metaphosphoric acid, and the solution was acidified for more than 24 h at −20 °C before being subjected to gas chromatography (GC) analysis. The fermentation broth was centrifuged at 13,000 rpm for 3 min, and the supernatant was filtered for the detection of the SCFA concentration. The concentrations of SCFAs were determined using GC (Shimadzu, GC-2010 Plus, Kyoto, Japan). GC analysis was carried out using a 0.32 mm × 30 m × 0.5 µm DB-FFAP column (Agilent Technologies, Santa Clara, CA, USA). Trans-2-butenoic acid was used as an internal standard.
The GC operating conditions were as follows: high-purity nitrogen carrier gas was maintained at a flow rate of 12 mL/min. The detector gas mixture comprised nitrogen (30 mL/min), hydrogen (40 mL/min), and air (400 mL/min). The temperature program initiated with a 70 °C isothermal hold for 30 s, followed by ramping to 190 °C, and subsequently increasing to 240 °C at 40 °C/min (5 min hold). The FID detector and vaporization chamber were maintained at 250 °C and 280 °C, respectively.
2.6. Analysis of Intestinal Flora
Genomic DNA extracted from fecal samples (FastPure Stool DNA Isolation Kit, MJYH, Shanghai, China) was assessed for purity using a NanoDrop 2000 spectrophotometer (Thermo Scientific, Wilmington, DE, USA). The 16S rRNA gene was amplified with primer pairs 338F (5′-ACTCCTACGGGAGGCAGCAG-3′) and 806R (5′-GGACTACHVGGG- TWTCTAAT-3′). Purified amplicons were pooled in equimolar amounts, and paired-end sequencing was performed on an Illumina NextSeq2000 platform (Illumina, San Diego, CA, USA) according to the standard protocols by Majorbio Bio-Pharm Technology Co., Ltd. (Shanghai, China). The raw sequencing reads were deposited into the sequence read archive database of National Center for Biotechnology Information. Processing of raw sequencing data involved de-multiplexing (in-house Perl script), quality filtering (fastp v0.19.6 [11]), and merging (FLASH v1.2.7 [12]). Then, the optimized sequences were clustered into operational taxonomic units (OTUs) using UPARSE (version 7.1) [13,14]. Representative sequences for each OTU were defined by selecting the most abundant sequence.
Selection of the representative read for each OTU was performed utilizing the QIIME ackage (version 1.9). With a confidence threshold of 0.7, OTUs were taxonomically annotated using the RDP Classifier and the SILVA database (v138) as a reference. The community structure of bacteria was analyzed at the genus and phylum levels based on the taxonomic information. Alpha diversity was calculated based on observed OTU, and the Chao index. Principal component analysis (PCA) and principal co-ordinates analysis (PCoA) were performed to compare the similarities and differences in microbial communities among the CK, WCS, and MADBS groups. Alpha diversity comparisons among the three groups were performed using between-group difference testing of the Chao1 index, analyzed by one-way ANOVA. R (version 3.3.1) was used for statistical analysis and graphing.
2.7. Animal Experiment Design
A total of 30 C57BL/6 healthy male mice (8 weeks old) were purchased from Hangzhou Ziyuan Laboratory Animal Technology Co., Ltd., Hangzhou, China, and then randomly divided into three groups: a control group (CK), a WMS group receiving 40 mg per day, and a MADBS group receiving 40 mg per day. Each group contained 10 mice. The animals were randomly allocated to cages across a room to account for spatial variability. Each mouse was placed separately in a sterile animal chamber, maintaining the room temperature at approximately 20 °C and the relative humidity between 45% and 55%. The mice were fed individually in their own cages. All the groups were administered for 14 days and underwent the same experimental procedure with a regular diet. The fresh fecal samples were collected immediately after defecation to analyze intestinal flora. The mice were euthanized by cervical dislocation after being anesthetized with isoflurane. For the gut microbiota analysis, 5 mice in the CK group and 8 mice in the treatment group were included in the analysis. Due to the difficulty in dissolving WCS and MADBS, during the initial gavage procedure, 9 mice experienced pulmonary aspiration and died. Consequently, 5 mice from the CK group were reassigned to the treatment groups to compensate for the loss. The Zhejiang Academy of Agricultural Sciences’ Ethics Committee approved this research (No. 2024ZAASLA111).
2.8. Correlation Analysis of Metabolite Factors and Gut Microbiota
Correlation heatmaps were generated based on correlation coefficients between the gut microbiota and both gases and SCFAs. The numerical matrix was presented through a heatmap. The color gradient in the heatmap reflects the data information in the two-dimensional matrix or table, with color intensity representing the magnitude of data values, thereby providing an intuitive visualization where numerical values are represented by defined color shades. The analysis was conducted using R software (version 3.3.1) with the pheatmap package (version 1.0.12).
2.9. Statistical Analysis
Statistical analysis was performed using GraphPad Prism software (version 9.5). Statistical differences were determined by conducting either a paired t-test or ANOVA. Data are presented as mean ± SD. The variable importance in projection (VIP) in OPLS-DA (VIP > 1) and the p-value (p < 0.05) were further used to identify significant differential metabolites.
3. Results
3.1. Effects of WMS and MADBS on SCFA Production
WMS and MADBS in human fecal samples were fermented to produce SCFAs (Figure 1, Supplementary Materials Table S1). Acetic, propionic, butyric, and valproic acid concentrations were notably higher in the WMS group than in the CK group (Figure 1). Among the three groups, the MADBS group had the lowest SCFA levels.
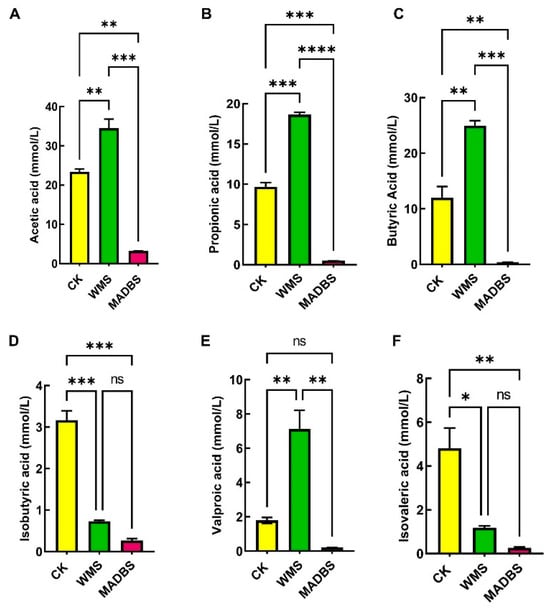
Figure 1.
In vitro fermentation results in the SCFA content in the fermentation broth. (A) Acetic acid, (B) propionic acid, (C) butyric acid, (D) isobutyric acid, (E) valeric acid, and (F) isovaleric acid. * p < 0.05, ** p < 0.01, *** p < 0.001, and **** p < 0.0001. ns: not significant.
3.2. Analysis of the Content of Gas Component
After 24 h of in vitro human fecal fermentation, gas component analysis revealed that the CK group exhibited higher levels of CH4, NH3, H2, and H2S than the WMS and MADBS groups. However, the WMS group had the highest level of CO2 level of the three groups. Additionally, the MADBS group significantly reduced the generation of CH4, NH3, H2S, and CO2 compared to the WMS and YCFA groups (Figure 2, Supplementary Materials Table S2). This suggests that MADBS and WMS have the potential to regulate gas production.
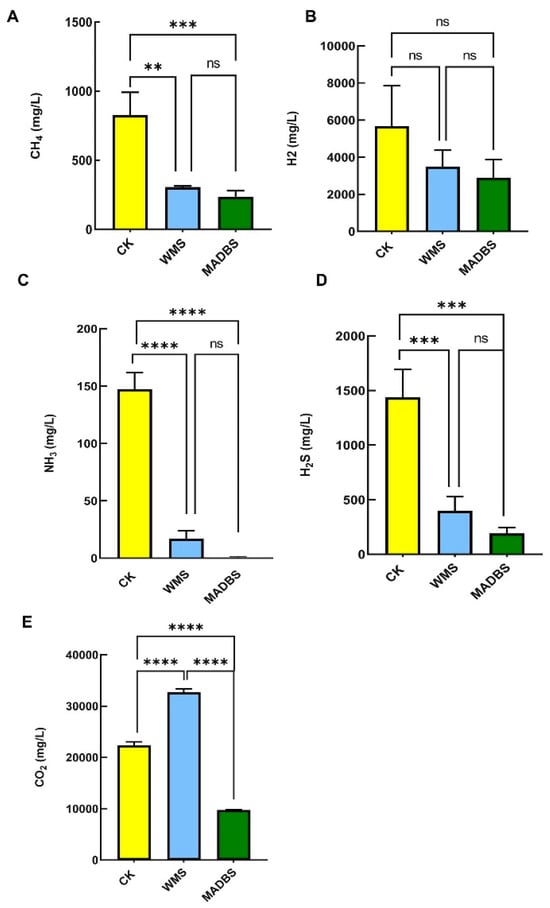
Figure 2.
Gas changes after in vitro human fecal fermentation. (A) CH4, (B) H2, (C) NH3, (D) H2S, and (E) CO2. ** p < 0.01, *** p < 0.001 and **** p < 0.0001. ns: not significant.
3.3. Impact of WMS and MADBS on Human Gut Microbiota by In Vitro Fermentation
To investigate the impact of WMS and MADBS on human gut microbiota structure, we analyzed the microbial composition of fecal samples using in vitro fermentation. The PCA plot shows microbial community profiles of a pooled fecal sample from nine healthy donors after 24 h of fermentation under three conditions (CK, WMS, MADBS). Each condition included three technical replicates, represented by the nine points (three points per condition). The microbial composition of WMS and MADBS groups deviated from the cluster of control according to the PCA analysis (Figure 3A). WMS and MADBS treatment exerted a notable impact on the bacterial community’s beta diversity. Comparison of alpha diversity indicated that WMS and MADBS changed the gut microbial community diversity (Figure 3B).
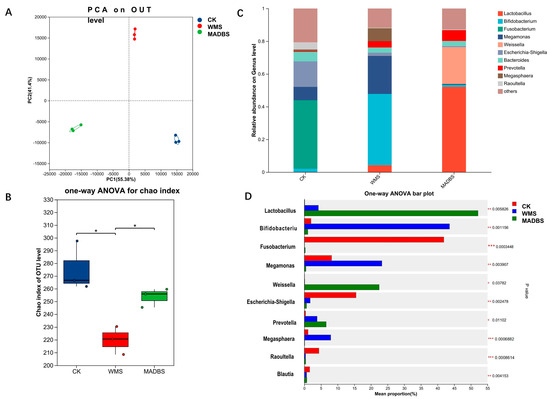
Figure 3.
The results of human gut microbiota after in vitro fecal fermentation. (A) PCA on OTU level of the gut microbial community differences between CK, WMS, and MADBS groups. (B) The difference in the Alpha Diversity index among CK, WMS, and MADBS groups. * p < 0.05. (C) Community barplot analysis on genus level. (D) Genera with significant abundance differences among CK, WMS, and MADBS samples. A one-way ANOVA was used to evaluate the significance of differences between the indicated groups. * p < 0.05; ** p < 0.01; *** p < 0.001.
Relative abundance analysis at the genus level revealed that WMS stimulated the growth of Bifidobacterium, Lactobacillus, Megamonas, and Megasphaera, whereas Escherichia-Shigella was found to be more abundant in the CK group (Figure 3C). These results suggest that WMS may modulate the gut microbiota and enhance the growth of probiotics. The results also demonstrated that the MADBS group had a significantly higher abundance of Weisslla, Lactobacillus, and Prevotella than the other two groups. However, the MADBS group had reduced levels of Fusobacterium, Escherichia-Shigella, and Megamonas.
Microbial communities showing significant differences among the three groups were statistically analyzed. The 10 dominant genera are shown in Figure 3D. The CK group was significantly enriched in Fusobacterium, Escherichia-Shigella, Raoultella, and Blautia. In contrast, the WMS group showed increased abundances of Lactobacillus, Bifidobacterium, Megamonas, and Prevotella, while the MADBS was dominated by Lactobacillus, Weisslla, and Prevotella. Table 1 summarizes the 10 statistically significant differences observed at the genus level across all three groups. A total of 54 bacterial genera showed significant differences (Supplementary Materials Table S3).

Table 1.
The impact of WMS and MADBS on the abundance of the top ten genera on humans’ in vitro fermentation.
The heatmap illustrates the distribution of the top dominant species in three groups, demonstrating the trends of species changes in the CK and treatment groups. The changes in abundance of different species were displayed using the gradient of color blocks, with the values corresponding to the color gradient. The dominant species in the MADBS group were Lactobacillus, Weissella, Lactococcus, Klebsiella, Faecalibacterium, Alloprevotella, Anaerostipes, Roseburia, and Klebsiella, while the abundance of Senegalimassilia, Bilophila, Desulfovibrio, Allisonella, Eggerthella, and Lachnospiraceae was very low when compared to the CK group (Figure 4). The dominant species in the WMS group were Lactobacillus, Bifidobacterium, Megamonas, Megasphaera, Collinsella, Mitsuokella, Catenibacterium, Streptococcus, and Prevotella. However, the abundance of Lachnospiraceae, Desulfovibrio, Fusobacterium, Bilophila, Butyricimonas, Roseburia, and Hafnia-Obesumbacterium was lower than that in the CK group.
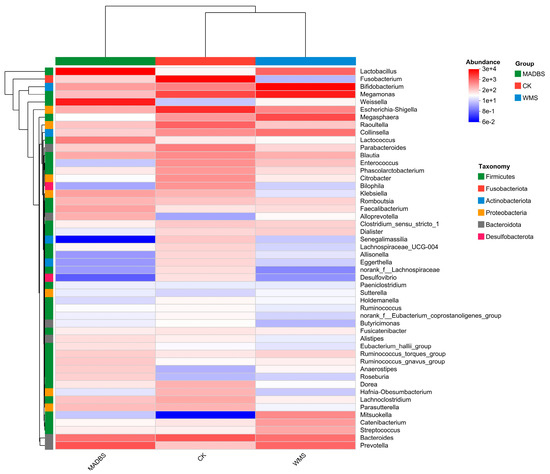
Figure 4.
Community heatmap analysis at the genus level.
3.4. Results of the Correlation Analysis of Metabolite Factors and Gut Microbiota
We investigated the association between the gut microbiome population and the production of gas and SCFA compounds. NH3, CH4, and H2S exhibited positive correlations with the high levels of Enterococcus, Bilophila, Raoultella, Phascolarctobacterium, Escherichia-Shigella, and Citrobacter. While it demonstrated a negative correlation with Lactobacillus, Prevotella, and Alloprevotella (Figure 5A), CO2 was positively correlated with the high levels of certain species, such as Megamonas, Megasphaera, Bifidobacterium, Collinsella, and Catenlbacterium.
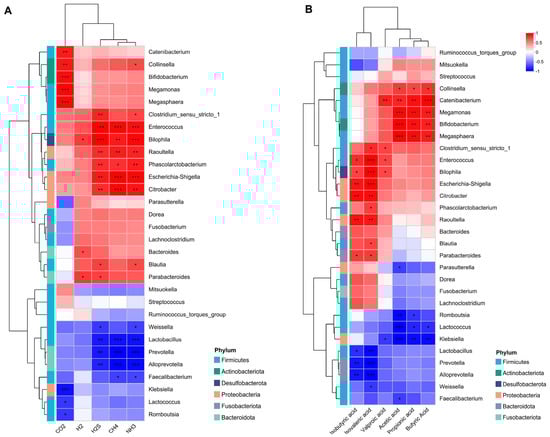
Figure 5.
Environmental factor heatmap. (A) The heatmap displays the correlation between the gut microbiota and gases. (B) The correlation between metabolite SCFA and the gut microbiota. Color depth represents the R-value magnitude (see legend for value intervals). Statistical significance is indicated as follows: * p < 0.05; ** p < 0.01; *** p < 0.001.
The isobutyric and isovaleric acids exhibited positive correlations with Enterococcus, Bilophila, Escherichia-Shigella, Citrobacter, Raoultella, and Parabacteroides and a negative correlation with the abundance of Lactobacillus, Prevotella, and Alloprevotella (Figure 5B). The contents of acetic, propionic, and butyric acids were positively correlated with the abundance of Collinsella, Catenibacterium, Megamonas Megasphaera, and Bifidobacterium. The relative abundance of Romboutsia, Lactococcus, and Klebsiella demonstrated a negative correlation with the acetic acid content. Valproic acid levels showed a positive correlation with the abundance of Catenibacterium, Enterococcus, Bilophila, and Clostridium_sensu_stricto_1.
3.5. Analysis of Gut Microbiota in Mice
The gut microbiota analysis of mice revealed that the WMS and MADBS groups differed from the CK group. Figure 6A illustrates the top 10 abundant genera with variations in abundance between the CK, WMS, and MADBS groups. Relative abundance analysis of the mouse gut microbiota at the genus level indicated that the WMS treatment promoted the abundance of norank_f_Muribaculaceae, Parasutterella and Parabacteroides while decreasing that of Allobaclum, Ileibacterium, Alistipes, norank_f_Ruminococcaceae, norank_f_Oscillospiraceae, Gordonibacter, and Dubosiella when compared to the CK group. The relative abundance of Allobaclum, Alistipes, and norank_f_Ruminococcaceae was reduced in the MADBS group. In contrast, the abundance of Ileibacterium, norank_f_Muribaculaceae, norank_f_Oscillospiraceae, Dubosiella, and Gordonibacter was significantly higher in the MADBS group than in the other two groups. PCoA analysis revealed significant differences in the community structures of the gut microbiotas among the CK, WMS, and MDB groups in mice (Figure 6B). The gut microbiota of mice in MADBS was separated from other two groups. Table 2 summarizes the top 10 statistically significant differences observed at the genus level across all three groups. Thirty bacterial genera showed significant differences among the three groups (Supplementary Materials Table S4).
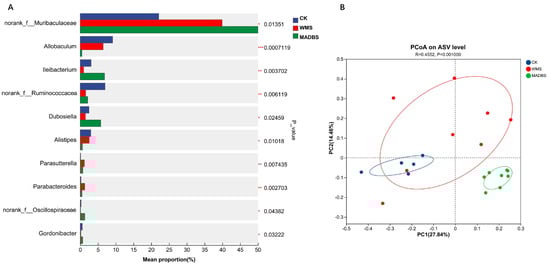
Figure 6.
Results of gut microbiota in mice. (A) The top 10 abundant genera in the CK, WMS, and MADBS groups. The vertical axis represents the genus names at various classification levels, and the horizontal axis represents the abundance percentage of the samples. * p < 0.05, ** p < 0.01, *** p < 0.001. (B) PCoA plot of microbial communities (mice, n = 5 for CK; n = 8 for WMS and MADMS).
Table 2.
The impact of WMS and MADBS on the abundance of the top ten genera in mice.
4. Discussion
Debranched starch (DBS) is primarily composed of linear starch molecules formed by the debranching of WMS, while MADBS is produced through the esterification reaction between MA (malic acid) and the hydroxyl groups at the C2, C3, and C6 positions of the glucose units in DBS. MADBS exhibited a higher degree of substitution (DS) and a greater content of resistant starch (RS) [9]. This was accompanied by an increase in amorphous regions and molecular aggregation. WMS and MADBS can be degraded into small molecular substances by intestinal microorganisms through anaerobic fermentation, including SCFA and gas. SCFAs serve as a link between the host and the gut microbiota. SCFAs play a crucial role in maintaining the normal function and morphology of the large intestine [15]. By lowering the intestinal pH, they effectively prevent the growth of pathogenic bacteria [16]. In vitro fermentation results revealed that the WMS group yielded significantly higher concentrations of acetic, propionic, butyric, and valproic acids than the CK group, whereas the MADBS group produced the lowest overall SCFA levels. The brain absorbs acetic acid, which diminishes appetite and alleviates intestinal inflammation [17]. Butyric acid can attenuate intestinal inflammation and delay the progression of chronic kidney disease [18,19]. Propionic acid exerts antibacterial effects by increasing the secretion of antimicrobial peptides within the host organism [20]. According to research, valproic acid is an anticonvulsant drug, which, along with other SCFAs, exerts inhibitory effects on cancer cell proliferation by modulating various signaling pathways [21].
The decrease in SCFA production may be attributed to ineffective microbial fermentation of MADBS. One potential explanation is that MABDS is difficult to use effectively due to its complex structure and limited microbial metabolic capacity. Our data suggest that MADBS may suppress the proliferation of SCFA-producing microbial populations, leading to decreased SCFA production. The decrease in SCFAs in the MADBS group was associated with reduced relative abundance of Butyricimonas and Clostridium (Figure 4), both of which are producers of SCFAs. The abundance of Lactobacilli increased, but these strains may lack a complete SCFAs synthesis pathway, leading to insufficient final product formation. The relationship between gut microbiota and SCFAs production involves intricate mechanisms that warrant further comprehensive study. Slowly fermentable substances (such as β-glucan) can form a gel-like matrix in the intestine, which lowers blood sugar and serum lipid levels [22]. Furthermore, hard-to-ferment foods can retain water, promote intestinal peristalsis, and alleviate constipation [23]. Prebiotics with rapid fermentation characteristics, such as fructooligosaccharides, tend to induce excessive flatulence and intestinal bloating [24], whereas slowly fermenting foods may exhibit a reduced propensity to cause gastrointestinal discomfort. The gas analysis results further confirmed our hypothesis, demonstrating that MADBS significantly reduced gas production (Figure 2).
Gas analysis revealed that the WMS and MADBS groups exhibited lower levels of CH4, NH3, and H2S. This effect was more notable in the case of MADBS. Figure 5A demonstrates that the CH4 and H2S levels showed positively correlations with the high abundances of Bilophila, Raoultella, and Escherichia-Shigella, all of which showed reduced abundance in the MADBS group. Conversely, these gases exhibited negative correlations with Lactobacillus, Prevotella, and Alloprevotella, all of which were more enriched in the MADBS group. The abundances of H2S-producing bacteria such as Bilophila and Desulfovibrio were decreased in the MADBS group compared to other groups (Figure 4). These shifts in microbial composition were associated with reduced gas production. Although H2S is an important biological mediator, its high concentrations can be potentially toxic to tissues and may contribute to colon cancer and inflammation [25,26]. Furthermore, CH4 may play a critical role in cardiovascular health, conditions that are often associated with the onset of diabetes and obesity [27,28].
Given the crucial role of the gut microbiota in human health and disease, its composition and abundance are subject to dietary influence. Certain foods can promote the growth of beneficial gut microbes, thereby improving the intestinal environment [15]. Microbial communities in fecal samples and their metabolic changes are frequently studied by in vitro fermentation experiments [29]. The effects of WMS and MADBS on the human gut microbiota were evaluated by an in vitro fermentation model. The results showed that WMS promoted the proliferation of intestinal Bifidobacteria and Lactobacillus, two known beneficial bacteria. Bifidobacteria, a key probiotic in the human intestine, are essential for protecting the gut from pathogenic infections [30]. WMS and MADBS significantly reduced the abundance of Escherichia-Shigella, the leading cause of human bacillary dysentery [31]. The results demonstrated that WMS significantly promotes the proliferation of probiotics while concurrently suppressing the growth of pathogenic bacteria.
The findings also demonstrated that the MADBS group exhibited a significantly higher abundance of Weissella, Lactobacillus, and Prevotella than the other two groups. Weissella species, as members of the lactic acid bacteria group, demonstrate pathogen inhibitory activity and probiotic potential [32]. Furthermore, this genus demonstrated promising therapeutic effects for atopic dermatitis and certain cancers [33,34]. Prevotella is one of the predominant fiber degrading bacteria in the intestine [35]. Previous studies indicated that Prevotella can be markedly increased by the consumption of resistant starch [36,37]. Similarly, the abundance of Prevotella was significantly increased by MADBS treatment. The MADBS group showed a decreased abundance of Fusobacterium, Escherichia-Shigella, and Megamonas. Studies indicated an association between Megamonas and non-alcoholic fatty liver disease in children and adolescents [38] since Megamonas can enhance lipid absorption and obesity [39]. Additionally, prior research has revealed that Fusobacterium nucleatum infection is frequently detected in human colorectal cancer and promotes colorectal carcinogenesis [40,41]. Patients with ulcerative colitis have Fusobacterium varium bacteria [42]. MADBS significantly increases the abundance of beneficial gut microbiota while suppressing pathogenic bacterial populations. Therefore, MADBS may represent a potential dietary strategy for gut microbiota modulation. However, translating these findings into clinical and commercial applications will require further research.
The effects of WMS and MADBS on the intestinal microbiota of mice were investigated in this study using mouse models. A species composition analysis of the mouse gut microbiota after WMS treatment revealed a significant rise in the population of Muribaculaceae and Bifidobacterium. Muribaculaceae is a potential probiotic bacterial family that produces SCFAs via mucin glycans and dietary fibers [43]. Muribaculaceae can alleviate type 2 diabetes, obesity, and inflammatory bowel disease [44,45,46]. MADBS increased the abundance of intestinal beneficial bacteria, such as Ileibacterium [47], Muribaculaceae, and Dubosiella. Dubosiella newyorkensis can modulate immune tolerance in colitis [48]. The results demonstrated that WMS and MADBS significantly enhance the abundance of beneficial gut microbiota in mice.
This study utilized an in vitro fecal fermentation model to explore the effects of WMS and MADBS on the adult gut microbiota, its metabolites, and the subsequent formation of SCFAs and gases. Notably, Liu et al. employed the Mucosal-Simulator of the Human Intestinal Microbial Ecosystem (SHIME) to evaluate the colonic fermentation profiles of WMS [49]. They demonstrated that the cooked waxy starch increased the butyrate production and enriched Bifidobacteriaceae abundance, which is consistent with the result obtained in our experiment. Our fermentation processes were conducted under strictly maintained anaerobic conditions. Although differences were observed in the two fecal fermentation processes, the results obtained were essentially consistent, thereby validating the feasibility of the methodology. This study synergizes in vivo rat model analyses with human fecal in vitro fermentation to elucidate diet–gut microbiota interactions, advancing understanding of dietary fiber-mediated microbial modulation.
5. Conclusions
WMS and MADBS significantly influence the richness and diversity of murine gut microbiota. Specifically, WMS treatment resulted in a higher relative abundance of Muribaculaceae and Bifidobacterium, whereas MADBS treatment elevated the levels of Ileibacterium, Muribaculaceae, and Dubosiella. In vitro fermentation experiments on human feces also demonstrated that WMS significantly promoted the growth of Bifidobacterium, Lactobacillus, Megamonas, and Megasphaera, while MADBS enhanced the proliferation of Weissella, Lactobacillus, and Prevotella. Notably, both treatments significantly reduced the abundance of Escherichia-Shigella. Metabolically, WMS improved the production of acetic, butyric, propionic, and valproic acids, whereas MADBS decreased the concentration of total SCFAs. In addition, both treatments resulted in lower levels of CH4, NH3, and H2S compared to the CK group.
These findings demonstrate that WMS and MADBS can effectively modulate the gut microbial ecosystem by enriching probiotics and suppressing potential pathogens while concurrently altering metabolic outputs. This suggests their potential as dietary interventions for gut microbiota regulation.
Supplementary Materials
The following supporting information can be downloaded at: https://www.mdpi.com/article/10.3390/microorganisms13092218/s1, Table S1. SCFAs content after in vitro fermentation. Table S2. Gas content after in vitro fermentation. Table S3. The impact of WMS and MADBS on the abundance of 54 significantly differential bacterial genera. Table S4. The impact of WMS and MADBS on the abundance of 30 significantly differential bacterial genera in mice.
Author Contributions
Methodology: W.L.; Investigation: Z.Z. and W.L.; Writing—Original Draft Preparation: Z.Z.; Review and Editing: G.Y. and X.J.; Resources: Y.Y. and X.J.; Funding Acquisition: L.W. and X.J. All authors have read and agreed to the published version of the manuscript.
Funding
This research was financially supported by the Science and Technology Research Project of Henan Province (252102111107) and the National Natural Science Foundation of China (32201969).
Institutional Review Board Statement
All procedures were performed in compliance with relevant laws and institutional guidelines for the collection of human fecal samples, which was approved by the Ethics Committee of the Zhejiang Academy of Agricultural Sciences (ZAASES [2024]01, approval date: 25 November 2024) with informed consent obtained from the participant. The privacy rights of human subjects must be observed. The approval of this animal study was granted by the Laboratory Animal Ethics Committee of Zhejiang Academy of Agricultural Sciences (No. 2024ZAASLA111, approval date: 30 June 2024).
Informed Consent Statement
Informed consent was obtained from all subjects involved in the study.
Data Availability Statement
The original contributions presented in this study are included in the article/Supplementary Material. Further inquiries can be directed to the corresponding authors.
Conflicts of Interest
The authors declare no conflicts of interest.
References
- Zheng, B.; Guo, X.; Tang, Y.; Chen, L.; Xie, F. Development changes in multi-scale structure and functional properties of waxy corn starch at different stages of kernel growth. Int. J. Biol. Macromol. 2021, 191, 335. [Google Scholar] [CrossRef]
- Achayuthakan, P.; Suphantharika, M. Pasting and rheological properties of waxy corn starch as affected by guar gum and xanthan gum. Carbohydr. Polym. 2008, 1, 9–17. [Google Scholar] [CrossRef]
- Church, T.; Martin, C.K. The obesity epidemic: A consequence of reduced energy expenditure and the uncoupling of energy intake. Obesity 2018, 26, 14–16. [Google Scholar] [CrossRef]
- Sneh, P.B.; Ashogbon, A.O.; Singh, A.; Chaudhary, V.; Whiteside, W.S. Enzymatic modification of starch: A green approach for starch applications. Carbohydr. Polym. 2022, 287, 119265. [Google Scholar] [CrossRef] [PubMed]
- Ji, X.; Yin, M.; Hao, L.; Shi, M.; Liu, H.; Liu, Y. Effect of inulin on pasting, thermal, rheological properties and in vitro digestibility of pea starch gel. Int. J. Biol. Macromol. 2021, 193, 1669–1675. [Google Scholar] [CrossRef] [PubMed]
- Liu, G.D.; Hong, Y.; Gu, Z.B.; Li, Z.F.; Cheng, L.; Li, C.M. Preparation and Characterization of Pullulanase Debranched Starches and their Properties for Drug Controlled-release. RSC Adv. 2015, 5, 97066–97075. [Google Scholar] [CrossRef]
- Liu, G.D.; Hong, Y.; Gu, Z.B.; Li, Z.F.; Cheng, L. Pullulanase hydrolysis behaviors and hydrogel properties of debranched starches from different sources. Food Hydrocoll. 2015, 45, 351. [Google Scholar] [CrossRef]
- Liu, W.; Hong, Y.; Gu, Z.B.; Cheng, L.; Li, Z.F.; Li, C.M. In structure and in-vitro digestibility of waxy corn starch debranched by pullulanase. Food Hydrocoll. 2017, 67, 104–110. [Google Scholar] [CrossRef]
- Yan, Y.; An, H.; Liu, Y.; Ji, X.; Shi, M.; Niu, B. Debranching facilitates malate esterification of waxy maize starch and decreases the digestibility. Int. J. Biol. Macromol. 2023, 242, 125056. [Google Scholar] [CrossRef] [PubMed]
- Duncan, S.H.; Louis, P.; Thomson, J.M.; Flint, H.J. The role of pH in determining the species composition of the human colonic microbiota. Environ. Microbiol. 2009, 8, 2112–2122. [Google Scholar] [CrossRef]
- Chen, S.; Zhou, Y.; Chen, Y.; Gu, J. fastp: An ultra-fast all-in-one FASTQ preprocessor. Bioinformatics 2018, 17, i884–i890. [Google Scholar] [CrossRef]
- Magoč, T.; Salzberg, S.L. FLASH: Fast length adjustment of short reads to improve genome assemblies. Bioinformatics 2011, 21, 2957–2963. [Google Scholar] [CrossRef] [PubMed]
- Edgar, R.C. UPARSE: Highly accurate OTU sequences from microbial amplicon deads. Nat. Methods 2013, 10, 996–998. [Google Scholar] [CrossRef]
- Stackebrandt, E.; Goebel, B.M. Taxonomic Note: A Place for DNA-DNA Reassociation and 16S rRNA Sequence Analysis in the Present Species Definition in Bacteriology. Int. J. Syst. Bacteriol. 1994, 4, 846–849. [Google Scholar] [CrossRef]
- Koh, A.; De Vadder, F.; Kovatcheva-Datchary, P.; Bäckhed, F. From dietary fiber to host physiology: Short-chain fatty acids as key bacterial metabolites. Cell 2016, 165, 1332–1345. [Google Scholar] [CrossRef]
- Li, Q.Y.; Dou, Z.M.; Chen, C.; Jiang, Y.M.; Yang, B.; Fu, X. Study on the Effect of Molecular weight on the gut microbiota fermentation properties of blackberry polysaccharides in vitro. J. Agric. Food Chem. 2022, 70, 11245–11257. [Google Scholar] [CrossRef]
- Fukuda, S.; Toh, H.; Hase, K.; Oshima, K.; Nakanishi, Y.; Yoshimura, K.; Tobe, T.; Clarke, J.M.; Topping, D.L.; Suzuki, T.; et al. Bifidobacteria can protect from enteropathogenic infection through production of acetate. Nature 2011, 7331, 543–547. [Google Scholar] [CrossRef]
- Crișan, T.O.; Cleophas, M.C.; Oosting, M.; Lemmers, H.; Toenhake-Dijkstra, H.; Netea, M.G.; Jansen, T.L.; Joosten, L.A. Soluble uric acid primes TLR-induced proinflammatory cytokine production by human primary cells via inhibition of IL-1Ra. Ann. Rheum. Dis. 2016, 4, 755–762. [Google Scholar] [CrossRef] [PubMed]
- Wang, S.; Lv, D.; Jiang, S.H.; Jiang, J.; Chen, Y. Quantitative reduction in short-chain fatty acids, especially butyrate, contributes to the progression of chronic kidney disease. Clin. Sci. 2019, 17, 1857–1870. [Google Scholar] [CrossRef]
- Alva-Murillo, N.; Ochoa-Zarzosa, A.; Lopez-Meza, J.E. Short chain fatty acids (propionic and hexanoic) decrease Staphylococcus aureus internalization into bovine mammary epithelial cells and modulate antimicrobial peptide expression. Vet. Microbiol. 2012, 155, 324–331. [Google Scholar] [CrossRef] [PubMed]
- Lipska, K.; Gumieniczek, A.; Filip, A.A. Anticonvulsant valproic acid and other short-chain fatty acids as novel anticancer therapeutics: Possibilities and challenges. Acta Pharm. 2020, 3, 291–301. [Google Scholar] [CrossRef]
- Rahar, S.; Swami, G.; Nagpal, N.; Nagpal, M.A.; Singh, G.S. Preparation, characterization, and biological properties of β-glucans. J. Adv. Pharm. Technol. Res. 2011, 2, 94. [Google Scholar] [CrossRef]
- Yu, Y.Y.; Fu, H.Q.; Du, H.Y.; Zhang, J.; Chen, K.Y.; Zhao, Y.X.; Gao, Y.; Li, M.H. Overview of research on the application of medicine food homologous bioactive ingredients to functional constipation. Food Med. Homol. 2025, 2, 9420057. [Google Scholar] [CrossRef]
- Ten, B.S.J.M.; Bovee-Oudenhoven, I.M.J.; Lettink-Wissink, M.L.G.; Katan, M.B.; van der Meer, R. Dietary Fructooligosaccharides affect intestinal barrier function in healthy men. J. Nutr. 2006, 1, 70–74. [Google Scholar] [CrossRef]
- Cao, Q.; Zhang, L.; Yang, G.; Xu, C.; Wang, R. Butyrate-stimulated H2S production in colon cancer cells. Antioxid. Redox Signal. 2010, 12, 1101–1109. [Google Scholar] [CrossRef] [PubMed]
- Roediger, W.E.W.; Duncan, A.; Kapaniris, O.; Millard, S. Sulphide impairment of substrate oxidation inrat colonocytes: A biochemical basis for ulcerative colitis? Clin. Sci. 1993, 85, 623–627. [Google Scholar] [CrossRef] [PubMed]
- Wang, J.; Qin, J.; Li, Y.; Cai, Z.; Li, S.; Zhu, J.; Zhang, F.; Liang, S.; Zhang, W.; Guan, Y.; et al. A metagenome-wide association study of gut microbiota in type 2 diabetes. Nature 2012, 490, 55–60. [Google Scholar] [CrossRef]
- Mathur, R.; Amichai, M.; Chua, K.S.; Mirocha, J.; Barlow, G.M.; Pimentel, M. Methane and hydrogenpositivity on breath rest is associated with greater body mass index and body fat. J. Clin. Endocrinol. Metab. 2013, 98, E698–E702. [Google Scholar] [CrossRef] [PubMed]
- Sanchez-Patan, F.; Cueva, C.; Monagas, M. In vitro fermentation of a red wine extract by human gut microbiota: Changes in microbial groups and formation of phenolic metabolites. J. Agric. Food Chem. 2012, 9, 2136. [Google Scholar] [CrossRef]
- Di Gioia, D.; Aloisio, I.; Mazzola, G.; Biavati, B. Bifidobacteria: Their impact on gut microbiota composition and their applications as probiotics in infants. Appl. Microbiol. Biotechnol. 2014, 2, 563–577. [Google Scholar] [CrossRef]
- Yang, F.; Zhang, X.; Chen, L.; Jiang, Y.; Yan, Y.; Tang, X.; Wang, J.; Xiong, Z.; Dong, J.; Xue, Y.; et al. Genome dynamics and diversity of Shigella species, the etiologic agents of bacillary dysentery. Nucleic Acids Res. 2005, 33, 6445–6458. [Google Scholar] [CrossRef]
- Kim, E.; Yang, S.M.; Kim, H.Y. Weissella and the two janus faces of the genus. Appl. Microbiol. Biotechnol. 2023, 4, 1119–1127. [Google Scholar] [CrossRef]
- Ahmed, S.; Singh, S.; Singh, V.; Roberts, K.D.; Zaidi, A.; Rodriguez-Palacios, A. The Weissella genus: Clinically treatable bacteria with antimicrobial/probiotic effects on inflammation and cancer. Microorganisms 2022, 12, 2427. [Google Scholar] [CrossRef]
- Kwak, S.H.; Cho, Y.M.; Noh, G.M.; Om, A.S. Cancer preventive potential of kimchi lactic acid bacteria (Weissella cibaria, Lactobacillus plantarum). J. Cancer Prev. 2014, 19, 253–258. [Google Scholar] [CrossRef]
- Flint, H.J.; Scott, K.P.; Louis, P.; Duncan, S.H. The role of the gut microbiota in nutrition and health. Nat. Rev. Gastroenterol. Hepatol. 2012, 9, 577–589. [Google Scholar] [CrossRef]
- Sun, Y.; Su, Y.; Zhu, W. Microbiome-metabolome responses in the cecum and colon of pig to a high resistant starch diet. Front. Microbiol. 2016, 7, 779. [Google Scholar] [CrossRef] [PubMed]
- Maier, T.V.; Lucio, M.; Lee, L.H.; VerBerkmoes, N.C.; Brislawn, C.J.; Bernhardt, J.; Lamendella, R.; Mcdermott, J.E.; Bergeron, N.; Heinzmann, S.S.; et al. Impact of dietary resistant starch on the human gut microbiome, metaproteome, and metabolome. mBio 2017, 8, e01343-17. [Google Scholar] [CrossRef]
- Zhou, J.; Zhang, Q.; Zhao, Y.; Zou, Y.; Chen, M.; Zhou, S.; Wang, Z. The relationship of Megamonas species with nonalcoholic fatty liver disease in children and adolescents revealed by Metagenomics of gut microbiota. Sci. Rep. 2022, 1, 22001. [Google Scholar] [CrossRef] [PubMed]
- Wu, C.; Yang, F.; Zhong, H.; Hong, J.; Lin, H.; Zong, M.; Ren, H.; Zhao, S.; Chen, Y.; Shi, Z.; et al. Obesity-enriched gut microbe degrades myo-inositol and promotes lipid absorption. Cell Host Microbe 2024, 8, 1301–1314. [Google Scholar] [CrossRef] [PubMed]
- Castellarin, M.; Warren, R.L.; Freeman, J.D.; Dreolini, L.; Krzywinski, M.; Strauss, J.; Barnes, R.; Watson, P.; Allen-Vercoe, E.; Moore, R.A.; et al. Fusobacterium nucleatum infection is prevalent in human colorectal carcinoma. Genome Res. 2012, 2, 299–306. [Google Scholar] [CrossRef]
- Rubinstein, M.R.; Wang, X.; Liu, W.; Hao, Y.; Cai, G.; Han, Y.W. Fusobacterium Nucleatum Promotes Colorectal Carcinogenesis by Modulating E-Cadherin/β-Catenin Signaling via its FadA Adhesin. Cell Host Microbe 2013, 2, 195–206. [Google Scholar] [CrossRef]
- Ohkusa, T.; Sato, N.; Ogihara, T.; Morita, K.; Ogawa, M.; Okayasu, I. Fusobacterium varium localized in the colonic mucosa of patients with ulcerative colitis stimulates species-specific antibody. J. Gastroenterol. Hepatol. 2002, 8, 849–853. [Google Scholar]
- Zhu, Y.; Chen, B.; Zhang, X.; Akbar, M.T.; Wu, T.; Zhang, Y.; Zhi, L.; Shen, Q. Exploration of the Muribaculaceae Family in the Gut Microbiota: Diversity, Metabolism, and Function. Nutrients 2024, 16, 2660. [Google Scholar] [CrossRef]
- Chen, J.; Ding, X.; Wu, R.; Tong, B.; Zhao, L.; Lv, H.; Meng, X.; Liu, Y.; Ren, B.; Li, J. Novel sesquiterpene glycoside from loquat leaf alleviates type 2 diabetes mellitus combined with nonalcoholic fatty liver disease by improving insulin resistance, oxidative stress, inflammation, and gut microbiota composition. J. Agric. Food Chem. 2021, 69, 14176–14191. [Google Scholar] [CrossRef] [PubMed]
- Yu, Y.; Zeng, F.; Han, P.; Zhang, L.; Yang, L.; Zhou, F.; Liu, Q.; Ruan, Z. Dietary chlorogenic acid alleviates high-fat diet-induced steatotic liver disease by regulating metabolites and gut microbiota. Int. J. Food Sci. Nutr. 2024, 75, 369–384. [Google Scholar]
- Zhan, F.; Song, W.; Fan, Y.; Wang, F.; Wang, Q. Cucurbitacin E alleviates colonic barrier function impairment and inflammation response and improves microbial composition on experimental colitis models. J. Inflamm. Res. 2024, 17, 2745–2756. [Google Scholar] [CrossRef]
- Cai, K.; Cao, X.Y.; Chen, F.; Zhu, Y.; Sun, D.D.; Cheng, H.B.; Duan, J.A.; Su, S.L. Xianlian Jiedu decoction alleviates colorectal cancer by regulating metabolic profiles, intestinal microbiota and metabolites. Phytomedicine 2024, 128, 155385. [Google Scholar] [CrossRef]
- Zhang, Y.; Tu, S.; Ji, X.; Wu, J.; Meng, J.; Gao, J.; Shao, X.; Shi, S.; Wang, G.; Qiu, J.; et al. Dubosiella newyorkensis modulates immune tolerance in colitis via the L-lysine-activated AhR-IDO1-Kyn pathway. Nat. Commun. 2024, 15, 1333. [Google Scholar] [CrossRef] [PubMed]
- Liu, Y.; Matheyambath, A.C.; Polic, I.I.; LaPointe, G. Differential fermentation of raw and processed high-amylose and waxy maize starches in the Simulator of the Human Intestinal Microbial Ecosystem (SHIME®). J. Funct. Foods 2021, 86, 104735. [Google Scholar] [CrossRef]
Disclaimer/Publisher’s Note: The statements, opinions and data contained in all publications are solely those of the individual author(s) and contributor(s) and not of MDPI and/or the editor(s). MDPI and/or the editor(s) disclaim responsibility for any injury to people or property resulting from any ideas, methods, instructions or products referred to in the content. |
© 2025 by the authors. Licensee MDPI, Basel, Switzerland. This article is an open access article distributed under the terms and conditions of the Creative Commons Attribution (CC BY) license (https://creativecommons.org/licenses/by/4.0/).