Article

Noctiluca scintillans Bloom Reshapes Microbial Community Structure, Interaction Networks, and Metabolism Patterns in Qinhuangdao Coastal Waters, China

1
Research Center for Marine Science, Hebei Normal University of Science and Technology, Qinhuangdao 066004, China
2
Hebei Key Laboratory of Ocean Dynamics, Resources and Environments, Qinhuangdao 066004, China
*
Author to whom correspondence should be addressed.
Microorganisms 2025, 13(8), 1959; https://doi.org/10.3390/microorganisms13081959
Submission received: 19 July 2025 / Revised: 18 August 2025 / Accepted: 20 August 2025 / Published: 21 August 2025
(This article belongs to the Section Environmental Microbiology)

Abstract

The coastal waters of Qinhuangdao are a major hotspot for harmful algal blooms (HABs) in the Bohai Sea, with Noctiluca scintillans being one of the primary algal species responsible for these events. A comprehensive understanding of the microbial community structure and functional responses to N. scintillans bloom events is crucial for elucidating their underlying mechanisms and ecological impacts. This study investigated the microbial community dynamics, metabolic shifts, and the environmental drivers associated with a N. scintillans bloom in the coastal waters of Qinhuangdao, China, using high-throughput sequencing of 16S and 18S rRNA genes, co-occurrence network analysis, and metabolic pathway prediction. The results revealed that the proliferation of autotrophic phytoplankton, such as Minutocellus spp., likely provided a nutritional foundation and favorable conditions for the N. scintillans bloom. The bloom significantly altered the community structures of prokaryotes and microeukaryotes, resulting in significantly lower α-diversity indices in the blooming region (BR) compared to the non-blooming region (NR). Co-occurrence network analyses demonstrated reduced network complexity and stability in the BR, with keystone taxa primarily belonging to Flavobacteriaceae and Rhodobacteraceae. Furthermore, the community structures of both prokaryotes and microeukaryotes correlated with multiple environmental factors, particularly elevated levels of NH4+-N and PO43−-P. Metabolic predictions indicated enhanced anaerobic respiration, fatty acid degradation, and nitrogen assimilation pathways, suggesting microbial adaptation to bloom-induced localized hypoxia and high organic matter. Notably, ammonia assimilation was upregulated, likely as a detoxification strategy. Additionally, carbon flux was redirected through the methylmalonyl-CoA pathway and pyruvate-malate shuttle to compensate for partial TCA cycle downregulation, maintaining energy balance under oxygen-limited conditions. This study elucidates the interplay between N. scintillans blooms, microbial interactions, and functional adaptations, providing insights for HAB prediction and management in coastal ecosystems.

1. Introduction

Marine ecosystems, especially coastal waters, are currently facing unprecedented challenges, such as global warming, nutrient pollution, and overfishing, which directly threaten ecosystem health [1,2]. Among these ecological disasters, harmful algal blooms (HABs) have gained significant attention due to their detrimental effects on marine ecosystems and human health. HABs are ecological anomalies that cause discoloration of seawater due to overpopulation of certain plankton under specific physicochemical factors and nutrient conditions, resulting in abnormal ecosystem structure and function [3]. It is estimated that no less than 2000 cases of poisoning due to algal toxins occur globally each year, with an economic loss of about 4 billion US dollars [4,5]. In China, the direct economic losses attributed to phycotoxins from 1977 to 2019 reached 5.9 billion yuan (about 0.87 billion US dollars), with actual losses likely being even higher [6]. Thus, it is crucial to enhance our understanding of the ecological dynamics surrounding harmful algae to effectively manage and control this phenomenon.
The formation, development, maintenance and termination of HABs are complex processes influenced by both abiotic and biotic factors. Abiotic factors include environmental conditions and nutrient availability, while biotic factors encompass grazing, pathogenicity and parasitism [7,8,9,10]. Among these biotic factors, microorganisms play a crucial role in HAB occurrence and development. They form complex ecological networks through various interactions, such as symbiotic mutualism [11], algicidal effects [8], allelopathic interactions [12], and parasitism [9]. These interactions support various ecosystem functions, including matter and energy flow and ecosystem stability [13,14]. Moreover, microorganisms affect the structure of microbial food webs through their participation in biogeochemical cycles, competing with algae for ecological niches [15,16]. Conversely, HABs can also affect microbial community structures and food webs [17,18]. Understanding the complex interactions among microorganisms and between microorganisms and the causative algal species of HABs is essential for elucidating the mechanisms that underlie HAB occurrences.
The Qinhuangdao coastal waters are a major hotspot for HABs in the Bohai Sea, China, with frequent blooms causing substantial economic losses to local fisheries and tourism [19,20]. One of the main algal species responsible for these blooms is the heterotrophic dinoflagellate Noctiluca scintillans [19], which is known for emitting blue fluorescence when disturbed. N. scintillans thrives in relatively low water temperatures (10–25 °C) [21] and typically causes HABs in the Qinhuangdao coastal waters most frequently during April–June and September–October [19]. Although N. scintillans does not produce toxins, it can secrete mucus and release ammonia, which can adversely affect the marine environment and organisms [2,22]. Research on outbreak mechanisms of N. scintillans blooms primarily focuses on nutrient supply [23] and hydrodynamic processes [24]. The dynamics of N. scintillans blooms correlate with phosphate and silicate levels, while precipitation, hydrodynamics, temperature, and food availability influence their spatial and temporal distribution along the Chinese coast [25]. Conversely, N. scintillans also enhances nutrient regeneration, supplying significant amounts of nitrogen and phosphorus to phytoplankton in the upper water layers [26,27].
Recently, an increasing number of studies have focused on microbial community composition and function during N. scintillans blooms, showing that structural changes and functional differences in microbial communities can respond to and affect the N. scintillans blooms [18,28,29]. For instance, Xia et al. reported that N. scintillans-associated bacterial community is dominated by Vibrionaceae during the bloom stage and exhibits significant downregulation of genes related to complex carbohydrate metabolism, while genes related to glucose transport and utilization are upregulated compared to the non-bloom stage [28]. Similarly, Zhou et al. suggested that microbial community composition and function display significant temporal heterogeneity at different stages of N. scintillans blooms, with phycosphere microorganisms enhancing organic carbon decomposition capacity, altering nitrogen assimilation rates, and influencing sulfur/phosphorus turnover efficiency and iron budget balance during HAB processes [18]. These findings indicate that structural and functional changes in microbial communities can respond to and affect N. scintillans blooms, yet the underlying mechanisms remain poorly understood. Therefore, in-depth investigations into the role of microorganisms in N. scintillans blooms are essential for providing valuable insights that could aid in the regulation of HAB dynamics in marine environments.
Through integrated analysis of 16S/18S rRNA gene high-throughput sequencing data, microbial co-occurrence networks, and gene predictions, this study systematically investigates: (1) the environmental and biological drivers underlying the N. scintillans bloom formation, and (2) bloom-induced shifts in microbial community structure and function. Studying these issues will enhance our understanding of the impacts of HABs on the function and stability of marine ecosystems and provide essential information for the prediction and management of HABs.

2. Materials and Methods

2.1. Study Area and Sampling Sites

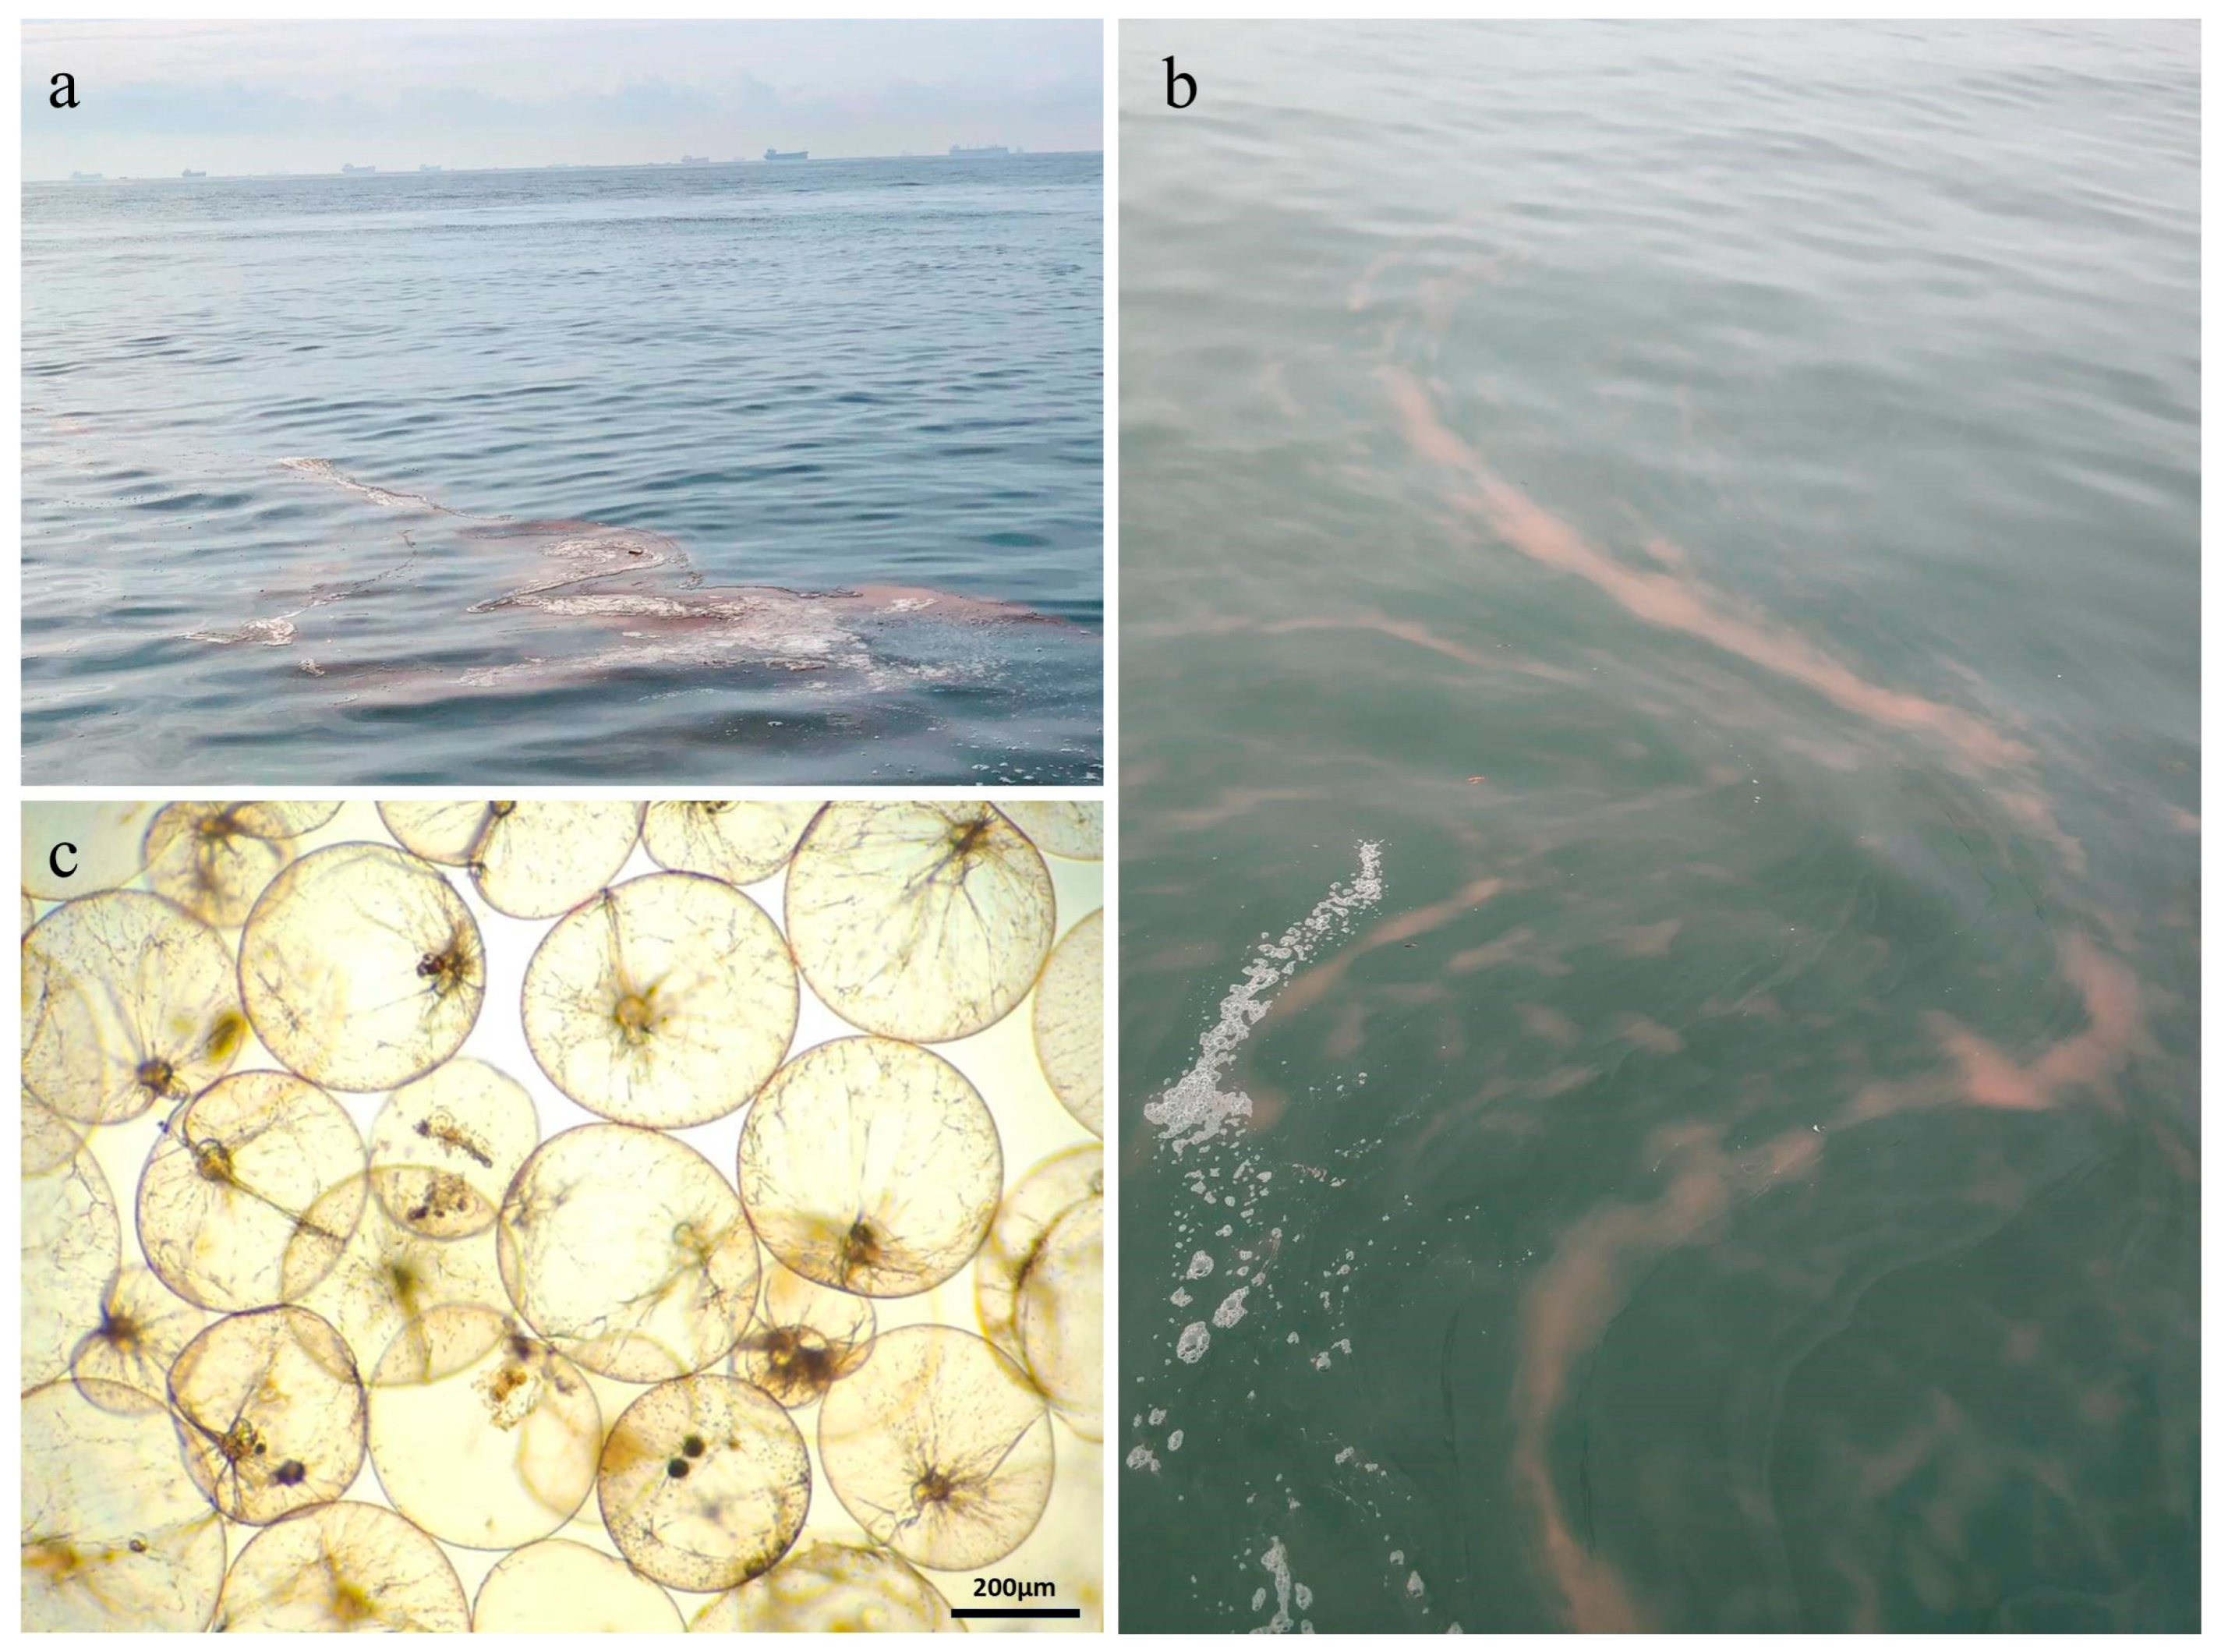
The study area is located in the coastal waters of Qinhuangdao, China. The survey was conducted on 28 September 2021. Grid sampling was conducted in the area where the Noctiluca scintillans bloom was absent (119°47′33″ E–119°33′44″ E, 39°57′17″ N–39°50′49″ N), designated as the non-blooming region (NR) below. Nine grid sites (NR1-NR9) were selected within the NR for sampling. The central location of the N. scintillans bloom was roughly 119°44′09″ E, 39°55′00″ N, covering an area of nearly 100 m2 (Figure 1 and Figure 2). Its distribution is influenced by wind, tides, and currents, making precise area measurement and grid sampling challenging. Additionally, flocculent cell clumping results in patchy density. Therefore, six randomized sites (BR1–BR6) were sampled within the blooming region (BR) to statistically represent the bloom’s patchiness. Seawater samples were collected from the surface, middle, and bottom layers at each site in both the BR and the NR (Table S1).

2.2. Sampling and Laboratory Analysis

Depth, temperature, salinity, pH, and dissolved oxygen (DO) were measured in situ using a calibrated Conductivity-Temperature-Depth (CTD) system (SeaBird, Loveland, CO, USA). Seawater samples were collected from surface, middle and bottom layers at each site using an SBE 32 Water Sampler (SeaBird, Loveland, CO, USA). In total, 45 seawater samples were collected. For each sample, 1 L of seawater was filtered through a 200 μm mesh sieve to remove larger zooplankton. The water was then passed through a 0.2 μm polycarbonate filter membrane (Millipore, Burlington, MA, USA). The filters were stored in liquid nitrogen during the cruise and subsequently transferred to a −80 °C deep freezer in the laboratory for future DNA extraction. Approximately 100 mL of filtered seawater was collected in 100 mL polycarbonate bottles and stored at −20 °C for nutrient concentration analysis. Additionally, 500 mL of seawater was sampled and filtered using a 0.7 μm GF/F filter membrane (Whatman, Maidstone, UK) and preserved at −20 °C for chlorophyll a concentration analysis. Nutrient concentrations were determined using a continuous flow analyzer (QuAAtro39, SEAL Analytical, Norderstedt, Germany). Standard solutions with filtered seawater matching the salinity of the samples were prepared. Prior to analysis, samples were equilibrated to room temperature, and ammonium samples were covered with sealing film to reduce potential volatilization interference. The calibration curve exhibited a correlation coefficient of ≥0.9999, and samples were analyzed in ascending order of concentration. Chlorophyll a concentration was determined using a 10-AU fluorometer (Turner Designs, San Jose, CA, USA) after 24 h extraction in 90% acetone at −20 °C. Another 500 mL of seawater was collected from each depth layer and fixed in polyethylene bottles with formaldehyde (final concentration 5%) for microscopy analysis. After 24–48 h of sedimentation, the fixed seawater samples were concentrated to a final volume of 50–250 mL. N. scintillans cells were enumerated in a 500-μL counting chamber by performing ten replicate counts under the UB203i inverted microscope (UOP Photoelectric Technology, Chongqing, China). The abundance was calculated based on the counted cell numbers and the corresponding concentration factor. The occurrence of the N. scintillans bloom was confirmed based on the density threshold (3 × 10³ cells/L) as specified in the Technical Regulations of Red Tide Monitoring (HY/T 069-2005).

2.3. DNA Extraction, PCR and Sequencing

Genomic DNA from microbial samples was extracted from the filters using the FastDNA® Spin Kit (MP Biomedicals, Solon, OH, USA) according to the manufacturer’s instructions. The extracted DNA was quantified using an enzyme marker (GeneCompang Limited, synergy HTX, Singapore), and its integrity was checked by 1.8% agarose gel electrophoresis. Subsequently, the hypervariable V4 region of prokaryotic 16S rRNA genes and V9 region of eukaryotic 18S rRNA genes were amplified, since these regions are widely adopted in microbial ecology due to their high taxonomic resolution and compatibility with Illumina platforms [30,31]. The V4 region of the prokaryotic 16S rRNA gene was amplified with the primer pair 515F [30] and 806R [32], while the V9 region of the eukaryotic 18S rRNA gene was amplified using the primer pair 1380F [31] and 1510R [31]. All PCR reactions were performed in a 10 μL reaction system, consisting of template DNA (2.5–4 ng), KOD FX Neo Buffer (5 μL), dNTP (2 mM each) 2 μL, and KOD FX Neo 0.2 μL. The PCR cycling conditions included an initial denaturation step at 95 °C for 5 min, followed by 25 cycles of 95 °C for 30 s, 50 °C for 30 s, and 72 °C for 40 s, concluding with a final extension at 72 °C for 7 min, and then holding at 4 °C. The amplification products were analyzed using 1.8% agarose gel electrophoresis, and the target fragments were subsequently recovered using the Monarch DNA Gel Recovery Kit. Finally, the purified amplicons were pooled and sent for high-throughput paired-end sequencing on the Illumina HiSeq 2500 platform at Biomarker Technologies Corporation in Beijing, China.

2.4. Bioinformatics Analysis

The raw paired-end reads were processed in R (version 4.3.1) using the DADA2 package in accordance with the DADA2 Pipeline Tutorial (version 1.16) (https://benjjneb.github.io/dada2/tutorial.html, accessed on 1 July 2024). The 16S and 18S rRNA gene sequences were annotated using the Silva database (version 132, http://www.arb-silva.de, accessed on 3 July 2024) and the PR2 database (version 5.0.0, https://github.com/pr2database, accessed on 3 July 2024), respectively. This process generated amplicon sequence variant (ASV) abundance tables and taxonomic species annotation tables. ASVs originating from chloroplasts or mitochondria in the prokaryotic dataset were removed using the phyloseq package. Similarly, ASVs in the eukaryotic dataset that were assigned to Metazoa and plants (i.e., Rhodophyta, Streptophyta, Trebouxiophyceae, and Ulvophyceae) were also removed. Additionally, ASVs that were unclassified at the phylum level were removed prior to further analysis. To ensure comparability among samples in terms of sequencing depth, the vegan package was used to normalize the ASV abundance table data based on the minimum sequencing depth across samples.

2.5. Data Processing and Community Structure Analysis

Data processing for microbial community structure and co-occurrence networks was conducted using R software (version 4.3.1). The analysis of α- and β-diversity of microbial communities across different regions was performed using the ggplot2 (version 3.4.2) and vegan (version 2.5-7) packages. Specifically, the α-diversity indices included the Sobs, Shannon, and Pielou’s indices [33]. Sobs index assesses the species richness within a community, while Pielou’s index evaluates the evenness of species distribution. In contrast, Shannon index considers both species richness and evenness. The β-diversity was quantified through Principal Coordinate Analysis (PCoA) using Bray–Curtis distance to evaluate the similarity between microbial communities across samples. Additionally, the statistical significance of these differences was validated using the Wilcoxon rank-sum test and Permutational Multivariate Analysis of Variance (PERMANOVA). Venn diagrams were created using the VennDiagram (version 1.7.3) package to analyze shared and unique ASVs between regions, while the relative abundance at the genus level was assessed with the ggplot2 package. The Wilcoxon rank-sum test was employed to test for significant differences in dominant species between regions and statistical significance was set at p < 0.05. Redundancy Analysis (RDA) was performed using the vegan package based on Hellinger-transformed abundance data and log10(x + 1)-transformed environmental data. The mean substitution method was used to handle the missing data in nutrient concentrations. Subsequently, environmental variables with VIF > 10 were excluded from RDA to avoid the collinearity problem, and the key environmental factors (p < 0.05) were identified by forward selection (FS) using the ordiR2step function in the vegan package. Then, ordination plots of environmental factors with prokaryotes and microeukaryotes were generated using the ggplot2 package.

2.6. Co-Occurrence Network Analysis

Co-occurrence networks for prokaryotes and microeukaryotes were constructed using the Hmisc (version 5.0.1) and igraph (version 1.2.11) packages. First, surface sample data from the BR and the NR were extracted from the ASV table for the experimental data. The data were then simplified by retaining only those ASVs with a relative abundance greater than 0.01% and present in more than 20% of the samples [34]. The association matrix was computed based on Spearman correlations, incorporating only the correlations deemed robust (|R| > 0.6) and statistically significant (p < 0.05) for network analysis, which was then exported as GraphML format. The fast greedy algorithm was utilized to identify modules, and information regarding nodes and edges, including node and edge weights, and module affiliation of nodes, was also incorporated into the GraphML dataset. The network was visualized using Gephi (v0.10.1). Node attributes (average degree, betweenness centrality), network topological properties (number of nodes, number of edges, average path length, clustering coefficient), and modular properties (modularity, number of modules) were computed using the igraph package.

2.7. Gene Prediction Analysis

To characterize microbial metabolic functional shifts during the algal bloom, metabolic pathways were predicted from 16S rRNA gene sequences using PICRUSt2 (v2.6.2) with the MetaCyc database as reference. Differential abundance analysis of metabolic pathways, KEGG orthologs (KOs), and enzyme-coding genes was performed, along with identification of key functional taxa, using R packages dplyr, tidyr, and ggplot2. This study primarily focused genes classified under “metabolism” at the KEGG level 1. Differential expression patterns (up-/down-regulation) were determined based on Wilcoxon rank-sum testing of gene relative abundance, with a significance threshold of p < 0.05.

3. Results

3.1. Noctiluca scintillans Density and Environmental Conditions

In the surface samples of the BR, the maximum density of N. scintillans was 2.8 × 10⁴ cells/L, exceeding the established bloom threshold of 3 × 10³ cells/L. Based on N. scintillans density and non-depleted dissolved oxygen levels in the BR, the sampling likely occurred during the developmental stage of the bloom. Significant differences in physicochemical factors were observed between the BR and NR across water layers (p < 0.05), except for the middle layer where no significant differences occurred (p > 0.05; Table 1). In the surface layer, while the temperature in the BR (22.9 °C) was slightly lower than in the NR (23.5 °C), the BR exhibited dramatically elevated concentrations of NH4+-N (851.8 mg/L vs. NR’s 130.2 mg/L) and PO43−-P (72.8 mg/L vs. NR’s 27.2 mg/L), representing 6.5-fold and 2.7-fold increases, respectively, compared to the NR (Figure S1). In the bottom layer, the salinity (28.8) and NH4+-N (222.0 mg/L) in the BR were significantly lower than that in the NR (29.6 and 311.1 mg/L), while the NO3-N (147.3 mg/L) and NO2-N (37.3 mg/L) in the BR were significantly higher than that in the NR (NO3-N: 90.9 mg/L, NO2-N: 21.4 mg/L).

3.2. Microbial Community Structure and Diversity

3.2.1. Microbial Community Composition

A total of 8310 prokaryotic ASVs and 1892 microeukaryotic ASVs were identified. The total number of shared prokaryotic and microeukaryotic ASVs between the BR and the NR were 1506 and 565, respectively, constituting 18.1% and 29.9% of the total prokaryotic and microeukaryotic ASVs (Figure S2).
The prokaryotic communities in the BR and NR were primarily composed of the genera Nautella, Marivivens, HIMB11, Candidatus Actinomarina, OM60 (NOR5) clade, and Litorimicrobium (Figure 3a). Notably, the composition of these dominant genera exhibited considerable variation both between the regions and with respect to depth. In the BR, the surface layer was predominantly occupied by Nautella (41.04%), followed by Marivivens (10.50%) and HIMB11 (5.01%). The middle layer was dominated by Nautella (17.06%), Marivivens (6.64%) and Halomonas (4.56%), while in the bottom layer, the most abundant genera were Nautella (27.11%), Marivivens (5.92%), and Lutimaribacter (3.61%). In contrast, the surface layer in the NR was predominantly composed of HIMB11 (9.02%), Ca. Actinomarina (7.26%), and Marivivens (6.18%). The middle layer was similarly dominated by HIMB11 (13.48%), Marivivens (9.37%), and Ca. Actinomarina (7.52%), while the bottom layer was dominated by HIMB11 (11.91%), Marivivens (8.41%), and Ca. Actinomarina (6.69%). The differences in species composition between the two regions were evident in both the surface and bottom layers, with the most pronounced variation observed in the surface layer; however, no significant differences were noted in the middle layer. Importantly, the relative abundances of Nautella and Marivivens were significantly higher in the surface and bottom layers of the BR when compared to the NR. In contrast, Ca. Actinomarina and OM60 (NOR5) clade exhibited significantly lower relative abundances across all layers in the BR compared to the NR. Additionally, HIMB11 displayed a significantly lower relative abundance in the middle and bottom layers of the BR in comparison to the NR (Figure 3a,c).
The microeukaryotic communities in the BR and NR were predominantly composed of Noctiluca, Dino-Group-I-Clade-1_X, Dorataspis_F3, Micromonas, Lepidodinium, and Protaspa (Figure 3b). The composition of these dominant microeukaryotic genera exhibited considerable variation between the BR and NR regions as well as with respect to depth. In the surface layer of the BR, Noctiluca was overwhelmingly dominant, accounting for 96.02%. In the middle layer, Noctiluca remained significant at 38.52%, followed by Dino-Group-I-Clade-1_X (20.60%) and Dorataspis_F3 (7.58%). The bottom layer of the BR was dominated by Noctiluca (32.27%), Dino-Group-I-Clade-1_X (24.06%) and Dorataspis_F3 (8.66%). In contrast, the surface layer of the NR was dominated by Noctiluca (19.55%), Dino-Group-I-Clade-1_X (16.37%), and Dorataspis_F3 (6.72%). The middle layer of the NR exhibited similar trends, with Noctiluca (30.56%), Dino-Group-I-Clade-1_X (13.96%), and Dorataspis_F3 (6.96%) as the primary genera. The bottom layer of NR was also characterized by Noctiluca (20.69%), Dino-Group-I-Clade-1_X (16.74%), and Dorataspis_F3 (10.24%). The species composition in the middle and bottom layers showed no significant difference between the two regions; however, the primary variation was observed in the surface layer. Noctiluca displayed a markedly higher relative abundance in the BR compared to the NR, whereas Dino-Group-I-Clade-1_X, Dorataspis_F3, and Micromonas exhibited significantly lower relative abundances in the BR. Additionally, Minutocellus had a significantly higher relative abundance in both the middle and bottom layers of the BR compared to the NR, although no significant difference was observed in the surface layer (Figure 3b,d).

3.2.2. Microbial Diversity

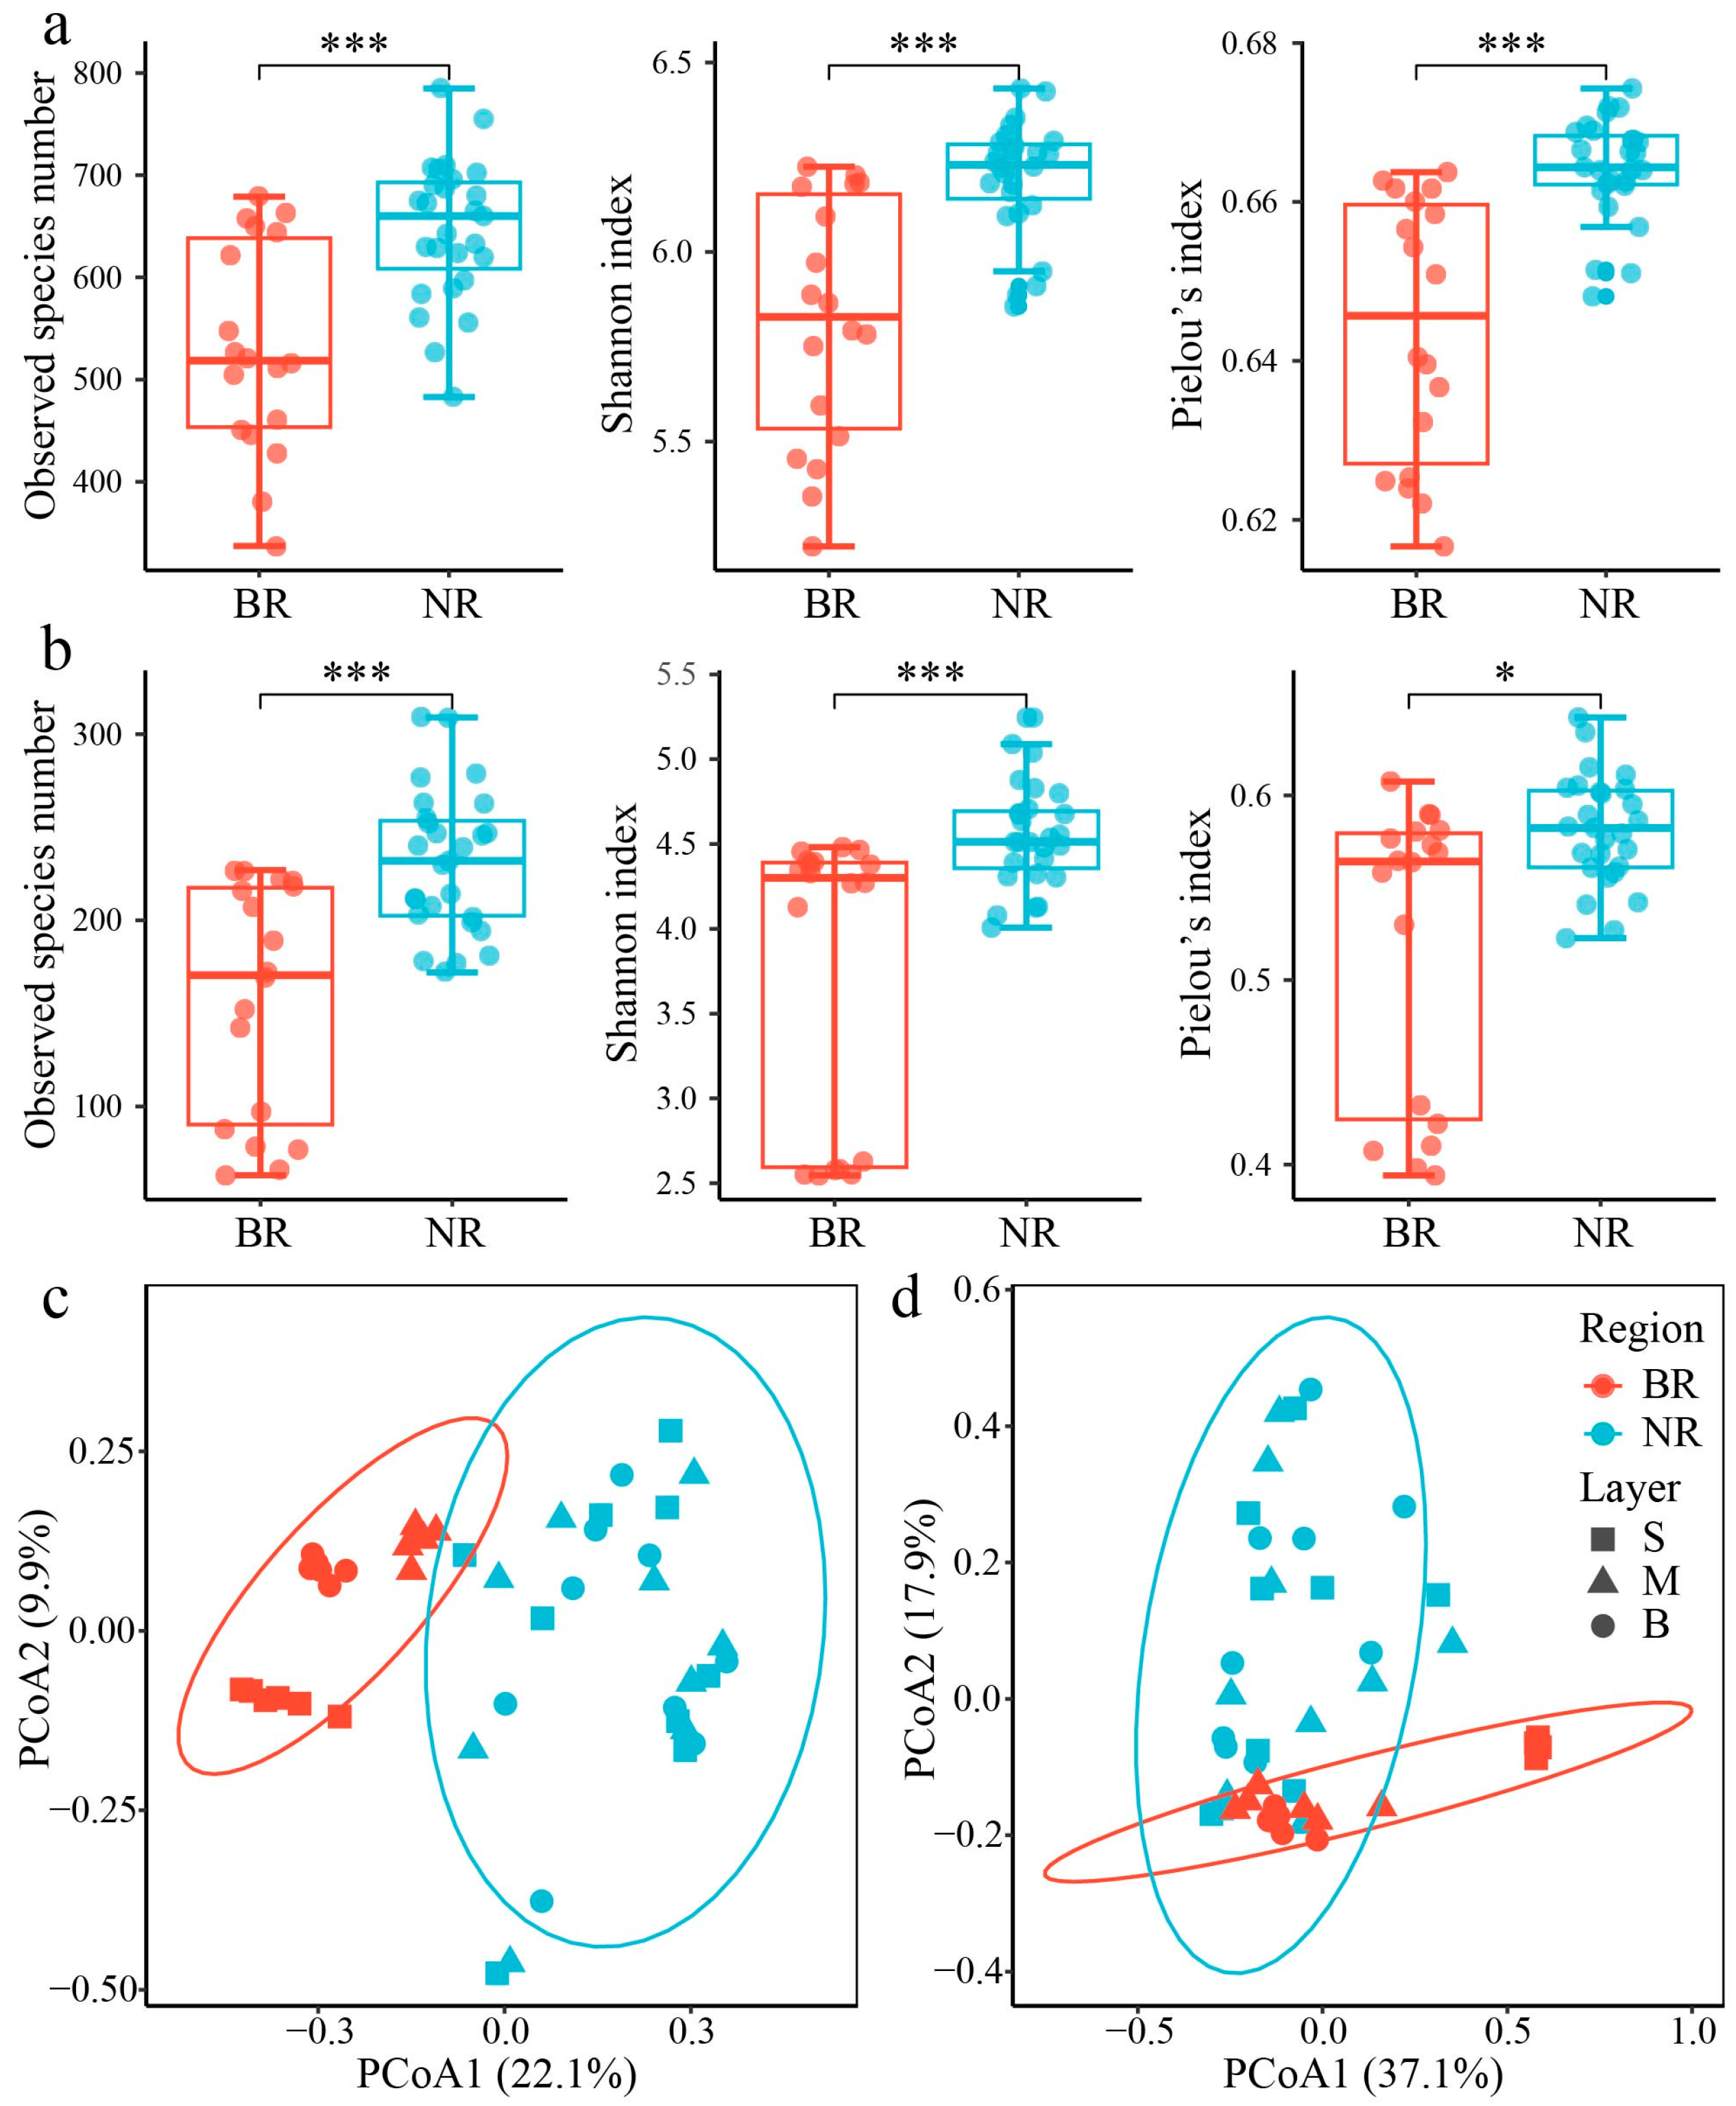
Both prokaryotic and microeukaryotic communities exhibited significant differences in α-diversity between the NR and BR (Figure 4a,b), with all indices (Sobs, Shannon, and Pielou’s) consistently lower in the BR (p < 0.05). PCoA analysis further confirmed distinct community compositions (PERMANOVA: p = 0.001, Figure 4c,d), though the explanatory power of the first two axes were limited for both groups (prokaryotes: 32.0%, microeukaryotes: 55.0%), suggesting their community structures are more dimensionally complex between these regions. Notably, the BR surface communities (both prokaryotic and microeukaryotic) showed particularly significant dissimilarities with the NR communities.

3.3. Relationship Between Microbial Community Composition and Environmental Factors

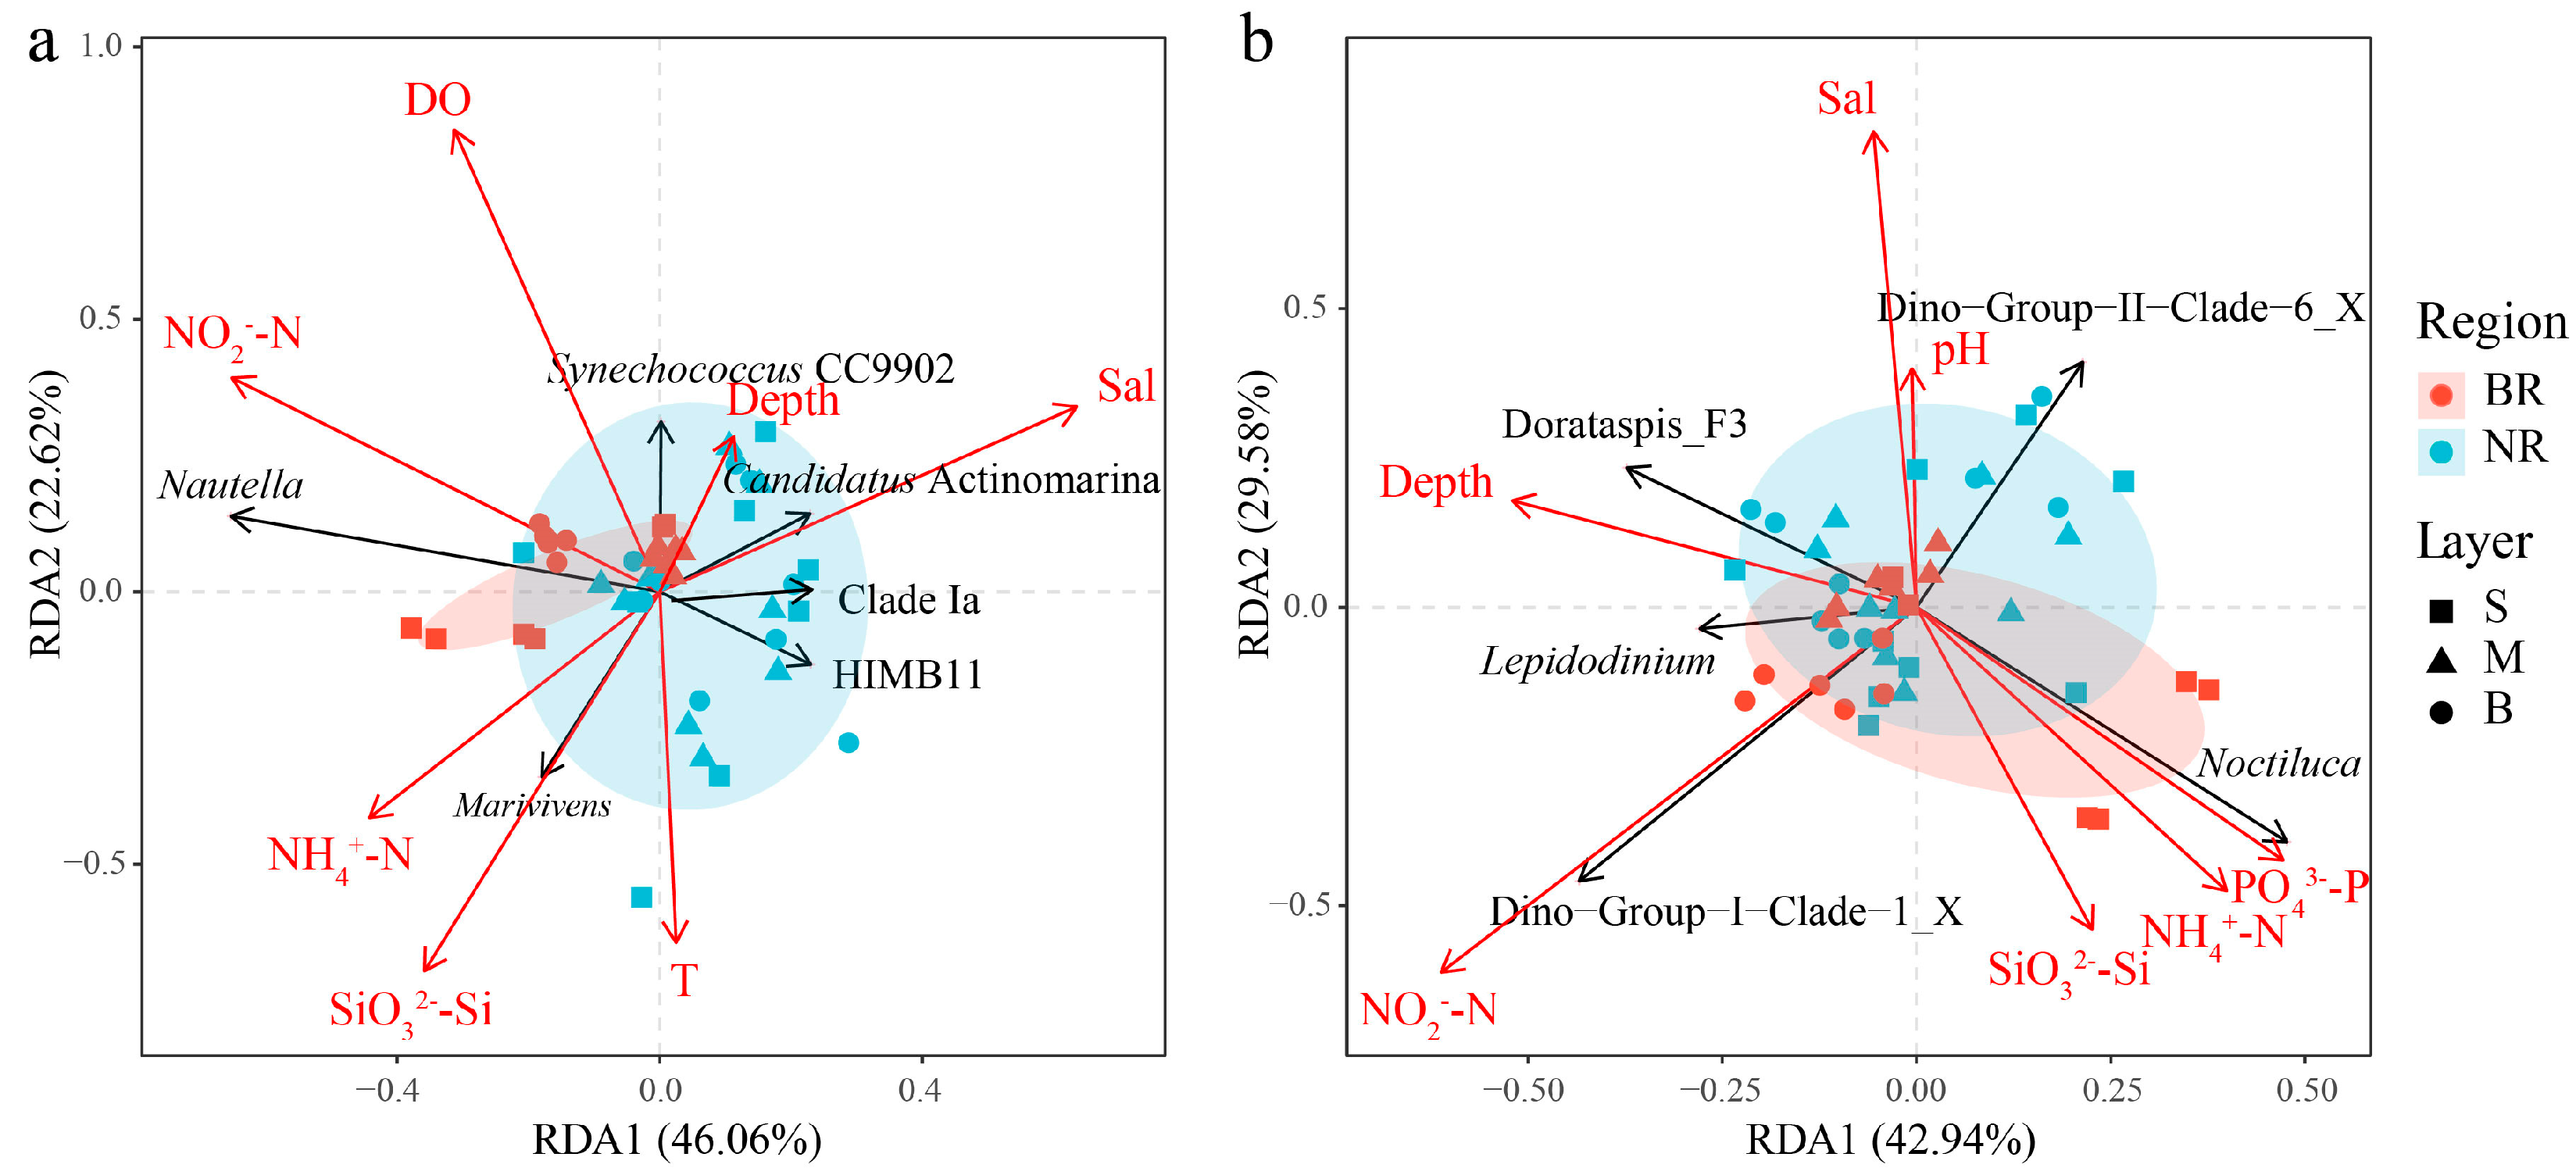
The FS analysis indicated that the key environmental factors that significantly influenced the prokaryotic community structure were NO2-N, SiO32−-Si, DO, depth, salinity, NH4+-N, and temperature. They collectively explained 43.3% of the variation in prokaryotic community composition. On the RDA plot, most samples from the BR were concentrated in the second and third quadrants, which represented higher nutrient levels (Figure 5a). NO2-N exhibited a positive correlation with Nautella and Synechococcus CC9902, while showing a negative correlation with HIMB11. Additionally, SiO32−-Si was positively correlated with Marivivens and negatively correlated with Synechococcus CC9902.
The key environmental factors that significantly influenced the microeukaryotic community structure were NO2-N, PO43−-P, SiO32−-Si, NH4+-N, depth, pH, and salinity. Collectively, these factors accounted for 47.5% of the variation in microeukaryotic community composition. Most samples from the BR were situated in the third and fourth quadrants of the RDA plot, indicative of higher nutrient levels (Figure 5b). The concentration of NO2-N showed a positive correlation with Dino-Group-I-Clade-1_X and a negative correlation with Dino-Group-II-Clade-6_X. The concentration of PO43−-P was positively correlated with Noctiluca and negatively correlated with Dorataspis_F3 and Lepidodinium. RDA further indicated that the relative abundance of Noctiluca was positively correlated with PO43−-P, NH4+-N and SiO32−-Si, while negatively correlated with NO2-N, depth, salinity, and pH. In contrast, the Spearman correlation analysis revealed that the relative abundance of N. scintillans was significantly correlated only with NH4+-N (p < 0.05) (Figure S3).

3.4. Microbial Co-Occurrence Network

3.4.1. Network Topological Properties

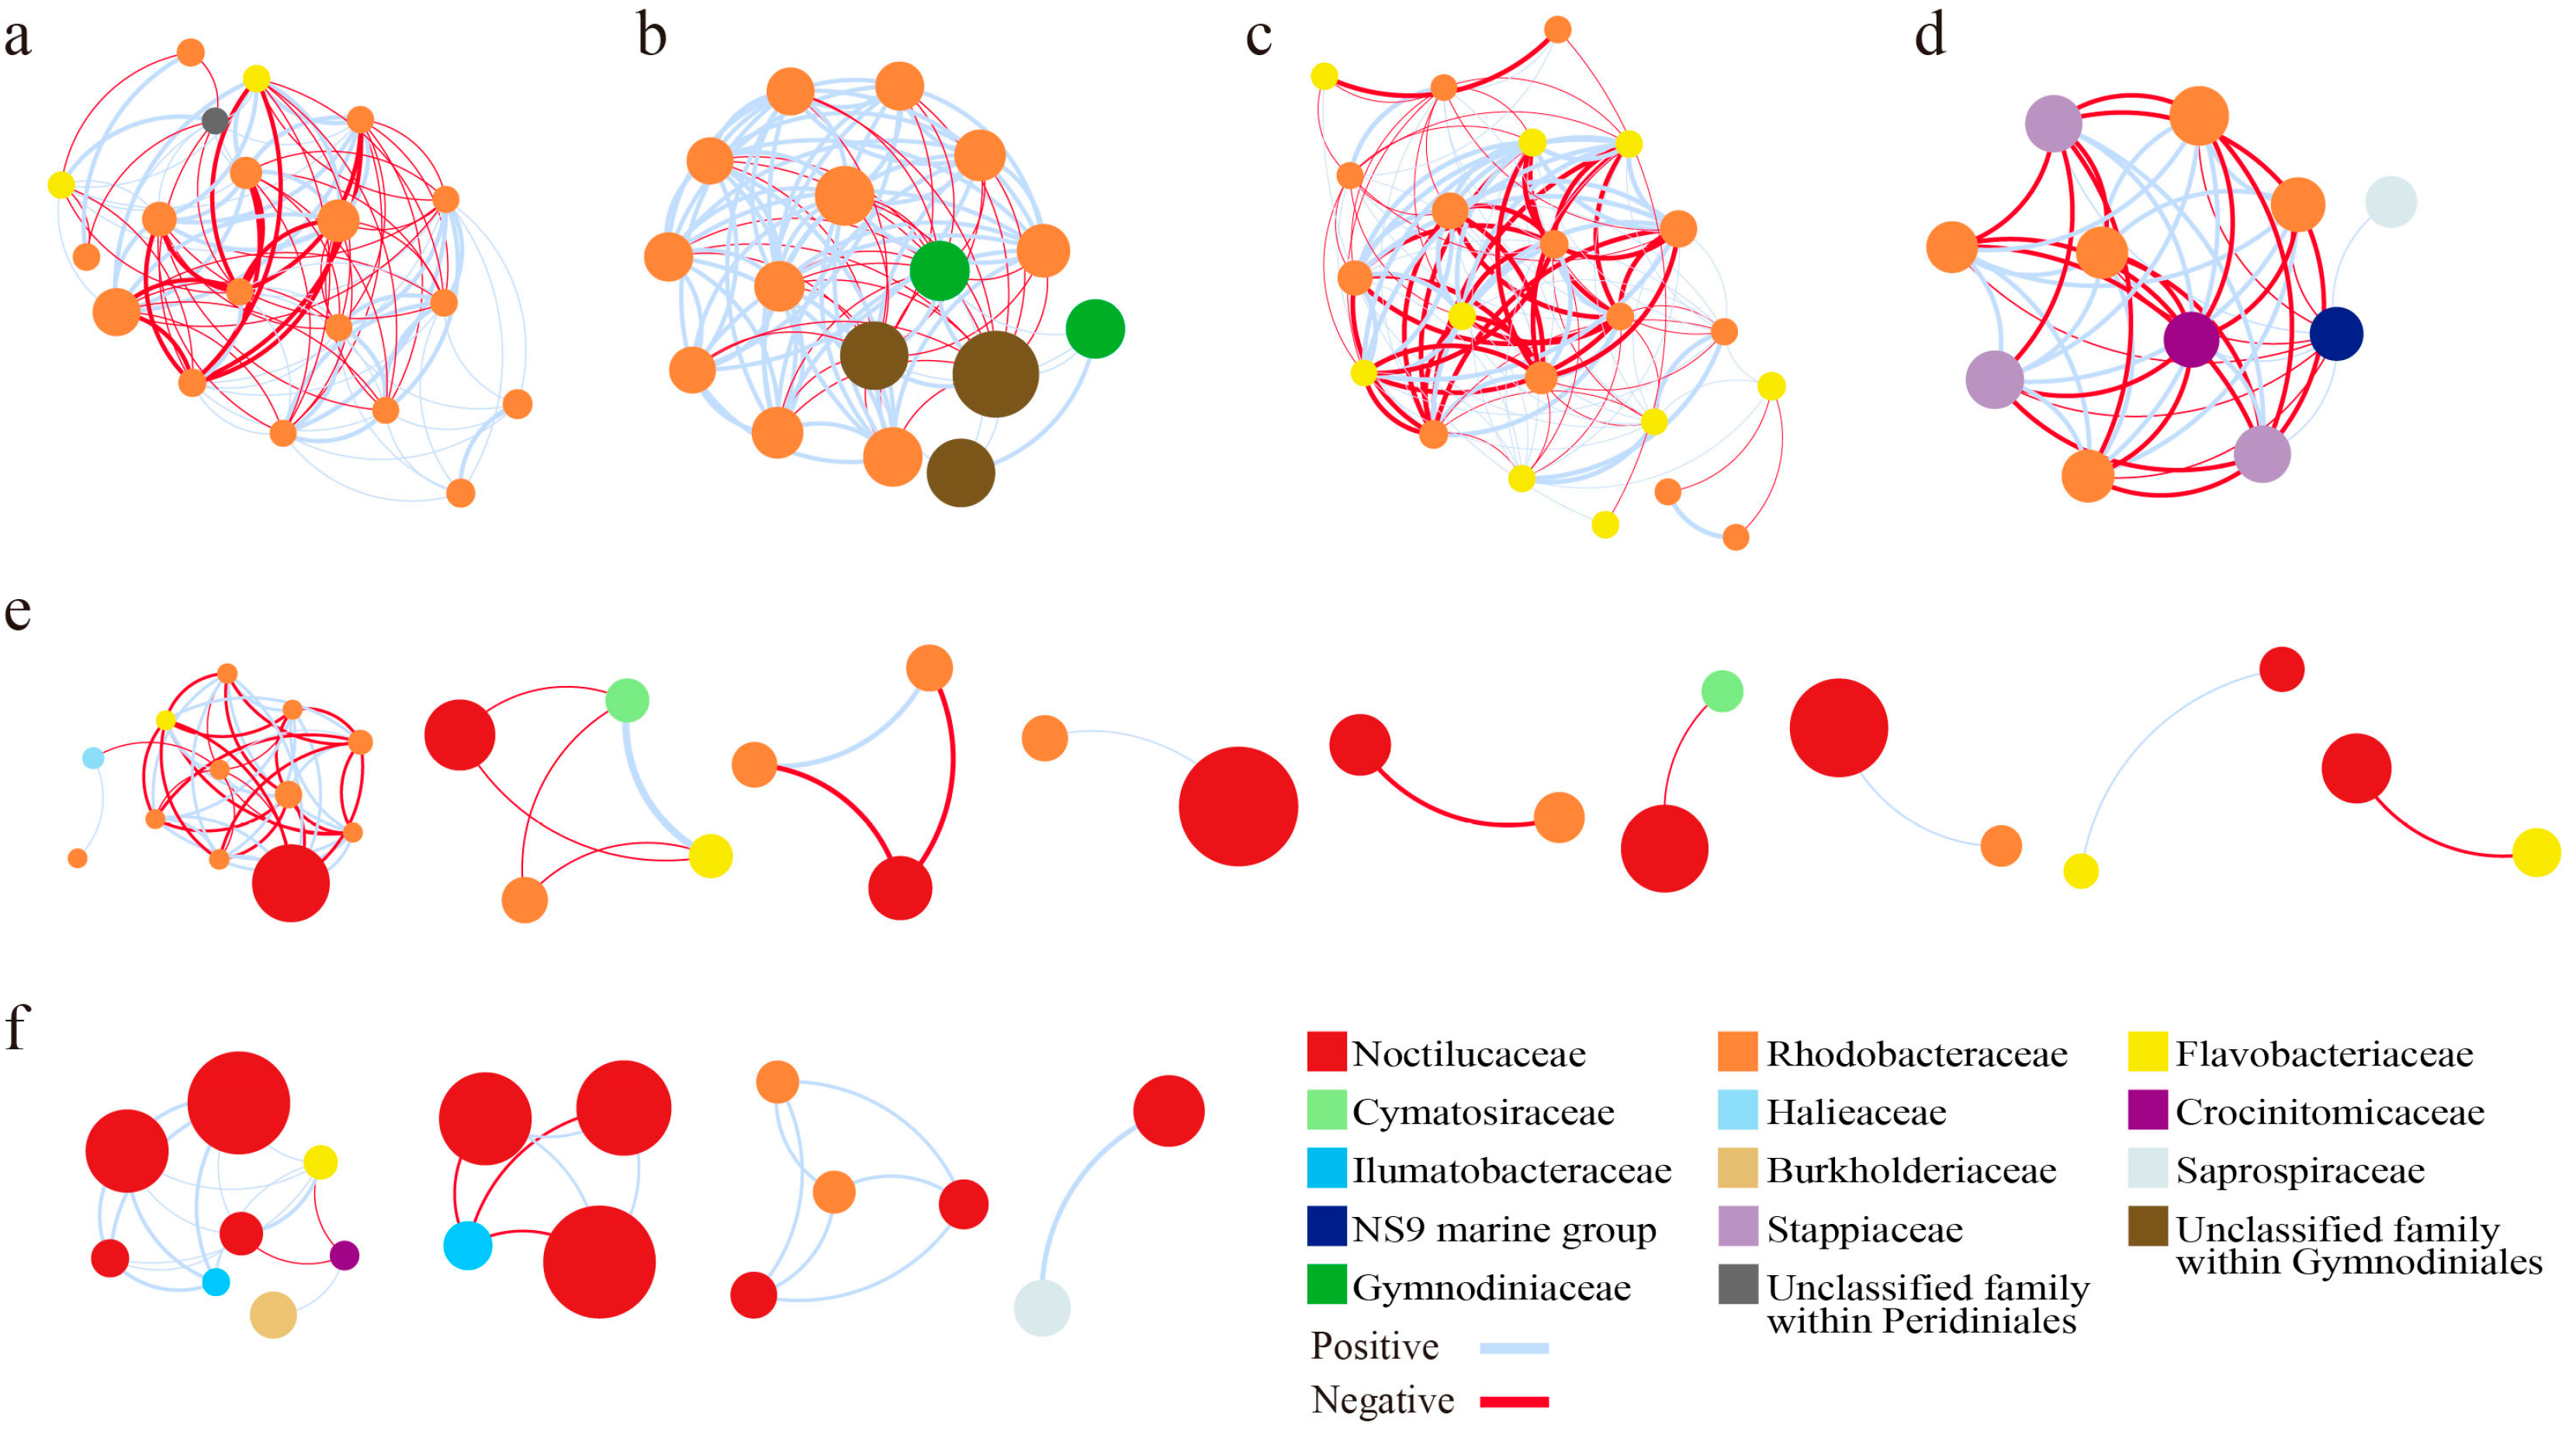
By comparing the topological properties of the integrated networks of prokaryotes and microeukaryotes between the BR and NR, we found that the BR network exhibited lower complexity and stability compared to the NR network. Specifically, the BR network had significantly fewer nodes, edges, and modules, as well as a lower average degree and clustering coefficient than the NR network. In contrast, the average path length and betweenness centrality were considerably higher in the BR network (Table 2, Figure 6). While the BR network contained a higher proportion of prokaryotic nodes (79.1%) compared to the NR network (94.1%), it exhibited a lower proportion of positive correlations. Furthermore, both the integrated networks in the BR and NR exhibited modularity greater than 0.4, confirming their multi-module structures (Table 2). When examining the independent prokaryotic and microeukaryotic networks across the regions, we found that the BR networks exhibited significantly fewer nodes, edges, and modules, and a lower average degree compared to the NR networks (Table S2, Figure S4). The BR prokaryotic network showed fewer positive correlations (77.0% vs. 94.3%), while the microeukaryotic networks exhibited minimal variation (98.6% vs. 99.3%). Notably, all networks maintained modularity greater than 0.4, further confirming their multi-module structures (Table S2).

3.4.2. Network Keystone Taxa

In the integrated networks, the keystone ASVs with the highest betweenness centrality in the BR were mostly from Flavobacteriaceae and Rhodobacteraceae, while those in the NR were from a more diverse range of taxa, including Rhodobacteraceae, Cryptomonadales, Verrucomicrobiales, Gymnodiniaceae, Cryomonadida, Chlorarachniophyceae, Ilumatobacteraceae, Rubritaleaceae, and Actinomarinaceae (Table 3). In the independent prokaryotic networks, the keystone ASVs in the BR were exclusively from Flavobacteriaceae and Rhodobacteraceae. In contrast, the keystone ASVs in the NR were from diverse taxa, such as Verrucomicrobiales, Rubritaleaceae, Rhodobacteraceae, and Crocinitomicaceae (Table S3). In the independent microeukaryotic networks, all nodes in the BR had a betweenness centrality of zero, indicating a lack of keystone nodes. In contrast, in the NR, only three ASVs (belonging to Cryomonadida and Cymatosiraceae) had non-zero betweenness centrality and were identified as keystone taxa (Table S3).

3.4.3. Network Modules

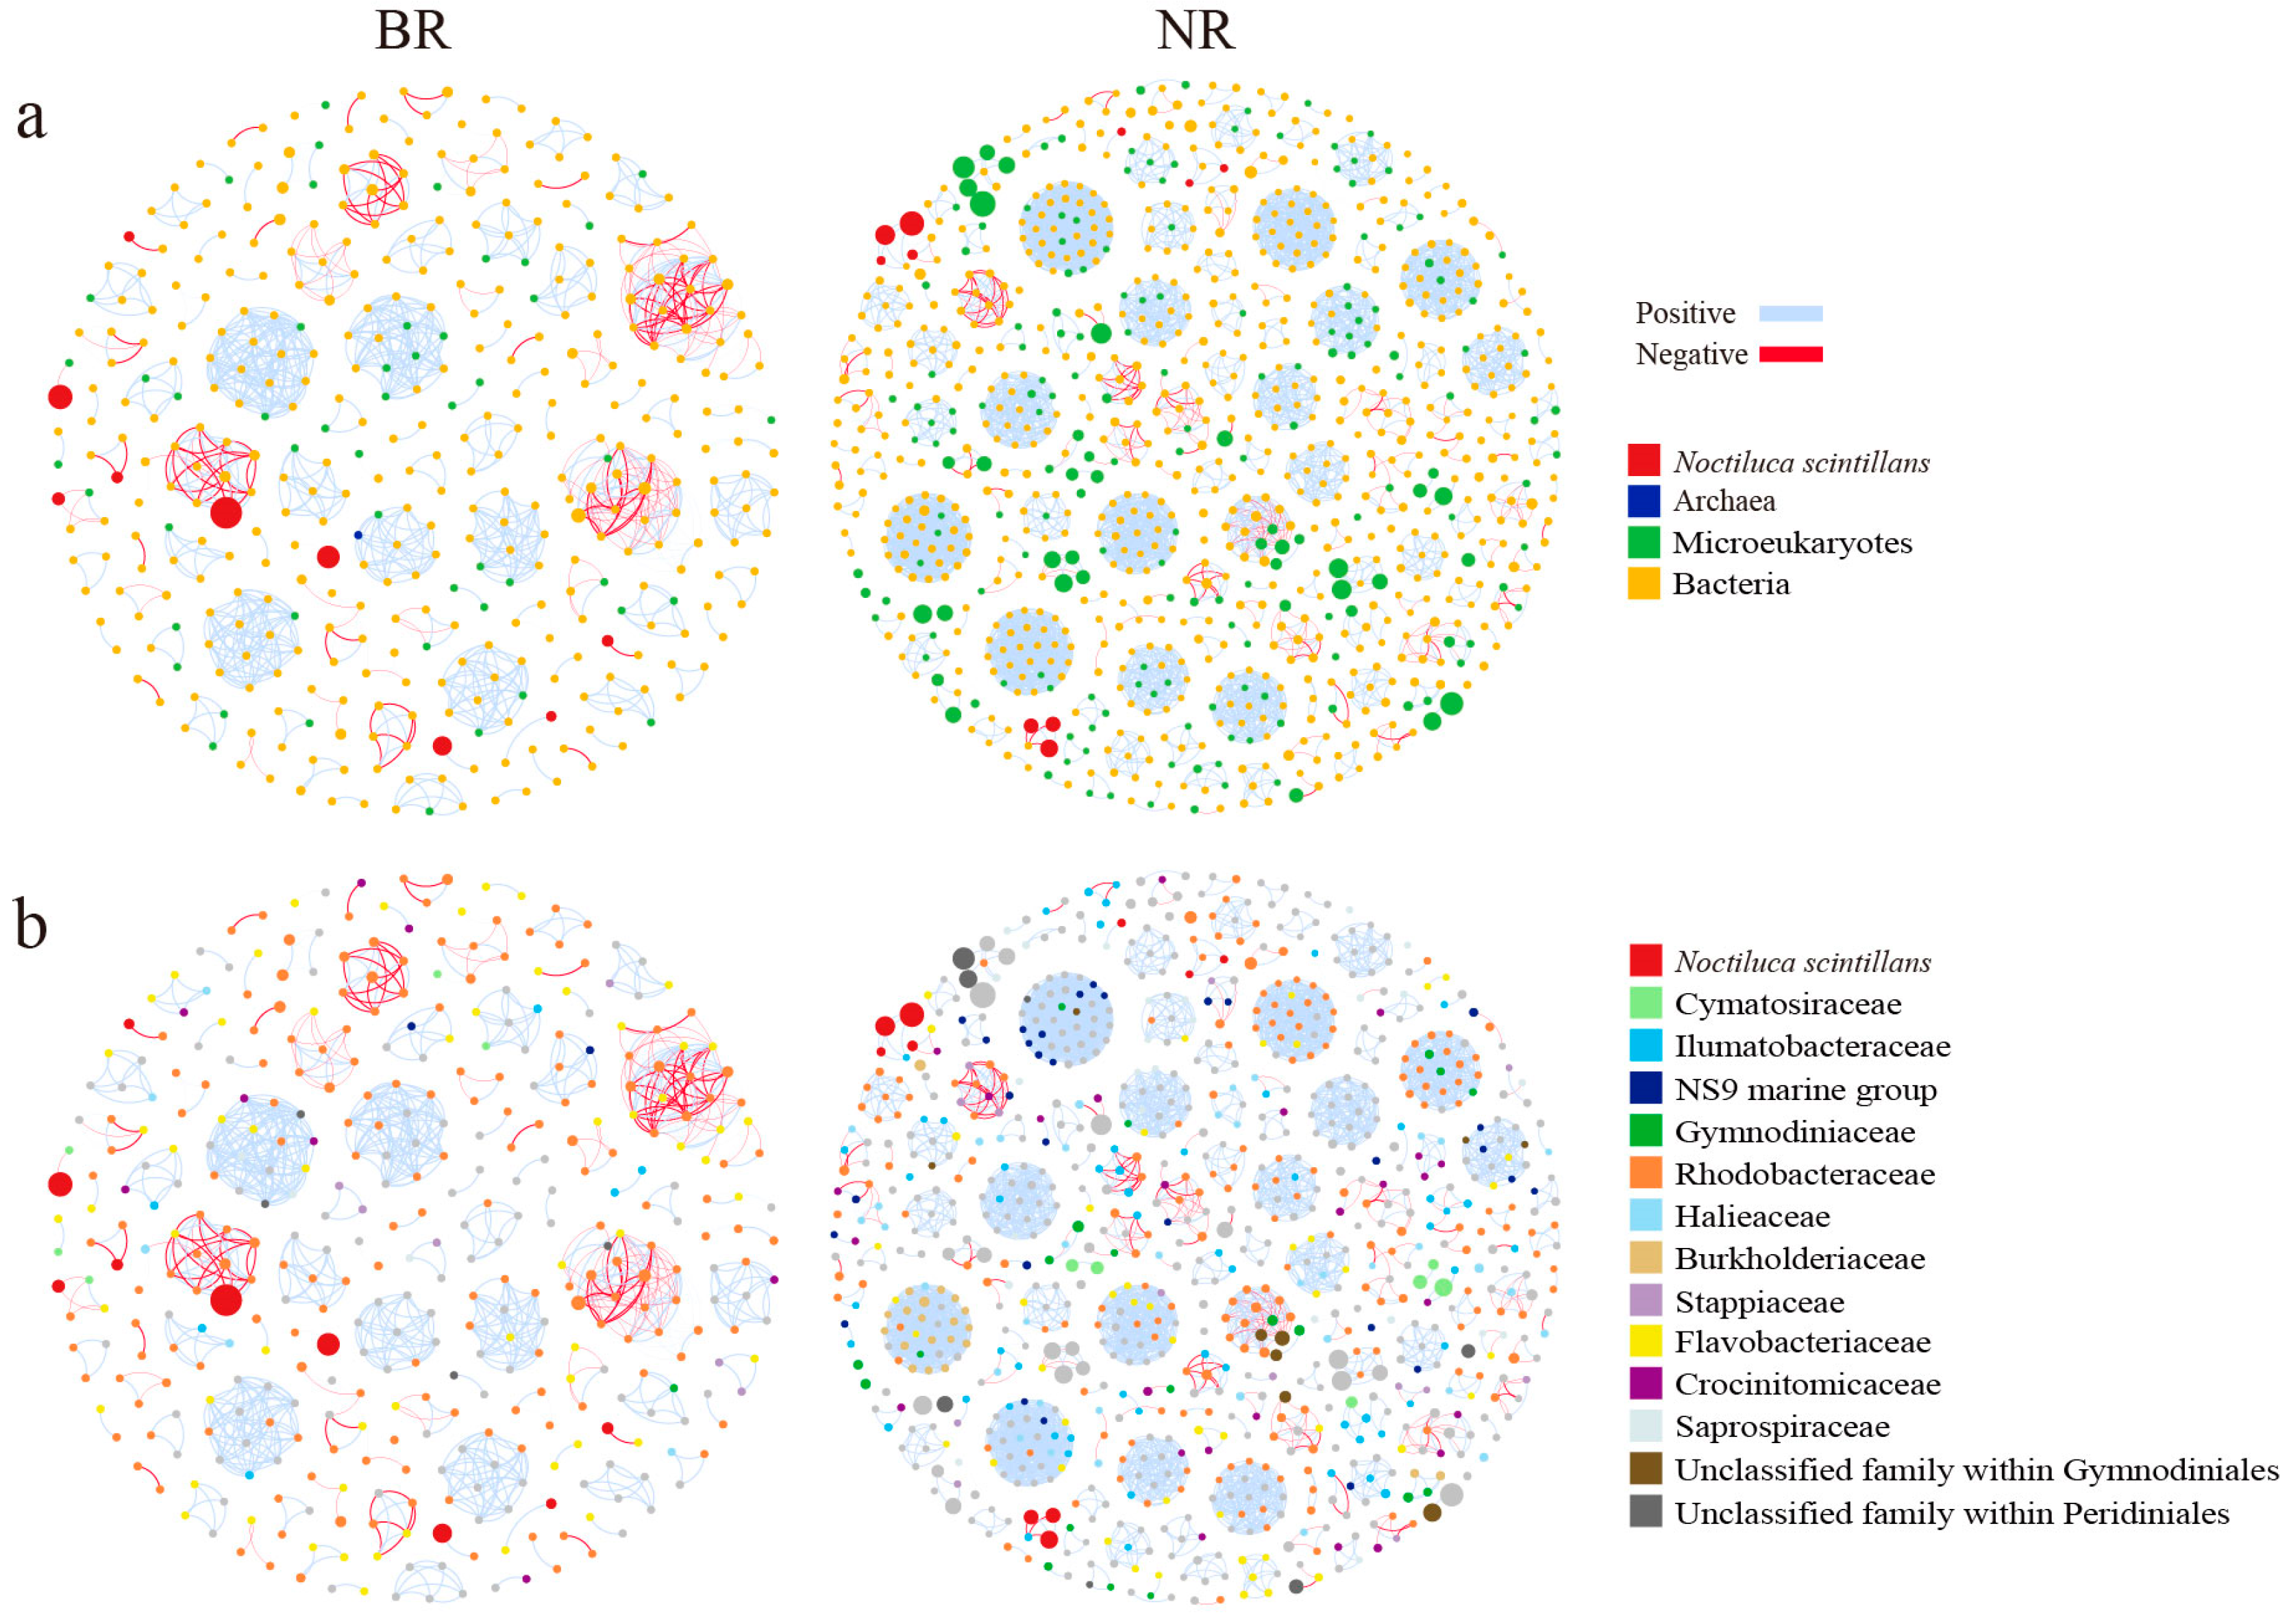
The main modules within the integrated networks of the BR and the NR exhibited significant differences. In the largest module containing negative correlations, the only microeukaryotic node in the BR network was from Peridiniales, whereas the microeukaryotic nodes in the NR network were predominantly from the family Gymnodiniaceae and other unclassified families within Gymnodiniales (Figure 7a,b). It was worth noting that as many as 33 nodes in the NR network were from Gymnodiniales, while only 1 node in the BR network was from Gymnodiniales. Regarding the largest module comprised entirely of prokaryotes with negative correlations, the nodes in the BR network were exclusively from Flavobacteriaceae and Rhodobacteraceae (Figure 7c). In contrast, the nodes in the NR network exhibited greater diversity, including members from Rhodobacteraceae, Stappiaceae, Crocinitomicaceae, and the NS9 marine group (Figure 7d). When considering the modules associated with N. scintillans, both the number of modules and the number of modules containing negative correlations in the BR network were notably greater than those in the NR network (Figure 7e,f). The nodes connected to N. scintillans in the BR network were notably less diverse, mostly belonging to Flavobacteriaceae and Rhodobacteraceae, while those in the NR network belonged to a broader range of taxa, i.e., Burkholderiaceae, Flavobacteriaceae, Crocinitomicaceae, Ilumatobacteraceae, Rhodobacteraceae, and Saprospiraceae (Figure 7e,f). It was noteworthy that in the BR network, the only microeukaryotic node that exhibited a significant negative correlation with N. scintillans was the ASVs from Minutocellus within Cymatosiraceae, whereas there were no microeukaryotic nodes significantly correlated with N. scintillans in the NR network (Figure 7e,f). Additionally, by the abovementioned comparisons, it was found that multiple Rhodobacteraceae ASVs were involved in these modules in both regions, while Flavobacteriaceae ASVs were more prevalent in the BR network (Figure 7).

3.5. Microbial Metabolic Functions

Gene prediction analysis indicated that the microbial communities in the BR exhibited multi-level metabolic reorganization characteristics compared to those in the NR (Figure 8). All analyses in this section are based on gene-level prediction results, and references to specific enzymes herein refer to the encoding genes of those enzymes.

3.5.1. Respiratory Chain

The genes for the aa3-type cytochrome c oxidase (aerobic type), including coxA, coxB, coxC, and coxD, were downregulated, while the genes for the cbb3-type cytochrome c oxidase (hypoxia-adaptive type), including ccoN, ccoO, ccoP, and ccoQ, were upregulated (Figure 8). Additionally, the genes encoding the alternative electron transfer pathway—nitrate reductase (NarGHI)—were also upregulated.

3.5.2. Fatty Acid Degradation, Methylmalonyl-CoA Pathway, and TCA Cycle

In the metabolic process of fatty acid degradation, long-chain fatty acid-CoA ligase (EC 6.2.1.3), a key enzyme in the β-oxidation pathway, was found to be upregulated (Figure 8). This upregulation suggests an enhancement of the fatty acid degradation pathway, leading to increased production of acetyl-CoA and propionyl-CoA. At the same time, key enzymes in the methylmalonyl-CoA pathway, such as methylmalonyl-CoA/ethylmalonyl-CoA epimerase (EC 5.1.99.1) and the alpha subunit of propionyl-CoA carboxylase (EC 6.4.1.3), were upregulated. Furthermore, acetyl-CoA C-acetyltransferase (EC 2.3.1.9), which serves as a link between these two pathways, was significantly upregulated. This indicates that acetyl-CoA and propionyl-CoA produced through β-oxidation might enter the methylmalonyl-CoA pathway, thereby enhancing its functionality.

3.5.3. Pyruvate Metabolism and Gluconeogenesis

In the pyruvate metabolic pathway, key enzymes such as malate synthetase (EC 2.3.3.9), malate dehydrogenase (decarboxylating, NADP+, EC 1.1.1.40), and the core components of the pyruvate dehydrogenase complex (EC 1.2.4.1, EC 2.3.1.12) were found to be upregulated (Figure 8). Additionally, the upregulation of gluconeogenic rate-limiting enzymes, including pyruvate carboxylase (EC 6.4.1.1), ATP-dependent phosphoenolpyruvate carboxykinase (EC 4.1.1.49), and fructose-1,6-diphosphatase (EC 3.1.3.11), indicates enhanced gluconeogenic flux with increased glucose production efficiency.

3.5.4. Branched-Chain Amino Acid Metabolism

The genes encoding the components of the branched-chain amino acid transport system in the ABC transport family, including livM, livK, livH, livG, and livF, were significantly upregulated in the BR (Figure 8). This indicates an increased capacity for branched-chain amino acid transport by microorganisms in this region. Although there were no significant differences in the genes related to ammonia transport, their relative abundances were high in both regions (e.g., the AmtB gene: BR: 0.088%; NR: 0.086%), suggesting that the ability of microorganisms to actively acquire ammonia was comparable between the two regions. Additionally, branched-chain amino acid degradation was markedly upregulated in the BR, particularly highlighted by the upregulation of key enzymes unique to the leucine degradation pathway—leucine dehydrogenase (EC 1.4.1.9), isovaleryl-CoA dehydrogenase (EC 1.3.8.4), and 3-methylcrotonyl-CoA carboxylase alpha subunit (EC 6.4.1.4), as well as the enzyme specific to the valine degradation pathway—valine dehydrogenase (EC 1.4.1.23) and the key enzyme unique to isoleucine metabolism—3-hydroxyacyl-CoA dehydrogenase (EC 1.1.1.35). Furthermore, acyl-CoA dehydrogenase (EC 1.3.8.7), a key enzyme common to all branched-chain amino acid degradation pathways, was also upregulated. Enzymes that convert the metabolic products of branched-chain amino acids into acetyl-CoA, acetoacetate, and propionyl-CoA, such as 3-hydroxy-3-methylglutaryl-CoA lyase (EC 4.1.3.4) and 3-hydroxyisobutyryl-CoA dehydrogenase (EC 1.1.1.31), were also upregulated.

3.5.5. Nitrogen Metabolism

In nitrogen metabolism, the pathways for ammonia production in the BR—reduction and nitrogen fixation—were significantly downregulated compared to the NR (Figure 8). This was reflected by the downregulation of nitrite reductase (EC 1.7.1.15, EC 1.7.7.1, EC 1.7.2.2), which catalyzes the reduction in nitrite to ammonia, and nitrogenase (EC 1.18.6.1), which catalyzes the conversion of nitrogen gas to ammonia. However, the nitrate reductase (EC 1.7.5.1; encoding genes NarGHI), which catalyzes the first step of nitrate reduction, was upregulated. The process of denitrification was overall active, as indicated by the upregulation of nitrate reductase (EC 1.7.5.1) (the same as the first step of nitrate reduction), nitric oxide reductase (EC 1.7.2.5), and nitrous oxide reductase (EC 1.7.2.4). Nevertheless, the nitrite reductase (NO-forming) (EC 1.7.2.1), which catalyzes the second step of denitrification, was downregulated. Ammonia assimilation in the BR was significantly upregulated, specifically indicated by the upregulation of glutamate dehydrogenase (NAD(P)+) (EC 1.4.1.3) and glutamine synthetase (EC 6.3.1.2). Isocitrate dehydrogenase (EC 1.1.1.42) in the TCA cycle in the BR was also upregulated, which is beneficial for providing sufficient α-ketoglutarate for ammonia assimilation.

4. Discussion

4.1. Relationship Between the Noctiluca scintillans Bloom and Environmental Conditions

In this study, it was found that the relative abundance of N. scintillans was much higher in the surface layer than in the bottom layer, which was consistent with the results of previous studies on the spatial pattern of N. scintillans [24,35]. This is, on one hand, due to the characteristics of the N. scintillans cells, which contain a large ammonia-filled vesicle inside, making them less dense and more buoyant, and they can release large amounts of mucus, making it easier for the cells to aggregate [36,37]. On the other hand, it might be attributed to the fact that the tidal and current patterns in the coastal waters of Qinhuangdao facilitated the congregation of N. scintillans in the surface layers [24].
It is generally believed that the outbreak of HABs is related to the combined effects of suitable physical, chemical, and hydrometeorological factors, and the intensity and dynamics of which can also cause the occurrence of N. scintillans blooms [38]. In this study, we found that the physicochemical properties of seawater between the BR and the NR exhibited significant differences in both the surface and bottom layers, whereas the difference in the middle layer was not pronounced. Although the surface temperature in the BR was significantly lower than that in the NR, the Spearman correlation test showed that the correlation between the relative abundance of N. scintillans and temperature was not significant. This was due to the temperatures in both regions being within the general temperature range for N. scintillans blooms (18.0–25.0 °C) [25], and thus temperature was not the primary factor responsible for the formation of N. scintillans blooms.
The levels of PO43−-P and NH4+-N in the surface waters of the BR, as well as the concentrations of NO2-N and NO3-N in the bottom waters of the BR, were significantly higher compared to those in the NR. Spearman correlation analysis revealed a significant positive correlation between the relative abundance of N. scintillans and NH4+-N concentration. Previous studies have shown that N. scintillans blooms are often associated with elevated levels of dissolved inorganic nutrients, including inorganic nitrogen, active phosphates, and soluble silicates, along with increased concentrations of trace elements [39]. This relationship may stem from abundant nutrients that support the growth of photosynthetic autotrophs, such as diatoms, which in turn provide ample prey for N. scintillans, facilitating its growth and reproduction [39]. Another scenario occurs when N. scintillans blooms transition to the diffusion phase; as many algal cells age and die, intracellular nutrients and organic matter are released into the seawater through cell lysis, leading to fluctuations in nutrient levels within the marine environment [40,41,42]. The nutrient vertical profiles showed that the elevated levels of PO43−-P and NH4+-N were confined to the surface waters of the BR and were not observed at adjacent sites closer to shore. Therefore, the localized high nutrient levels likely result from nutrient release by N. scintillans cells rather than from terrestrial runoff or upwelling. The substantial accumulation of NH4+-N within the vesicles of N. scintillans ruptures during cellular senescence, releasing nitrogenous compounds such as ammonium, nitrate, and urea into the seawater [37]. Urea can subsequently be converted to ammonium through microbial metabolism, further elevating ammonium levels in the environment [43]. Similarly, the increase in phosphate may be attributed to cell lysis, which releases polyphosphate and organic phosphorus, thereby temporarily boosting bioavailable phosphate.

4.2. Impacts of the N. scintillans Bloom on Prokaryotic and Microeukaryotic Community Structure

It was observed that the α-diversity indices of both prokaryotic and microeukaryotic communities were significantly lower in the BR compared to the NR. This decrease was primarily due to the overwhelming dominance of N. scintillans in the BR, which suppressed the growth of other microeukaryotes and simultaneously triggered a rapid increase in the proportions of specific prokaryotes, allowing them to achieve absolute dominance. Results of PERMANOVA and the Wilcoxon rank-sum test indicated significant differences in the compositions of prokaryotic and microeukaryotic communities between the BR and NR, particularly in the surface waters. The dominant prokaryotic taxa that were significantly higher in the surface waters of the BR compared to the NR included Nautella, Marivivens and Lutimaribacter, which were all from the Rhodobacteraceae family. Rhodobacteriaceae are known to increase in abundance during phytoplankton blooms, as they consume freshly synthesized organic matter and are often associated with particles [44,45,46,47]. Moreover, N. scintillans hosts a significant proportion of endocytic Rhodobacteriaceae [45].
According to the results of FS, both prokaryotic and microeukaryotic community compositions exhibited significant correlations with various environmental factors. The variation in prokaryotic community composition was significantly correlated with factors including NO2-N, SiO32−-Si, DO, depth, salinity, NH4+-N and temperature. In contrast, the microeukaryotic community composition showed significant correlations with NO2-N, PO43−-P, SiO32−-Si, NH4+-N, depth, pH and salinity. It was evident that nutrient levels were closely linked to both the prokaryotic and microeukaryotic community structures. Among the dominant microeukaryotic taxa, Dino-Group-I-Clade-1_X, which belongs to the parasitic Syndiniales, showed a positive correlation with NO2-N. This lineage exhibited high relative abundance in the middle and bottom waters of the BR, likely due to the relatively high abundance of its host dinoflagellates in those same layers, where nutrient levels were sufficient, though N. scintillans were less abundant compared to the surface layer. Among the dominant prokaryotic taxa, those with higher relative abundances in the surface waters of the BR, such as Nautella and Marivivens, exhibited positive correlations with NO2-N and SiO32−-Si, respectively. Notably, the distribution of Nautella differed from that of Marivivens, as Nautella also showed higher relative abundances in the middle and bottom waters of the BR. Their distributions were presumably related primarily to the availability of organic matter they feed on, while their correlations with specific nutrients may be attributed to the collinearity between these nutrients and distinct types of organic matter.

4.3. Impacts of the N. scintillans Bloom on Microbial Interactions

Microbial co-occurrence networks can be applied to elucidate the complexity and interactions within microbial communities [48]. Various network topological parameters can reflect the network complexity, and the higher the network complexity, the higher the stability of the microbial network and the stronger the ability to adapt to changes in the external environment [49]. In this study, we analyzed integrated co-occurrence networks of prokaryotes and microeukaryotes, revealing that the number of nodes, edges, and the average degree of the BR network were significantly lower than those of the NR network. This finding indicated that the BR network exhibited lower complexity compared to the NR network. Furthermore, the average path length and betweenness centrality were higher in the BR network, while the number of modules was fewer. These characteristics suggested that the BR microbial network depended predominantly on nodes with higher betweenness centrality, demonstrating reduced connectivity and a lack of redundant pathways [50]. Consequently, if specific modules within the BR network were disrupted, it would be challenging to maintain functionality through alternative pathways, emphasizing the inherent vulnerability of the BR network and its lower stability. In contrast, the microbial communities in the NR exhibit a more intricate and stable network structure. Analysis of independent prokaryotic networks further confirmed that the complexity of the microbial network in the BR was noticeably lower than that in the NR. These findings indicate that the observed bloom of N. scintillans reduced the complexity and stability of the microbial network. However, HABs do not universally reduce the complexity of microbial networks; some studies suggest that the complexity may actually increase during HABs [51,52]. These contrasting effects likely reflect the distinct food web structures associated with different algal bloom scenarios.
Nodes with high betweenness centrality are often identified as keystone taxa, which play an important role in maintaining community stability [53]. Keystone taxa exert considerable influence on community composition, and their absence can result in substantial losses of community members [54]. Depending on the interaction topology and type (beneficial/antagonistic), keystone species can either promote or reduce species richness. In the BR network, the nodes exhibiting the highest betweenness centrality were predominantly from Flavobacteriaceae and Rhodobacteraceae, indicating their crucial contribution to network complexity and stability. Flavobacteriaceae can efficiently convert high molecular weight (HMW) compounds derived from phytoplankton, such as amino acids, organic acids, carbohydrates, and sugar alcohols, into low molecular weight (LMW) substances, including polysaccharides, proteins, nucleic acids, and lipids [46,55]. Rhodobacteriaceae are generally capable of degrading LMW carbohydrates and are thought to capitalize on partial degradation of algal exudates by other bacteria in the phycosphere [55]. Our results showed that the keystone taxa in the BR network included ASVs from the genus Aurantivirga within Flavobacteriaceae, as well as from HIMB11 and Donghicola within Rhodobacteraceae. Aurantivirga is recognized as one of the earliest responders to phytoplankton blooms, exhibiting a copiotrophic lifestyle characterized by rapid cycles of proliferation and decline. This dynamic is facilitated by its ability to outcompete other taxa through the digestion of algae-derived polysaccharides [56]. HIMB11 possesses genetic potential for degrading the algae-derived compound dimethysulfoniopropionate (DMSP), potentially increasing emissions of the gas dimethylsulfide (DMS) during N. scintillans blooms [45]. Donghicola is known to degrade bacteria-derived dissolved organic matter (DOM) and probably bacteria-derived lipids [57]. These taxa within Flavobacteriaceae and Rhodobacteraceae can synergistically remineralize larger components of phytoplankton organic matter [47]. The interplay among them, along with their distinct interactions with N. scintillans, played a crucial role in sustaining the stability of the integrated network during the bloom.
Positive correlations accounted for a proportion as high as 94.1% in the NR network, suggesting that the microorganisms have similar preferences and cooperative behaviors, i.e., cross-feeding, syntrophic interactions, and mutualistic interactions [58,59]. In contrast, in the BR network, although most of the correlations between the nodes were positive, there was also a certain proportion (20.9%) of negative correlations, which was much higher than that in the NR network. An increase in negative microbial correlations caused by algal blooms has also been described in other studies [60]. Negative correlations reflect antagonistic relationships among microorganisms, including competition, parasitism, and pathogenic relationships [53]. Among these antagonistic relationships, competitive relations may be the most prevalent, because the ecological niches of dominant microbial taxa in the BR were relatively similar and the utilization of similar resources intensified their competition.
In microbial co-occurrence networks, a module usually represents a group of microorganisms that interact strongly among themselves but little with taxa in other modules [50]. We compared the largest modules containing prokaryotes and microeukaryotes, the largest modules containing only prokaryotes, and the module associated with N. scintillans in the two regions. The nodes in the BR network were significantly less diverse at the family level, primarily belonging to Flavobacteriaceae and Rhodobacteraceae, whereas the nodes in the NR network belonged to more diverse families. Additionally, multiple Rhodobacteraceae ASVs were involved in these modules in both regions, while Flavobacteriaceae ASVs were more prevalent in the NR network. This indicated that the role of Flavobacteriaceae was significantly enhanced in the BR network compared to the NR network, due to their rapid response to the abundant algae-derived DOM produced during the bloom [46].
The number of modules associated with N. scintillans nodes in the BR network was greater than in the NR network, and a higher number of negative correlations were observed within these modules. Specifically, N. scintillans exhibited a negative correlation with the ASV from Minutocellus solely in the BR network. The genus Minutocellus showed a significantly higher relative abundance in the middle and bottom layers of the BR compared to the NR, while no significant difference was observed in the surface waters between the two regions. Minutocellus has been identified as a dominant symbiotic group associated with brown algae blooms caused by Aureococcus anophagefferens in the coastal waters of Qinhuangdao [61]. Minutocellus can grow and reproduce by utilizing nutrients such as nitrate, ammonia nitrogen, and organic nitrogen [62]. The observed negative correlation between Minutocellus and N. scintillans, along with the distribution characteristics of Minutocellus in the water column in the BR, might be attributed to the higher nutrient levels in the coastal waters of Qinhuangdao, which likely facilitated the reproduction of Minutocellus, thereby providing a nutritional basis for the bloom of N. scintillans [63]. However, this hypothesis remains speculative, and we expect that future studies conducted at multiple time points will provide further insights into the predation-prey relationships during HABs.

4.4. Impacts of the N. scintillans Bloom on Microbial Metabolism

The upregulation of hypoxia-adaptive cytochrome oxidase genes in the electron transport chain [64], along with the upregulation of nitrate reductase genes representing an alternative electron transfer pathway, indicates that in the bloom environment, the aerobic energy-production pathway in microorganisms might no longer be the sole dominant energy-generating process. Instead, anaerobic energy metabolism utilizing nitrate as an electron acceptor was enhanced [65,66]. A possible reason for this is that although the DO levels in the BR were not low, the high organic matter content could facilitate the aggregation of microbial communities, which leads to the formation of local hypoxic microenvironments characterized by a relative deficiency of electron acceptors, thereby promoting enhanced anaerobic metabolic processes.
The upregulation of key enzymes in the β-oxidation pathway suggests that this process might lead to an increased production of acetyl-CoA and propionyl-CoA. Additionally, the upregulation of key enzymes in the methylmalonyl-CoA pathway, along with those linking acetyl-CoA and propionyl-CoA to this pathway, indicates that acetyl-CoA and propionyl-CoA generated from β-oxidation could be utilized by the methylmalonyl-CoA pathway to convert into succinyl-CoA [67,68], which then enters the TCA cycle. This enhanced process facilitates the complete oxidation of unconventional carbon sources, such as odd-chain fatty acids, thereby maximizing energy utilization.
The upregulation of fatty acid degradation pathways could improve the efficiency of acetyl-CoA production. In the pyruvate metabolic pathway, the simultaneous enhancement of two consecutive steps—the conversion of acetyl-CoA to malate by malate synthase and the subsequent transformation of malate to pyruvate by malate dehydrogenase [69,70]—was likely linked to the availability of ample acetyl-CoA substrates. This sequential upregulation could facilitate the conversion of acetyl-CoA into pyruvate, thereby stimulating the gluconeogenic pathway that uses pyruvate as a substrate. The upregulation of multiple key enzymes in gluconeogenesis supports this hypothesis to a certain extent. The resulting fructose-6-phosphate might enter the biosynthetic pathway of UDP-N-acetylglucosamine and participate in the synthesis of materials that constitute cellular structures, such as glycosaminoglycans and ribose.
The upregulation of two specific enzymes involved in the deamination of leucine and valine, alongside a lack of significant changes in branched-chain amino acid transaminases, suggests that in addition to acquiring ammonia through ammonia transport proteins, there might exist a potential relationship whereby leucine or valine, under the catalysis of their specific deaminating enzymes [71,72], produce free ammonia that can be captured and utilized by glutamine synthetase or glutamate dehydrogenase. Moreover, the upregulation of enzymes converting branched-chain amino acid metabolic products into acetyl-CoA, acetoacetate, and propionyl-CoA indicates that the end products of branched-chain amino acid metabolism were being transformed into active intermediate metabolites [68]. These metabolites could be integrated into structural cellular components through processes such as gluconeogenesis or via the methylmalonyl pathway, ultimately entering energetic pathways such as the TCA cycle.
In nitrogen metabolism, the nitrite reductase that catalyzes the reduction in nitrite to ammonia and the nitrogenase that facilitates the conversion of nitrogen gas to ammonia were both downregulated in the BR. This might be due to the high concentration of ammonia, a product of these enzymatic reactions, which exerts a negative feedback regulation on the enzymes, leading to suppression of the ammonia production pathway [73,74]. Conversely, the gene for nitrate reductase, NarGHI, which catalyzes the initial step in nitrate reduction, was upregulated. This might be due to the low-oxygen or micro-oxic conditions created by high organic matter content in the BR [75]. Under these conditions, the limited availability of oxygen as an electron acceptor allowed nitrate to serve both as an electron acceptor and as a means to establish a transmembrane proton gradient, thereby supporting ATP synthesis through alternative electron transport pathways and compensating for energy production limitations in low-oxygen environments.
The process of denitrification appeared to be highly active in the BR, as indicated by the upregulation of nitrate reductase, nitric oxide reductase, and nitrous oxide reductase. This suggests that the primary fate of nitrate in this environment was denitrification, leading to the release of nitrogen gas from seawater rather than its reduction to ammonia. However, the downregulation of nitrite reductase (NO-type), which catalyzes the second step of the denitrification process, indicates that the efficiency of denitrification might be limited. This could be attributed to the suppression of enzyme expression in a micro-oxic environment [76].
Furthermore, the nitrogen assimilation processes in the BR were significantly upregulated, suggesting that microorganisms tended to convert ammonia into biologically available organic nitrogen. This is specifically shown by the upregulation of glutamate dehydrogenase and glutamine synthetase, where the former catalyzes the condensation of α-ketoglutarate with ammonia to form glutamate, and the latter catalyzes the condensation of glutamate with ammonia to form glutamine. These enzymatic processes are crucial pathways for microbial ammonia assimilation. Notably, α-ketoglutarate, a substrate for glutamate dehydrogenase, primarily originates from the tricarboxylic acid (TCA) cycle. The upregulation of isocitrate dehydrogenase in the TCA cycle within the BR ensured a sufficient supply of α-ketoglutarate, thereby maintaining the continuity of ammonia assimilation pathways. By converting ammonia into neutral, non-toxic glutamine, microorganisms might effectively alleviate ammonia toxicity in the high-ammonia environment of the BR, representing a key strategy for surviving in such conditions.

5. Conclusions

This study conducted a comparative analysis of the environmental conditions, microbial community structure, interactions, and metabolic features between the BR and NR, aiming for a better understanding of the causes and ecological impacts of Noctiluca scintillans blooms. Our findings revealed elevated inorganic nutrient levels in the BR, likely creating conditions favorable for the proliferation of autotrophic phytoplankton, such as Minutocellus spp., which ultimately led to the occurrence of the N. scintillans bloom.
This bloom significantly altered the community structure and diversity of prokaryotes and microeukaryotes in the pelagic environment. Specifically, the α-diversity indices for both prokaryotic and microeukaryotic communities were significantly lower in the BR compared to the NR. This decline was primarily due to the dominance of N. scintillans, which suppressed the growth of other microeukaryotes while simultaneously triggering a rapid increase in specific prokaryotic proportions. Furthermore, the bloom reduced the complexity and stability of the microbial co-occurrence network and significantly impacted the composition of keystone taxa. The keystone taxa within several complex modules of the BR network predominantly belonged to Rhodobacteriaceae and Flavobacteriaceae, suggesting that these taxa played crucial roles in maintaining network stability. In contrast, the taxa in the NR network exhibited greater diversity.
The N. scintillans bloom also induced a shift in microbial metabolic patterns. Despite ambient oxygen availability in the bloom environment, the microbial community transitioned from predominantly aerobic respiration to energy-yielding pathways adapted to micro-oxic/anoxic conditions. This shift likely resulted from localized oxygen depletion within micro-niches, driven by intense microbial competition for carbon sources in the high organic matter environment. Microbial communities in the BR optimized carbon substrate utilization by enhancing the degradation of fatty acids and branched-chain amino acids, channeling the resulting metabolites directly into the TCA cycle or via the methylmalonyl-CoA pathway for TCA cycle entry. While the TCA cycle was partially downregulated, these communities managed to maintain a balance between gluconeogenesis and energy production through flexible interconversion of pyruvate and malate. Additionally, in the nitrogen cycle, ammonium-mediated feedback inhibition suppressed ammonium-generating processes (e.g., nitrogen fixation), while denitrification pathways were significantly upregulated, becoming the dominant process for nitrogen transformation.
In summary, our research underscores the intricate relationships between nutrient enrichment, microbial community dynamics, and metabolic responses that collectively drive the ecological shifts associated with a N. scintillans bloom, highlighting the need for further investigation into the implications of these interactions on marine ecosystem health.

Supplementary Materials

The following supporting information can be downloaded at: https://www.mdpi.com/article/10.3390/microorganisms13081959/s1, Figure S1. Vertical distribution of the measured environmental factors. The star indicates the location of the blooming region (BR), and the red box highlights the vertical distribution of these factors within the BR. Figure S2. Venn diagram based on the prokaryotic (a) and microeukaryotic (b) ASVs in the blooming region (BR) and the non-blooming region (NR). Figure S3. Correlations between the relative abundance of Noctiluca scintillans and environmental factors. Figure S4. Comparison of the independent prokaryotic (a) and microeukaryotic (b) co-occurrence networks between the blooming region (BR) and the non-blooming region (NR). Nodes indicate individual ASVs and edges indicate significant correlations. The size of each node corresponds to the abundance of ASV, while the thickness of the connecting edges represents the strength of the correlation. Table S1. Depth of sampling layers. Table S2. Comparison of topological properties of the independent prokaryotic and microeukaryotic networks between the blooming region (BR) and the non-blooming region (NR). Table S3. Comparison of the keystone taxa with the highest betweenness centrality in independent prokaryotic and microeukaryotic networks between the blooming region (BR) and the non-blooming region (NR).

Author Contributions

Conceptualization, Y.W.; methodology, Y.W., M.Z. and X.Y.; software, M.Z. and X.Y.; validation, Y.W.; formal analysis, Y.W., M.Z. and X.Y.; investigation, Y.W.; data curation, Y.W.; writing—original draft preparation, Y.W., M.Z. and X.Y.; writing—review and editing, Y.W., M.Z., X.Y., Y.C., D.S. and Z.L.; visualization, M.Z. and X.Y.; project administration, Y.W. and Z.L.; funding acquisition, Y.W., Y.C., D.S. and Z.L. All authors have read and agreed to the published version of the manuscript.

Funding

This research was funded by the National Natural Science Foundation of China (42206161), the Hebei Natural Science Foundation (D2022407004 & D2025407004), and the Science Research Project of Hebei Education Department (QN2025066).

Institutional Review Board Statement

Not applicable.

Informed Consent Statement

Not applicable.

Data Availability Statement

All the raw sequence files of this study were submitted to the National Center for Biotechnology Information (NCBI) with the study accession number PRJNA1187025. All data are available upon request to the authors.

Conflicts of Interest

The authors declare no conflicts of interest.

References

  1. Cai, R.; Han, Z.; Yang, Z. Impacts and risks of changing ocean on marine ecosystems and dependent communities and related responses. Clim. Change Res. 2020, 16, 182–193, (In Chinese with English Abstract). [Google Scholar]
  2. Hooper, D.U.; Adair, E.C.; Cardinale, B.J.; Byrnes, J.E.; Hungate, B.A.; Matulich, K.L.; Gonzalez, A.; Duffy, J.E.; Gamfeldt, L.; O’Connor, M.I. A global synthesis reveals biodiversity loss as a major driver of ecosystem change. Nature 2012, 486, 105–108. [Google Scholar] [CrossRef] [PubMed]
  3. Berdalet, E.; Kudela, R.M.; Urban, E.; Enevoldsen, H.O.; Banas, N.S.; Bresnan, E.; Burford, M.A.; Davidson, K.; Gobler, C.J.; Karlson, B.; et al. GlobalHAB: A new program to promote international research, observations, and modeling of harmful algal blooms in aquatic systems. Oceanography 2017, 30, 70–81. [Google Scholar] [CrossRef]
  4. Berdalet, E.; Fleming, L.E.; Gowen, R.; Davidson, K.; Hess, P.; Backer, L.C.; Moore, S.K.; Hoagland, P.; Enevoldsen, H. Marine harmful algal blooms, human health and wellbeing: Challenges and opportunities in the 21st century. J. Mar. Biol. Assoc. U. K. 2015, 96, 61–91. [Google Scholar] [CrossRef]
  5. Brown, A.R.; Lilley, M.K.S.; Shutler, J.D.; Lowe, C.D.; Artioli, Y.; Torres, R.; Berdalet, E.; Tyler, C.R. Assessing risks and mitigating impacts of harmful algal blooms on mariculture and marine fisheries. Rev. Aquac. 2019, 12, 1663–1688. [Google Scholar] [CrossRef]
  6. Yan, T.; Li, X.-D.; Tan, Z.-J.; Yu, R.-C.; Zou, J.-Z. Toxic effects, mechanisms, and ecological impacts of harmful algal blooms in China. Harmful Algae 2022, 111, 102148. [Google Scholar] [CrossRef]
  7. Carnicer, O.; Guallar, C.; Andree, K.B.; Diogène, J.; Fernández-Tejedor, M. Ostreopsis cf. ovata dynamics in the NW Mediterranean Sea in relation to biotic and abiotic factors. Environ. Res. 2015, 143, 89–99. [Google Scholar] [PubMed]
  8. Demuez, M.; González-Fernández, C.; Ballesteros, M. Algicidal microorganisms and secreted algicides: New tools to induce microalgal cell disruption. Biotechnol. Adv. 2015, 33, 1615–1625. [Google Scholar] [CrossRef] [PubMed]
  9. Gerphagnon, M.; Latour, D.; Colombet, J.; Sime-Ngando, T. Fungal parasitism: Life cycle, dynamics and impact on cyanobacterial blooms. PLoS ONE 2013, 8, e60894. [Google Scholar] [CrossRef]
  10. Jingzhong, Z.; Liping, D.; Baoping, Q. Preliminary studies on eutrophication and red tide problems in Bohai Bay. Hydrobiologia 1985, 127, 27–30. [Google Scholar] [CrossRef]
  11. Adachi, M.; Kanno, T.; Okamoto, R.; Itakura, S.; Yamaguchi, M.; Nishijima, T. Population structure of Alexandrium (Dinophyceae) cyst formation-promoting bacteria in Hiroshima Bay, Japan. Appl. Environ. Microbiol. 2003, 69, 6560–6568. [Google Scholar] [CrossRef]
  12. Zhou, J.; Lyu, Y.; Richlen, M.L.; Anderson, D.M.; Cai, Z.H. Quorum sensing is a language of chemical signals and plays an ecological role in algal-bacterial interactions. Crit. Rev. Plant Sci. 2016, 35, 81–105. [Google Scholar] [CrossRef] [PubMed]
  13. Faust, K.; Raes, J. Microbial interactions: From networks to models. Nat. Rev. Microbiol. 2012, 10, 538–550. [Google Scholar] [CrossRef] [PubMed]
  14. De Roy, K.; Marzorati, M.; van den Abbeele, P.; van de Wiele, T.; Boon, N. Synthetic microbial ecosystems: An exciting tool to understand and apply microbial communities. Environ. Microbiol. 2014, 16, 1472–1481. [Google Scholar] [CrossRef] [PubMed]
  15. Furbino, L.E.; Godinho, V.M.; Santiago, I.F.; Pellizari, F.M.; Alves, T.M.; Zani, C.L.; Junior, P.A.; Romanha, A.J.; Carvalho, A.G.; Gil, L.H.; et al. Diversity patterns, ecology and biological activities of fungal communities associated with the endemic macroalgae across the Antarctic peninsula. Microb. Ecol. 2014, 67, 775–787. [Google Scholar] [CrossRef]
  16. Seymour, J.R.; Amin, S.A.; Raina, J.B.; Stocker, R. Zooming in on the phycosphere: The ecological interface for phytoplankton-bacteria relationships. Nat. Microbiol. 2017, 2, 17065. [Google Scholar] [CrossRef]
  17. Matcher, G.; Lemley, D.A.; Adams, J.B. Bacterial community dynamics during a harmful algal bloom of Heterosigma akashiwo. Aquat. Microb. Ecol. 2021, 86, 153–167. [Google Scholar] [CrossRef]
  18. Zhou, J.; Lao, Y.-m.; Song, J.-t.; Jin, H.; Zhu, J.-m.; Cai, Z.-h. Temporal heterogeneity of microbial communities and metabolic activities during a natural algal bloom. Water Res. 2020, 183, 116020. [Google Scholar] [CrossRef]
  19. Chen, Y.; Wang, L.; Liu, Z.; Su, D.; Wang, Y.; Qi, Y. Biodiversity and interannual variation of harmful algal bloom species in the coastal sea of Qinhuangdao, China. Life 2023, 13, 192. [Google Scholar] [CrossRef]
  20. Zhang, W.; Ma, X.; Zhang, Y.-F.; Zhang, J.; Zhao, S.; Li, G.-M. An analysis of red tide characteristics in Qinhuangdao coastal seawater. Trans. Oceanol. Limnol. 2020, 5, 48–55, (In Chinese with English Abstract). [Google Scholar]
  21. Harrison, P.J.; Furuya, K.; Glibert, P.M.; Xu, J.; Liu, H.; Yin, K.; Lee, J.H.W.; Anderson, D.M.; Gowen, R.; Al-Azri, A.R.; et al. Geographical distribution of red and green Noctiluca scintillans. Chin. J. Oceanol. Limnol. 2011, 29, 807–831. [Google Scholar] [CrossRef]
  22. Morton, B.; Twentyman, P.R. The occurrence and toxicity of a red tide caused by Noctiluca scintillans (Macartney) Ehrenb., in the coastal waters of Hong Kong. Environ. Res. 1971, 4, 544–557. [Google Scholar] [CrossRef]
  23. Turkoglu, M. Red tides of the dinoflagellate Noctiluca scintillans associated with eutrophication in the Sea of Marmara (the Dardanelles, Turkey). Oceanologia 2013, 55, 709–732. [Google Scholar] [CrossRef]
  24. Xiang, C.; Tan, Y.; Zhang, H.; Liu, J.; Ke, Z.; Li, G. The key to dinoflagellate (Noctiluca scintillans) blooming and outcompeting diatoms in winter off Pakistan, northern Arabian Sea. Sci. Total Environ. 2019, 694, 133396. [Google Scholar] [CrossRef]
  25. Wang, K.; Lin, H.; Peng, C.; Sun, L.; Gao, Y.; Chen, B. Long-term changes in Noctiluca scintillans blooms along the Chinese coast from 1933 to 2020. Glob. Change Biol. 2023, 29, 5099–5113. [Google Scholar] [CrossRef]
  26. Ara, K.; Nakamura, S.; Takahashi, R.; Shiomoto, A.; Hiromi, J. Seasonal variability of the red tide-forming heterotrophic dinoflagellate Noctiluca scintillans in the neritic area of Sagami Bay, Japan: Its role in the nutrient-environment and aquatic ecosystem. Plankton Benthos Res. 2013, 8, 9–30. [Google Scholar] [CrossRef]
  27. Pithakpol, S.; Tada, K.; Montani, S. Ammonium and phosphate pools of Noctiluca scintillans and their supplies to the water column in Harima Nada, the Seto Inland Sea, Japan. La Mer 2000, 37, 153–162. [Google Scholar]
  28. Xia, X.; Cheung, S.; Zhang, S.; Lu, Y.; Leung, S.K.; Shi, Z.; Xu, H.; Gu, B.; Tan, Y.; Zeng, H.; et al. Noctiluca scintillans bloom alters the composition and carbohydrate utilization of associated bacterial community and enriches potential pathogenic bacterium Vibrio anguillarum. Water Res. 2024, 249, 120974. [Google Scholar] [CrossRef]
  29. Xia, X.; Leung, S.K.; Cheung, S.; Zhang, S.; Liu, H. Rare bacteria in seawater are dominant in the bacterial assemblage associated with the bloom-forming dinoflagellate Noctiluca scintillans. Sci. Total Environ. 2020, 711, 135107. [Google Scholar] [CrossRef]
  30. Parada, A.E.; Needham, D.M.; Fuhrman, J.A. Every base matters: Assessing small subunit rRNA primers for marine microbiomes with mock communities, time series and global field samples. Environ. Microbiol. 2016, 18, 1403–1414. [Google Scholar] [CrossRef]
  31. Amaral-Zettler, L.A.; McCliment, E.A.; Ducklow, H.W.; Huse, S.M. A method for studying protistan diversity using massively parallel sequencing of V9 hypervariable regions of small-subunit ribosomal RNA genes. PLoS ONE 2009, 4, e6372, Erratum in PLoS One 2009, 4. [Google Scholar] [CrossRef] [PubMed] [PubMed Central]
  32. Apprill, A.; McNally, S.P.; Parsons, R.J.; Weber, L. Minor revision to V4 region SSU rRNA 806R gene primer greatly increases detection of SAR11 bacterioplankton. Aquat. Microb. Ecol. 2015, 75, 129–137. [Google Scholar] [CrossRef]
  33. Oksanen, J. Vegan: Ecological diversity. R Proj. 2013, 368, 1–12. [Google Scholar]
  34. Liu, J.; Zhu, S.; Liu, X.; Yao, P.; Zhang, X.H. Spatiotemporal dynamics of the archaeal community in coastal sediments: Assembly process and co-occurrence relationship. ISME J. 2020, 14, 1463–1478. [Google Scholar] [CrossRef]
  35. Kordubel, K.; Martínez-Rincón, R.O.; Baschek, B.; Boersma, M.; Hieronymi, M.; Johns, D.G.; Kirstein, I.V.; Voynova, Y.G.; Möller, K.O. Long-term changes in spatiotemporal distribution of Noctiluca scintillans in the southern North Sea. Harmful Algae 2024, 138, 102699. [Google Scholar] [CrossRef]
  36. Zhou, C.; Wu, Y.; Zou, J. Nutrient dynamics of Noctiluca scintillans (Macartney). Oceanol. Limnol. Sin. 1994, 25, 152–157, (In Chinese with English Abstract). [Google Scholar]
  37. Elbrächter, M.; Qi, Z. Aspects of Noctiluca (Dinophyceae) population dynamics. In Proceedings of the NATO Advanced Study Institute, Physiological Ecology of Harmful Algal Blooms, Bermuda, UK, 27 May–6 June 1996; Springer: Berlin/Heidelberg, Germany, 1998; pp. 315–336. [Google Scholar]
  38. Zheng, X.-R.; Fu, Z.; Xi, Y.-J.; Mu, J.-D.; Li, Y. Grey relationship analysis for the environmental factors affecting the Noctiluca scintillans density in Qinhuangdao coastal area. Prog. Fish. Sci. 2014, 35, 8–15, (In Chinese with English Abstract). [Google Scholar]
  39. Xu, C.-y.; Huang, M.-z.; Du, Q. Ecological characteristics of important red tide species in Fujian coastal waters. J. Oceanogr. Taiwan Strait 2010, 29, 434–441, (In Chinese with English Abstract). [Google Scholar]
  40. Miyaguchi, H.; Fujiki, T.; Kikuchi, T.; Kuwahara, V.S.; Toda, T. Relationship between the bloom of Noctiluca scintillans and environmental factors in the coastal waters of Sagami Bay, Japan. J. Plankton Res. 2006, 28, 313–324. [Google Scholar] [CrossRef]
  41. Li, Y.; Yang, C.; Li, D.; Tian, Y.; Zheng, T. Dynamics of bacterial community during the bloom caused by Skeletonema costatum and Akashiwo sanguinea in Xiamen sea area. Acta Microbiol. Sin. 2012, 52, 1268–1281, (In Chinese with English Abstract). [Google Scholar]
  42. Qi, S.; Qin, C.; Huang, S.; Zhong, C.; Sun, K. Correlation between the patch distribution of Noctiluca Scintillans bloom and aquatic environmental factors. J. Trop. Biol. 2018, 9, 1–11, (In Chinese with English Abstract). [Google Scholar]
  43. Solomon, C.M.; Collier, J.L.; Berg, G.M.; Glibert, P. Role of urea in microbial metabolism in aquatic systems: A biochemical and molecular review. Aquat. Microb. Ecol. 2010, 59, 67–88. [Google Scholar] [CrossRef]
  44. Gómez-Consarnau, L.; Needham, D.M.; Weber, P.K.; Fuhrman, J.A.; Mayali, X. Influence of light on particulate organic matter utilization by attached and free-living marine bacteria. Front. Microbiol. 2019, 10, 1024. [Google Scholar] [CrossRef]
  45. Zhang, S.; Liu, H.; Xia, X. Community dynamics of free-living and particle-attached bacteria over sequential blooms of heterotrophic dinoflagellate Noctiluca scintillans and mixotrophic ciliate Mesodinium rubrum. Appl. Environ. Microbiol. 2022, 88, e01323-22. [Google Scholar] [CrossRef]
  46. Teeling, H.; Fuchs, B.M.; Becher, D.; Klockow, C.; Gardebrecht, A.; Bennke, C.M.; Kassabgy, M.; Huang, S.; Mann, A.J.; Waldmann, J.; et al. Substrate-controlled succession of marine bacterioplankton populations induced by a phytoplankton bloom. Science 2012, 336, 608–611. [Google Scholar] [CrossRef]
  47. Buchan, A.; LeCleir, G.R.; Gulvik, C.A.; González, J.M. Master recyclers: Features and functions of bacteria associated with phytoplankton blooms. Nat. Rev. Microbiol. 2014, 12, 686–698. [Google Scholar] [CrossRef]
  48. Röttjers, L.; Faust, K. From hairballs to hypotheses-biological insights from microbial networks. FEMS Microbiol. Rev. 2018, 42, 761–780. [Google Scholar] [CrossRef]
  49. Hernandez, D.J.; David, A.S.; Menges, E.S.; Searcy, C.A.; Afkhami, M.E. Environmental stress destabilizes microbial networks. ISME J. 2021, 15, 1722–1734. [Google Scholar] [CrossRef]
  50. Zhou, J.; Deng, Y.; Luo, F.; He, Z.; Tu, Q.; Zhi, X. Functional molecular ecological networks. mBio 2010, 1, e00169-10. [Google Scholar] [CrossRef]
  51. Trombetta, T.; Vidussi, F.; Roques, C.; Scotti, M.; Mostajir, B. Marine microbial food web networks during phytoplankton bloom and non-bloom periods: Warming favors smaller organism interactions and intensifies trophic cascade. Front. Microbiol. 2020, 11, 502336. [Google Scholar] [CrossRef]
  52. Xu, S. The Variation of Marine Microbial Community Structure and Its Ecological Functions Following a Phaeocystis Bloom, Highlighted by Omics Techniques. Ph.D. Dissertation, University of Chinese Academy of Sciences, Beijing, China, 2021. (In Chinese with English Abstract). [Google Scholar]
  53. Zhu, J.; Zhou, J.; Wang, H.; Chen, G.; Cai, Z. The ecological network approach to algal-bacterial relationships: Review and prospects. Chin. Sci. Bull. 2021, 66, 4378–4394, (In Chinese with English Abstract). [Google Scholar] [CrossRef]
  54. Berry, D.; Widder, S. Deciphering microbial interactions and detecting keystone species with co-occurrence networks. Front. Microbiol. 2014, 5, 219. [Google Scholar] [CrossRef]
  55. Roager, L.; Kempen, P.J.; Bentzon-Tilia, M.; Sonnenschein, E.C.; Gram, L. Impact of host species on assembly, composition, and functional profiles of phycosphere microbiomes. Msystems 2024, 9, e0058324. [Google Scholar] [CrossRef]
  56. Brüwer, J.D.; Orellana, L.H.; Sidhu, C.; Klip, H.C.; Meunier, C.L.; Boersma, M.; Wiltshire, K.H.; Amann, R.; Fuchs, B.M. In situ cell division and mortality rates of SAR11, SAR86, Bacteroidetes, and Aurantivirga during phytoplankton blooms reveal differences in population controls. mSystems 2023, 8, e0128722, Erratum in mSystems 2024, 9, e0119623 . [Google Scholar] [CrossRef] [PubMed] [PubMed Central]
  57. Liang, J.; Liu, J.; Zhan, Y.; Zhou, S.; Xue, C.-X.; Sun, C.; Lin, Y.; Luo, C.; Wang, X.; Zhang, X.-H. Succession of marine bacteria in response to Ulva prolifera-derived dissolved organic matter. Environ. Int. 2021, 155, 106687. [Google Scholar] [CrossRef]
  58. Raes, J.; Bork, P. Molecular eco-systems biology: Towards an understanding of community function. Nat. Rev. Microbiol. 2008, 6, 693–699. [Google Scholar] [CrossRef]
  59. Yang, C.; Wang, Q.; Simon, P.N.; Liu, J.; Liu, L.; Dai, X.; Zhang, X.; Kuang, J.; Igarashi, Y.; Pan, X.; et al. Distinct network interactions in particle-associated and free-living bacterial communities during a Microcystis aeruginosa bloom in a plateau lake. Front. Microbiol. 2017, 8, 1202. [Google Scholar] [CrossRef]
  60. Tarafdar, L.; Mohapatra, M.; Muduli, P.R.; Kumar, A.; Mishra, D.R.; Rastogi, G. Co-occurrence patterns and environmental factors associated with rapid onset of Microcystis aeruginosa bloom in a tropical coastal lagoon. J. Environ. Manag. 2023, 325, 116580. [Google Scholar] [CrossRef]
  61. Chen, Y. Ecological Characteristics of Phytoplankton and Physiological Mechanism of Interspecies Relationship Between the Key Phytoplankton Species in a Seallop Culture Sea Area of Bohai Bay. Ph.D. Dissertation, Xiamen University, Xiamen, China, 2017. (In Chinese with English Abstract). [Google Scholar]
  62. Wang, F.-W.; Li, Y.; Zhen, Y.; Liu, Q. Transcriptome analysis of carbon fixation pathway of Minutocellus polymorphus under different nitrogen source conditions and the comparison with other microalgae. Oceanol. Limnol. Sin. 2020, 51, 1127–1135, (In Chinese with English Abstract). [Google Scholar]
  63. Chen, J.; Zhong, Y.; Wang, L.; Qiu, D. In situ diets of the bloom-forming dinoflagellate Noctiluca scintillans in Daya Bay. Harmful Algae 2023, 130, 102546. [Google Scholar] [CrossRef]
  64. de Gier, J.W.L.; Schepper, M.; Reijnders, W.N.; Van Dyck, S.J.; Slotboom, D.J.; Warne, A.; Saraste, M.; Krab, K.; Finel, M.; Stouthamer, A.H.; et al. Structural and functional analysis of aa3-type and cbb3-type cytochrome c oxidases of Paracoccus denitrificans reveals significant differences in proton-pump design. Mol. Microbiol. 1996, 20, 1247–1260. [Google Scholar] [CrossRef]
  65. Bertero, M.G.; Rothery, R.A.; Palak, M.; Hou, C.; Lim, D.; Blasco, F.; Weiner, J.H.; Strynadka, N.C.J. Insights into the respiratory electron transfer pathway from the structure of nitrate reductase A. Nat. Struct. Mol. Biol. 2003, 10, 681–687. [Google Scholar] [CrossRef]
  66. Rothery, R.A.; Blasco, F.; Magalon, A.; Weiner, J.H. The diheme cytochrome b subunit (Narl) of Escherichia coli nitrate reductase A (NarGHI): Structure, function, and interaction with quinols. J. Mol. Microbiol. Biotechnol. 2001, 3, 273–283. [Google Scholar]
  67. Ma, W.; Li, J.; Yang, W.Q.; Zhang, Z.Y.; Yan, C.X.; Huang, P.W.; Sun, X.M. Efficient biosynthesis of odd-chain fatty acids via regulating the supply and consumption of propionyl-CoA in Schizochytrium sp. J. Agric. Food Chem. 2023, 71, 9847–9855. [Google Scholar] [CrossRef]
  68. Rosenberg, L.E. The inherited methylmalonic acidaemias: A model system for the study of vitamin metabolism and apoenzyme-coenzyme interactions. In Transport and Inherited Disease: Monograph Based upon Proceedings of the Seventeenth Symposium of The Society for the Study of Inborn Errors of Metabolism; Springer: Dordrecht, The Netherlands, 1981; pp. 3–32. [Google Scholar]
  69. Bratcher, S.C.; Hsu, R.Y. The pyruvate-proton exchange reaction of malic enzyme from pigeon liver. Biochim. Biophys. Acta (BBA)-Protein Struct. Mol. Enzymol. 1982, 702, 54–60. [Google Scholar] [CrossRef]
  70. Katagiri, T.; Amao, Y. Trivalent metal ions promote the malic enzyme-catalyzed building of carbon–carbon bonds from CO2 and pyruvate. New J. Chem. 2020, 44, 17208–17214. [Google Scholar] [CrossRef]
  71. Misono, H.; Sugihara, K.; Kuwamoto, Y.; Nagata, S.; Nagasaki, S. Leucine dehydrogenase from Corynebacterium pseudodiphtheriticum: Purification and characterization. Agric. Biol. Chem. 1990, 54, 1491–1498. [Google Scholar] [CrossRef]
  72. Ohshima, T.; Soda, K. Valine dehydrogenase from a non-spore-forming bacterium Alcaligenes faecalis: Purification and characterization. Biochim. Biophys. Acta (BBA)-Protein Struct. Mol. Enzymol. 1993, 1162, 221–226. [Google Scholar] [CrossRef]
  73. Wang, H.; Gunsalus, R.P. The nrfA and nirB nitrite reductase operons in Escherichia coli are expressed differently in response to nitrate than to nitrite. J. Bacteriol. 2000, 182, 5813–5822. [Google Scholar] [CrossRef]
  74. Drepper, T.; Raabe, K.; Giaourakis, D.; Gendrullis, M.; Masepohl, B.; Klipp, W. The Hfq-like protein NrfA of the phototrophic purple bacterium Rhodobacter capsulatus controls nitrogen fixation via regulation of nifA and anfA expression. FEMS Microbiol. Lett. 2002, 215, 221–227. [Google Scholar] [CrossRef]
  75. Pitcher, G.C.; Probyn, T.A. Suffocating phytoplankton, suffocating waters—Red tides and anoxia. Front. Mar. Sci. 2016, 3, 186. [Google Scholar] [CrossRef]
  76. Durand, S.; Guillier, M. Transcriptional and post-transcriptional control of the nitrate respiration in bacteria. Front. Mol. Biosci. 2021, 8, 667758. [Google Scholar] [CrossRef]
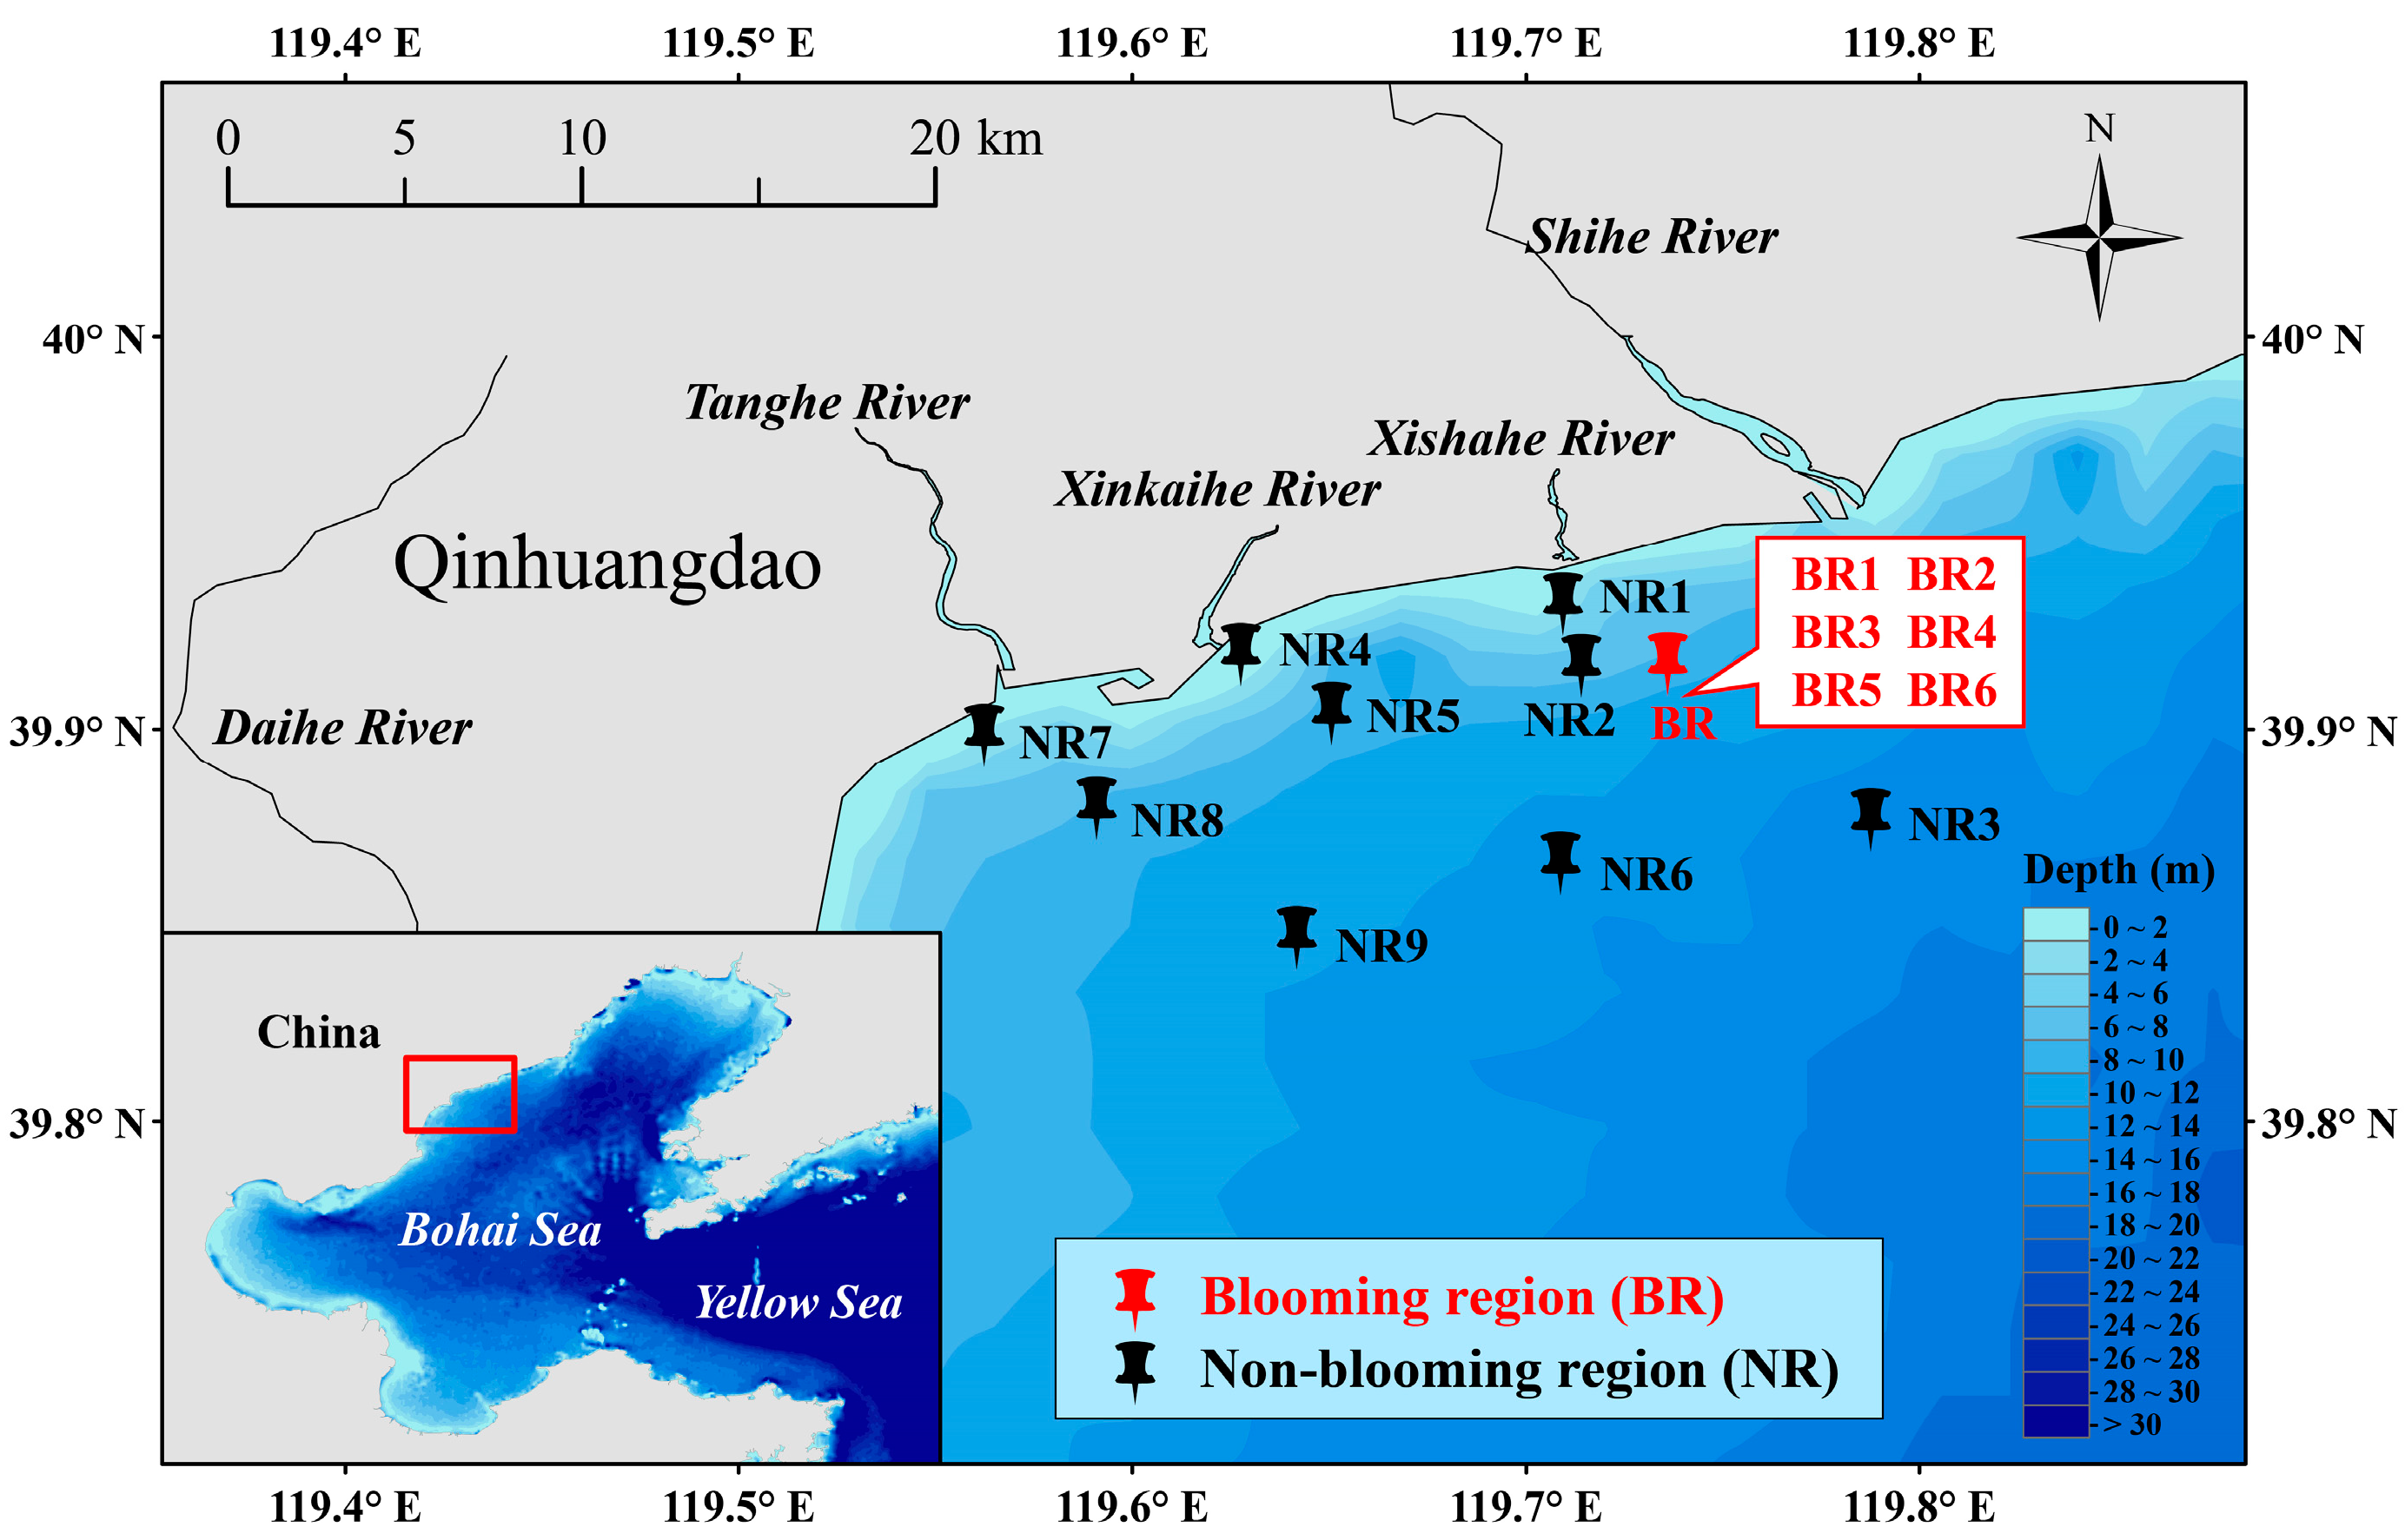
Figure 1. Location of sampling region and sites. Since the six sites in the blooming region (BR) were randomly selected and located close to each other, only a representative central location is marked on the map.
Microorganisms 13 01959 g001
Figure 2. Images of the Noctiluca scintillans bloom: (a) Blooming scene; (b) Flocculent aggregates formation; (c) Microscopic cell morphology.
Microorganisms 13 01959 g002
Figure 3. Taxonomic compositions of microbial communities in the blooming region (BR) and the non-blooming region (NR). (a) Relative abundances of genera of prokaryotes; (b) Relative abundances of genera of microeukaryotes; (c) Variance of the top 15 genera of prokaryotes; (d) Variations in the top 15 genera of microeukaryotes. S: surface layer, M: middle layer, B: bottom layer. Statistical significance of differences (***: p < 0.001, **: p < 0.01, *: p < 0.05, ns: p > 0.05) is determined by the Wilcoxon rank-sum test.
Microorganisms 13 01959 g003
Figure 4. Comparison of microbial α-diversity and community composition between the blooming region (BR) and the non-blooming region (NR). (a,b) Boxplots of Sobs, Shannon, and Pielou’s indices for prokaryotic and microeukaryotic communities. Statistical significance of differences (***: p < 0.001, *: p < 0.05) is determined by the Wilcoxon rank-sum test. (c,d) Principal Coordinates Analysis (PCoA) illustrating the prokaryotic and microeukaryotic community dissimilarity. S: surface layer, M: middle layer, B: bottom layer.
Microorganisms 13 01959 g004
Figure 5. Relationship between the prokaryotic (a) and microeukaryotic (b) community compositions at the genus level and environmental variables. Abbreviations for layers and environmental variables are defined in Table 1.
Microorganisms 13 01959 g005
Figure 6. Comparison of the integrated co-occurrence networks of prokaryotes and microeukaryotes between the blooming region (BR) and the non-blooming region (NR). Panels (a,b) classify the nodes by color at the domain level and the class level, respectively. Nodes indicate individual ASVs and edges indicate significant correlations. The size of each node corresponds to the abundance of ASV, while the thickness of the connecting edges represents the strength of the correlation.
Microorganisms 13 01959 g006
Figure 7. Comparison of important modules derived from the integrated networks of the blooming region (BR) and the non-blooming region (NR). (a) Largest module containing negative correlations from the BR network; (b) Largest module containing negative correlations from the NR network; (c) Largest module comprised entirely of prokaryotes with negative correlations from the BR network; (d) Largest module comprised entirely of prokaryotes with negative correlations from the NR network; (e) Modules associated with Noctiluca scintillans from the BR network; (f) Modules associated with N. scintillans from the NR network.
Microorganisms 13 01959 g007
Figure 8. Schematic diagram of metabolic differences in the blooming region (BR) microbial community relative to the non-blooming region (NR). Solid arrows represent single-step catalytic reactions showing significant changes between regions, while dashed arrows indicate reactions with no significant differences or non-key processes. Downstream metabolic fates appear in gray rounded rectangles, inorganic nitrogen compounds as structural formulas, and amino acids as pink ovals. Organic metabolites are represented by rounded rectangles, color-coded by pathway: yellow for TCA cycle, blue for β-oxidation, purple for methylmalonyl-CoA pathway, green for pyruvate metabolism and gluconeogenesis, and brown for branched-chain amino acids. Membrane transporters, catalytic enzymes and their corresponding encoding genes are colored red (upregulated), blue (downregulated) or yellow (unchanged) to reflect differential expression patterns.
Microorganisms 13 01959 g008
Table 1. Comparison of parameters of seawater samples from the blooming region (BR) and the non-blooming region (NR) in the Qinhuangdao coastal waters.
LayerT
(°C)
SalDepth
(m)
pHDO
(mg/L)
Chl-a
(µg/L)
NO3-N
(mg/L)
NO2-N
(mg/L)
NH4+-N
(mg/L)
PO43−-P
(mg/L)
SiO32−-Si
(mg/L)
BRNRBRNRBRNRBRNRBRNRBRNRBRNRBRNRBRNRBRNRBRNR
S22.9 *23.5 *29.129.10.20.17.77.67.57.12.72.1184.4240.829.728.9851.8 *130.2 *72.8 *27.2 *447.9260.4
M22.822.929.629.55.65.17.77.67.47.12.52.196.597.324.521.0291.5316.113.710.8395.0574.4
B22.722.928.8 **29.6 **11.110.07.77.67.67.13.03.1147.3 *90.9 *37.3 **21.4 **222.0 *311.151.612.4516.7502.2
S: surface layer; M: middle layer; B: bottom layer; T: temperature; Sal: salinity; DO: dissolved oxygen; Chl-a: chlorophyll a; NO3-N: nitrate; NO2-N: nitrite; NH4+-N: ammonium; PO43−-P: phosphate; SiO32−-Si: silicate. Environmental factors exhibiting significant variations (Wilcoxon rank-sum test: p < 0.05) are highlighted in bold, with statistical significance denoted as: **: p < 0.01, *: p < 0.05.
Table 2. Comparison of topological properties of the integrated co-occurrence networks of prokaryotes and microeukaryotes between the blooming region (BR) and the non-blooming region (NR).
Network PropertiesBRNR
Number of nodes401903
Number of prokaryotic nodes342697
Number of microeukaryotic nodes59206
Number of edges10404300
Proportion of positive correlations79.1%94.1%
Average degree5.1879.524
Average path length1.3031.123
Network diameter66
Clustering coefficient0.9530.995
Betweenness centrality0.00050.0001
Number of modules95159
Modularity0.9430.946
Table 3. Comparison of the keystone taxa with the highest betweenness centrality between the blooming region (BR) and the non-blooming region (NR).
BRNR
GenusIdentifiable Taxonomic Level Above GenusBetweenness CentralityGenusIdentifiable Taxonomic Level Above GenusBetweenness Centrality
AurantivirgaFlavobacteriaceae38UnclassifiedRhodobacteraceae42
HIMB11Rhodobacteraceae25.5UnclassifiedCryptomonadales30
HIMB11Rhodobacteraceae25.5UnclassifiedVerrucomicrobiales24
DonghicolaRhodobacteraceae18GymnodiniumGymnodiniaceae24
AurantivirgaFlavobacteriaceae16ProtaspaCryomonadida21
DonghicolaRhodobacteraceae16MarivivensRhodobacteraceae20
AurantivirgaFlavobacteriaceae16UnclassifiedChlorarachniophyceae20
UnclassifiedRhodobacteraceae16UnclassifiedIlumatobacteraceae18
Sva0996 marine groupMicrotrichaceae15RoseibacillusRubritaleaceae18
HIMB11Rhodobacteraceae15Ca. ActinomarinaActinomarinaceae17.5
Disclaimer/Publisher’s Note: The statements, opinions and data contained in all publications are solely those of the individual author(s) and contributor(s) and not of MDPI and/or the editor(s). MDPI and/or the editor(s) disclaim responsibility for any injury to people or property resulting from any ideas, methods, instructions or products referred to in the content.