Article

Isolation, Identification, and Antibiotic Resistance, CRISPR System Analysis of Escherichia coli from Forest Musk Deer in Western China

1
College of Veterinary Medicine, Sichuan Agricultural University, Chengdu 611130, China
2
Sichuan Institute for Drug Control, Chengdu 611731, China
*
Author to whom correspondence should be addressed.
These authors contributed equally to this work.
Microorganisms 2025, 13(7), 1683; https://doi.org/10.3390/microorganisms13071683
Submission received: 19 June 2025 / Revised: 7 July 2025 / Accepted: 10 July 2025 / Published: 17 July 2025

Abstract

Escherichia coli (E. coli) is an opportunistic pathogen widely distributed in nature, and multi-drug resistance (MDR) E. coli has been widely recognized as a critical reservoir of resistance genes, posing severe health threats to humans and animals. A total of 288 E. coli strains were isolated and purified from fresh fecal samples of forest musk deer collected from farms in Sichuan, Shaanxi, and Yunnan Provinces of China between 2013 and 2023. This study aimed to conduct antibiotic susceptibility testing and resistance gene detection on the isolated forest musk deer-derived E. coli, analyze the correlations between them, investigate the presence of CRISPR systems within the strains, and perform bioinformatics analysis on the CRISPR systems carried by the strains. Results showed that 138 out of 288 E. coli strains were MDR, with the highest resistance to tetracycline (48.3%), cefalexin (45.1%), and doxycycline (41.7%). Prevalent genes were tetA (41.0%), sul2 (30.2%), blaTEM (27.1%), with 29 gene–phenotype pairs correlated. CRISPR system-negative strains had higher resistance rates to 16 antibiotics and lower detection rates only for aac (6′)-Ib-cr, qnrA, and qnrB compared to CRISPR system-positive strains. Regional analysis showed that the problem of drug resistance in Sichuan and Shaanxi was more serious, and that the detection rate of antibiotic resistance genes was relatively high. This study guides E. coli infection control in forest musk deer and enriches resistance research data.

1. Introduction

Antibiotic resistance has emerged as a global crisis and a pressing health threat that demands urgent resolution. Antimicrobial resistance (AMR) has made the treatment of animal diseases more difficult, increasing the morbidity and mortality of animals, and severely affecting the production efficiency of animal husbandry. After wild animals come into contact with multidrug-resistant bacteria in the environment, they may further enhance the transmission of multidrug-resistant bacteria in nature, thereby affecting the health and stability of the entire ecosystem [1,2]. With the proposal of the “One Health” concept, increasing attention is being paid to the threat of animal-derived bacteria to human health [3]. Human exposure to animal-derived drug-resistant bacteria through air, food, and water sources increases the risk of antibiotic treatment failure [4].
As a major member of the intestinal microbiota in humans and animals, E. coli is a widely distributed Gram-negative bacterium and an important zoonotic conditional pathogen. Due to its strong survival ability and extreme tolerance to temperature and acidity, it easily infects humans and animals through water, soil, and food, causing severe diarrhea, septicemia, and various inflammatory diseases such as peritonitis, pneumonia, pericarditis, and cellulitis. E. coli infections not only pose a serious threat to the health of livestock and poultry in aquaculture but also cause significant economic losses [5]. Antibiotics are the primary method for treating E. coli diseases, but the continuous development of intensive and large-scale farming models has led to the widespread abuse of antibiotics worldwide, resulting in enhanced bacterial resistance and an increase in the number of superbugs [6]. As a typical multi-drug resistance bacterium, some bacterial multidrug resistance (MDR) E. coli strains carrying multiple resistance genes may even render commonly used antibiotics and so-called “last-resort” antibiotics ineffective.
MDR can be acquired through multiple pathways, such as mutations in antibiotic-targeted genes and the transfer and recombination of resistance genes [7]. The horizontal transfer of resistance genes is a crucial factor in the rapid spread of bacterial resistance. As a major reservoir of antibiotic resistance genes, E. coli can both acquire resistance genes from other bacteria and transfer its own resistance genes to other bacteria [8]. Antibiotic resistance genes (ARGs) are considered the main factor contributing to bacterial resistance and have been defined as new environmental pollutants. More than half of the total global antibiotic consumption is used in animal husbandry, thereby establishing the livestock industry as a primary source of resistance genes. High detection rates of resistance genes have been reported in wastewater, soil, and other environments around farms worldwide. Once these resistance genes spread to the surrounding environment, they augment the probability of human exposure. Therefore, strengthening investigations into bacterial resistance in animal farms and understanding the abundance of resistance genes are of utmost importance [9].
The Clustered Regularly Interspaced Short Palindromic Repeats-associated protein (CRISPR-Cas) system is a bacterial immune system composed of clustered, regularly interspaced short palindromic repeats and multiple CRISPR-associated genes. The CRISPR-Cas system is harbored by approximately 40% of bacteria and 90% of archaea [10]. It is the only adaptive immune system found in prokaryotes, consisting of two main parts: the CRISPR locus and Cas genes. The CRISPR locus includes a leader sequence, spacers, and direct repeats (DR). The CRISPR-Cas system is categorized into two classes based on the structural and functional characteristics of Cas proteins and further subcategorized into six types (I-VI) [11]. Among them, the Type II system is widely used in genome editing because it only requires one Cas protein to function. Current studies have demonstrated that an intact CRISPR system can prevent bacteria from acquiring plasmids carrying resistance genes, thereby reducing bacterial tolerance to antibiotics [12]. The absence of Cas genes in the CRISPR system may be one of the causes of multi-drug resistance bacteria [13,14].
The forest musk deer (Moschus berezovskii) is a mammal belonging to the order Artiodactyla, family Moschidae, and genus Moschus. In China, forest musk deer are mainly distributed in Sichuan, Shaanxi, Gansu, Yunnan, and other regions. The abdominal scent gland of adult male musk deer secretes musk, which is an essential raw material for high-end cosmetics and perfumes and a precious medicinal herb in traditional Chinese medicine [15]. Due to overhunting by humans, wild forest musk deer resources have been depleted, and the species has been listed as a national first-class protected wild animal in China and included in the International Union for Conservation of Nature (IUCN) Red List of Endangered Species in 2015. With the increasing severity of bacterial resistance, the incidence of bacterial diseases in captive forest musk deer has become higher and more harmful, posing a significant threat to the health of captive forest musk deer [16,17].
Currently, there is insufficient research on the resistance of forest musk deer-derived E. coli. Thus, this study aimed to characterize the antibiotic resistance phenotypes and antibiotic resistance genes profiles of E. coli isolates from Sichuan, Shaanxi, and Yunnan Provinces, China. We also conducted bioinformatics analysis of their CRISPR systems to elucidate the interconnections among resistance phenotypes, resistance genes, and CRISPR systems in forest musk deer-derived E. coli, thereby providing theoretical foundations for E. coli prevention and control.

2. Materials and Methods

2.1. Test Strains

The 288 E. coli strains used in this study were isolated from 315 fresh fecal samples randomly collected from forest musk deer farms in Sichuan, Shaanxi, and Yunnan Provinces between 2013 and 2023. Samples were stored in sterile centrifuge tubes (Eppendorf, Germany) and transported back to the laboratory at 4 °C within 12 h for bacterial isolation. Fecal samples were pre-enriched in LB broth medium (Haibo, Qingdao, China) at 37 °C with shaking at 120 r/min for 8 h. The culture was then spread onto EMB agar medium (Haibo, Qingdao, China) and incubated at 37 °C for 16 h. Single colonies exhibiting green metallic sheen on EMB agar were picked for Gram staining, and suspected E. coli colonies were purified and subjected to further identification testing.

2.2. DNA Extraction and 16S rRNA Gene Analysis

Bacterial DNA was extracted using a bacterial genomic DNA extraction kit (Tiangen, Beijing, China) according to the manufacturer’s instructions. The universal primers for the bacterial 16S rRNA gene (27F: 5′-AGAGTTTGATCCTGGCTCAG-3′ and 1492R: 5′-GGTTACCTTGTTACGACTT-3′) were used to amplify the 16S rRNA gene of the purified isolates [18]. The PCR reaction system (25 μL) comprised 12.5 μL of 2 × San Taq PCR Mix (Sangon, Shanghai, China), 1 μL each of forward and reverse primers (10 μmol/L), 1 μL of bacterial DNA, and 9.5 μL of ddH2O. The PCR amplification program was as follows: pre-denaturation at 94 °C for 2 min; denaturation at 94 °C for 30 s, primer annealing for 30 s, extension at 72 °C for 1 min, for a total of 30 cycles; and final extension at 72 °C for 10 min. The amplified products were submitted to Qingke Biological Co., Ltd. (Beijing, China) for sequencing, and the sequencing results were subjected to BLAST comparison in NCBI version 2.16.0. Colonies confirmed as E. coli after sequence alignment were purified on EMB agar medium.

2.3. Antibiotic Susceptibility Testing

In combination with a survey of antibiotic usage in each farm and the guidelines and interpretive standards of the Clinical and Laboratory Standards Institute (CLSI), the Kirby-Bauer (K-B) disk diffusion method was used to assess the sensitivity of the isolated bacteria to 24 antibiotics [19]. The antibiotics tested included piperacillin–tazobactam 10:1 (TZP, 100/10 μg), ampicillin–sulbactam 1:1 (SAM, 20/10 μg), amoxicillin–clavulanic acid 2:1 (AMC, 20/10 μg), cefalexin (CFX, 30 μg), ceftazidime (CAZ, 30 μg), cefuroxime (CXM, 30 μg), ceftriaxone (CRO, 30 μg), cefazolin (KZ, 30 μg), cefoxitin (FOX, 30 μg), aztreonam (ATM, 30 μg), imipenem (IPM, 10 μg), meropenem (MEM, 10 μg), gentamicin (CN, 10 μg), tobramycin (TOB, 10 μg), amikacin (AK, 30 μg), trimethoprim–sulfamethoxazole (STX, 25 μg), polymyxin B (PB, 300 μg), nitrofurantoin (F, 100 μg), levofloxacin (LEV, 5 μg), ciprofloxacin (CIP, 5 μg), florfenicol (FFC, 30 μg), chloramphenicol (CHL, 30 μg), tetracycline (TE, 30 μg), and doxycycline (DOX, 5 μg). Results were interpreted according to CLSI standards. E. coli ATCC25922 was used as a control [20]. MDR strains were defined as those resistant to three or more classes of antibiotics [21].

2.4. Antibiotic Resistance Gene Detection

PCR detection methods were established for representative antibiotic resistance genes (ARGs) in E. coli strains, including β-lactams (blaTEM, blaCTX-M, blaSHV), tetracyclines (tetA, tetX), quinolones (qnrA, qnrB, qnrS), amide alcohols (floR), sulfonamides (sul1, sul2, sul3), and aminoglycosides (aac(6′)-Ib-cr, strA, strB, gyrB, ant(3″)-Ia, aph(3′)-Ⅱa) resistance genes. The PCR primers and corresponding annealing temperatures are shown in Table S1 [22].

2.5. CRISPR Sequence Analysis

The presence of the CRISPR system in the isolated strains was detected by PCR. Primers were designed based on the CRISPR structure sequences of E. coli published on the CRISPR database website (https://crisprcas.i2bc.paris-saclay.fr/, accessed on 3 March 2025.) (CF: 5′-TACCGTTGGTGAAGGAGCTG-3′, CR: 5′-TTCCGGTGGATTTGGATGGG-3′). The repeat and spacer sequences of the amplified CRISPR sequences were analyzed using the CRISPRCasFinder website (https://crisprcas.i2bc.paris-saclay.fr/, accessed on 5 March 2025) to identify potential CRISPR targets. The identified spacer sequences of each strain were submitted to the CRISPRTarget website (https://crispr.otago.ac.nz/CRISPRTarget/crispr_analysis.html, accessed on 7 March 2025) for BLAST comparison analysis of the spacer sequence sources against the GenBank-Phage, RefSeq-Plasmid, RefMicrobial, and RefSeq-viral databases (using default parameters), with sequences showing that > 90% were considered homologous. The RNA secondary structure of the repeat sequences was predicted using RNAfold web (http://rna.tbi.univie.ac.at/cgi-bin/RNAWebSuite/RNAcofold.cgi, accessed on 10 March 2025).

2.6. Data Processing and Analysis

Statistical analysis was performed using SPSS Statistics Version 26. p-values < 0.05 were considered statistically significant. The Pearson correlation coefficient (r) was used as a nonparametric measure of the strength of association between two variables, ranging from −1 to 1 [23]. The assessment of correlation was conducted using the chi-square test and by computing Spearman’s rank correlation coefficient (r). Specifically, according to the previous literature, an absolute value of r in the range of 0.5 to 1.0 denoted a high correlation, 0.3 to 0.5 indicated a moderate correlation, 0.1 to 0.3 signified a low correlation, and an absolute value of r < 0.1 indicated no correlation [5].

3. Results

3.1. Antibiotic Resistance Phenotype Analysis

A total of 288 strains of Escherichia coli strains were isolated in this study, including 163 strains from Sichuan Province, 70 strains from Shaanxi Province, and 55 strains from Yunnan Province in China. Among all 288 isolated E. coli strains, 138 (47.92%, 138/288) were resistant to three or more classes of antibiotics and defined as MDR E. coli. Specifically, MDR E. coli isolates from Sichuan, Shaanxi, and Yunnan were 81 (49.69%, 81/163), 40 (57.14%, 40/70), and 17 (30.91%, 17/55), respectively. Furthermore, 51 (17.70%, 51/288) E. coli strains were sensitive to all antibiotics. As shown in Table 1, among the eight classes of antibiotics used in the susceptibility test, β-lactam antibiotics had the highest resistance rate (73.61%, 212/288), followed by tetracycline antibiotics (50.35%, 145/288), aminoglycoside antibiotics (41.32%, 119/288), sulfonamide antibiotics (36.11%, 104/288), amide alcohol antibiotics (32.29%, 93/288), quinolone antibiotics (28.47%, 82/288), furan antibiotics (2.43%, 7/288), and polypeptide antibiotics (1.74%, 5/288). Among the 24 antibiotics used, tetracycline (48.26%, 139/288), cefalexin (45.14%, 130/288), and doxycycline (41.67%, 120/288) had the highest resistance rates, while cefoxitin (3.13%, 9/288), nitrofurantoin (2.43%, 7/288), and polymyxin B (1.74%, 5/288) had the lowest resistance rates, with resistance rates of other antibiotics ranging between 4.17% and 37.5%. As shown in Table S2 the detailed analysis of resistance phenotypes revealed 194 distinct resistance profiles among the 288 E. coli isolates, with IPM (5.90%, 17/288), TET/DOX (4.51%, 13/288), AK/IPM (1.74%, 5/288), CFX (1.74%, 5/288), and CHL/AMC/CFX/CAZ/CXM/CRO/KZ/ATM (1.39%, 4/288) being the most common.
Table 2 details the resistance rates of E. coli strains isolated from Sichuan, Shanxi, and Yunnan Provinces to 24 antibiotics. Among them, 163 E. coli strains isolated from Sichuan had higher resistance rates to 19 antibiotics than the overall average across the three regions, 70 strains isolated from Shaanxi had higher resistance rates to 15 antibiotics than the overall average, and 55 strains isolated from Yunnan had a higher resistance rate only to FOX than the overall average. Comparison of the resistance rates of the isolated strains from the three regions to various antibiotics showed that the resistance rates of AK, FFC, CIP, TZP, SAM, AMC, CFX, CAZ, CXM, CRO, KZ, ATM, IPM, and F were highest in Sichuan, while the resistance rates of CN, TOB, TET, DOX, CHL, LEV, SXT, MEM, and PB were highest in Shaanxi. The isolated strains from Yunnan had a higher resistance rate only to FOX than the other two regions and showed no resistance to AK, TZP, SAM, IPM, PB, and F.

3.2. Distribution of Resistance Genes in E. coli

As shown in Table 3, 276 E. coli strains were detected with at least one resistance gene. Among the 18 resistance genes across six classes tested, 16 resistance genes were detected, with gyrB (90.97%), tetA (40.97%), and sul2 (30.21%) having the highest detection rates, while tetX (0.35%), qnrA (0.35%), and aac(6′)-Ib-cr (3.13%) had the lowest detection rates. The detection rates of the remaining 10 detected resistance genes ranged from 4.51% to 23.61%, and aph (3′)-IIa and blaSHV were not identified.
Table 4 shows the detection rates of resistance genes in the three regions. Sichuan had higher detection rates than the overall average across the three regions for seven resistance genes, including ermB, sul3, qnrA, qnrB, aac(6′)-Ib-cr, ant (3′’)-Ia, and tetX. Shaanxi had higher detection rates than the overall average for 10 resistance genes, including floR, blaTEM, sul1, sul2, strA, gyrB, qnrS, strB, blaCTX-M, and tetA. The isolated strains from Yunnan had lower detection rates of all resistance genes than the overall average and the other two regions. The detailed profiles of antibiotic resistance genes harbored by all isolated strains are provided in Supplementary Table S3.

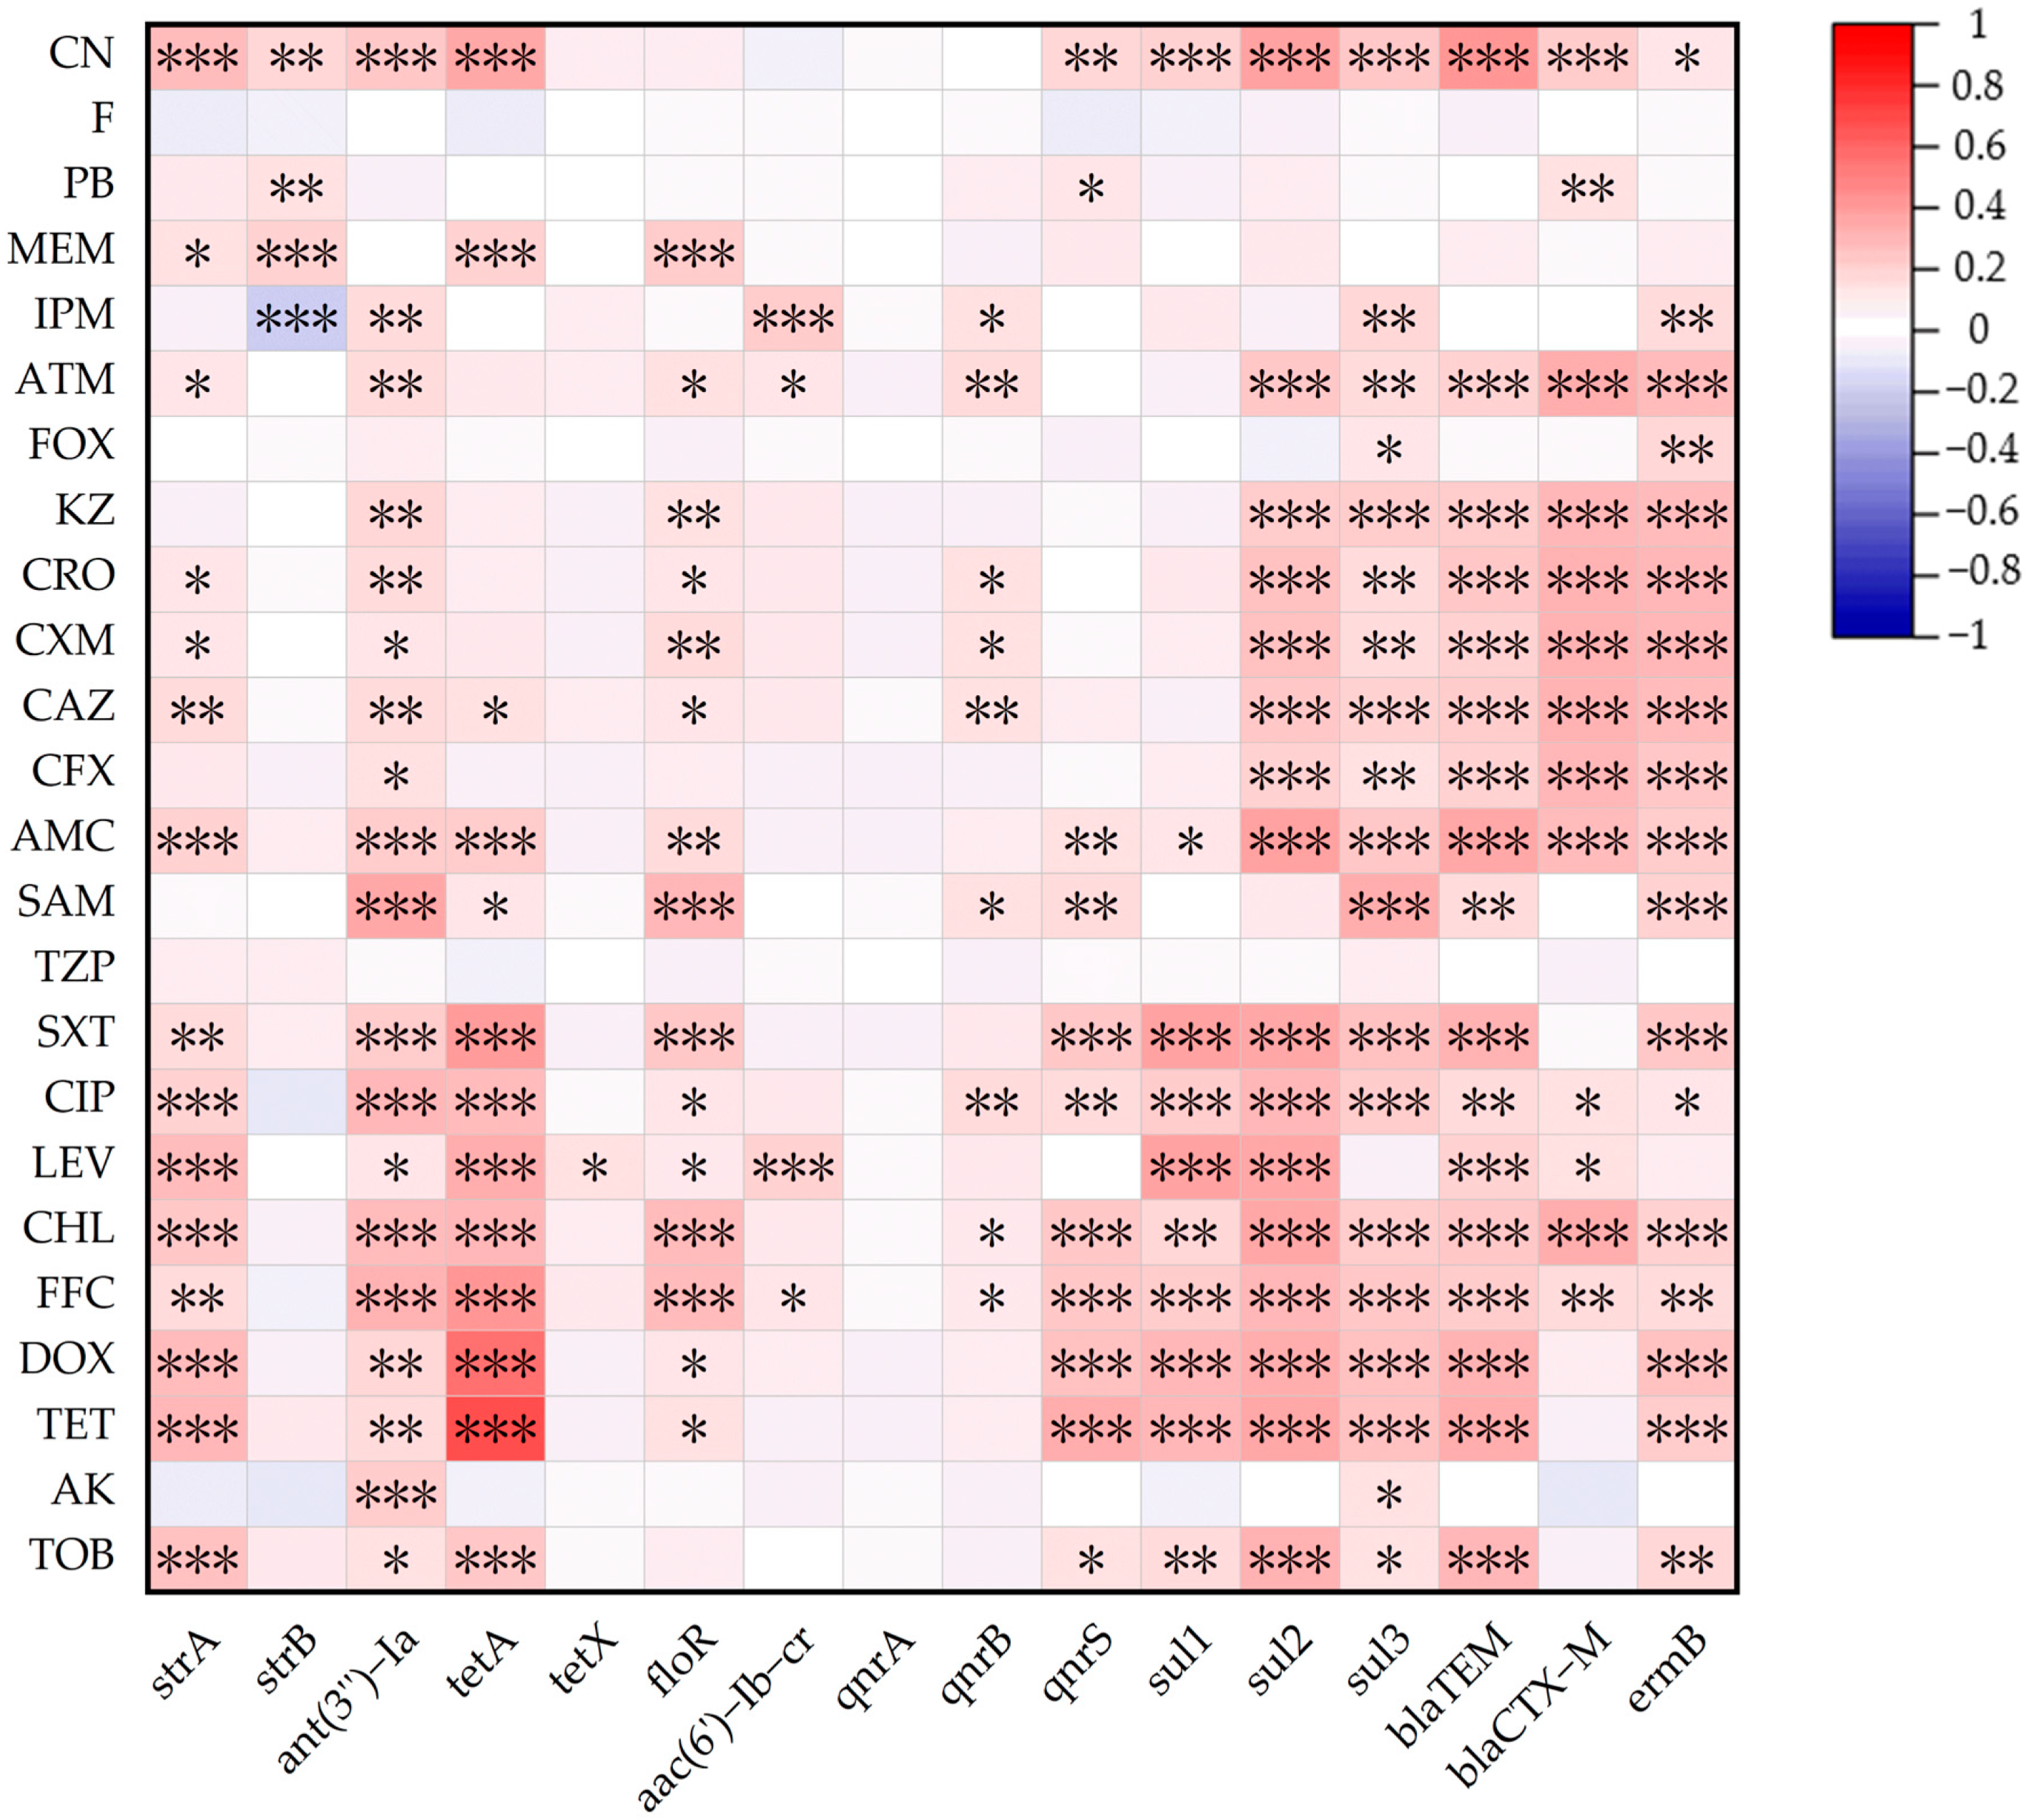
3.3. Relationship Between ARGs and AMRs

Figure 1 illustrates 48 pairs of positive correlations (r > 0.1, p < 0.05) among ARGs, with the strongest correlations found between blaTEM and sul2 (r = 0.65), sul2 and strA (r = 0.63), strA and strB (r = 0.59), and sul3 and ant(3′′)-Ia (r = 0.57). The correlations among the remaining ARGs ranged from r = 0.12 to 0.47. Four pairs of negative correlations (r < −0.1, p < 0.05) were also observed among ARGs, including floR and blaTEM (r = −0.13), blaTEM and qnrB (r = −0.13), strA and ant(3′′)-Ia (r = −0.12), and strB and emrB (r = −0.13).
As shown in Figure 2, there were 155 pairs of positive correlations (r > 0.1, p < 0.05) among AMRs, with the strongest positive correlations observed in five pairs: CXM and CRO (r = 0.87), CRO and KZ (r = 0.82), CRO and ATM (r = 0.81), CXM and KZ (r = 0.80), and TE and DOX (r = 0.80). Additionally, 18 pairs showed strong positive correlations (r = 0.51–0.79), and the remaining 93 pairs had positive correlations ranging from r = 0.21 to 0.50.
As shown in Figure 3, there were 184 pairs of positive correlations (r > 0.1, p < 0.05) between ARGs and AMRs. Among them, 29 ARG–AMR pairs of resistance genes matched their mediated antibiotic resistance phenotypes. The tetA gene showed the strongest correlations with tetracycline antibiotics TE and DOX (r = 0.693, r = 0.572). For aminoglycoside antibiotics, CN was positively correlated with strA, strB, and ant(3′′)-Ia (r = 0.295, r = 0.181, r = 0.232), TOB was positively correlated with strA and ant(3′′)-Ia (r = 0.263, r = 0.163), and AK was positively correlated with ant(3′′)-Ia (0.229). For amide alcohol antibiotics, both FFC and CHL showed positive correlations with floR (r = 0.279, r = 0.302). For quinolone antibiotics, LEV was positively correlated with aac(6′)-Ib-cr (r = 0.216), and CIP was positively correlated with qnrB and qnrS (r = 0.162, r = 0.173). For sulfonamide antibiotics, STX was positively correlated with sul1, sul2, and sul3 (r = 0.378, r = 0.366, r = 0.281). For β-lactam antibiotics, blaTEM was positively correlated with AMC, CFX, CAZ, CXM, CRO, KZ, and ATM (r = 0.366, r = 0.217, r = 0.221, r = 0.211, r = 0.243, r = 0.219, r = 0.200), and blaCTX-M was positively correlated with AMC, CFX, CAZ, CXM, CRO, KZ, and ATM (r = 0.282, r = 0.317, r = 0.325, r = 0.322, r = 0.322, r = 0.303, r = 0.353).

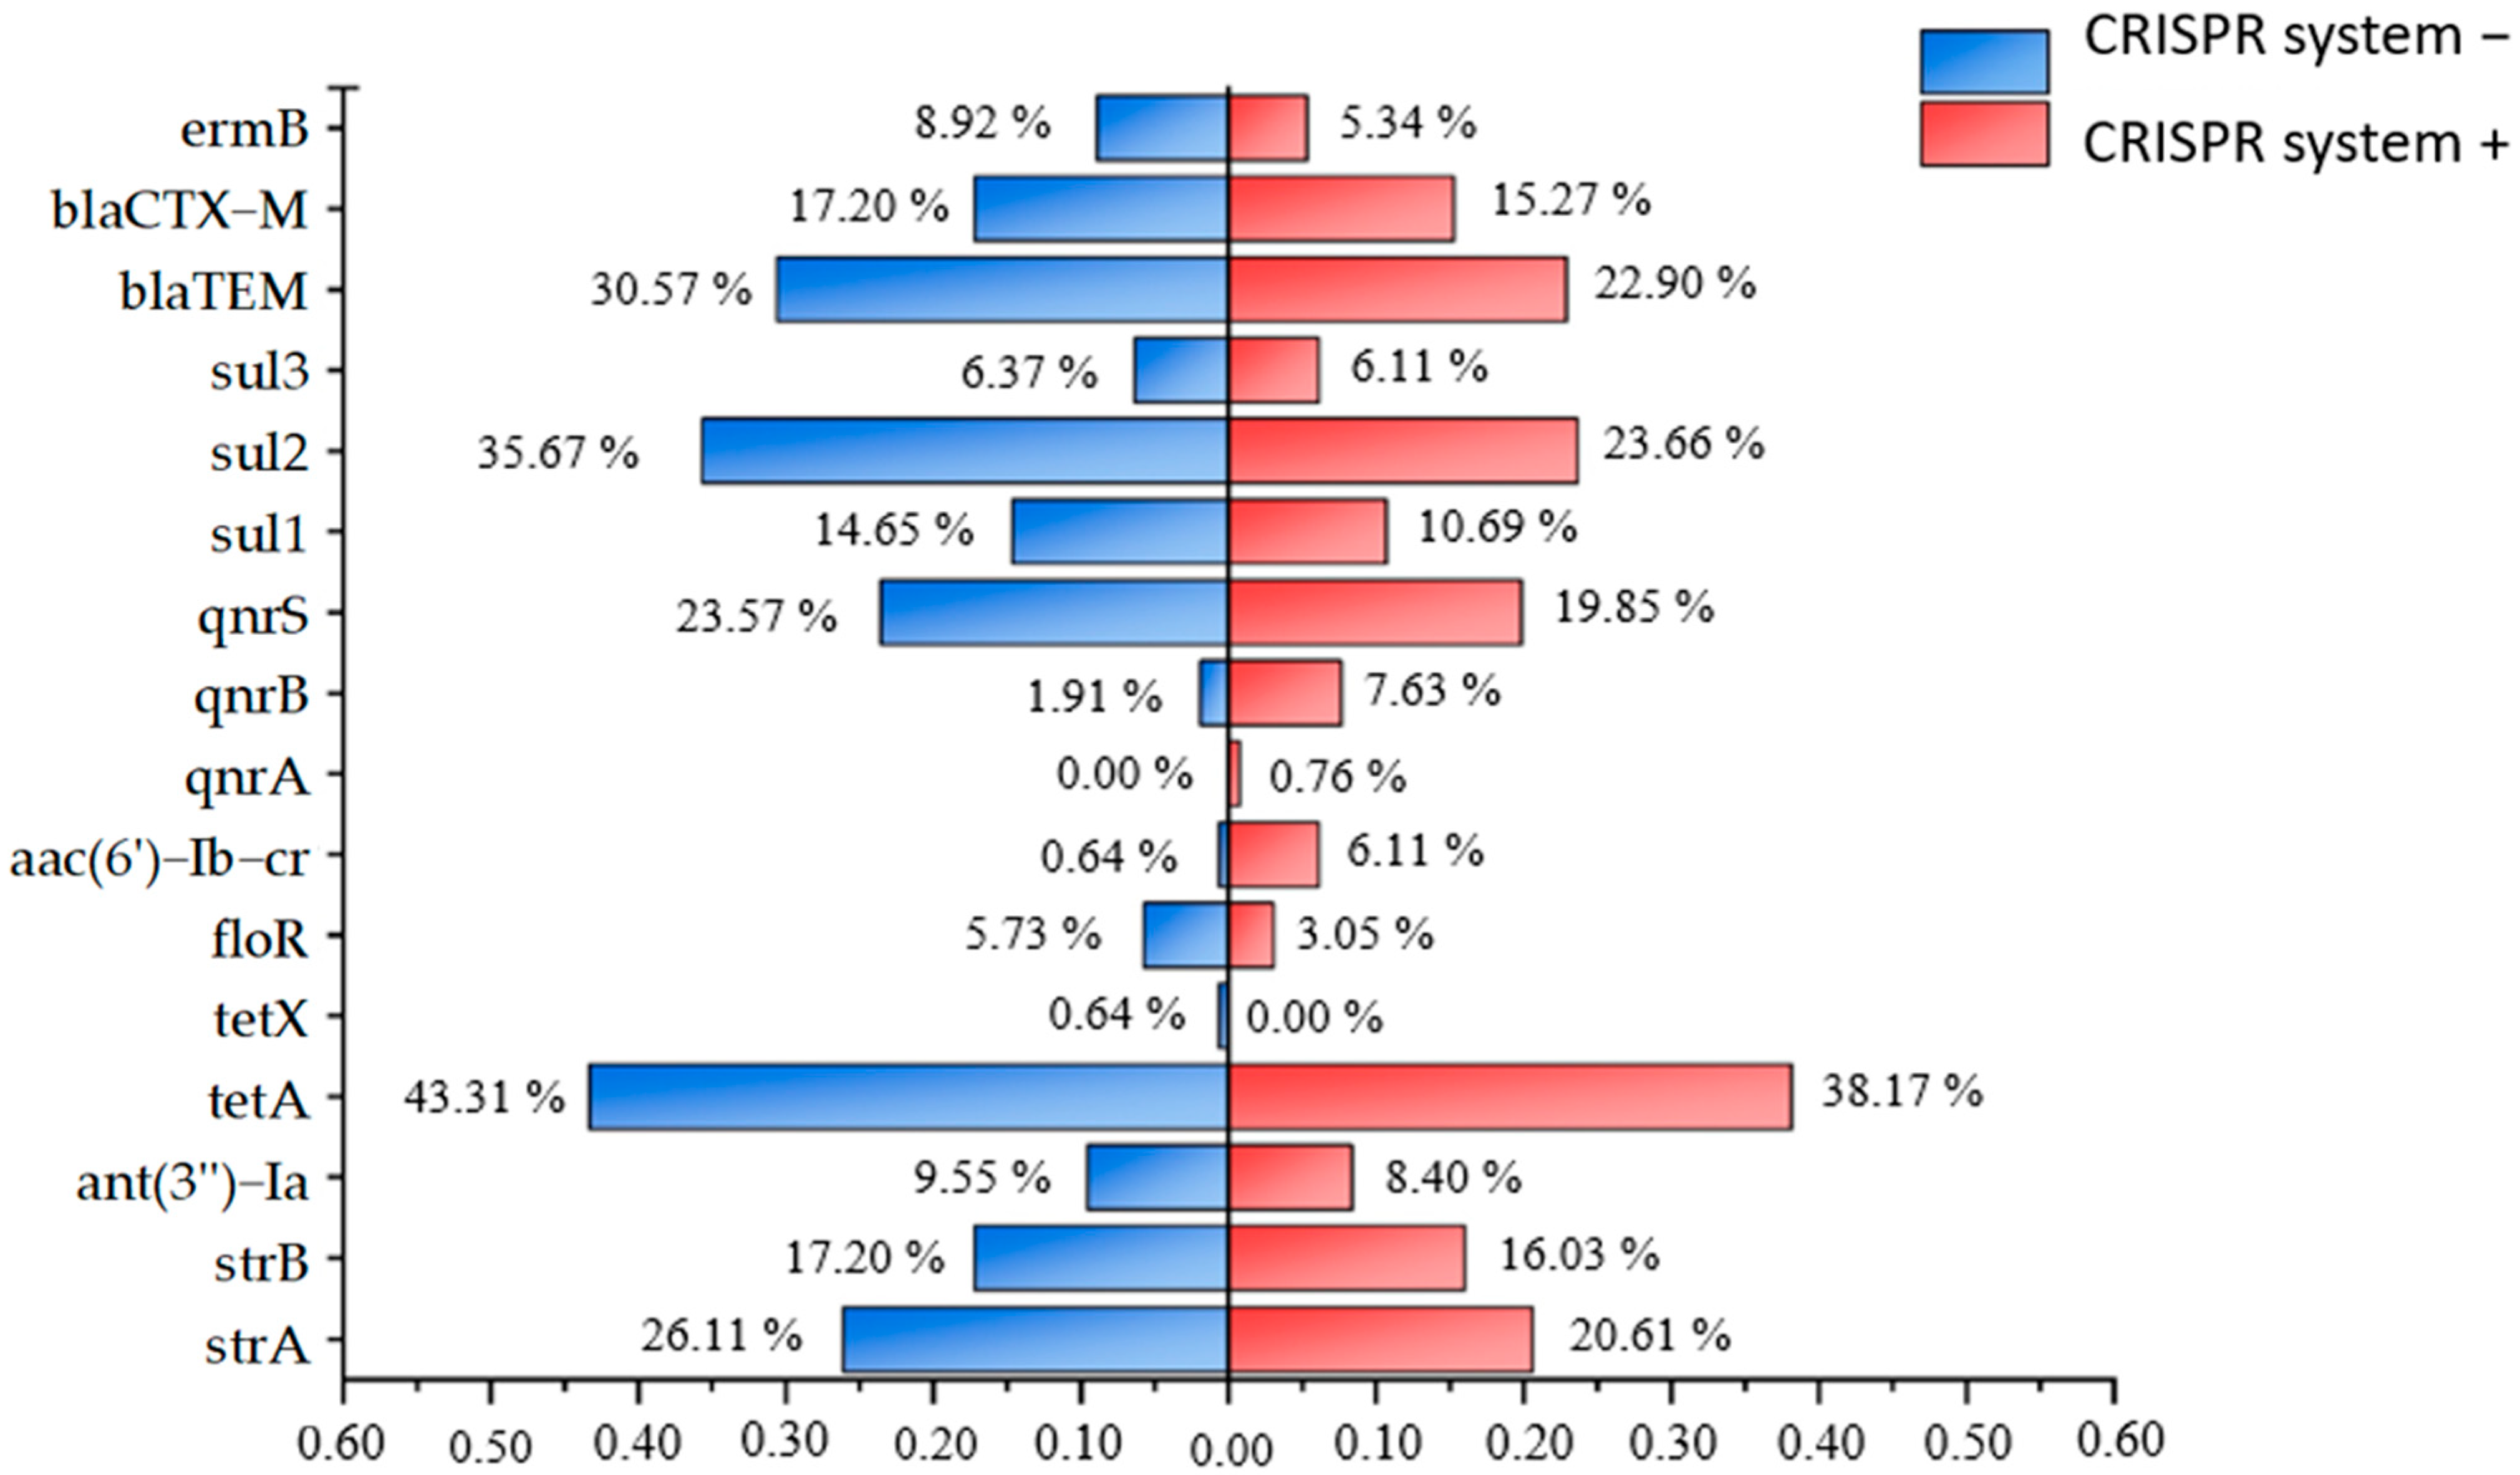
3.4. Characteristics Analysis of CRISPR System in Isolated Strains

Among the 288 E. coli isolates, 131 strains were detected with CRISPR structures, with a detection rate of 45.49%. A total of six types of repeat sequences were identified in the detected CRISPR structures. The repeat sequences in the CRISPR structure can be transcribed into RNA and form stem-loop secondary structures, which can serve as targets for CAS protein recognition and further cleavage [24]. As shown in Figure 4, the secondary structures of the six repeat sequences identified in this study were predicted. Based on the stem-loop structures, they can be divided into two categories. Sequences 1, 3, 4, and 5 had two loop structures in the head and middle regions, with the head loop comprising six bases, the middle loop nine bases, and the inter-loop stem region measuring five bases in length. The differences between sequences 1, 3, 4, and 5 mainly lie in the tail, with sequences 1 and 5 having two bases at the tail, and sequences 3 and 4 having three bases and one base at the tail, respectively. Sequences 2 and 6 had only one loop structure composed of six bases in the head in their secondary structures, and compared to other sequences, sequences 2 and 6 had longer tail sequences, reaching thirteen bases. As shown in Table 5, the minimum free energy of repeat sequences 1, 3, 4, and 5 was −15.20 kcal/mol, while that of sequences 2 and 6 was −14.20 kcal/mol.
The spacer sequences found in E. coli were compared with sequences in four databases (GenBank-Phage, RefSeqPlasmid, RefSeq-Microbial, and RefSeq-viral) using BLAST. A total of 1624 spacer sequences were identified using CRISPR Finder software version 1.1.2, and after excluding duplicate spacer sequences, 375 unique spacer sequences were counted. The CRISPR Target software version 6.1 was used to compare the sources of the identified non-duplicate spacer sequences, and 243 spacer sequences were found to have homologous fragments in the databases, including 148 from plasmids, 91 from phages, and 4 from viruses.
The comparison of antibiotic resistance rates and resistance gene detection rates between CRISPR system-positive and -negative strains, as shown in Figure 5 and Figure 6, showed that CRISPR system-negative strains had higher resistance rates to 16 antibiotics, including TET, DOX, LEV, CIP, TZP, SAM, AMC, CFX, CAZ, CXM, CRO, KZ, FOX, ATM, and F, compared to CRISPR system-positive strains. Among the 16 resistance genes detected in this experiment, CRISPR system-negative strains had lower detection rates only for aac(6′)-Ib-cr, qnrA, and qnrB compared to CRISPR system-positive strains. Additionally, 39.69% of CRISPR system-positive strains were MDR, while 54.78% of CRISPR system-negative strains were MDR. These results suggest that the CRISPR system may interfere with the acquisition of resistance genes and the development of resistance in E. coli isolates to a certain extent.

4. Discussion

Currently, antibiotic therapy remains the primary strategy for controlling bacterial infections globally [25]. However, the prevalence of MDR E. coli has been increasing, and with the rise in antibiotic resistance and the slow development of new antibiotics, E. coli-induced infections are imposing a growing health burden and mortality risk [26,27]. Antimicrobial susceptibility testing is crucial for guiding the selection of appropriate antimicrobial agents to treat infections and control the prevalence of MDR bacteria.
According to the resistance profiles of the isolated strains in this study, 288 E. coli strains exhibited 193 resistance phenotypes. The complex resistance phenotypes of the isolated strains reflect the rapid and diverse changes in bacterial resistance patterns, which undoubtedly pose challenges to the treatment of bacterial infections in forest musk deer. Monitoring the resistance of strains isolated from farms, summarizing their resistance phenotypes, and using this information to guide the prudent and rational use of antibiotics will help select more effective prevention and treatment strategies in forest musk deer farming.
The highest resistance rate observed in this study was for tetracycline, which is consistent with the findings of several studies by Tao He [28], Katarzyna Ćwiek [29], Hanaa M El Maghraby [30], and others. This trend is not surprising, as tetracycline-class drugs are among the most commonly used antibiotics in aquaculture in China and globally. Their extensive use may contribute to the development of resistance in E. coli [31,32,33]. The high prevalence of antibiotic resistance among the 288 E. coli isolates partially reflects the issue of irrational antibiotic use in forest musk deer farms, highlighting the urgency of rational selection of antimicrobials in forest musk deer farming. However, the isolated strains in this study showed significantly lower resistance rates to meropenem, piperacillin–tazobactam, cefoxitin, polymyxin B, and nitrofurantoin, all below 10%, with PB having the lowest resistance rate at 1.74%. Based on the results of this experiment, the use of tetracyclines, quinolones, and aminoglycosides should be restricted in subsequent forest musk deer farming, while polypeptide antibiotics should be considered as a priority for treating E. coli infections in forest musk deer. Polypeptide antibiotics exhibit broad-spectrum activity against Gram-positive/negative bacteria, fungi, viruses, and protozoa. Unlike conventional antibiotics, they act by disrupting cell membranes or targeting multiple pathways, posing lower resistance risks [34]. Additionally, polypeptide antibiotics are poorly absorbed in the animal intestine, acting primarily in the digestive tract, with extremely low residual levels in the body, ensuring high safety of use. As natural or synthetic antimicrobial molecules composed of amino acids, polypeptide antibiotics have become important alternatives to traditional antibiotics in recent years, demonstrating significant advantages in growth promotion and disease treatment in animal farming [35].
Analysis of the resistance gene carriage rates in different regions showed that Yunnan had the lowest carriage rates of all resistance genes, significantly lower than the average of the three regions, while Shaanxi had higher detection rates of 10 resistance genes than the other two regions, with sul2, strA, strB, and blaTEM showing much higher detection rates than Sichuan and Yunnan. The differences in antibiotic susceptibility test results and resistance gene detection rates among the three regions of Sichuan, Shaanxi, and Yunnan may be primarily attributed to differences in the types, frequency, and intensity of antibiotic use in each region, as evidenced by the findings of Nicola M Pfeifer [36] and others on the impact of antibiotic selection pressure on resistance phenotypes. Secondly, environmental and ecological factors may also indirectly influence the spread of bacterial resistance. Studies have shown that differences in climate zones can indirectly regulate the transmission dynamics of resistance genes by affecting the structure of environmental microorganisms. For example, in warmer environments, the proportion of strains carrying carbapenem and β-lactam resistance genes increases significantly [37]. Environmental media such as soil and water in different regions of ecosystems also influence the spread of resistance genes and the colonization of resistant strains [38]. Furthermore, the genetic background of strains and adaptive evolution may also contribute to these phenomena [39].
Notably, a tetX-carrying E. coli strain was isolated from Sichuan in this experiment. This gene can cause high-level resistance to tigecycline, which is an irreplaceable treatment for MDR bacterial infections in humans. With the increasing severity of carbapenem antibiotic resistance in recent years, tigecycline has become the optimal choice for treating MDR bacterial infections and has been designated by the World Health Organization (WHO) as the last line of defense against infections caused by multi-drug resistance Gram-negative bacteria, classified as a critical antimicrobial agent requiring strict restriction of use. Tigecycline has a mechanism of action similar to other tetracyclines, inhibiting bacterial protein synthesis by binding to the 30S subunit of the ribosome [40,41]. Although tigecycline is not permitted for use in animal husbandry, numerous cases of plasmid-mediated tigecycline resistance gene tetX have been detected in animal-derived bacteria in recent years, increasing the probability of horizontal transmission of tetX. If this leads to clinical treatment failure in humans, it could potentially trigger a global public health crisis. Some researchers speculate that the increased detection rate of tetX in animal-derived bacteria in recent years may be related to the long-term selection pressure caused by the extensive use of tetracycline-class antibiotics in regions such as China, the United States, and Europe over recent decades, which may have promoted the emergence and spread of tetX [42]. Mobile plasmids such as IncQ, IncX1, and IncFIB play a crucial role in this process. Studies have found that tetX-positive plasmids with the same Inc type were detected in E. coli strains with the same or different ST types, further confirming the important role of plasmids in the transmission of the tetX gene. Additionally, the mobile element ISCR2 has been confirmed to mediate the transmission of tetX between plasmids and chromosomes in different hosts, and ISCR2 is present in the upstream or downstream genes of multiple tetX mutants such as tet(X3), tet(X4), and tet(X5) [43,44,45,46]. Therefore, monitoring the prevalence of tetX in animal-derived E. coli has become increasingly urgent.
Analysis of the correlation between ARGs and AMRs in the isolated strains revealed 191 pairs of positive correlations. However, there were also phenomena where resistance phenotypes did not match resistance gene carriage, such as some isolated strains carrying only a few ARGs (e.g., qnrA, tetA, sul2, and ermB) or no ARGs at all but still showing resistance to some antibiotics, while other strains carried resistance genes but did not exhibit resistance to the corresponding antibiotics. Possible reasons for these phenomena include the following. (1) Bacteria exhibit different sensitivities to antibiotics when in different metabolic states. For example, bacteria in a non-dividing state with low metabolic activity show increased sensitivity to ciprofloxacin and streptomycin but reduced sensitivity to penicillin and tetracycline, a phenomenon known as “drug indifference”, which is common in chronic infections. When treatment is stopped, some bacteria may recover from a quiescent state to a normal state, leading to disease recurrence [47,48,49,50]. (2) Carried resistance genes may be in a silent state and unexpressed, defined as “silent antibiotic resistance genes”. Bacterial resistance genes are mostly acquired from the outside through horizontal transfer, so bacteria often silence these foreign genes through various mechanisms to reduce survival costs. The expression of resistance genes can be influenced by their carriage in different bacterial species and the nutritional status of the bacteria. Although silent resistance genes do not confer antibiotic resistance, they can still be transmitted among bacterial populations, posing a potential threat to antibiotic therapy [51]. (3) Bacteria without resistance genes can also develop antibiotic resistance through biofilm formation, reduced growth rate, metabolic changes, and stimulating the expression of efflux pumps through metabolic products [52].
Previous studies have demonstrated that the spacer sequences in the bacterial CRISPR system share high homology with exogenous genes such as plasmids and phages and certain bacterial endogenous genes [24]. Therefore, in this study, 375 non-duplicate E. coli spacer sequences were subjected to BLAST comparison against four databases: GenBank-Phage, RefSeq-Plasmid, RefSeq-Microbial, and RefSeq-viral. A total of 243 spacer sequences had homologous matches in the databases, including 99 sequences homologous to E. coli phages or plasmids, confirming that E. coli defends against phages and exogenous plasmids by integrating exogenous genes into its CRISPR structure. Homologous sequences were also identified with plasmids and phages of other bacterial species such as Salmonella, Enterococcus, Citrobacter braakii, Escherichia fergusonii, Klebsiella pneumoniae, and Shigella flexneri. This may be due to the close genetic relationship and similar living environments of E. coli with these bacteria, as well as the animal intestine providing a favorable environment for horizontal gene transfer between these bacteria [53]. Although many spacer sequences were repetitive, the repeated appearance of these spacer sequences in different or the same strains indicates that the CRISPR structure of bacteria is constantly inserting and deleting spacer sequences during the evolution of bacteria [54]. The combination of repeat sequences and spacer sequences from different bacteria exhibits significant differences in arrangement and sequence, which may provide greater help for typing and tracing bacteria carrying CRISPR structures in the future [55,56].
It should be noted that this study had limitations, including the limited number of antibiotics and resistance genes tested, as well as transposons, insertion sequences, and integrons that were not considered. In future studies, facing the complex problem of bacterial resistance, whole-genome sequencing (WGS) technology should be used to provide a more comprehensive investigation of resistance gene carriage in isolated strains, combined with environmental conditions, genetic interactions, and bacterial adaptive mechanisms for a more comprehensive integrated analysis based on gene detection and resistance phenotype experiments.

5. Conclusions

In summary, this study isolated 288 E. coli strains from feces of captive forest musk deer in Sichuan, Shaanxi, and Yunnan Provinces of China, conducted antibiotic susceptibility testing, resistance gene detection, and CRISPR system carriage analysis, and analyzed the correlations among them. In terms of resistance, the isolated strains from the three regions showed high resistance rates to tetracycline, trimethoprim–sulfamethoxazole, and cefalexin, but Yunnan had relatively lower resistance rates to various antibiotics compared to the other two regions. For resistance genes, tetA, strA, sul3, and blaTEM had high detection rates, and correlation analysis revealed 29 ARG–AMR pairs with positive correlations between resistance genes and their mediated phenotypes. The proportions of MDR bacteria, antibiotic resistance rates, and resistance gene detection rates were compared between CRISPR system-positive and CRISPR system-negative strains. The results of this study provide a theoretical basis for the rational use of antibiotics in forest musk deer farms and the efficient prevention and treatment of bacterial diseases in forest musk deer. From the “One Health” perspective, conducting antibiotic susceptibility testing and resistance gene detection on animal-derived E. coli will also contribute to the common development of animal welfare, agricultural biosafety, and public health.

Supplementary Materials

The following supporting information can be downloaded at: https://www.mdpi.com/article/10.3390/microorganisms13071683/s1, Table S1: Primers used in this study; Table S2: Isolate strains resistance phenotypic details in this study; Table S3: Statistics on the carriage of antimicrobial resistance genes in isolated E. coli strains.

Author Contributions

Conceptualization, K.Y. and X.W.; methodology, K.Y. and X.W.; software, K.Y.; validation, K.Y. and X.W.; formal analysis, X.W.; investigation, K.Y., X.W. and Y.L.; resources, K.Y., X.W. and Y.L.; data curation, K.Y., X.W. and Y.L.; writing—original draft preparation, K.Y.; writing—review and editing, K.Y., X.W. and Y.L.; visualization, K.Y.; supervision, H.D., B.M., Z.L., Y.W., Z.Y., X.Y. and Y.L.; project administration, Y.L.; funding acquisition, Y.L. All authors have read and agreed to the published version of the manuscript.

Funding

This research was funded by the Natural Science Foundation of Sichuan Province (2024NSFSC0378).

Institutional Review Board Statement

All animal experiments were approved by the institutional animal care and use committee of Sichuan Agricultural University of China (Approval number 20250663, 19 June 2025).

Informed Consent Statement

Not applicable.

Data Availability Statement

The original contributions presented in this study are included in the article/Supplementary Materials. Further inquiries can be directed to the corresponding author.

Conflicts of Interest

The authors declare no conflicts of interest.

Abbreviations

The following abbreviations are used in this manuscript:
MDRmulti-drug resistance
CRISPR-CasClustered Regularly Interspaced Short Palindromic Repeats-associated protein
WHOWorld Health Organization
ARGsAntibiotic resistance genes
DRdirect repeats
IUCNInternational Union for Conservation of Nature
CLSIClinical and Laboratory Standards Institute
rPearson correlation coefficient
WGSwhole-genome sequencing

References

  1. Mendelson, M.; Laxminarayan, R.; Limmathurotsakul, D.; Kariuki, S.; Gyansa-Lutterodt, M.; Charani, E.; Singh, S.; Walia, K.; Gales, A.C.; Mpundu, M. Antimicrobial resistance and the great divide: Inequity in priorities and agendas between the Global North and the Global South threatens global mitigation of antimicrobial resistance. Lancet Glob. Health 2024, 12, e516–e521. [Google Scholar] [CrossRef]
  2. Hernando-Amado, S.; Coque, T.M.; Baquero, F.; Martínez, J.L. Defining and combating antibiotic resistance from One Health and Global Health perspectives. Nat. Microbiol. 2019, 4, 1432–1442. [Google Scholar] [CrossRef]
  3. Smit, C.C.H.; Lambert, M.; Rogers, K.; Djordjevic, S.P.; Van Oijen, A.M.; Keighley, C.; Taxis, K.; Robertson, H.; Pont, L.G. One Health Determinants of Escherichia coli Antimicrobial Resistance in Humans in the Community: An Umbrella Review. Int. J. Mol. Sci. 2023, 24, 17204. [Google Scholar] [CrossRef]
  4. Li, B.; Yang, Y.; Ma, L.; Ju, F.; Guo, F.; Tiedje, J.M.; Zhang, T. Metagenomic and network analysis reveal wide distribution and co-occurrence of environmental antibiotic resistance genes. ISME J. 2015, 9, 2490–2502. [Google Scholar] [CrossRef]
  5. Li, F.; Li, M.; Nie, L.; Zuo, J.; Fan, W.; Lian, L.; Hu, J.; Chen, S.; Jiang, W.; Han, X.; et al. Molecular Epidemiology and Antibiotic Resistance Associated with Avian Pathogenic Escherichia coli in Shanxi Province, China, from 2021 to 2023. Microorganisms 2025, 13, 541. [Google Scholar] [CrossRef]
  6. Blake, K.S.; Xue, Y.P.; Gillespie, V.J.; Fishbein, S.R.; Tolia, N.H.; Wencewicz, T.A.; Dantas, G. The tetracycline resistome is shaped by selection for specific resistance mechanisms by each antibiotic generation. Nat. Commun. 2025, 16, 1452. [Google Scholar] [CrossRef]
  7. Sommer, M.O.A.; Munck, C.; Toft-Kehler, R.V.; Andersson, D.I. Prediction of antibiotic resistance: Time for a new preclinical paradigm? Nat. Rev. Microbiol. 2017, 15, 689–696. [Google Scholar] [CrossRef] [PubMed]
  8. Poirel, L.; Madec, J.Y.; Lupo, A.; Schink, A.K.; Kieffer, N.; Nordmann, P.; Schwarz, S. Antimicrobial Resistance in Escherichia coli. Microbiol. Spectr. 2018, 6, 10. [Google Scholar] [CrossRef] [PubMed]
  9. He, Y.; Yuan, Q.; Mathieu, J.; Stadler, L.; Senehi, N.; Sun, R.; Alvarez, P.J. Antibiotic resistance genes from livestock waste: Occurrence, dissemination, and treatment. NPJ Clean Water 2020, 3, 4. [Google Scholar] [CrossRef]
  10. Dong, H.; Cui, Y.; Zhang, D. CRISPR/Cas Technologies and Their Applications in Escherichia coli. Front. Bioeng. Biotechnol. 2021, 9, 762676. [Google Scholar] [CrossRef]
  11. Tong, Y.; Jørgensen, T.S.; Whitford, C.M.; Webe, T.; Lee, S.Y. A versatile genetic engineering toolkit for E. coli based on CRISPR-prime editing. Nat. Commun. 2021, 12, 5206. [Google Scholar] [CrossRef]
  12. Pandova, M.; Kizheva, Y.; Hristova, P. Relationship Between CRISPR-Cas Systems and Acquisition of Tetracycline Resistance in Non-Clinical Enterococcus Populations in Bulgaria. Antibiotics 2025, 14, 145. [Google Scholar] [CrossRef] [PubMed]
  13. Palmer, K.L.; Gilmore, M.S. Multidrug-resistant enterococci lack CRISPR-cas. mBio 2010, 1, e00227-10. [Google Scholar] [CrossRef] [PubMed]
  14. Gholizadeh, P.; Aghazadeh, M.; Ghotaslou, R.; Rezaee, M.A.; Pirzadeh, T.; Cui, L.; Watanabe, S.; Feizi, H.; Kadkhoda, H.; Kafil, H.S. Role of CRISPR-Cas system on antibiotic resistance patterns of Enterococcus faecalis. Ann. Clin. Microbiol. Antimicrob. 2021, 20, 49. [Google Scholar] [CrossRef] [PubMed]
  15. Jie, H.; Li, F.; Liu, Q.; Zheng, T.; Tan, H.; Feng, X.; Zhao, G.; Zeng, D.; Li, D.; Xu, Z.; et al. Elucidating metabolites and biosynthetic pathways during musk maturation: Insights from forest musk deer. Front. Pharmacol. 2025, 16, 1503138. [Google Scholar] [CrossRef]
  16. Gong, R.; Song, S.; Ai, Y.; Wang, S.; Dong, X.; Ren, Z.; Xie, H.; Jiang, B.; Zhao, L. Exploring the growing forest musk deer (Moschus berezovskii) dietary protein requirement based on gut microbiome. Front. Microbiol. 2023, 14, 1124163. [Google Scholar] [CrossRef]
  17. Wu, X.; Yang, W.; Cheng, J.; Luo, Y.; Fu, W.; Zhou, L.; Wu, J.; Wang, Y.; Zhong, Z.; Yang, Z.; et al. Molecular cloning, prokaryotic expression and its application potential evaluation of interferon (IFN)-ω of forest musk deer. Sci. Rep. 2023, 13, 10625. [Google Scholar] [CrossRef]
  18. Church, D.L.; Cerutti, L.; Gürtler, A.; Griener, T.; Zelazny, A.; Emler, S. Performance and Application of 16S rRNA Gene Cycle Sequencing for Routine Identification of Bacteria in the Clinical Microbiology Laboratory. Clin. Microbiol. Rev. 2020, 33, 19. [Google Scholar] [CrossRef]
  19. Salam, M.A.; Al-Amin, M.Y.; Pawar, J.S.; Akhter, N.; Lucy, I.B. Conventional methods and future trends in antimicrobial susceptibility testing. Saudi J. Biol. Sci. 2023, 30, 103582. [Google Scholar] [CrossRef]
  20. Humphries, R.; Bobenchik, A.M.; Hindler, J.A.; Schuetz, A.N. Overview of Changes to the Clinical and Laboratory Standards Institute Performance Standards for Antimicrobial Susceptibility Testing, M100, 31st Edition. J. Clin. Microbiol. 2021, 59, e0021321. [Google Scholar] [CrossRef]
  21. Liu, H.; Pan, S.; Cheng, Y.; Luo, L.; Zhou, L.; Fan, S.; Wang, L.; Jiang, S.; Zhou, Z.; Liu, H.; et al. Distribution and associations for antimicrobial resistance and antibiotic resistance genes of Escherichia coli from musk deer (Moschus berezovskii) in Sichuan, China. PLoS ONE 2023, 18, e0289028. [Google Scholar] [CrossRef]
  22. Zhu, Z.; Jiang, S.; Qi, M.; Liu, H.; Zhang, S.; Liu, H.; Zhou, Z.; Wang, L.; Wang, C.; Luo, Y.; et al. Prevalence and characterization of antibiotic resistance genes and integrons in Escherichia coli isolates from captive non-human primates of 13 zoos in China. Sci. Total Environ. 2021, 798, 149268. [Google Scholar] [CrossRef] [PubMed]
  23. Schober, P.; Boer, C.; Schwarte, L.A. Correlation Coefficients: Appropriate Use and Interpretation. Anesth. Analg. 2018, 126, 1763–1768. [Google Scholar] [CrossRef] [PubMed]
  24. Kunin, V.; Sorek, R.; Hugenholtz, P. Evolutionary conservation of sequence and secondary structures in CRISPR repeats. Genome Biol. 2007, 8, R61. [Google Scholar] [CrossRef] [PubMed]
  25. Nkansa-Gyamfi, N.A.; Kazibwe, J.; Traore, D.A.; Nji, E. Prevalence of multidrug-, extensive drug-, and pandrug-resistant commensal Escherichia coli isolated from healthy humans in community settings in low- and middle-income countries: A systematic review and meta-analysis. Glob. Health Action 2019, 12 (Suppl. S1), 1815272. [Google Scholar] [CrossRef]
  26. Antimicrobial Resistance Collaborators. Global burden of bacterial antimicrobial resistance in 2019: A systematic analysis. Lancet 2022, 399, 629–655. [Google Scholar] [CrossRef]
  27. Rozwadowski, M.; Gawel, D. Molecular Factors and Mechanisms Driving Multidrug Resistance in Uropathogenic Escherichia coli-An Update. Genes 2022, 13, 1397. [Google Scholar] [CrossRef]
  28. He, T.; Wang, R.; Liu, D.; Walsh, T.R.; Zhang, R.; Lv, Y.; Ke, Y.; Ji, Q.; Wei, R.; Liu, Z.; et al. Emergence of plasmid-mediated high-level tigecycline resistance genes in animals and humans. Nat. Microbiol. 2019, 4, 1450–1456. [Google Scholar] [CrossRef]
  29. Ćwiek, K.; Woźniak-Biel, A.; Karwańska, M.; Siedlecka, M.; Lammens, C.; Rebelo, A.R.; Hendriksen, R.S.; Kuczkowski, M.; Chmielewska-Władyka, M.; Wieliczko, A. Phenotypic and genotypic characterization of mcr-1-positive multidrug-resistant Escherichia coli ST93, ST117, ST156, ST10, and ST744 isolated from poultry in Poland. Braz. J. Microbiol. 2021, 52, 1597–1609. [Google Scholar] [CrossRef]
  30. El Maghraby, H.M.; El-Sayed, H.A.; Hussein, S.; El Azawy, D.S.; Attia, O.; Orabi, E.E.; Fahmy, Y.A. Detection of phylogrouping, adhesin, and extended spectrum β-lactamases genes in hospital acquired uropathogenic Escherichia coli isolates. Mol. Biol. Rep. 2024, 51, 143. [Google Scholar] [CrossRef]
  31. Peng, S.; Zheng, H.; Herrero-Fresno, A.; Olsen, J.E.; Dalsgaard, A.; Ding, Z. Co-occurrence of antimicrobial and metal resistance genes in pig feces and agricultural fields fertilized with slurry. Sci. Total Environ. 2021, 792, 148259. [Google Scholar] [CrossRef]
  32. Zhao, C.; Wang, Y.; Mulchandani, R.; Van Boeckel, T.P. Global surveillance of antimicrobial resistance in food animals using priority drugs maps. Nat. Commun. 2024, 15, 763. [Google Scholar] [CrossRef] [PubMed]
  33. Thaker, M.; Spanogiannopoulos, P.; Wright, G.D. The tetracycline resistome. Cell. Mol. Life Sci. 2010, 67, 419–431. [Google Scholar] [CrossRef] [PubMed]
  34. Roberts, K.D.; Zhu, Y.; Azad, M.A.K.; Han, M.L.; Wang, J.; Wang, L.; Yu, H.H.; Horne, A.S.; Pinson, J.-A.; Rudd, D.; et al. A synthetic lipopeptide targeting top-priority multidrug-resistant Gram-negative pathogens. Nat. Commun. 2022, 13, 1625. [Google Scholar] [CrossRef] [PubMed]
  35. Mahlapuu, M.; Håkansson, J.; Ringstad, L.; Björn, C. Antimicrobial Peptides: An Emerging Category of Therapeutic Agents. Front. Cell. Infect. Microbiol. 2016, 6, 194. [Google Scholar] [CrossRef]
  36. Pfeifer, N.M.; Weber, M.; Wiegand, E.; Barth, S.A.; Berens, C.; Menge, C. Escherichia coli resistant to the highest priority critically important fluoroquinolone or 3rd and 4th generation cephalosporin antibiotics persist in pigsties. Appl. Environ. Microbiol. 2025, 91, e0138624. [Google Scholar] [CrossRef]
  37. El Badawy, A.; Hamza, D.; Ahmed, Z.; Sabry, M.A. Seasonal and environmental drivers of antibiotic resistance and virulence in Escherichia coli from aquaculture and their public health implications. Sci. Rep. 2025, 15, 16100. [Google Scholar] [CrossRef]
  38. Tyrrell, C.; Burgess, C.M.; Brennan, F.P.; Muenzenmaier, D.; Drissner, D.; Leigh, R.J.; Walsh, F. Genomic analysis of antimicrobial resistant Escherichia coli isolated from manure and manured agricultural grasslands. npj Antimicrob. Resist. 2025, 3, 8. [Google Scholar] [CrossRef]
  39. Zhou, J.; Zhou, J.; Chen, M.; Lü, P.; Jiang, C. Prevalence of β-lactam antibiotic resistance of Escherichia coli isolated from a neonatal intensive care unit. BMC Pediatr. 2025, 25, 95. [Google Scholar] [CrossRef]
  40. Sun, J.; Chen, C.; Cui, C.Y.; Zhang, Y.; Liu, X.; Cui, Z.-H.; Ma, X.Y.; Feng, Y.; Fang, L.X.; Lian, X.-L. Plasmid-encoded tet(X) genes that confer high-level tigecycline resistance in Escherichia coli. Nat. Microbiol. 2019, 4, 1457–1464. [Google Scholar] [CrossRef]
  41. Brodersen, D.E.; Clemons, W.M.; Carter, A.P.; Morgan-Warren, R.J.; Wimberly, B.T.; Ramakrishnan, V. The structural basis for the action of the antibiotics tetracycline, pactamycin, and hygromycin B on the 30S ribosomal subunit. Cell 2000, 103, 1143–1154. [Google Scholar] [CrossRef]
  42. Sun, C.; Cui, M.; Zhang, S.; Wang, H.; Song, L.; Zhang, C.; Zhao, Q.; Liu, D.; Wang, Y.; Shen, J.; et al. Plasmid-mediated tigecycline-resistant gene tet(X4) in Escherichia coli from food-producing animals, China, 2008–2018. Emerg. Microbes Infect. 2019, 8, 1524–1527. [Google Scholar] [CrossRef]
  43. Fan, X.Y.; Jiang, Y.; Wu, H.; Liu, J.; Gu, Q.Y.; Wang, Z.Y.; Sun, L.; Jiao, X.; Li, Q.; Wang, J. Distribution and spread of tigecycline resistance gene tet(X4) in Escherichia coli from different sources. Front. Cell. Infect. Microbiol. 2024, 14, 1399732. [Google Scholar] [CrossRef]
  44. Cheng, Y.; Li, Y.; Yang, M.; He, Y.; Shi, X.; Zhang, Z.; Zhong, Y.; Zhang, Y.; Si, H. Emergence of novel tigecycline resistance gene tet(X5) variant in multidrug-resistant Acinetobacter indicus of swine farming environments. Vet. Microbiol. 2023, 284, 109837. [Google Scholar] [CrossRef] [PubMed]
  45. Tang, F.; Cai, W.; Jiang, L.; Wang, Z.; Liu, Y. Large-Scale Analysis of Fitness Cost of tet(X4)-Positive Plasmids in Escherichia coli. Front. Cell. Infect. Microbiol. 2022, 12, 798802. [Google Scholar] [CrossRef] [PubMed]
  46. Wang, J.; Lu, M.J.; Wang, Z.Y.; Jiang, Y.; Wu, H.; Pan, Z.M.; Jiao, X. Tigecycline-resistant Escherichia coli ST761 carrying tet(X4) in a pig farm, China. Front. Microbiol. 2022, 13, 967313. [Google Scholar] [CrossRef] [PubMed]
  47. Xie, J.; Zhou, M.; Cong, Z.; Xiao, X.; Liu, L.; Chen, S.; Jiang, W.; Wu, Y.; Liu, R. A host defense peptide-mimicking prodrug activated by drug-resistant Gram-negative bacterial infections. Sci. Transl. Med. 2025, 17, eadl4870. [Google Scholar] [CrossRef]
  48. Liu, X.; Wu, Y.; Mao, C.; Shen, J.; Zhu, K. Host-acting antibacterial compounds combat cytosolic bacteria. Trends Microbiol. 2022, 30, 761–777. [Google Scholar] [CrossRef]
  49. Stacy, A.; Andrade-Oliveira, V.; McCulloch, J.A.; Hild, B.; Oh, J.H.; Perez-Chaparro, P.J.; Sim, C.K.; Lim, A.I.; Link, V.M.; Enamorado, M.; et al. Infection trains the host for microbiota-enhanced resistance to pathogens. Cell 2021, 184, 615–627. [Google Scholar] [CrossRef]
  50. Stine, W.; Akiyama, T.; Weiss, D.; Kim, M. Lineage-dependent variations in single-cell antibiotic susceptibility reveal the selective inheritance of phenotypic resistance in bacteria. Nat. Commun. 2025, 16, 4655. [Google Scholar] [CrossRef]
  51. Deekshit, V.K.; Srikumar, S. ‘To be, or not to be’-The dilemma of ‘silent’ antimicrobial resistance genes in bacteria. J. Appl. Microbiol. 2022, 133, 2902–2914. [Google Scholar] [CrossRef]
  52. Hughes, D.; Andersson, D.I. Environmental and genetic modulation of the phenotypic expression of antibiotic resistance. FEMS Microbiol. Rev. 2017, 41, 374–391. [Google Scholar] [CrossRef] [PubMed]
  53. Chakraborty, S.; Snijders, A.P.; Chakravorty, R.; Ahmed, M.; Tarek, A.M.; Hossain, M.A. Comparative network clustering of direct repeats (DRs) and cas genes confirms the possibility of the horizontal transfer of CRISPR locus among bacteria. Mol. Phylogenet. Evol. 2010, 56, 878–887. [Google Scholar] [CrossRef] [PubMed]
  54. Makarova, K.S.; Haft, D.H.; Barrangou, R.; Brouns, S.J.; Charpentier, E.; Horvath, P.; Moineau, S.; Mojica, F.J.M.; Wolf, Y.I.; Yakunin, A.F. Evolution and classification of the CRISPR-Cas systems. Nat. Rev. Microbiol. 2011, 9, 467–477. [Google Scholar] [CrossRef] [PubMed]
  55. Toro, M.; Cao, G.; Ju, W.; Allard, M.; Barrangou, R.; Zhao, S.; Brown, E.; Meng, J. Association of clustered regularly interspaced short palindromic repeat (CRISPR) elements with specific serotypes and virulence potential of shiga toxin-producing Escherichia coli. Appl. Environ. Microbiol. 2014, 80, 1411–1420. [Google Scholar] [CrossRef]
  56. Yin, S.; Jensen, M.A.; Bai, J.; Debroy, C.; Barrangou, R.; Dudley, E.G. The evolutionary divergence of Shiga toxin-producing Escherichia coli is reflected in clustered regularly interspaced short palindromic repeat (CRISPR) spacer composition. Appl. Environ. Microbiol. 2013, 79, 5710–5720. [Google Scholar] [CrossRef]
Figure 1. The associations between ARGs among E. coli isolates from musk deer (n = 288). The intensity of the color represents the value of the correlation coefficient (r). * p ≤ 0.05 ** p ≤ 0.01 *** p ≤ 0.001.
Microorganisms 13 01683 g001
Figure 2. The associations between AMRs among E. coli isolates from musk deer (n = 288). The intensity of the color represents the value of the correlation coefficient (r). * p ≤ 0.05 ** p ≤ 0.01 *** p ≤ 0.001.
Microorganisms 13 01683 g002
Figure 3. The associations between AMRs and ARGs among E. coli isolates from musk deer (n = 288). The intensity of the color represents the value of the correlation coefficient (r). * p ≤ 0.05 ** p ≤ 0.01 *** p ≤ 0.001.
Microorganisms 13 01683 g003
Figure 4. Prediction of secondary structure of E. coli repeat sequences. The structure is colored by base-pairing probabilities.
Microorganisms 13 01683 g004
Figure 5. Differences in resistance rates to various antibiotics between strains carrying and not carrying CRISPR systems. The antibiotic resistance rates of strains with and without the CRISPR system are, respectively, represented by red and blue.
Microorganisms 13 01683 g005
Figure 6. Differences in carrying rate of antibiotic resistance genes between strains carrying and not carrying CRISPR systems. The carriage rates of antibiotic resistance genes in strains with and without the CRISPR system are, respectively, represented by red and blue.
Microorganisms 13 01683 g006
Table 1. Antimicrobial resistance (AMR) detected in E. coli strains isolated from musk deer (n = 288).
Category of AntimicrobialNo. of Resistant Isolates (%)AntibioticNo. of Resistant Isolates (%)
aminoglycosides119 (41.32)gentamicin (CN)90 (31.25)
tobramycin (TOB)53 (18.40)
amikacin (AK)33 (11.46)
tetracyclines145 (50.34)tetracycline (TET)139 (48.26)
doxycycline (DOX)120 (41.67)
amide alcohols93 (32.29)florfenicol (FFC)66 (22.92)
chloramphenicol (CHL)84 (29.17)
quinolones82 (28.47)Levofloxacin (LEV)40 (13.89)
ciprofloxacin (CIP)51 (17.71)
sulfonamides105 (36.11)trimethoprim–sulfamethoxazole (SXT)105 (36.46)
β-lactams212 (73.61)piperacillin/tazobactam10:1 (TZP)12 (4.17)
ampicillin/sulbactam 1:1 (SAM)31 (10.76)
amoxicillin/clavulanic acid 2:1
(AMC)
101 (35.07)
cefalexin (CFX)130 (45.14)
ceftazidime (CAZ)82 (28.47)
cefuroxime sodium (CXM)108 (37.5)
ceftriaxone (CRO)107 (37.15)
cephazolin (KZ)108 (37.5)
cefoxitin (FOX)9 (3.13)
aztreonam (ATM)99 (34.37)
imipenem (IPM)89 (30.9)
meropenem (MEM)15 (5.21)
polypeptides5 (1.74)polymyxin b (PB)5 (1.74)
furans7 (2.43)nitrofurantoin (F)7 (2.43)
Table 2. The distribution among E. coli resistance phenotype from musk deer in Sichuan (n = 163), Shanxi (n = 70), and Yunnan (n = 55).
AntibioticNo. of Resistant Isolates in Sichuan (%)No. of Resistant Isolates in Shanxi (%)No. of Resistant Isolates in Yunnan (%)
Gentamicin (CN)45 (27.61)30 (42.86)15 (27.27)
Tobramycin (TOB)30 (18.40)16 (22.86)7 (12.73)
Amikacin (AK)32 (19.63)1 (1.43)0 (0.00)
Tetracycline (TET)79 (48.47)40 (57.14)20 (36.36)
Doxycycline (DOX)73 (44.79)32 (45.71)15 (27.27)
Florfenicol (FFC)43 (26.38)16 (22.86)7 (12.73)
Chloramphenicol (CHL)49 (30.06)28 (40.00)7 (12.73)
Levofloxacin (LEV)25 (15.34)12 (17.14)3 (5.45)
Ciprofloxacin (CIP)35 (21.47)13 (18.57)3 (5.45)
trimethoprim–sulfamethoxazole (SXT)60 (36.81)26 (37.14)19 (34.55)
piperacillin/tazobactam10:1 (TZP)9 (5.52)3 (4.29)0 (0.00)
ampicillin/sulbactam 1:1 (SAM)24 (14.72)7 (10.00)0 (0.00)
amoxicillin/clavulanic acid 2:1 (AMC)62 (38.04)24 (34.29)15 (27.27)
cefalexin (CFX)81 (49.69)26 (37.14)23 (41.82)
ceftazidime (CAZ)57 (34.79)21 (30.00)4 (7.27)
cefuroxime sodium (CXM)67 (41.10)24 (34.29)17 (30.91)
ceftriaxone (CRO)66 (40.49)26 (37.14)15 (27.27)
cephazolin (KZ)68 (41.72)23 (32.86)17 (30.91)
cefoxitin (FOX)5 (3.07)2 (2.86)2 (3.64)
aztreonam (ATM)68 (41.72)25 (35.71)6 (10.91)
imipenem (IPM)86 (52.76)3 (4.29)0 (0.00)
meropenem (MEM)7 (4.29)7 (10.00)1 (1.82)
polymyxin b (PB)2 (1.23)3 (4.29)0 (0.00)
nitrofurantoin (F)7 (4.29)0 (0.00)0 (0.00)
Table 3. Details of antimicrobial resistance (AMR) and antibiotic resistance genes (ARGs) detected in E. coli strains isolated from musk deer (n = 288).
Category of AntimicrobialNo. of Resistant Isolates (%)ARGsNo. of Positive Isolates (%)
aminoglycosides119 (41.32)strA68 (23.61%)
strB48 (16.67%)
gyrB262 (90.97%)
ant(3′′)-Ia26 (9.03%)
aph(3′)-IIa0 (0%)
tetracyclines145 (50.34)tetA118 (40.97%)
tetX1 (0.35%)
amide alcohols93 (32.29)flor
ermB
13 (4.51%)
21 (7.29%)
quinolones82 (28.47)aac(6′)-Ib-cr9 (3.13%)
qnrA1 (0.35%)
qnrB13 (4.51%)
qnrS63 (21.88%)
sulfonamides105 (36.11)sul137 (12.85%)
sul287 (30.21%)
sul368 (23.61%)
β-lactams212 (73.61)blaTEM78 (27.08%)
blaCTX-M47 (16.32%)
blaSHV0 (0%)
Table 4. The distribution of antibiotic resistance genes among E. coli from captive musk deer in Sichuan (n = 163), Shanxi (n = 70), and Yunan (n = 55).
ARGsNumber of Positive Strains in Sichuan (%)Number of Positive Strains in Shanxi (%)Number of Positive Strains in Yunnan (%)
floR7 (4.29%)6 (8.57%)0 (0.00%)
blaTEM40 (24.54%)37 (52.86%)1 (1.82%)
sul120 (12.27%)16 (22.86%)1 (1.82%)
sul246 (28.22%)40 (57.14%)1 (1.82%)
strA24 (14.72%)39 (55.71%)5 (9.09%)
gyrB148 (90.80%)65 (92.86%)49 (89.09%)
qnrS29 (17.79%)26 (37.14%)8 (14.55%)
strB8 (4.91%)36 (51.43%)4 (7.27%)
blaCTX-M24 (14.72%)18 (25.71%)5 (9.09%)
ermB19 (11.66%)2 (2.86%)0 (0.00%)
sul315 (9.20%)1 (1.43%)2 (3.64%)
blaSHV0 (0.00%)0 (0.00%)0 (0.00%)
qnrA1 (0.61%)0 (0.00%)0 (0.00%)
qnrB12 (7.36%)1 (1.43%)0 (0.00%)
aac(6′)-Ib-cr9 (5.52%)0 (0.00%)0 (0.00%)
ant(3′′)-Ia26 (15.95%)0 (0.00%)0 (0.00%)
aph(3′)-IIa0 (0.00%)0 (0.00%)0 (0.00%)
tetA61 (37.42%)39 (55.71%)18 (32.73%)
tetX1 (0.61%)0 (0.00%)0 (0.00%)
Table 5. Results for minimum free energy prediction of repeat sequences.
Repeat Sequences NumberRepeat Sequence (5′–3′)Minimum Free Energy Prediction
Sequence 1GTGTTCCCCGCGCCAGCGGGGATAAACCG−15.20 kcal/mol
Sequence 2CGGTTTATCCCCGCTGGCGCGGGGAACAC−14.20 kcal/mol
Sequence 3TGTGTTCCCCGCGCCAGCGGGGATAAACCG−15.20 kcal/mol
Sequence 4GTGTTCCCCGCGCCAGCGGGGATAAACC−15.20 kcal/mol
Sequence 5GTGTTCCCCGCGTCAGCGGGGATAAACCG−15.20 kcal/mol
Sequence 6CGGTTTATCCCCGCTGGCGCGGGGAACACG−14.20 kcal/mol
Disclaimer/Publisher’s Note: The statements, opinions and data contained in all publications are solely those of the individual author(s) and contributor(s) and not of MDPI and/or the editor(s). MDPI and/or the editor(s) disclaim responsibility for any injury to people or property resulting from any ideas, methods, instructions or products referred to in the content.

