Article

Healthy Ageing and Gut Microbiota: A Study on Longevity in Adults

by
Lihua Deng
1,†,
Jun Xu
2,3,†,
Qian Xue
1,
Yanan Wei
1 and
Jingtong Wang
1,*
1
Department of Geriatrics, Peking University People’s Hospital, Beijing 100044, China
2
Department of Gastroenterology, Peking University People’s Hospital, Beijing 100044, China
3
Clinical Center of Immune-Mediated Digestive Diseases, Peking University People’s Hospital, Beijing 100044, China
*
Author to whom correspondence should be addressed.
These authors contributed equally to this work.
Microorganisms 2025, 13(7), 1657; https://doi.org/10.3390/microorganisms13071657
Submission received: 24 April 2025 / Revised: 5 July 2025 / Accepted: 8 July 2025 / Published: 14 July 2025
(This article belongs to the Section Gut Microbiota)

Abstract

Many studies have focused on ageing and gut microbiota, but the correlation between gut microbiota and physical function in older adults, especially those with longevity, remains obscure and deserves further exploration. In this study we investigated changes in the gut microbiota and the association between gut microbiota and physical function in adults with longevity. This is a prospective observational study. Fifty-one older adults aged ≥ 60 years (including 27 participants aged 90 years and above) were enrolled. Information on clinical data, physical function including intrinsic capacity by Integrated Care for Older People (ICOPE) tool, and dietary habits of participants was collected and analysed. Gut microbiota structure and functional pathways were analysed by Metagenomics. Intrinsic capacity (measured as ICOPE scores) of adults’ longevity (aged 90–98, longe group) was significantly lower than older adults aged 60–89 years (CON group) (5.44 ± 2.15 vs. 6.71 ± 1.46, p = 0.017). Gut microbiota of the longe group is enriched in Akkermansia and Bifidobacterium, which may be beneficial to health. Gut microbiota was closely related to daily milk (including plain milk, flavoured milk with a content of cow’s milk or reconstituted milk of ≥80%, or reconstituted milk or fermented milk with a content of cow’s milk or milk powder of ≥80%) consumption, anxiety, and physical function including grip strength by the Short Physical Performance Battery (SPPB). Bacteroides plebeius and Bacteroides eggerthii were increased in long-living adults with better physical function. Escherichia coli was more abundant in frail young-old adults. Grip strength is positively correlated with the abundance of Roseburia hominis, Eubacterium rectale, Eubacterium eligens, and Roseburia intestinalis (p < 0.05). Pathways related to amino acid synthesis that include L-isoleucine, L-valine, and L-threonine were over-presented in long-living adults of better physical function. Adults with longevity showed comparable gut microbiota abundance to younger elderly individuals. The gut microbiota of long-living adults showed higher abundance of potentially beneficial bacteria, and the altered bacteria are closely associated with physical function. Changes in the gut microbiota may precede clinical indicators during the process of ageing. Gut microbiota may be a potential biomarker for longevity and healthy ageing. Nutrition and emotional state can be important influencing factors.

1. Background

The ageing global population is an important medical, social, and demographic problem [1]. Maintaining physical function and enabling well-being in older age has been defined as “healthy ageing” by the WHO [2,3]. Healthy ageing primarily involves preserving physical function and mental health free from anxiety and expression [2]. Research on healthy ageing has focused on longevity, physical function, and emotional well-being. Gut microbiota may play an important role. Numerous studies have shown that the gut microbiota reflects the influence of the environment on the body, regulates health status and disease risk, plays a regulatory role in the ageing process, and varies with age [4,5,6,7]. Therefore, the gut microbiota is regarded as a “metabolic organ” [8,9]. Pan Shifu et al. [10] found that centenarians’ gut microbiome exhibits youth-associated features in the gut microbiome, with high butyrate-producing bacteria abundance and lower Enterobacteriaceae and Proteobacteria levels. This suggests gut microbiota and metabolites correlate with longevity. Although many studies have been conducted on ageing and gut microbiota, the correlation between gut microbiota and physical function in older adults, especially those with longevity, remains obscure and deserves further exploration.
Older adults are prone to various chronic diseases that affect their physical function and quality of life. A series of methods include Fried phenotype for frailty, the Integrated Care for Older People (ICOPE) tool for intrinsic capacity, and the Short Physical Performance Battery (SPPB) for physical function. Frailty is a complex age-related condition characterised by a decline in physiological capacity of several organ systems. Adults with frailty are more susceptibility to diseases [11]. Intrinsic capacity was introduced by the World Health Organisation (WHO) [3] and combines all the physical and mental capacities an individual can reveal. Integrated Care for Older People (ICOPE) is a guideline for community-level interventions to manage declines in intrinsic capacity, including cognition, locomotion, vitality, sensory abilities, and psychosocial abilities [12]. The ICOPE tool can be used to quantitatively evaluate intrinsic capacity. The SPPB is a common tool for assessing physical function and is now widely used. Few studies have assessed older adults’ overall health and physical function by comprehensive assessment and examined their correlation with gut microbiota and the role of gut microbiota in healthy ageing.
This study investigated the role of the gut microbiota in healthy ageing by exploring the association between the gut microbiota and frailty, intrinsic capacity, and altered pathways. Information on chronic diseases, clinical indicators, and diet was collected and analysed.

2. Materials and Methods

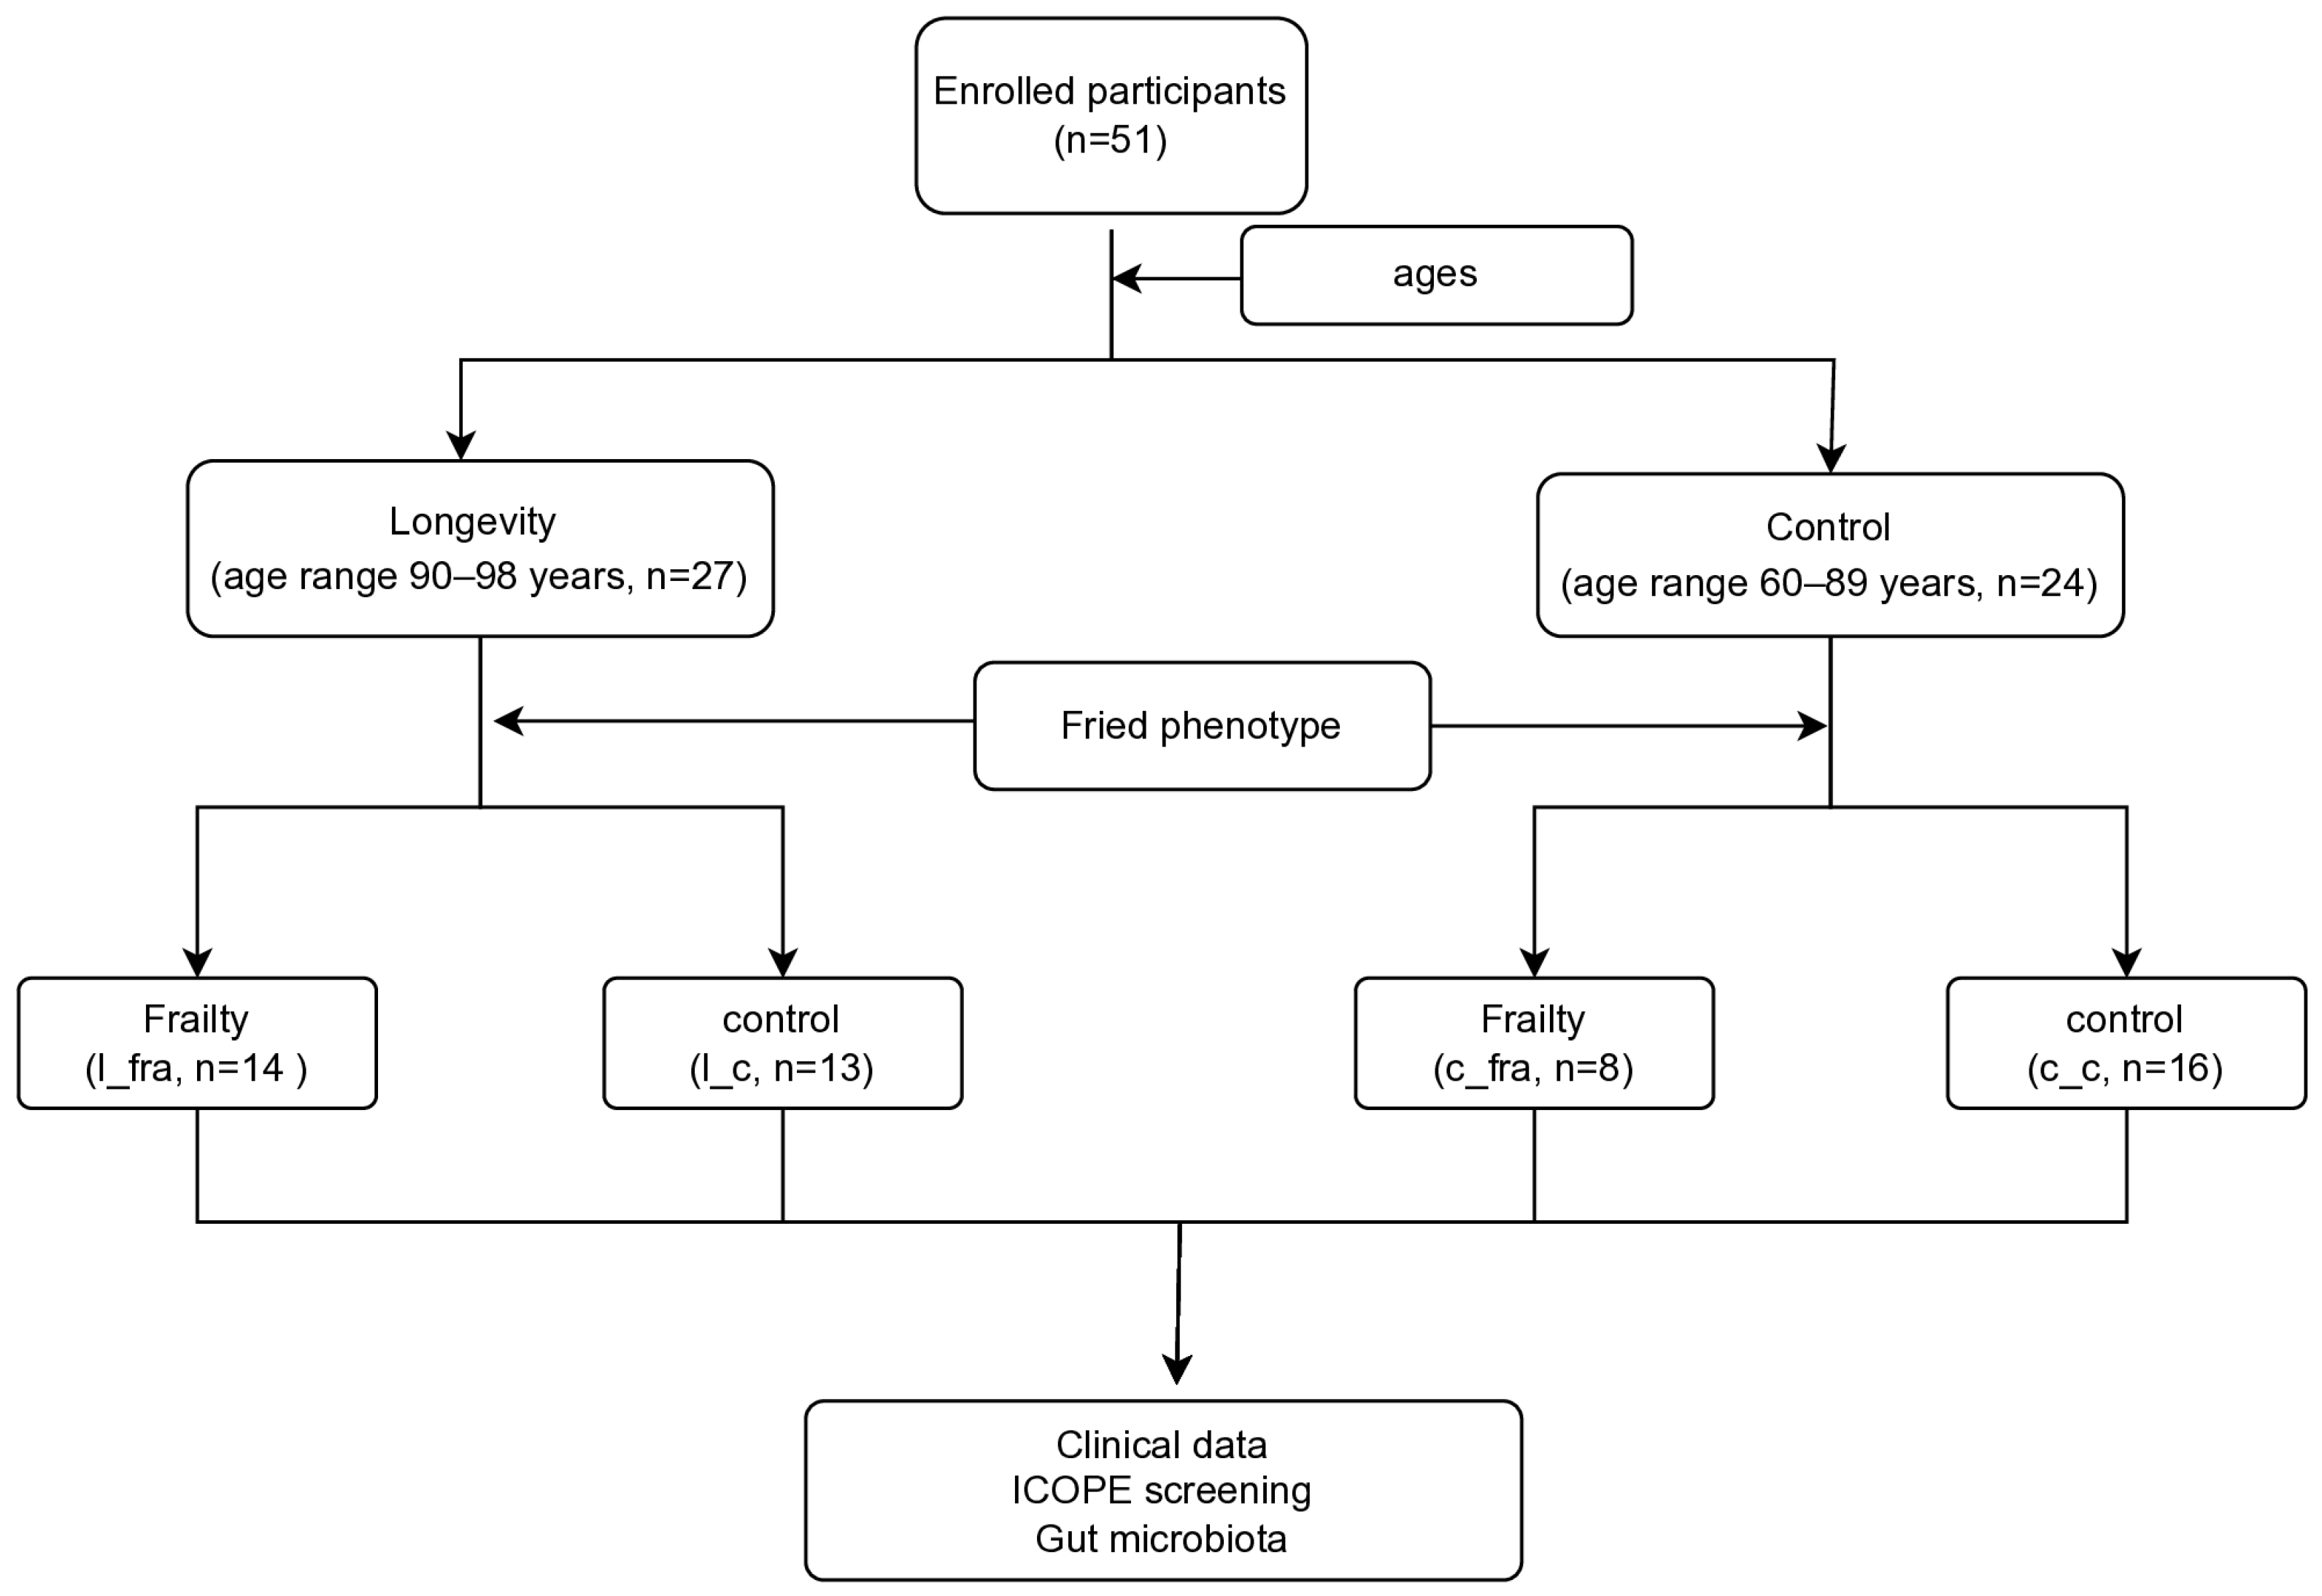
2.1. Study Participants

A prospective study was conducted between February 2021 and February 2022, during which long-lived adults (longe group, age range 90 years and above) and young-old adults (control group, age range 60–89 years) were continuously recruited at the geriatric department of Peking University People’s Hospital. Participants visited the geriatric department for regular examinations for chronic diseases. Frailty was defined by the Fried phenotype (FP 2001) [13]. Intrinsic capacity was screened using the ICOPE tool (Table 1) [14]. The Mini-Mental State Examination (MMSE) [15], Short Physical Performance Battery (SPPB) test [16], Mini-Nutritional Assessment Short Form (MNA-SF) [17], Brief 7-Item Self-Report Questionnaire for Generalised Anxiety Disorder (GAD-7) [18], and Patient Health Questionnaire-9 (PHQ-9) [19] were used to assess cognition, locomotion, nutrition, and psychosocial conditions, respectively. MMSE scores less than 27 were defined as mild cognitive impairment (MCI). We calculated a summary intrinsic capacity score by adding responses to all eight dichotomous questions from the five domains (possible range: 0–8). The higher the score, the better the intrinsic capacity. One or more abnormal results on the ICOPE screening tool were defined as impaired intrinsic ability (IC). The study was approved by the ethics committee of Peking University People’s Hospital, and all participants provided written informed consent.
Individuals who met one or more of the following criteria were excluded: inability to move and stand independently from a chair; chronic cardiopulmonary insufficiency preventing normal daily activities (either New York Heart Association Functional Classification III/IV or inability to tolerate a 6 min walk test); renal insufficiency (creatinine clearance < 60 mL/(min·1.73 m2)); or the presence of an active malignant gastroenteric neoplastic disease. The exclusion criteria were based on factors known or likely to impact the gut microbiota or those that confound the diagnosis of frailty.
All participants were interviewed to collect data concerning sex, age, education (years), smoking, history of hypertension (HTN) (sitting blood pressure ≥ 140/90 mmHg for two or more times), DM (confirmed by oral glucose tolerance test or glycosylated haemoglobin C ≥ 6.5%), non-alcoholic fatty liver disease (NAFLD, confirmed by ultrasound or computed tomography), and medication history (drugs used over 4 months in the past year).
A modified Food Frequency Questionnaire (FFQ) was used to collect information on participants’ diets. Daily milk consumption was recorded. Milk types included plain milk (ultra-heated sterilized plain milk or pasteurized milk), reconstituted milk, flavoured milk, or fermented milk (with a content of ≥80% cow’s milk or milk powder), measured in millilitres (ml). In this study, the main types of milk consumed by the individuals were ultra-heated sterilized plain milk, pasteurized milk, and fermented milk.
Blood samples were collected after 8 h of fasting. The samples were centrifuged at 3000 rpm at room temperature for 10 min; the supernatants were collected and stored in aliquots at −80 °C until use for routine and biochemical tests.

2.2. Sample Collection

Faecal samples were collected in sterile tubes containing a DNA stabiliser (Invitek, Berlin, Germany) according to the field sampling protocol. The samples were stored at −80 °C for further analysis. Total bacterial genomic DNA was extracted from the faecal samples using a TIANamp Bacteria DNA Kit (TIANGEN, Beijing, China). The eligibility criteria for faecal sampling were as follows: (1) no treatment with antibiotics or probiotics within 1 month before sample collection; and (2) no diarrhoea, fever, or infection within 1 month of sample collection.

2.3. Sequencing and Bioinformatics

A DNA library was constructed using the TruSeq Nano DNA LT Library Preparation Kit (FC-121-4001) (Illumina, San Diego, CA, USA). DNA was fragmented using dsDNA fragmentase (M0348S; NEB) at 37 °C for 30 min. Library construction began with fragmented cDNA. Blunt-end DNA fragments were generated using a combination of fill-in reactions and exonuclease activity, and size selection was performed using the provided sample purification beads. An A-base was then added to the blunt ends of each strand to prepare them for ligation to indexed adapters. Each adapter contained a T-base overhang for ligation to the A-tailed fragmented DNA. These adapters contained the full complement of the sequencing primer hybridisation sites for single-indexed, paired-end, and indexed reads. Single- or dual-index adapters were ligated to the fragments, and the ligated products were amplified with PCR under the following conditions: initial denaturation at 95 °C for 3 min; 8 cycles of denaturation at 98 °C for 15 s; annealing at 60 °C for 15 s; extension at 72 °C for 30 s; and then final extension at 72 °C for 5 min. We conducted paired-end sequencing (2 × 150) using the Illumina Hiseq 2000 sequencing platform (Illumina, San Diego, CA, USA).
The raw sequencing reads were processed to obtain valid reads for further analysis. First, sequencing adapters were removed from the sequencing reads using Cutadapt v1.9 [20]. Second, low-quality reads were trimmed using fqtrim v0.94, a sliding-window algorithm. Third, reads were aligned to the host genome using Bowtie2 v2.2.0 to remove host contamination. Once quality-filtered reads were obtained, they were assembled de novo to construct the metagenome of each sample using IDBA-UD v1.1.1 [21]. All coding regions (CDSs) of the metagenomic contigs were predicted using MetaGeneMark v3.26 [22]. The CDS sequences of all samples were clustered using CD-HIT v4.6.1 [23] to obtain unigenes. The unigene abundance of each sample was estimated by TPM based on the number of aligned reads using Bowtie2 v2.2.0 [24]. The lowest common ancestor taxonomy of the unigenes was obtained by alignment against the NCBI NR database using DIAMOND v0.9.14 [25]. Based on the taxonomic and functional annotation of unigenes, along with the abundance profile of unigenes, differential analysis was carried out at each taxonomic, functional, or gene level using Fisher’s exact test (categorical variables) or the Kruskal–Wallis test (continuous variable analysis). We used the linear discriminant analysis (LDA) effect size (LEfSe) [26] method to identify species with statistically significant differential abundance among groups, and results were validated with ALDEx2 (Table S1) [27]. Multivariate Association with Linear Models (MaAsLin) [28] was used to analyse the relationship between gut microbiota and longevity. The vegan (v 2.5-7) package [29] was used for calculating alpha diversity (Shannon’s and Simpson’s indexes) with bacterial relative abundance at the species level. The beta-diversity was calculated with the constrained principal coordinate analysis based on the Bray–Curtis distance [30].

2.4. Longevity-Associated Microbial Index

The longevity-associated microbial index (LAMI) was defined as the log value of the total abundance of bacterial genera enriched in the “longe” group (aged 90–98) divided by the total abundance of bacterial genera depleted in the “longe” group [31,32,33], which was expressed as follows:
L A M I = log 2 Σ e Σ d
where “e” presented bacterial contents enriched in the “longe”, and “d” presented the depleted. Based on bacterial contents with significant differences between the “longe” and the “CON” groups (aged 60–89) at different levels (genus, species, and strain), three LAMIs were calculated and used for describing the profiles of the bacterial community in long-lived individuals. At the genus level, Akkermansia was enriched in the “longe” group, and Alcaligenes, Candidatus_Saccharibacteria_noname_unclassified, Clostridiales_Family_XIII_Incertae_Sedis_noname, Granulicatella, and Weissella were depleted. At the species level, Akkermansia muciniphila, Bifidobacterium adolescentis, Lactobacillus salivarius, Clostridium bartlettii, and Streptococcus anginosus were enriched in the “longe” group, and Alcaligenes_unclassified, Bacteroides_sp_3_1_19, Bifidobacterium dentium, Eubacterium infirmum, Lachnospiraceae bacterium_1_4_56FAA, and Streptococcus australis were depleted. At the strain level, GCF_000020225, GCF_000154445, Bifidobacterium_dentium_unclassified, Lactobacillus_salivarius_unclassified, and Streptococcus_anginosus_unclassified were enriched, while Bifidobacterium_adolescentis_unclassified, GCF_000163655, GCF_000218385, GCF_000242675, and Streptococcus_australis_unclassified were depleted in the “longe” participants.

2.5. Functional Profiles of Microbial Communities with HMP Unified Metabolic Analysis Network 2 (HUMAnN2)

The HMP Unified Metabolic Analysis Network 2 (HUMAnN2) is a tiered search strategy that enables fast, accurate, and species-resolved functional profiling of host-associated and environmental communities [34,35]. To investigate the role of microbes in promoting longevity, we profiled the functions of HUMAnN2-based microbial genes.

2.6. Statistical Analysis

R software (v4.0.1; R Foundation for Statistical Computing, Vienna, Austria) with ggplot2 (v3.3.2) and pheatmap packages was used for data visualisation. SPSS software (version 20.0; IBM, Armonk, NY, USA) was used for statistical analysis, and numerical variables are expressed as mean values ± standard deviation (x ± s). An analysis of variance was used to compare the variables between the groups, and the chi-square test was used to analyse categorical variables among the groups. Multiple testing was used with the Bonferroni test. All statistical results were significant when the p-value ≤ 0.05 (two-tailed). The p-value was corrected with FDR, and FDR < 0.05 was considered significant.

3. Results

3.1. Demographic and Clinical Data of the Study Population

A total of 27 long-lived adults (longe group, age range 90–98 years, labelled as “longe”) and 24 young-old adults (control group, age range 60–89 years, labelled as “CON”) were enrolled in this study. The mean ages (SD) were 91.6 (1.9) years and 79.1 (6.8) years, respectively. The female population was higher in the CON group than in the longe group (58.3% vs. 29.6%, p = 0.039). No significant differences were observed between the longe and CON groups regarding DM, HTN, coronary heart disease (CHD), and NAFLD rates. In the longe group, 14 patients (51.9%) were defined as frail based on the FP criteria. Eight patients (33.3%) in the CON group were considered frail (Figure 1). The prevalence of impaired intrinsic capacity was 92.6% and 62.5% in the longe and CON groups, respectively. The longe group had lower scores for cognitive function (MMSE) (p = 0.001), nutritional status (MNA_SF) (p < 0.001), osteoporosis (osteoporosis self-assessment tool for Asians, OSTA) (p = 0.004), and intrinsic capacity (p = 0.017) (Table 2). Furthermore, the longe group had lower serum albumin levels and higher creatinine levels (both p < 0.05). Multifactorial analysis showed that higher daily milk intake (300–500 mL/d vs. <300 mL/d) and higher MNA-SF scores were independent protective factors against frailty, while ageing was an independent risk factor (Figure S3C).

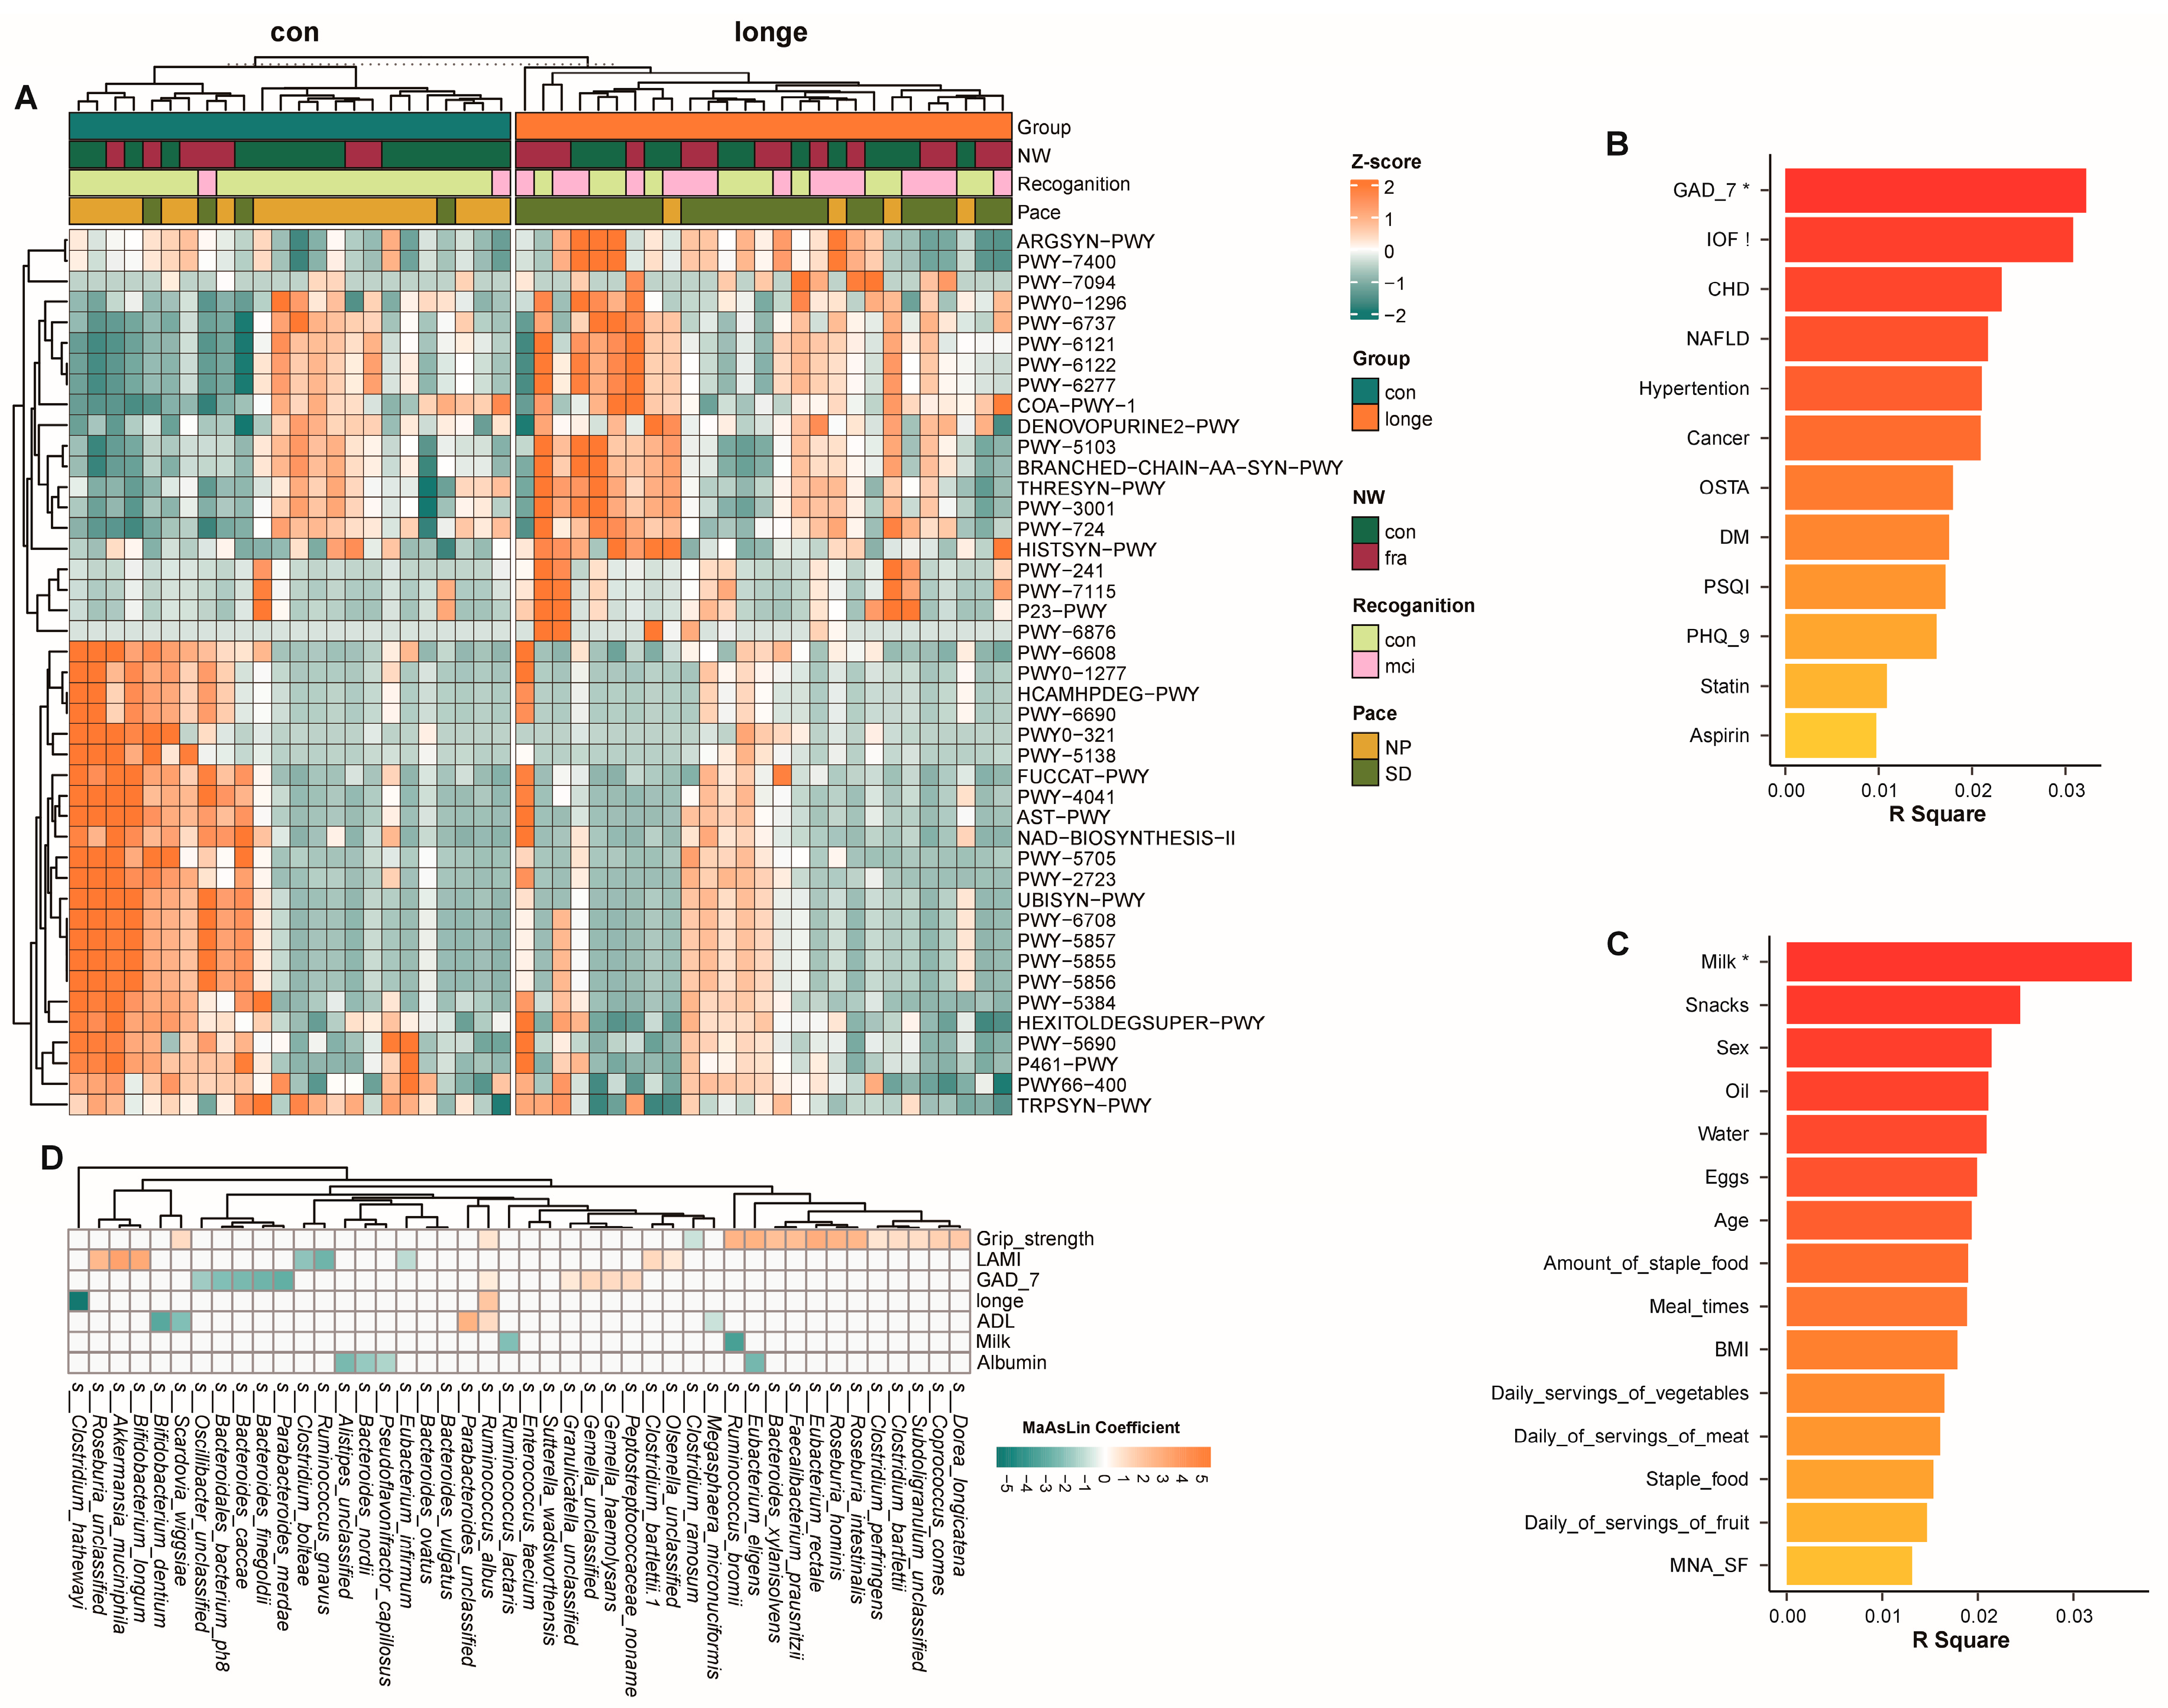
3.2. Bacterial Diversity, Abundance, and Functionality

No significant differences were observed in Shannon’s index, Simpson’s index, or the principal component analysis between the longe (aged 90–98 years) and CON groups (aged 60–89 years) (all p > 0.05). The bacterial composition between the two groups at the phylum to species level is shown in Figure 2 and Figure S1C–I. Further analyses of the gut microbiota structure revealed significant changes in Verrucomicrobia at the phylum level in the longe group. This trend was similar at the bacterial order (Verrucomicrobiales), family (Verrucomicrobiaceae), and species (Akkermansia mucinilhilla) level (Figure 2A,B and Figure S1A,B). In addition, the longe group had a higher abundance of Bifidobacterium dentium at the species level. Furthermore, Lactobacillus salivarius, Clostridium bartiletti, and Streptococcus anginosus were more abundant at the species level in the longe group (Figure 2C,D). Notably, Klebsiella, Roseburia, and Prevotellas at the genus level and Streptococcus austrails, Eubacterium infirmum, Bacteroides_sp_3_1_19, and Bifidobacterium adolescentis at the species level declined significantly in the longe group (Figure 2C,D). The LAMI values were calculated based on the bacterial abundance at the genus, species, and strain levels (Figure 2E and Figure S1). The data showed that the differences in LAMI values were most pronounced at the species level between the longe and CON groups (p = 0.0002; Figure 2E). Additionally, we tested the differential efficiency of LAMI using a receiver operating characteristic (ROC) curve. The area under the curve (AUC) was 0.7209 (p = 0.0029; Figure 2F). At the genus and strain levels, the differences were significant (p = 0.0013 and 0.003, respectively) (Figure S1J–M).
Having identified the aforementioned differences in microbial diversity and structure, we further analysed the association between microbiota and clinical assessment results for frailty and intrinsic capacity. We detected a significant association between Akkermansia mucinilhilla and frailty, recognition, and gait speed (Figure 2G). Predictive functional analysis revealed differences in functional pathways. Pathways related to protein processing, nutrient metabolism, and cellular renewal, including L-isoleucine biosynthesis III, the super-pathway of branched amino acid biosynthesis, L-arginine biosynthesis, and starch degradation, were overrepresented in the longe group (Figure 3 and Figure S2A). Faecalibacterium prausnitzii and Escherichia coli contributed most to the branched amino acid biosynthesis pathway and L-arginine biosynthesis I, respectively (Figure 3A and Figure S2B–I). We further analysed the association between diet, clinical scores, and gut microbiota composition and function. GAD-7 scores in clinical data and daily milk consumption had the highest relevance. We also analysed the relationship between gut microbiota and grip strength by MaAsLin coefficient (Figure 3B,C). GAD-7 scores were negatively correlated with Parabacteroides merdae (coefficient = −2.81, p = 0.004), Bacteroides finegoldii (coefficient = −2.57, p = 0.012), and Bacteroides cacae (coefficient = −2.30, p = 0.014) and positively correlated with Peptostreptococcaceae noname (coefficient = 1.19, p =0.002) and Gemella haemolysans (coefficient = 1.19, p = 0.017). Daily milk consumption was negatively correlated with Ruminosoccus bromii (coefficient = −3.50, p = 0.005) and Ruminosoccus lactaris (coefficient =−2.11, p = 0.001). Grip strength was positively correlated with Roseburia hominis (coefficient = 2.63, p < 0.001), Eubacterium rectale (coefficient = 2.94, p = 0.005), Eubacterium eligens (coefficient = 2.72, p = 0.003), and Roseburia intestinalis (coefficient = 2.56, p = 0.006) and negatively correlated with Clostridium ramosum (coefficient = −0.87, p = 0.015) (Figure 3D and Figure S3).

3.3. Gut Microbiota and Clinical Data Based on Age and Frailty

To explore the correlation between the gut microbiota, longevity, and physical function, the participants were divided into four groups based on age and the presence of frailty: long-lived adults with frailty (l_fra, n = 14), long-lived adults without frailty (l_c, n = 13), young-old adults with frailty (c_fra, n = 8), and young-old adults without frailty (c_c, n = 16) (Figure 1).
Compared to the l_c group, the l_fra group had lower cognition (MMSE) and nutritional state (MNA_SF) scores, more depression (PHQ-9), and worse sleep (Pittsburgh Sleep Quality Index, PSQI) (all p < 0.05). The proportion of adults who consumed 300–500 mL of milk per day was significantly higher in the l_c group (p < 0.01, Figure 4F–J). Eubacterium hallii and Bacteroides plebeius were more abundant in the l_c group, whereas Alistipes finegoldii was more abundant in the l_fra group (Figure 4A,F).
When c_c and c_fra were compared, the percentage of adults who consumed more than 300–500 mL of milk was significantly lower in c_fra. No significant differences were found in MNA_SF, GAD_7, or grip-strength scores between the c_c and c_fra groups (all p > 0.05). Bacteroides thetaiotaomicron, Scardovia wiggsiae, and Ruminococcus albus were more abundant in the c_fra group, whereas Bacteroides vulgatus and Bacteroides uniformis were more abundant in the c_c group (Figure 4A–E).
The c_fra group was younger but had worse physical function, whereas the l_c group had longevity with preserved physical function. These two groups differed the most when age and physical function were taken into account. We analysed dietary habit, bacterial structure, and functional pathways of the l_c and c_fra groups (Figure 5 and Figure S4). Bacteroides uniformis, Bacteroides eggerthii, and Streptococcus anginosus increased at the species level in the l_c group. C_fra showed higher levels of Escherichia coli, Bifidobacterium animalis, Acidaminococus fermentans, and Bacteroides thetaiotaomicron (Figure 5A). Many pathways were overrepresented in the l_c group compared with c_fra group, including chorismate biosynthesis; aromatic amino acid biosynthesis; biosynthesis of L-isoleucine, L-lysine, CDP-diacylglycerol, S-adenosyl-L-methionine, L-threonine, L-methionine, and L-valine; de novo biosynthesis of adenosine ribonucleotides; and de novo biosynthesis of guanosine ribonucleotides. Underrepresented pathways in the l_c group included fucose degradation, hexitol degradation in the TCA cycle, and ketogluconate metabolism (Figure 5B). The percentage of subjects who consumed more than 300 mL/d of milk was significantly higher in the l_c group (Figure 5C). The c_fra group had higher GAD_7 scores and MNA_SF, while there was no significant difference in grip strength between the l_c and c_fra group (Figure 5D–F).

4. Discussion

With the rapid ageing of the world’s population and the desire for healthy ageing, age-related issues are receiving increasing attention. Our results showed that impaired intrinsic capacity and frailty prevalence were higher in long-lived adults. The intrinsic capacity scores of long-lived adults were significantly lower than those of young-old adults. In the longe group, no significant differences were found in albumin, haemoglobin, creatinine, erythrocyte sedimentation rate (ESR), and C-reactive protein (CRP) levels between the frail (l_fra) and control (l_c) adults, while the l_fra group had lower MNA_SF scores and higher PHQ-9 and PSQI scores. Long-lived adults with frailty had worse nutritional and psychological states. Clinical assessment scales combining subjective and objective factors may be more sensitive than single clinical indicators in identifying long-lived adults with impaired physical function. Multifactorial analysis showed that ageing, poor nutritional status (lower MNA_SF score), and lower daily milk consumption (300–500 mL/d vs. <300 mL/d) were independently associated with frailty in older adults. These results confirm the importance of intrinsic capacity for the long-lived adults [36], suggesting the positive role of good nutrition, emotions, and sleep status. The correlation between gut microbiota and the clinical assessment scales deserves further exploration.
A previous study showed that chao1, observed species, and Shannon index increased with age after 60, peaked at 90, and declined thereafter [37]. This study observed no significant decline in long-lived adults compared with the young-old group in overall taxonomic diversity. Nevertheless, the composition of the bacteria differs. Akkermansia muciniphila and Bifidobacterium dentium, known as health-associated genera, increased in the long-lived adults. Meanwhile, Akkermansia muciniphila was positively correlated with LAMI. Akkermansia muciniphila modulates energy metabolism and glucose tolerance, promotes immunomodulation, and promotes metabolic homeostasis. Thus, Akkermansia muciniphila may be a next-generation probiotic [38,39]. This correlates with a previous study [6]. Functional analysis suggests Akkermansia muciniphila is involved in the super-pathway of branched amino acid (BCAA) biosynthesis and 5-aminoimidazole ribonucleotide biosynthesis I. BCAA is a substrate for nitrogenous compound synthesis and regulates the metabolism of glucose, lipid and protein synthesis, intestinal health, and immunity via a special signal network, including phosphoinositide 3-kinase/protein kinase B/mammalian target of rapamycin (PI3K/AKT/mTOR) [40]. In the functional pathways analysis, amino acid synthesis pathways were overrepresented in the l_c group compared to the c_fra group. Enrichment of this bacterium and altered pathways in long-lived adults with better physical function indicate that Akkermansia muciniphila, protein synthesis, and metabolism are closely associated with healthy ageing. In the subgroup analysis, compared to the l_fra group, the l_c group was enriched in Bacteroides plebeius. Bacteroides plebeius has shown the potential to combat muscle atrophy via the Mystn/ActRIIB/SMAD3 pathway, enhancing the barrier function of the intestinal mucosa and reducing protein consumption in animal studies [41]. In long-lived adults, changes in gut microbiota are associated with physical function.
The l_c (long-lived adults without frailty) and c_fra (young-old adults with frailty) groups had the most remarkable difference in combined age and physical function scores. We expected that a comparison of these two groups might identify changes in gut microbiota and function that are most closely related to healthy aging. Those in the C_fra group were not inferior to those in the l_c group in terms of cognitive function, gait speed, and MNA_SF. While the l_c group showed an increased abundance of Bacteroides eggerthii, the c_fra group showed a higher abundance of Escherichia coli. Bacteroides eggerthii has been shown to produce short-chain fatty acids (SCFAs) that can regulate intestinal immunity and inflammation and promote a healthy intestinal environment [42,43]. No differences in SCFA pathway were observed in this study. Escherichia coli is a well-known opportunistic pathogen [44]. The results suggest that some beneficial bacteria are enriched in long-lived adults, especially those with preserved physical function, whereas opportunistic pathogenic bacteria are enriched in frail older adults. Changes in gut microbiota may precede clinical indicators.
In the subsequent analysis, we analysed the relationship between gut microbiota and clinical indicators such as grip strength and gait speed, as well as possible related functional pathways. Grip strength was positively correlated with Roseburia hominis, which can produce butyrate and thus alleviate neuroinflammation [45,46]. No studies have been reported on the relationship between grip strength and Roseburia hominis. Based on the characteristics of Roseburia hominis, we speculated that it may affect muscle function, and furthermore gait speed, by acting on short-chain fatty acid metabolism and gut immune pathways. Considering that this study is a cross-sectional observational study with a limited sample size, the association and hypothesis need further verification. Studies have found that animal-based diets decrease the levels of Firmicutes (including Ruminococcus bromii), which metabolise dietary plant polysaccharides [47]. This study showed that milk consumption was negatively correlated with the abundance of Ruminococcus bromii. This is consistent with the results of previous studies. The affected pathways included the synthesis of L-lysine, L-threonine, and L-methionine amino acids. Diets may impact physical function by affecting the gut microbiota and functional pathways.
This study’s findings are limited, as we only evaluated the correlation between microbiota and physical function in a cross-sectional study and conducted preliminary explorations. Furthermore, it is impossible to determine whether the altered bacteria and pathways are temporary or long-lasting. The causal relationship between the gut microbiota and physical function is unclear. In addition, collecting food intake information was challenging because it was difficult to accurately record the daily dietary consumption of participants aged over 90 years. Some consumed nutrients were also calculated. The mechanisms underlying the association between the microbiota and physical function should be confirmed by cohort studies with large samples and long-term follow-up.

5. Conclusions

In conclusion, this study found no decline in the abundance of gut microbiota in long-lived individuals. Bacteria of long-lived adults were enriched in Akkermansia muciniphila, Bifidobacterium dentium, and Bacteroides plebeius, which may have beneficial effect for health. Furthermore, gut microbiota have a close relationship with physical function and intrinsic capacity. Possibly related pathways included amino acid synthesis and SCFA metabolism. During the process of increasing frailty, changes in gut microbiota may precede clinical indicators. Thus, gut microbiota may serve as a potential biological marker of healthy ageing.

Supplementary Materials

The following supporting information can be downloaded at: https://www.mdpi.com/article/10.3390/microorganisms13071657/s1, Figure S1. Details of gut microbiota in long-lived and young-old adults. (A,B) Principal coordinate analysis based on Bray-Curtis dissimilarity at genus and strain levels. (J−M) The efficiency of LAMI in distinguishing between long-lived and young-old group at genus and strain level. Figure S2. Altered pathways in the longe and CON groups and major contributing bacteria. (A) Functional pathway in longe and CON groups, (B−I) Microbial contributions to different functional pathways. Figure S3. Association between clinical factors, frailty, and gut microbiota. (A,B) R software (v 4.0.1) with the vegan (v 2.5-7) package were used for analysis. (C) Clinical indicators associated with frailty; (D) Microbial abundance in adults with different daily milk intakes. (E−H) The correlation between microbiota and clinical indicators, as well as LAMI. Figure S4. Altered pathways in subgroups. (A) Functional pathway in c_c and c_fra group, (B) Functional pathway in l_c and l_fra group. Figure S5. Flowchart of study. Table S1. Results of differential abundance analysis by ALDEx2.

Author Contributions

Conceptualization, L.D., J.X. and Y.W.; Methodology, L.D., Y.W. and J.W.; Software, J.X.; Formal analysis, L.D. and J.X.; Investigation, L.D. and Q.X.; Resources, J.W.; Data curation, J.X. and Q.X.; Writing—original draft, L.D. and J.X.; Writing—review & editing, J.W.; Supervision, Q.X., Y.W. and J.W.; Funding acquisition, Y.W. and J.W. All authors have read and agreed to the published version of the manuscript.

Funding

This work was supported by the National Project of Multidisciplinary Management of Major Diseases (2020) and the International Institute of Population Health, Peking University Health Science Center (JKCJ202303).

Institutional Review Board Statement

The study was approved by the Ethics Committee of Peking University People’s Hospital (Document ID: 2021PHB044-001, 2021PHB183-001, 19 February 2021).

Informed Consent Statement

All participants provided written informed consent.

Data Availability Statement

The original data presented in the study are openly available in the Genome Sequence Archive (Genomics, Proteomics & Bioinformatics 2021) in the National Genomics Data Center (Nucleic Acids Res 2022), China National Center for Bioinformation/Beijing Institute of Genomics, Chinese Academy of Sciences (GSA: CRA012774) at https://ngdc.cncb.ac.cn/gsa (accessed on 21 September 2024).

Conflicts of Interest

The authors declare no conflicts of interest.

Abbreviations

DMdiabetes mellitus
WHOWorld Health Organisation
ICOPEIntegrated Care for Older People
MMSEMini-Mental State Examination
SPPBShort Physical Performance Battery
MNA_SFMini-Nutritional Assessment Short Form
GAD-7Brief 7-Item Self-Report Questionnaire for Generalised Anxiety Disorder
PHQ-9Patient Health Questionnaire-9
MCImild cognitive impairment
ICimpaired intrinsic ability
NAFLDnon-alcoholic fatty liver disease
HTNhypertension
FFQFood Frequency Questionnaire
LAMIThe longevity-associated microbial index
CHDcoronary heart disease
BCAAbranched amino acid

References

  1. Partridge, L.; Deelen, J.; Slagboom, P.E. Facing up to the global challenges of ageing. Nature 2018, 561, 45–56. [Google Scholar] [CrossRef] [PubMed]
  2. Rudnicka, E.; Napierała, P.; Podfigurna, A.; Męczekalski, B.; Smolarczyk, R.; Grymowicz, M. The World Health Organization (WHO) approach to healthy ageing. Maturitas 2020, 139, 6–11. [Google Scholar] [CrossRef]
  3. Beard, J.R.; Officer, A.; de Carvalho, I.A.; Sadana, R.; Pot, A.M.; Michel, J.-P.; Lloyd-Sherlock, P.; Epping-Jordan, J.E.; Peeters, G.M.E.E.G.; Mahanani, W.R.; et al. The World report on ageing and health: A policy framework for healthy ageing. Lancet 2016, 387, 2145–2154. [Google Scholar] [CrossRef] [PubMed]
  4. Kong, F.; Hua, Y.; Zeng, B.; Ning, R.; Li, Y.; Zhao, J. Gut microbiota signatures of longevity. Curr. Biol. 2016, 26, R832–R833. [Google Scholar] [CrossRef]
  5. Palmas, V.; Pisanu, S.; Madau, V.; Casula, E.; Deledda, A.; Cusano, R.; Uva, P.; Loviselli, A.; Velluzzi, F.; Manzin, A. Gut Microbiota Markers and Dietary Habits Associated with Extreme Longevity in Healthy Sardinian Centenarians. Nutrients 2022, 14, 2436. [Google Scholar] [CrossRef] [PubMed]
  6. Biagi, E.; Franceschi, C.; Rampelli, S.; Severgnini, M.; Ostan, R.; Turroni, S.; Consolandi, C.; Quercia, S.; Scurti, M.; Monti, D.; et al. Gut Microbiota and Extreme Longevity. Curr. Biol. 2016, 26, 1480–1485. [Google Scholar] [CrossRef] [PubMed]
  7. Ko, C.-Y.; Liu, Q.-Q.; Su, H.-Z.; Zhang, H.-P.; Fan, J.-M.; Yang, J.-H.; Hu, A.-K.; Liu, Y.-Q.; Chou, D.; Zeng, Y.-M. Gut microbiota in obstructive sleep apnea-hypopnea syndrome: Disease-related dysbiosis and metabolic comorbidities. Clin. Sci. 2019, 133, 905–917. [Google Scholar] [CrossRef]
  8. Claesson, M.J.; Jeffery, I.B.; Conde, S.; Power, S.E.; O’Connor, E.M.; Cusack, S.; Harris, H.M.B.; Coakley, M.; Lakshminarayanan, B.; O’Sullivan, O.; et al. Gut microbiota composition correlates with diet and health in the elderly. Nature 2012, 488, 178–184. [Google Scholar] [CrossRef]
  9. Sonnenburg, E.D.; Sonnenburg, J.L. The ancestral and industrialized gut microbiota and implications for human health. Nat. Rev. Microbiol. 2019, 17, 383–390. [Google Scholar] [CrossRef]
  10. Pang, S.; Chen, X.; Lu, Z.; Meng, L.; Huang, Y.; Yu, X.; Huang, L.; Ye, P.; Chen, X.; Liang, J.; et al. Longevity of centenarians is reflected by the gut microbiome with youth-associated signatures. Nat. Aging 2023, 3, 436–449. [Google Scholar] [CrossRef]
  11. Dent, E.; Martin, F.C.; Bergman, H.; Woo, J.; Romero-Ortuno, R.; Walston, J.D. Management of frailty: Opportunities, challenges, and future directions. Lancet 2019, 394, 1376–1386. [Google Scholar] [CrossRef] [PubMed]
  12. Integrated Care for Older People: Guidelines on Community-Level Interventions to Manage Declines in Intrinsic Capacity. Geneva2017. Available online: https://www.who.int/publications/i/item/9789241550109 (accessed on 1 January 2017).
  13. Fried, L.P.; Tangen, C.M.; Walston, J.; Newman, A.B.; Hirsch, C.; Gottdiener, J.; Seeman, T.; Tracy, R.; Kop, W.J.; Burke, G.; et al. Frailty in older adults: Evidence for a phenotype. J. Gerontol. A Biol. Sci. Med. Sci. 2001, 56, M146–M157. [Google Scholar] [CrossRef]
  14. Liu, S.; Yu, X.; Wang, X.; Li, J.; Jiang, S.; Kang, L.; Liu, X. Intrinsic Capacity predicts adverse outcomes using Integrated Care for Older People screening tool in a senior community in Beijing. Arch. Gerontol. Geriatr. 2021, 94, 104358. [Google Scholar] [CrossRef] [PubMed]
  15. Folstein, M.F.; Folstein, S.E.; McHugh, P.R. “Mini-mental state”. A practical method for grading the cognitive state of patients for the clinician. J. Psychiatr. Res. 1975, 12, 189–198. [Google Scholar] [CrossRef]
  16. Mangione, K.K.; Craik, R.L.; McCormick, A.A.; Blevins, H.L.; White, M.B.; Sullivan-Marx, E.M.; Tomlinson, J.D. Detectable changes in physical performance measures in elderly African Americans. Phys. Ther. 2010, 90, 921–927. [Google Scholar] [CrossRef] [PubMed]
  17. Rubenstein, L.Z.; Harker, J.O.; Salvà, A.; Guigoz, Y.; Vellas, B. Screening for undernutrition in geriatric practice: Developing the short-form mini-nutritional assessment (MNA-SF). J. Gerontol. A Biol. Sci. Med. Sci. 2001, 56, M366–M372. [Google Scholar] [CrossRef]
  18. Spitzer, R.L.; Kroenke, K.; Williams, J.B.W.; Löwe, B. A brief measure for assessing generalized anxiety disorder: The GAD-7. Arch. Intern. Med. 2006, 166, 1092–1097. [Google Scholar] [CrossRef]
  19. Kroenke, K.; Spitzer, R.L.; Williams, J.B. The PHQ-9: Validity of a brief depression severity measure. J. Gen. Intern. Med. 2001, 16, 606–613. [Google Scholar] [CrossRef]
  20. Martin, M. Cutadapt removes adapter sequences from high-throughput sequencing reads. EMBnet. J. 2011, 17, 10–12. [Google Scholar] [CrossRef]
  21. Peng, Y.; Leung, H.C.M.; Yiu, S.M.; Chin, F.Y.L. IDBA-UD: A de novo assembler for single-cell and metagenomic sequencing data with highly uneven depth. Bioinformatics 2012, 28, 1420–1428. [Google Scholar] [CrossRef]
  22. Zhu, W.; Lomsadze, A.; Borodovsky, M. Ab initio gene identification in metagenomic sequences. Nucleic Acids Res. 2010, 38, e132. [Google Scholar] [CrossRef] [PubMed]
  23. Fu, L.; Niu, B.; Zhu, Z.; Wu, S.; Li, W. CD-HIT: Accelerated for clustering the next-generation sequencing data. Bioinformatics 2012, 28, 3150–3152. [Google Scholar] [CrossRef] [PubMed]
  24. Langmead, B.; Salzberg, S.L. Fast gapped-read alignment with Bowtie 2. Nat. Methods 2012, 9, 357–359. [Google Scholar] [CrossRef]
  25. Buchfink, B.; Xie, C.; Huson, D.H. Fast and sensitive protein alignment using DIAMOND. Nat. Methods 2015, 12, 59–60. [Google Scholar] [CrossRef] [PubMed]
  26. Segata, N.; Izard, J.; Waldron, L.; Gevers, D.; Miropolsky, L.; Garrett, W.S.; Huttenhower, C. Metagenomic biomarker discovery and explanation. Genome Biol. 2011, 12, R60. [Google Scholar] [CrossRef]
  27. Fernandes, A.D.; Reid, J.N.; Macklaim, J.M.; McMurrough, T.A.; Edgell, D.R.; Gloor, G.B. Unifying the analysis of high-throughput sequencing datasets: Characterizing RNA-seq, 16S rRNA gene sequencing and selective growth experiments by compositional data analysis. Microbiome 2014, 2, 15. [Google Scholar] [CrossRef]
  28. Mallick, H.; Rahnavard, A.; McIver, L.J.; Ma, S.; Zhang, Y.; Nguyen, L.H.; Tickle, T.L.; Weingart, G.; Ren, B.; Schwager, E.H.; et al. Multivariable association discovery in population-scale meta-omics studies. PLoS Comput. Biol. 2021, 17, e1009442. [Google Scholar] [CrossRef]
  29. Oksanen, J.; Simpson, G.L.; Blanchet, F.G.; Kindt, R.; Legendre, P.; Minchin, P.R.; O’HAra, R.; Solymos, P.; Stevens, M.H.H.; Szoecs, E.; et al. Vegan: Community Ecology Package, R Package Version 2.0-10; CRAN; 2013. Available online: https://github.com/vegandevs/vegan (accessed on 1 January 2017).
  30. Tatsumi, S.; Iritani, R.; Cadotte, M.W. Partitioning the temporal changes in abundance-based beta diversity into loss and gain components. Methods Ecol. Evol. 2022, 13, 2042–2048. [Google Scholar] [CrossRef]
  31. Gevers, D.; Kugathasan, S.; Denson, L.A.; Vázquez-Baeza, Y.; Van Treuren, W.; Ren, B.; Schwager, E.; Knights, D.; Song, S.J.; Yassour, M.; et al. The treatment-naive microbiome in new-onset Crohn’s disease. Cell Host Microbe 2014, 15, 382–392. [Google Scholar] [CrossRef]
  32. Lloyd-Price, J.; Arze, C.; Ananthakrishnan, A.N.; Schirmer, M.; Avila-Pacheco, J.; Poon, T.W.; Andrews, E.; Ajami, N.J.; Bonham, K.S.; Brislawn, C.J.; et al. Multi-omics of the gut microbial ecosystem in inflammatory bowel diseases. Nature 2019, 569, 655–662. [Google Scholar] [CrossRef]
  33. Xu, J.; Zhang, J.-N.; Sun, B.-H.; Liu, Q.; Ma, J.; Zhang, Q.; Liu, Y.-X.; Chen, N.; Chen, F. The role of genotype and diet in shaping gut microbiome in a genetic vitamin A deficient mouse model. J. Genet. Genom. 2022, 49, 155–164. [Google Scholar] [CrossRef] [PubMed]
  34. Franzosa, E.A.; McIver, L.J.; Rahnavard, G.; Thompson, L.R.; Schirmer, M.; Weingart, G.; Lipson, K.S.; Knight, R.; Caporaso, J.G.; Segata, N.; et al. Species-level functional profiling of metagenomes and metatranscriptomes. Nat. Methods 2018, 15, 962–968. [Google Scholar] [CrossRef]
  35. Stevens, C.; Norris, S.; Arbeeva, L.; Carter, S.; Enomoto, M.; Nelson, A.E.; Lascelles, B.D.X. Gut Microbiome and Osteoarthritis: Insights from the Naturally Occurring Canine Model of Osteoarthritis. Arthritis Rheumatol. 2024, 76, 1758–1763. [Google Scholar] [CrossRef]
  36. Gutiérrez-Robledo, L.M.; García-Chanes, R.E.; González-Bautista, E.; Rosas-Carrasco, O. Validation of Two Intrinsic Capacity Scales and Its Relationship with Frailty and Other Outcomes in Mexican Community-Dwelling Older Adults. J. Nutr. Health Aging 2021, 25, 33–40. [Google Scholar] [CrossRef] [PubMed]
  37. Odamaki, T.; Kato, K.; Sugahara, H.; Hashikura, N.; Takahashi, S.; Xiao, J.-Z.; Abe, F.; Osawa, R. Age-related changes in gut microbiota composition from newborn to centenarian: A cross-sectional study. BMC Microbiol. 2016, 16, 90. [Google Scholar] [CrossRef] [PubMed]
  38. Zhang, T.; Li, Q.; Cheng, L.; Buch, H.; Zhang, F. Akkermansia muciniphila is a promising probiotic. Microb. Biotechnol. 2019, 12, 1109–1125. [Google Scholar] [CrossRef]
  39. Cani, P.D.; Depommier, C.; Derrien, M.; Everard, A.; de Vos, W.M. Akkermansia muciniphila: Paradigm for next-generation beneficial microorganisms. Nat. Rev. Gastroenterol. Hepatol. 2022, 19, 625–637. [Google Scholar] [CrossRef]
  40. Nie, C.; He, T.; Zhang, W.; Zhang, G.; Ma, X. Branched Chain Amino Acids: Beyond Nutrition Metabolism. Int. J. Mol. Sci. 2018, 19, 954. [Google Scholar] [CrossRef]
  41. Pei, T.; Zhu, D.; Yang, S.; Hu, R.; Wang, F.; Zhang, J.; Yan, S.; Ju, L.; He, Z.; Han, Z.; et al. Bacteroides plebeius improves muscle wasting in chronic kidney disease by modulating the gut-renal muscle axis. J. Cell. Mol. Med. 2022, 26, 6066–6078. [Google Scholar] [CrossRef]
  42. Shimizu, J.; Kubota, T.; Takada, E.; Takai, K.; Fujiwara, N.; Arimitsu, N.; Murayama, M.A.; Ueda, Y.; Wakisaka, S.; Suzuki, T.; et al. Propionate-producing bacteria in the intestine may associate with skewed responses of IL10-producing regulatory T cells in patients with relapsing polychondritis. PLoS ONE 2018, 13, e0203657. [Google Scholar] [CrossRef]
  43. Liu, Y.; Zhu, J.; Wang, H.; Lu, W.; Lee, Y.K.; Zhao, J.; Zhang, H. Machine learning framework for gut microbiome biomarkers discovery and modulation analysis in large-scale obese population. BMC Genom. 2022, 23, 850. [Google Scholar] [CrossRef] [PubMed]
  44. Denamur, E.; Clermont, O.; Bonacorsi, S.; Gordon, D. The population genetics of pathogenic Escherichia coli. Nat. Rev. Microbiol. 2021, 19, 37–54. [Google Scholar] [CrossRef] [PubMed]
  45. Song, L.; Sun, Q.; Zheng, H.; Zhang, Y.; Wang, Y.; Liu, S.; Duan, L. Roseburia hominis Alleviates Neuroinflammation via Short-Chain Fatty Acids through Histone Deacetylase Inhibition. Mol. Nutr. Food Res. 2022, 66, e2200164. [Google Scholar] [CrossRef] [PubMed]
  46. Machiels, K.; Joossens, M.; Sabino, J.; De Preter, V.; Arijs, I.; Eeckhaut, V.; Ballet, V.; Claes, K.; Van Immerseel, F.; Verbeke, K.; et al. A decrease of the butyrate-producing species Roseburia hominis and Faecalibacterium prausnitzii defines dysbiosis in patients with ulcerative colitis. Gut 2014, 63, 1275–1283. [Google Scholar] [CrossRef]
  47. David, L.A.; Maurice, C.F.; Carmody, R.N.; Gootenberg, D.B.; Button, J.E.; Wolfe, B.E.; Ling, A.V.; Devlin, A.S.; Varma, Y.; Fischbach, M.A.; et al. Diet rapidly and reproducibly alters the human gut microbiome. Nature 2014, 505, 559–563. [Google Scholar] [CrossRef]
Figure 1. Flowchart of study. ICOPE: Integrated Care for Older People tool.
Microorganisms 13 01657 g001
Figure 2. The characteristics of gut microbiota in long-lived (longe) and young-old (CON) adults. (A) The microbiota’s alpha diversity is assessed using Shannon and simpson indices. In the box plots, the horizontal lines indicate the median values. The upper and lower boundaries of the boxes correspond to the 75th and 25th percentiles, respectively. (B) Principal coordinate analysis based on Bray-Curtis dissimilarity at species level. R software (v 4.0.1) with the vegan (v 2.5-7) package were used for analysis. p-values were acquired using permutational multivariate analysis of variance (PERMANOVA). (C) The characteristics of microbial communities in two groups of people at various taxonomic levels (domain, phylum, class, order, family, genus, and species). (D) The microbiota with the most significant differences between long-lived and young-old group. (E) LAMI of longe and CON group. (F) The efficiency of LAMI in distinguishing between long-lived and young-old group. (G) Heatmap of bacterial abundance with significant difference in different groups. Abbreviations: LAMI: The longevity-associated microbial index, MCI: mild cognitive impairment, NP: normal pace, SD: gait speed decreased.
Microorganisms 13 01657 g002
Figure 3. (A) Functional pathways in long-lived and young-old adults. (BD) Related dietary and clinical factors and the association between gut microbiota and clinical assessments. (B,C) R software (v 4.0.1) with the vegan (v 2.5-7) package were used for analysis. p-values were acquired using permutational multivariate analysis of variance (PERMANOVA). *: FDR < 0.05, !: 0.05 < FDR < 0.1. Abbreviations: GAD-7: Brief 7-Item Self-Report Questionnaire for Generalised Anxiety Disorder, IOF: one-minute osteoporosis risk test, CHD: chronic heart disease, NAFLD: non-alcoholic fatty liver disease, OSTA: osteoporosis self-assessment tool for Asians, DM: diabetes mellitus, PSQI: Pittsburgh Sleep Quality Index, PHQ-9: Patient Health Questionnaire-9, ADL: activity of daily living, BMI: body mass index, MNA_SF: Mini Nutritional Assessment-Short Form, MCI: mild cognitive impairment, NP: normal pace, SD: gait speed decreased.
Microorganisms 13 01657 g003
Figure 4. Comparison of gut microbiota, clinical assessments and daily milk intake in different subgroups. (AE): c_c versus c_fra, (FJ): l_c versus l_fra). Abbreviations: l_fra: frail nonagenarian individuals (aged 90–98), l_c: non-frail individuals aged 90–98, c_fra: frail individuals aged 60–89, c_c: non-frail individuals aged 60–89, MNA_SF: Mini Nutritional Assessment-Short Form, GAD-7: Brief 7-Item Self-Report Questionnaire for Generalised Anxiety Disorder, ns: no significance.
Microorganisms 13 01657 g004
Figure 5. The comparative analysis of gut microbiota, functional pathways, and clinical data between l_c and c_fra groups. (A): The microbiota with the most significant differences between l_c and c_fra groups. (B): Functional pathways in l_c and c_fra groups. (CF): Clinical assessments and daily milk intake in l_c and c_fra groups. Abbreviations: l_fra: frail nonagenarian individuals (aged 90–98), l_c: non-frail individuals aged 90–98, c_fra: frail individuals aged 60–89, c_c: non-frail individuals aged 60–89, MNA_SF: Mini Nutritional Assessment-Short Form, GAD-7: Brief 7-Item Self-Report Questionnaire for Generalised Anxiety Disorder, ns: no significance.
Microorganisms 13 01657 g005
Table 1. Five domains constituting the intrinsic capacity measured by the WHO ICOPE screening tool.
Intrinsic CapacityTestsScores
CognitionMMSEScores equal or greater than 27 (1)/less than 27 (0)
Locomotion
 Chair rise test
Rise from a chair five times without using arms within 14 sYes (1)/No (0)
Vitality
 Weight lossHave you unintentionally lost more than 3 kg over the last 3 months?Yes (0)/No (1)
 Appetite lossHave you experienced loss of appetite?Yes (0)/No (1)
Sensory
 Visual impairmentDo you have any problems with your eyes: difficulties in seeing far, reading, or eye disease?Yes (0)/No (1)
 Hearing lossDo you have any problems in hearing: difficulties in hearing whispers?Yes (0)/No (1)
Psychosocial
 Depressive symptomsPHQ-9 scoreScores greater than 4 (0)/scores equal to or less than 4 (1)
 Anxiety symptomsGAD-7 scoreScores greater than 4 (0)/scores equal to or less than 4 (1)
Abbreviations: MMSE: Mini-Mental State Examination, PHQ-9: Patient Health Questionnaire-9, GAD-7: Brief 7-Item Self-Report Questionnaire for Generalised Anxiety Disorder.
Table 2. Demographic and clinical data of long-lived and young-old adults.
Longe Group vs. CON GroupLonge GroupCON Group
Longe Group
(≥90, n = 27)
CON Group (60–89, n = 24)p Valuel_fra (n = 14)l_c (n = 13)pC_fra (n = 8)C-c (n = 16)p Value
Age91.59 ± 1.8979.08 ± 6.83<0.00191.85 ± 1.6691.30 ± 2.140.40680.75 ± 5.6578.25 ± 7.370.410
Female8 (29.6%)14 (58.3%)0.0395 (35.7%)3 (23.1%)0.6781 (12.5%)13(81.2%)0.002
DM6 (22.2%)10 (41.7%)0.1353 (21.4%)3 (23.1%)1.0006 (75.0%)4(25.0%)0.032
HTN18 (66.7%)18 (75.0%)0.51411 (78.6%)7 (53.8%)0.2367 (87.5%)11(68.8%)0.621
CHD8 (30.8%)4 (16.7%)0.2436 (42.9%)2 (16.7)0.2163 (37.5%)1(6.2%)0.091
NAFLD2 (7.4%)6 (25.0%)0.1271 (7.1%)1 (7.1%)1.0001 (12.5%)5(31.2%)0.621
Statin14 (51.9%)16 (66.7%)0.28311 (78.6%)3 (23.1%)0.0046 (75.0%)10(62.5%)0.667
Metformin0 (0.0%)5 (20.8%)0.018---3 (37.5%)2(12.5%)0.289
Aspirin8 (29.6%)9 (37.5%)0.5526 (42.9%)2 (15.4%)0.2094 (50.0%)5(31.2%)0.412
Albumin35.36 ± 3.6539.06 ± 4.090.00834.74 ± 3.8537.83 ± 0.400.20036.90 ± 4.9340.29 ± 3.060.059
Haemoglobin121.40 ± 19.48126.27 ± 17.330.430118.83 ± 19.93131.67 ± 16.560.325124.00 ± 28.33127.57 ± 6.920.736
BMI24.70 ± 3.5024.12 ± 3.090.53725.25 ± 4.3824.10 ± 2.210.40623.82 ± 2.5224.27 ± 3.400.747
Grip strength19.56 ± 7.2720.17 ± 6.440.75615.00 ± 5.2124.48 ± 5.88<0.00119.41 ± 9.6420.54 ± 4.450.760
Time_4.57m10.02 ± 5.664.80 ± 2.45<0.0016.61 ± 3.6213.18 ± 5.430.0016.33 ± 3.704.04 ± 0.970.126
CRP8.82 ± 18.423.68 ± 9.190.33110.80 ± 20.260.90 ± 0.460.4256.69 ± 15.211.96 ± 1.760.410
ESR15.80 ± 17.2216.87 ± 24.060.88318.42 ± 18.405.33 ± 3.060.25426.50 ± 36.9611.36 ± 10.480.292
Creatinine95.33 ± 29.9376.50 ± 18.310.02396.50 ± 33.4490.67 ± 9.020.77584.87 ± 17.3371.71 ± 17.670.106
BUN6.50 ± 2.507.07 ± 1.700.4046.59 ± 2.776.14 ± 1.150.7947.15 ± 1.667.04 ± 1.780.882
MMSE24.78 ± 4.5028.17 ± 1.200.00122.57 ± 4.7827.15 ± 2.700.00627.62 ± 1.0628.44 ± 1.210.121
MNA-SF12.85 ± 2.6816.33 ± 0.96<0.00111.50 ± 2.9314.31 ± 1.380.00416.50 ± 0.7616.25 ± 1.060.561
GAD-72.04 ± 3.432.54 ± 3.020.5823.21 ± 4.210.77 ± 1.740.0613.13 ± 3.182.25 ± 3.000.516
PHQ-92.67 ± 3.823.13 ± 3.890.6744.36 ± 4.400.85 ± 1.950.0144.13 ± 3.802.63 ± 3.960.385
PSQI8.67 ± 4.229.12 ± 3.650.68211.29 ± 3.735.85 ± 2.64<0.01010.00 ± 3.708.69 ± 3.660.419
OSTA−5.32 ± 2.27−3.42 ± 2.180.004−5.19 ± 2.69−5.47 ± 1.810.754−3.14 ± 2.68−3.56 ± 1.960.662
Intrinsic capacity5.44 ± 2.156.71 ± 1.460.0174.00 ± 1.667.00 ± 1.41<0.0107.15 ± 1.044.50±1.29<0.010
Abbreviations: l_fra: frail nonagenarian individuals (aged 90–98), l_c: non-frail individuals aged 90–98, c_fra: frail individuals aged 60–89, c_c: non-frail individuals aged 60–89, DM: diabetes mellitus, HTN: hypertension, CHD: chronic heart disease, NAFLD: non-alcoholic fatty liver disease, BMI: body mass index, CRP: C-reactive protein, ESR: erythrocyte sedimentation rate, BUN: blood urea nitrogen, MMSE: Mini-Mental State Examination, MNA-SF: Mini-Nutritional Assessment Short Form, PHQ-9: Patient Health Questionnaire-9, GAD-7: Brief 7-Item Self-Report Questionnaire for Generalised Anxiety Disorder, OSTA: osteoporosis self-assessment tool for Asians.
Disclaimer/Publisher’s Note: The statements, opinions and data contained in all publications are solely those of the individual author(s) and contributor(s) and not of MDPI and/or the editor(s). MDPI and/or the editor(s) disclaim responsibility for any injury to people or property resulting from any ideas, methods, instructions or products referred to in the content.

