Article

Fungal Diversity and Interactions in the Nasal and Oral Cavities of Individuals with Allergic Rhinitis, Asthma and Healthy Controls

by
Marcos Pérez-Losada
Computational Biology Institute, Department of Biostatistics and Bioinformatics, Milken Institute School of Public Health, The George Washington University, Washington, DC 20052-0066, USA
Microorganisms 2025, 13(6), 1204; https://doi.org/10.3390/microorganisms13061204 (registering DOI)
Submission received: 28 March 2025 / Revised: 1 May 2025 / Accepted: 23 May 2025 / Published: 25 May 2025
(This article belongs to the Special Issue Advances in Human Infections and Public Health)

Abstract

:
Allergic rhinitis and asthma are common chronic airway diseases that present significant public health challenges. Previous research has shown how the nasal and oral mycobiomes influence the onset, progression and severity of these two conditions, but no study so far has directly compared those mycobiomes within the same cohort during health and disease. To address this gap, I analyzed next-generation fungal ITS sequence data from 349 participants, including individuals with allergic rhinitis, asthma, and healthy controls. The nasal and oral mycobiomes showed a great overlap in composition but differed significantly (p < 0.04) in the relative abundance of several dominant genera. Moreover, only 18.6% of the fungal amplicon variants were shared among cavities. Microbial alpha-diversity was significantly higher (p < 0.05) in the nasal cavity, while beta-diversity varied significantly (p < 0.045) across all indices and clinical groups. Fungal networks were largely fragmented and showed relatively low ecological niche specialization, which contrasts with a previous study of bacteriomes from the same cohort. These networks also differed in structure, complexity and keystone nodes across clinical phenotypes. Overall, these findings highlight that the nasal and oral mycobiomes play distinct yet interconnected roles in allergic rhinitis and asthma.

1. Introduction

Allergic rhinitis and asthma are among the most common chronic airway diseases in developed countries, posing a significant public health burden [1,2,3]. An estimated 400 million people worldwide suffer from allergic rhinitis [4], while asthma affects over 300 million individuals and is responsible for more than 495,000 deaths annually [5,6,7,8].
Allergic rhinitis is an inflammatory condition of the nasal mucosa, characterized by sneezing, congestion, itching and rhinorrhea [9,10,11,12]. Similarly, asthma involves airway inflammation, obstruction, and mucus production [7,13,14]. These conditions frequently coexist [15,16,17,18,19], with approximately 40% of individuals with allergic rhinitis also having asthma, and up to 80% of asthma patients experiencing symptoms of allergic rhinitis [20]. This strong association supports the concept of united airway disease, in which both conditions share pathophysiological, epidemiological and clinical links [15,21,22,23,24].
Despite growing interest in the role of fungi in airway diseases, few studies have used next-generation sequencing (NGS) to analyze the upper airway mycobiome in individuals with rhinitis or asthma. Existing research suggests that fungal communities contribute to the onset, severity and progression of both conditions [25,26,27]. However, those studies have focused on a single niche, despite evidence that respiratory disease outcomes may be better understood by examining microbial interactions across multiple body sites [28,29,30,31,32,33,34]. Investigating cross-niche interactions could deepen our understanding of airway inflammatory diseases, support the development of holistic hypotheses on their progression, and inform more integrated diagnostic and treatment strategies [29,32,34,35,36].
In this study, I analyzed internal transcribed spacer (ITS) NGS data from the nasal and oral mycobiomes of 349 individuals with allergic rhinitis (with and without asthma comorbidity), asthma and healthy controls. I compared fungal taxonomic diversity and cross-cavity community interactions to explore how microbial dynamics differ between health and respiratory disease states.

2. Materials and Methods

2.1. Cohort

All participants in this study were enrolled in the ASMAPORT Project (PTDC/SAU-INF/27953/2017). This study was approved by the “Comissão de Ética para a Saúde” (Parecer_58-17, 17 March 2017) of the Centro Hospitalar Universitário São João, Facultade de Medicina (Porto, Portugal). ASMAPORT was a cross-sectional study of adults and young people from northern Portugal created in 2018 to investigate host–microbe interactions during allergic rhinitis and asthma. Further details are provided in Pérez-Losada et al. [26,27].

2.2. Sample Preparation and Amplicon Sequencing

Here I have included a short description of the molecular procedures performed to characterize the fugal communities of the upper airways; further details are provided in [26,27]. A total of 349 children and adults (12.7 ± 5.5 years of age and 54.2% female) participated in this study. They were classified into four clinical groups or phenotypes: allergic rhinitis (AR = 47 individuals), allergic rhinitis with asthma comorbidity (ARAS = 161), asthma (AS = 12) and healthy controls (HC = 129). Nasal and oral samples were collected by swabbing the right and left nostrils and left and right mouth cheeks, respectively, during 30 s with a cotton swab. A total of 698 samples were processed.
Total DNA was extracted using the ZymoBIOMICS™ DNA Miniprep Kit D4300 (Zymo Research Corp, Irvine, CA, USA). DNA extractions were prepared for sequencing using the Schloss’ MiSeq_WetLab_SOP protocol (09.2015) [37]. Each DNA sample, negative controls and mock samples were amplified for regions of the internal transcribed spacers (ITS) 1 and 2 (~230 bp) following the Earth Microbiome Project’s protocols [38]. Libraries were then sequenced in a single run of the Illumina MiSeq sequencing platform at the University of Michigan Medical School. Sequence files and associated metadata and BioSample attributes have been deposited in the NCBI (PRJNA1107919).

2.3. Mycobiome Analyses

ITS amplicon sequence variants (ASV) in each sample were inferred using dada2 version 1.18 [39]. Reads were filtered using standard default dada2 parameters. Forward and reverse reads were merged and chimeras identified. Taxonomic assignment was performed against the UNITE v9.0 2023-07-18 database [40] using the RDP naive Bayesian classifier [41,42]. ASV sequences were aligned in MAFFT [43] and a phylogenetic tree was inferred in FastTree [44]. The resulting ASV tables and tree were then imported into the R package phyloseq [45] for further analysis.
Samples were normalized using the negative binomial distribution as recommended by McMurdie and Holmes [46] and implemented in the Bioconductor package DESeq2 [47]. This approach simultaneously accounts for biological variability and library size differences and has increased sensitivity for group sample sizes of less than 20 participants. Taxonomic and phylogenetic alpha-diversity were estimated using Chao1 richness and Shannon, Simpson and phylogenetic (Faith’s) diversity (PD) indices. Beta-diversity was estimated using phylogenetic Unifrac (unweighted and weighted) distances, and dissimilarity between samples was explored using principal coordinates analysis (PCoA).
Significant differences in alpha-diversity indices and microbial abundances (phyla and genera) between nasal and oral mycobiomes in each clinical group (AR, ARAS, AS and HC) were assessed using linear models and linear mixed-effects models to account for the non-independence of subjects (random effects)—lmer4 R package [48]. Beta-diversity indices were compared using permutational multivariate analysis of variance (adonis) as implemented in the R package vegan [49]. The Benjamini–Hochberg method (alpha = 0.05) was applied to correct for multiple hypotheses testing [50,51]. All these analyses were performed in R 4.2.3 [52] and RStudio 2024.12.1 [53].
Fungal interactions were inferred for each naso–oral mycobiome (AR, ARAS, AS and HC). First ASVs were classified as nasal or oral using the niche indicator species analysis in the R package indicspec (function multipatt) [54]. This function calculates an indicator value for each ASV at each niche (mouth and nose), taking its total abundance per niche into account. An ASV was deemed a niche indicator only when it had a p-value < 0.05 for one specific niche. Fungal networks were then constructed using the SPIEC-EASI (SParse InversE Covariance Estimation for Ecological Association Inference) R package [55]. To avoid overestimation of the impact of very rare taxa on the overall network structure [29], only the 200 most prevalent ASVs in each group except for AS (100 ASVs) were included in the analysis (sample prevalence < 5% in all groups). Meinshausen–Buhlmann estimation with nlambda = 20, lambda.min.ratio = 0.01 and rep.num = 50 was applied [55]. This method uses conditional independence rather than correlation, hence making it less likely to detect spurious connections between taxa. Data were centered log-ratio transformed. Keystone nodes (key taxa players in the network) were selected using three criteria: degree of centrality (nodes with the highest number of connections), betweenness centrality (nodes that frequently serve as bridges in the network) and closeness centrality (nodes that can quickly reach other nodes). Only nodes in the top 95% percentile for those three indices were considered keystone taxa. The following properties were also estimated for each network: node degree (number of edges a node has with other nodes within the network), neighborhood connectivity (degree of interconnectivity among immediate neighbors in the network) and cohesion (how tightly linked are the nodes of a network).

3. Results

I analyzed a total of 698 nasal and oral swabs from 349 participants grouped into four phenotypes: AR = 47, ARAS = 161, AS = 12 and HC = 129 (see [26,27] for more details). After excluding singletons, the nasal–oral mycobiomes comprised 14,505,917 clean reads, ranging from 1014 to 223,989 sequences per sample (mean = 20,782.1), and 10,288 ASVs. In previous studies [26,27] I described and compared the mycobiomes of those same four clinical phenotypes within each cavity (nose and mouth) using ITS sequence data; here I have combined those genomic and clinical datasets to assess similarities and differences in fungal composition, structure and interactions between cavities for each clinical group (AR, ARAS, AS and HC).

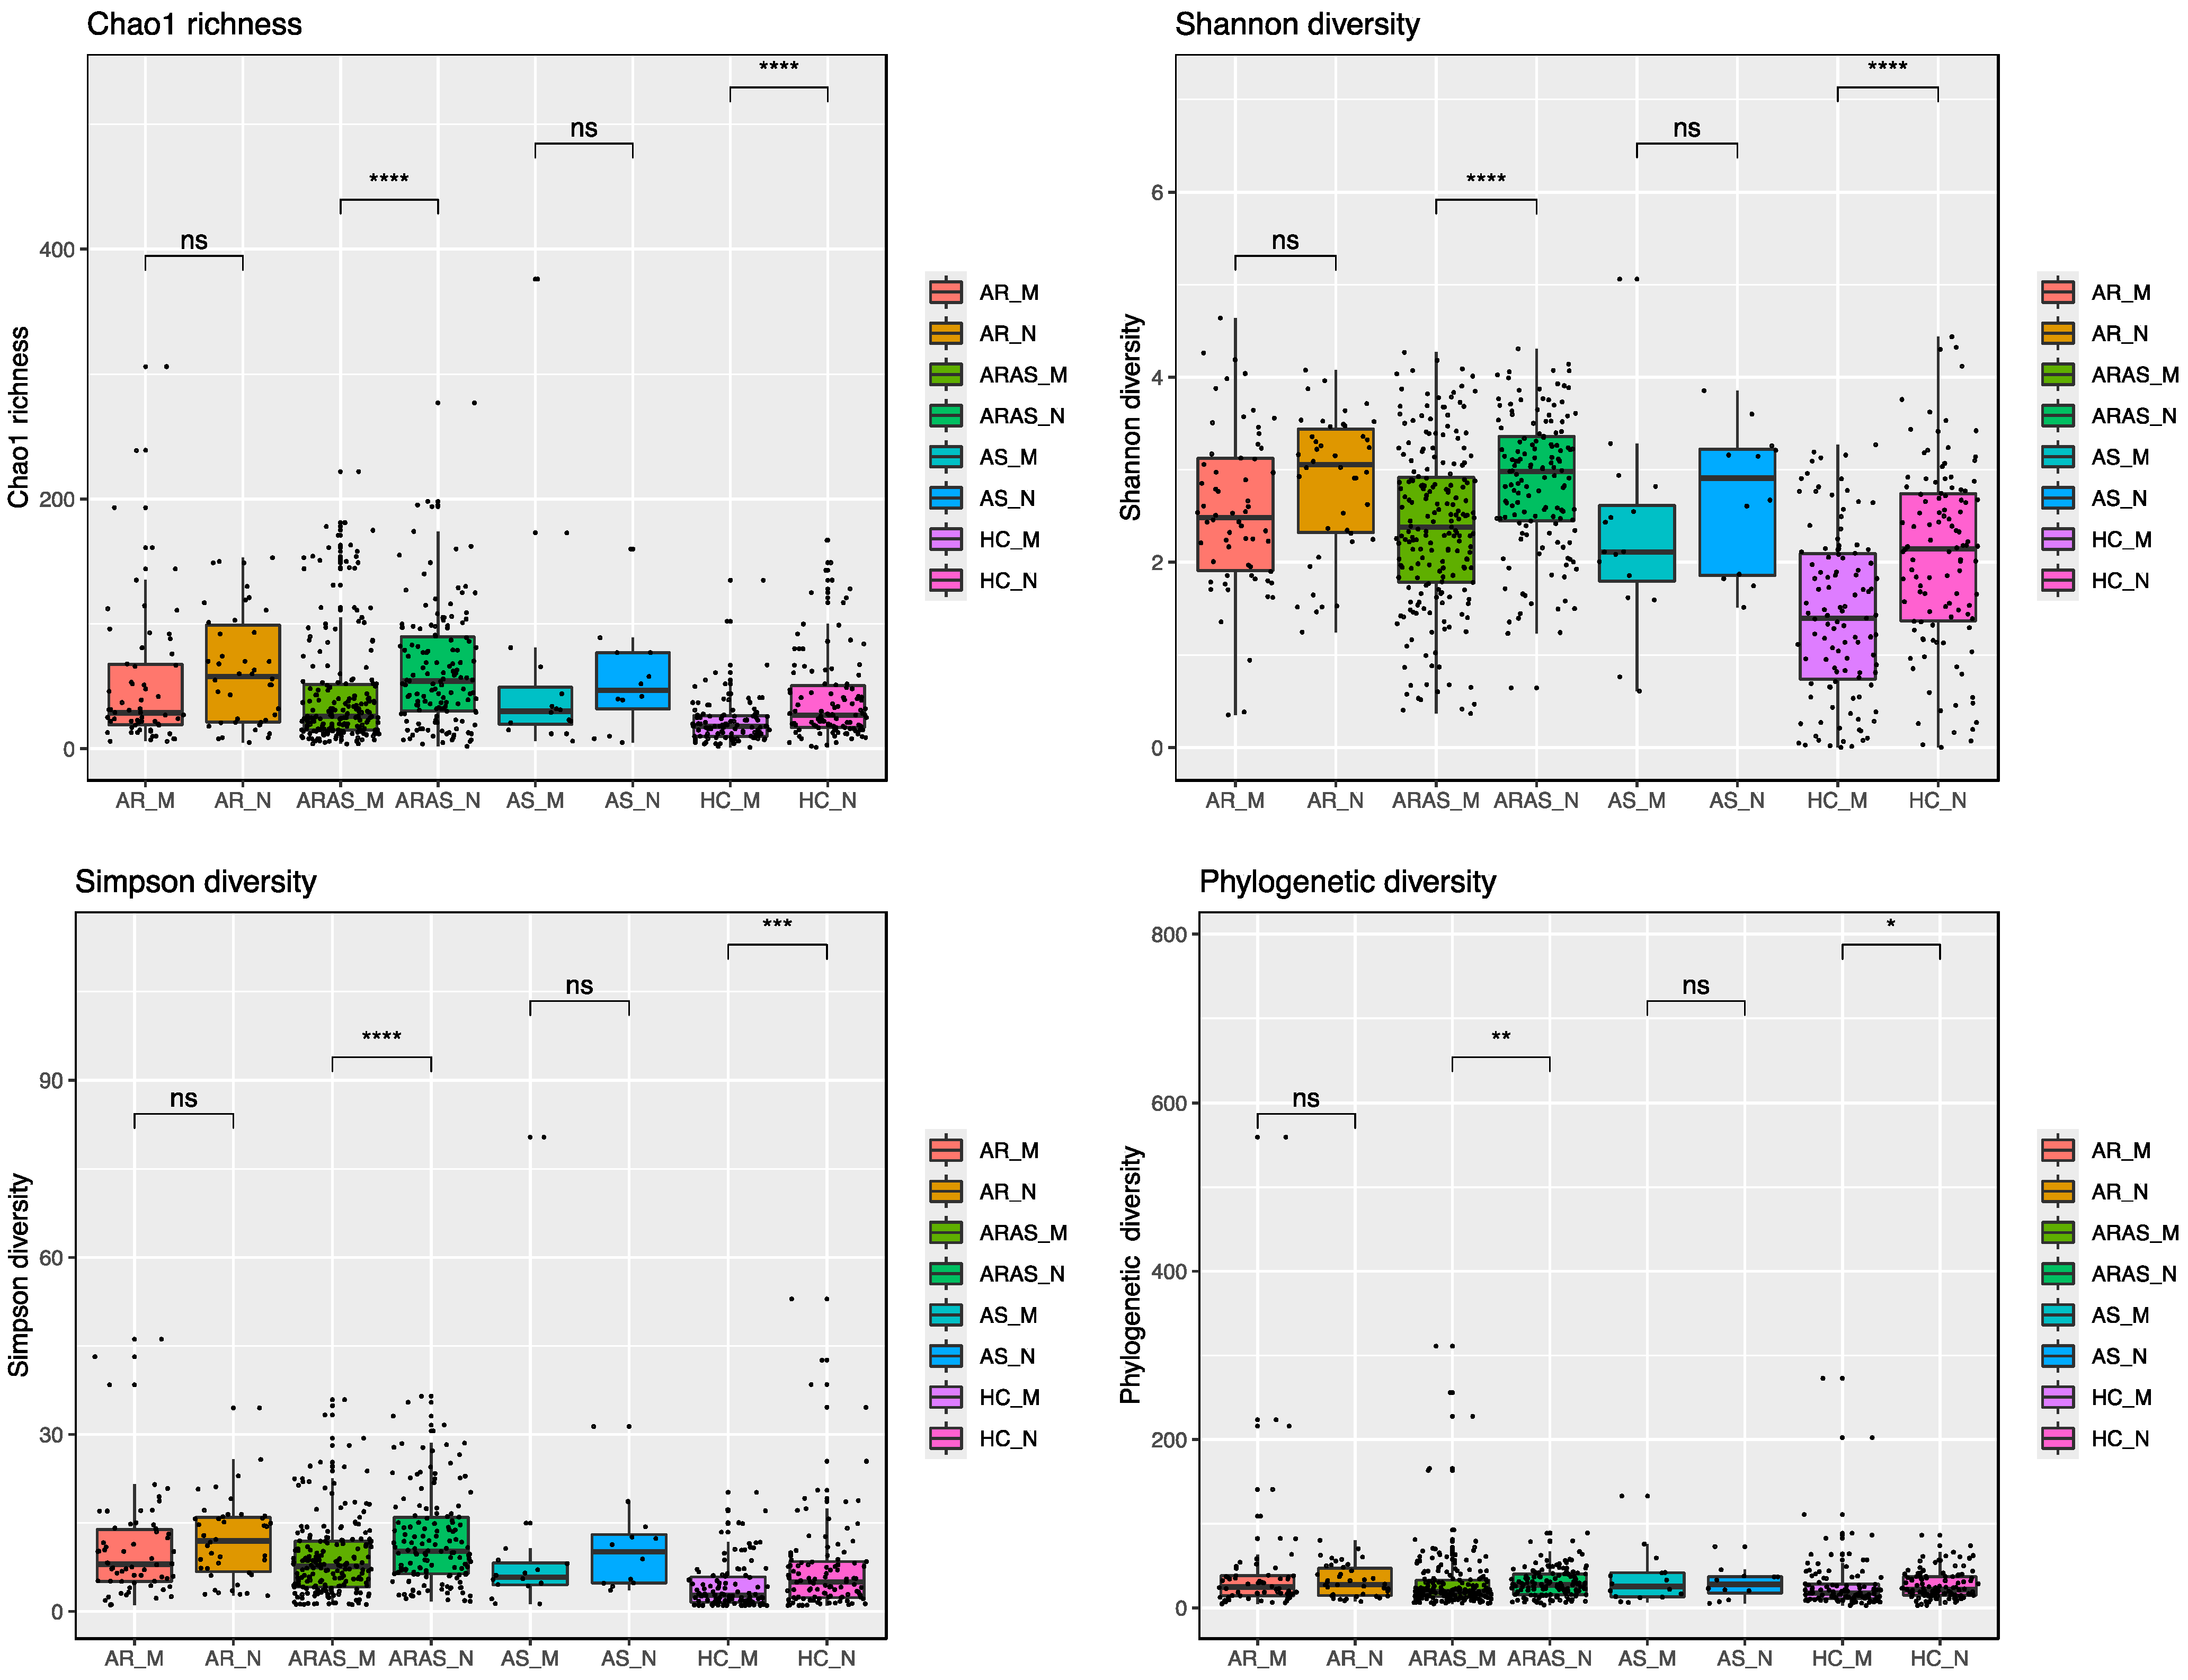
3.1. The Nasal and Oral Mycobiomes Differ in Taxonomic Composition and Diversity

The nasal and oral mycobiomes shared the same dominant phyla and genera, but in different proportions (Table S1 and Figure 1). More information about their unique composition can be found in [26,27]. The phyla Ascomycota and Basidiomycota accounted for most of the reads in the nasal and oral mycobiomes; Ascomycota only varied significantly (p = 0.0002) between nose and mouth in the HC group, while Basidiomycota (p ≤ 0.0353) did it in the ARAS and HC groups (Table S1). Similarly, nine (Malassezia, Cladosporium, Penicillium, Aspergillus, Candida, Aleurina, Debaryomyces, Wallemia and Saccharomyces) of the fifteen dominant fungal genera showed significant differences (≤0.0387) in mean relative abundance across phenotypes (Table S1). Cladosporium varied significantly across all the disease phenotypes, Penicillium in ARAS and AS, Aleurina in ARAS and HC and Debaryomyces, Wallemia and Saccharomyces in AR and ARAS. The other three genera (Malassezia, Aspergillus and Candida) only varied significantly in one particular phenotype.
As a whole (all phenotypes combined), the nasal and oral mycobiomes had 4025 and 4653 unique ASVs, respectively, and shared 1610 (18.6%) ASVs. Then, within each clinical group, AR, ARAS, AS and HC shared eleven, one hundred and ninety-three, three and ninety-five ASVs, respectively, between cavities (Figure S1).
Alpha-diversity indices [Chao1, Shannon, Simpson and phylogenetic diversity (PD)] of community richness and evenness varied between nasal and oral mycobiomes for each phenotype (Figure 2 and Table S2). The nasal mycobiomes showed higher diversity than the oral mycobiomes for all the indices and phenotypes except for PD and Chao1 in AS. All of the alpha-diversity pairwise comparisons between cavities across phenotypes resulted significant (p < 0.01), except for Chao1 in AR and AS, and PD in AS.
To characterize the structure of the fungal communities (beta-diversity), I applied principal coordinates analysis (PCoAs) to Unifrac (unweighted and weighted) distance matrices. The PCoAs of the samples grouped either by cavity alone or by cavity and clinical phenotype (Figure 3) separated the nasal and oral mycobiomes, although not completely. Axes one and two in the PCoA of Unifrac weighted distances explained 17.3% and 13.4% of the variance, respectively, while the same axes in the PCoA of Unifrac unweighted distances explained 8.7% and 4.8% of the variance, respectively. Group segregation was confirmed by the adonis test, which revealed significant differences (0.0433 ≤ p < 0.0001) in beta-diversity for all indices and pairwise comparisons performed.

3.2. Fungal Interactions in the Nasal and Oral Cavities

I inferred fungal interactions in the naso–oral mycobiomes of each phenotypic group (AR, ARAS, AS and HT) using SPIEC-EASI analysis (Figure 4). All nodes (ASVs) in each network were statistically assigned to a cavity (M = mouth, N = nose or NM = undetermined or mixed), as indicated by niche indicator analysis. ASVs in N and M represent specialists strongly associated to each cavity, while ASVs in NM represent generalists occurring in both cavities (low-prevalence ASVs were filtered out) (Table S3).
All naso–oral networks looked different in their structure, complexity and keystone nodes (Table S3). The AR network included 200 nodes (M = 7, N = 44, NM = 149) and 322 edges, with 14.0% of them connecting intra-niche ASVs (N-N or M-M) and 86% connecting inter-niche ASVs (N-M, N-NM, M-NM and NM-NM). The AR network showed a mean node degree of 3.22, a mean neighborhood connectivity of 3.92, a mean cohesion of 0.11. It included 25 keystone taxa (M = 0, N = 3 and NM = 22) belonging to the genera Bullera, Cladosporium, Crustomyces, Debaryomyces, Exophiala, Fusarium, Ganoderma, Malassezia, Mycosphaerella, Mycosphaerellaceae_sp, Papiliotrema, Peniophora, Phaeophlebiopsis, Phlebia, Phlebiopsis, Rhodotorula, Sidera, Sistotrema, Skeletocutis, Stereum, Symmetrospora and Vishniacozyma.
The ARAS network included 200 nodes (M = 22, N = 61, NM = 117) and 117 edges with 35.9% of them connecting intra-niche ASVs (64.1% inter-niche) and many unconnected nodes. It showed a mean node degree of 1.17, a mean neighborhood connectivity of 1.61 and a mean cohesion of 0.05. This network included 12 keystone taxa (M = 1, N = 4 and NM = 7) of the genera Cladosporium, Debaryomyces, Laetiporus, Mycoacia, Phlebia, Sidera, Sistotrema and Sterigmatomyces.
The AS network included 100 nodes (M = 0, N = 13 and NM = 87) and 66 edges with 7.6% of them connecting intra-niche ASVs (92.4% inter-niche). It showed a mean node degree of 1.32, a mean neighborhood connectivity of 1.58 and a mean cohesion of 0.04. The AS network included 14 keystone taxa (M = 0, N = 2 and NM = 12) of the genera Acremonium, Bjerkandera, Filobasidium, Itersonilia, Meyerozyma, Penicillium, Phaeosphaeria, Phanerochaete, Pseudobensingtonia, Sporobolomyces, Stereum and Vishniacozyma.
Finally, the HC network included 200 nodes (M = 1, N = 43 and NM = 156) and 192 edges with 11.5% of them connecting intra-niche ASVs (88.5% inter-niche). It showed a mean node degree of 1.92, a mean neighborhood connectivity of 2.63 and a mean cohesion of 0.09. The HC network included 17 keystone taxa (M = 0, N = 1 and NM = 16) of the genera Agaricomycetes_sp, Aspergillus, Athelia, Chytridiomycota_gen_Incertae_sedis, Cladosporium, Constantinomyces, Penicillium, Rigidoporus, Saccharomyces, Toxicocladosporium and Wallemia.
Four keystone ASVs were shared between AR and ARAS, one between AR and AS, and two between AS and HC (Table S3). Similarly, five keystone fungal genera were shared between AR and ARAS, two between AR and AS, one between AS and HC, and one among AR, ARAS and HC (Table S3).

4. Discussion

Allergic rhinitis and asthma are significant healthcare burdens, causing widespread distress globally [1,2,3]. The nasal and oral mycobiome have been closely linked to the onset, progression and severity of both conditions [25,26,27]. However, no studies so far have directly compared these two microbial communities within the same cohort to evaluate their similarities, differences and potential interactions during rhinitis or asthma. To bridge this gap, I analyzed ITS sequencing data from 349 individuals (698 nasal and oral samples), including those with allergic rhinitis (with and without comorbid asthma), asthma and healthy controls.
The nasal and oral mycobiomes overlapped in phyla and genera composition across all studied phenotypes (AR, ARAS, AS and HC) (Table S1 and Figure 1). All these fungal taxa are natural residents of the two cavities, including some opportunistic pathogens (e.g., Malassezia, Alternaria, Aspergillus, Candida and Penicillium) [56,57,58]. Fungal abundances varied more greatly between cavities at the genus level than at the phylum level, with 2–3 dominant genera varying significantly in AS and HC and 5–6 in AR and ARAS (Table S1). The nasal mycobiomes showed higher richness and evenness than the oral mycobiomes for most alpha-diversity indices and phenotypes (Figure 2 and Table S2), with about half of the comparisons resulting significant (p < 0.01). Nasal and oral fungal communities were also differently structured across cavities and clinical phenotypes for all beta-diversity indices compared (0.0433 ≤ p < 0.0001), with the former being the major driver of divergence (Figure 3).
As indicated above, we are still lacking studies comparing the composition and diversity of the nasal and oral mycobiomes in rhinitis or asthma, but previous analyses in healthy individuals have revealed shared membership but significant differences in relative proportions between both cavities [59,60,61,62], as seen in this study. Such taxonomic differences, as those seen in diversity, can be attributed to several key factors differentiating the nasal and oral mucosal environments, including oral exposure to food and beverage intake, variation in environmental conditions like pH (the mouth tends to be more neutral, while the nasal cavity is slightly more acidic); moisture (the mouth has abundant saliva, while the nose has mucus) or oxygen availability (the nasal passages are more directly exposed to ambient air compared to the relatively more enclosed and moist oral cavity); host immune factors (the saliva, for example, contains antimicrobial peptides; immunoglobulins and enzymes like lysozyme that regulate fungal populations differently than the mucociliary defense system in the airways; similarly, the nasal mucus has also unique antimicrobial peptides); intra- and inter-domain microbial interactions (the bacterial communities also differ between the mouth and nose, influencing fungal populations through competition or cooperation); biofilms (like the dental plaque, which provides a unique structure that supports fungi differently than the loosely attached microbiota in the nasal cavity); anatomical barriers and mucociliary clearance mechanisms (lacking in the oral cavity) [59,60,61,62,63,64,65].
Co-occurrence networks showed distinct patterns of fungal interactions in each phenotype (Figure 4 and Table S3). The AR network showed the highest connectivity (i.e., complexity), while the other three networks shower a greater proportion of unconnected nodes (i.e., fragmentation). This agrees with a former network analysis of the oral mycobiome, which also shown more complex interactions in the AR group [27]. The AS network showed the lowest proportion (13%) of specialists (N or M), while the ARAS network showed the highest proportion (41.5%) of specialists. Higher proportions of NM taxa suggest that AR, AS and HC networks are less stable and more transient. Concomitantly, the ARAS network also showed the highest proportion (36%) of intra-niche node interactions, while the other three naso–oral networks showed lower values (8% to 14%). Most of the keystone nodes across the networks (58.3 to 94.1%) also inhabited both cavities (NM). All this evidence, thus, suggests that the fungal interactome in the naso–oral region is dominated by generalists. This remarkably contrasts with a previous study of the naso–oral bacteriomes in this same cohort [34], where network membership included more specialists (up to 99.4% in the HC network) and lower fragmentation, highlighting differences between the fungal and bacterial interactomes.
Previous studies of the oral, nasal and nasopharyngeal bacteriome during respiratory infection have also suggested that loss of ecological specialization (or translocation) may lead to respiratory disease [29,66,67,68]. Similarly, network fragmentation, which is indicative of potential dysbiosis and loss of stability, could increase susceptibility to airway disease [29,34]. The co-occurrence analyses here do not seem to show clear trends, since healthy individuals showed similar or lower levels of fungal network specialization and fragmentation than AR and ARAS individuals (Figure 4 and Table S3). Although it is possible that those factors are playing differential roles in these communities (HC included less pathogenic keystone taxa, hence less dysbiotic interactions—see below), further research is needed to validate this hypothesis.
Taxa inhabiting both cavities (i.e., generalists) seem to play an important role in the fungal interactome. These findings highlight the distinct yet interconnected roles of the naso–oral mycobiome in allergic rhinitis and asthma. Moreover, they reinforce the idea that, despite their shared pathophysiological and clinical features under the united airway disease concept [15]), allergic rhinitis and asthma may represent distinct conditions, as supported by this and other omics studies [26,27,34,69,70,71,72,73].
Twelve to twenty-five keystone nodes (key taxa influencing community structure, stability and function) were detected across the networks (Table S3). Several belonged to genera considered opportunistic pathogens (Acremonium, Fusarium, Exophiala, Malassezia, Meyerozyma or Rhodotorula) and were only found in the disease phenotypes. Nonetheless, some pathogenic genera (Cladosporium, Penicillium or Aspergillus) were also found in the healthy group, which included more commensal taxa.
Some keystone ASVs of the genera Aspergillus, Cladosporium, Debaryomyces, Filobasidium, Malassezia, Penicillium, Rhodotorula, Saccharomyces, Vishniacozyma and Wallemia showed a relative high abundance in the nasal or oral cavities; however, most of them (Table S3) showed low abundances, despite being highly connected. This aligns with the “rare taxa” hypothesis, which suggests that a species’ abundance is not always the best indicator of its significance within a microbial community [74,75]. Adopting a system-centric approach to studying the airway mycobiome may offer deeper insights into the roles of lesser-known microbes as disease indicators and potential therapeutic targets [29,34,76,77,78,79]. Further research is needed to elucidate their contribution to the pathogenesis of respiratory illnesses [71,72,73,79,80,81,82].
This study has some limitations. ITS amplicon sequence data has limited resolution, hence fungal taxa could not be widely identified at the species level. ITS sequencing may experience PCR biases [83,84]. This is a cross-sectional study, so it does not account for potential fungal variation over time or the impact of confounding factors (antibiotic or probiotic use, clinical severity or allergens). Similarly, it allows to infer significant associations across the compared clinical groups but not causality. The potential pathological effect of pathogenic fungi in patients with allergic rhinitis or asthma is beyond the scope of this study, and further research is needed to explore that. Finally, this study focuses on a Portuguese cohort, hence new cohorts need to be characterized to validate all the findings presented here.

5. Conclusions

I analyzed the nasal and oral mycobiomes of a cohort of 349 individuals, including those with allergic rhinitis (with and without comorbid asthma), asthma and healthy controls. The fungal communities exhibited significant differences in taxonomic composition, diversity and structural organization between cavities across all clinical groups. Additionally, fungal networks differed notably in connectivity and fragmentation and keystone taxa, with multiple keystone species of varying relative abundance identified in each network.

Supplementary Materials

The following supporting information can be downloaded at: https://www.mdpi.com/article/10.3390/microorganisms13061204/s1. Table S1: Mean relative proportions and statistical significance of pairwise comparisons of mycobiomes from the mouth (M) and nose (N) of participants with allergic rhinitis (AR), allergic rhinitis with asthma comorbidity (ARAS), asthma (AS) and healthy controls (HC). Table S2: Alpha-diversity estimates (Chao1 richness, Shannon, Simpson and phylogenetic diversity indices) of mycobiomes from the mouth (M) and nose (N) of participants with allergic rhinitis (AR), allergic rhinitis with asthma comorbidity (ARAS), asthma (AS) and healthy controls (HC). Table S3: Amplicon sequence variants (ASVs) included in the co-occurrence networks (nodes) of the naso–oral mycobiomes in Figure 4. Niche assignment (N = nose, M = mouth, NM = undetermined or mixed), keystone status and taxonomic identification are provided for all ASVs. Figure S1: UpSet plot of amplicon sequence variants (ASVs) of mycobiomes from the mouth (M) and nose (N) of participants with allergic rhinitis (AR), allergic rhinitis with asthma comorbidity (ARAS), asthma (AS) and healthy controls (HC).

Funding

This study was co-funded by the EU via European Regional Development Fund (ERDF) and by national funds via the Fundação para a Ciência e a Tecnologia (FCT) and the project PTDC/ASP-PES/27953/2017—POCI-01-0145-FEDER-027953. M.P.-L. was supported by the FCT under the “Programa Operacional Potencial Humano—Quadro de Referência Estratégico” Nacional funds from the European Social Fund and Portuguese “Ministério da Educação e Ciência” IF/00764/2013.

Institutional Review Board Statement

All participants enrolled in this study were part of the ASMAPORT Project (PTDC/SAU-INF/27953/2017). This study was approved by the “Comissão de Ética para a Saúde” (Parecer_58-17, 17 March 2017) of the Centro Hospitalar Universitário São João, Facultade de Medicina (Porto, Portugal).

Informed Consent Statement

Written consent from all the participants or their legal guardians was obtained using the informed consent documents approved by the ethics committee.

Data Availability Statement

Sequence files and associated metadata and BioSample attributes have been deposited in the NCBI (PRJNA1107919).

Acknowledgments

I thank all the participants who kindly supplied a biological sample and all the collaborators, clinicians, technicians and nurses at Centro Hospitalar Universitário São João, Faculdade de Medicina da Universidade do Porto, University Institute of Health Sciences—CESPU, and Universidad de Talca, who contributed to the ASMAPORT project. I also thank the GWU Colonial One High Performance Computing Cluster for computational time.

Conflicts of Interest

The author declares no conflicts of interest.

References

  1. Serebrisky, D.; Wiznia, A. Pediatric Asthma: A Global Epidemic. Ann. Glob. Health 2019, 85, 6. [Google Scholar] [CrossRef] [PubMed]
  2. Dierick, B.J.H.; van der Molen, T.; Flokstra-de Blok, B.M.J.; Muraro, A.; Postma, M.J.; Kocks, J.W.H.; van Boven, J.F.M. Burden and socioeconomics of asthma, allergic rhinitis, atopic dermatitis and food allergy. Expert. Rev. Pharmacoecon Outcomes Res. 2020, 20, 437–453. [Google Scholar] [CrossRef] [PubMed]
  3. Meltzer, E.O.; Bukstein, D.A. The economic impact of allergic rhinitis and current guidelines for treatment. Ann. Allergy Asthma Immunol. Off. Publ. Am. Coll. Allergy Asthma Immunol. 2011, 106, S12–S16. [Google Scholar] [CrossRef] [PubMed]
  4. Barrie, C. Allergic rhinitis. Pediatr. Rev. 2023, 44, 537–550. [Google Scholar]
  5. GBD Disease Injury Incidence Prevalence Collaborators. Global, regional, and national incidence, prevalence, and years lived with disability for 354 diseases and injuries for 195 countries and territories, 1990–2017: A systematic analysis for the Global Burden of Disease Study 2017. Lancet 2018, 392, 1789–1858. [Google Scholar] [CrossRef]
  6. GBD Diseases Injuries Collaborators. Global burden of 369 diseases and injuries in 204 countries and territories, 1990–2019: A systematic analysis for the Global Burden of Disease Study 2019. Lancet 2020, 396, 1204–1222. [Google Scholar] [CrossRef]
  7. Dharmage, S.C.; Perret, J.L.; Custovic, A. Epidemiology of Asthma in Children and Adults. Front. Pediatr. 2019, 7, 246. [Google Scholar] [CrossRef]
  8. The Global Asthma Report. Auckland: Global Asthma Network. 2018. Available online: www.globalasthmanetwork.org (accessed on 22 May 2025).
  9. Savoure, M.; Bousquet, J.; Jaakkola, J.J.K.; Jaakkola, M.S.; Jacquemin, B.; Nadif, R. Worldwide prevalence of rhinitis in adults: A review of definitions and temporal evolution. Clin. Transl. Allergy 2022, 12, e12130. [Google Scholar] [CrossRef]
  10. Steelant, B.; Farre, R.; Wawrzyniak, P.; Belmans, J.; Dekimpe, E.; Vanheel, H.; Van Gerven, L.; Kortekaas Krohn, I.; Bullens, D.M.A.; Ceuppens, J.L.; et al. Impaired barrier function in patients with house dust mite-induced allergic rhinitis is accompanied by decreased occludin and zonula occludens-1 expression. J. Allergy Clin. Immunol. 2016, 137, 1043–1053.e5. [Google Scholar] [CrossRef]
  11. Steelant, B.; Seys, S.F.; Van Gerven, L.; Van Woensel, M.; Farre, R.; Wawrzyniak, P.; Kortekaas Krohn, I.; Bullens, D.M.; Talavera, K.; Raap, U.; et al. Histamine and T helper cytokine-driven epithelial barrier dysfunction in allergic rhinitis. J. Allergy Clin. Immunol. 2018, 141, 951–963.e8. [Google Scholar] [CrossRef]
  12. Acevedo-Prado, A.; Seoane-Pillado, T.; Lopez-Silvarrey-Varela, A.; Salgado, F.J.; Cruz, M.J.; Faraldo-Garcia, A.; Nieto-Fontarigo, J.J.; Pertega-Diaz, S.; Sanchez-Lastres, J.; San-Jose-Gonzalez, M.A.; et al. Association of rhinitis with asthma prevalence and severity. Sci. Rep. 2022, 12, 6389. [Google Scholar] [CrossRef] [PubMed]
  13. Mims, J.W. Asthma: Definitions and pathophysiology. Int. Forum Allergy Rhinol. 2015, 5 (Suppl. S1), S2–S6. [Google Scholar] [CrossRef] [PubMed]
  14. Licari, A.; Brambilla, I.; Marseglia, A.; De Filippo, M.; Paganelli, V.; Marseglia, G.L. Difficult vs. Severe Asthma: Definition and Limits of Asthma Control in the Pediatric Population. Front. Pediatr. 2018, 6, 170. [Google Scholar] [CrossRef]
  15. Compalati, E.; Ridolo, E.; Passalacqua, G.; Braido, F.; Villa, E.; Canonica, G.W. The link between allergic rhinitis and asthma: The united airways disease. Expert. Rev. Clin. Immunol. 2010, 6, 413–423. [Google Scholar] [CrossRef] [PubMed]
  16. Bousquet, J.; Hellings, P.W.; Agache, I.; Amat, F.; Annesi-Maesano, I.; Ansotegui, I.J.; Anto, J.M.; Bachert, C.; Bateman, E.D.; Bedbrook, A.; et al. Allergic Rhinitis and its Impact on Asthma (ARIA) Phase 4 (2018): Change management in allergic rhinitis and asthma multimorbidity using mobile technology. J. Allergy Clin. Immunol. 2019, 143, 864–879. [Google Scholar] [CrossRef]
  17. Ferreira-Magalhaes, M.; Pereira, A.M.; Sa-Sousa, A.; Morais-Almeida, M.; Azevedo, I.; Azevedo, L.F.; Fonseca, J.A. Asthma control in children is associated with nasal symptoms, obesity, and health insurance: A nationwide survey. Pediatr. Allergy Immunol. Off. Publ. Eur. Soc. Pediatr. Allergy Immunol. 2015, 26, 466–473. [Google Scholar] [CrossRef]
  18. Pite, H.; Pereira, A.M.; Morais-Almeida, M.; Nunes, C.; Bousquet, J.; Fonseca, J.A. Prevalence of asthma and its association with rhinitis in the elderly. Respir. Med. 2014, 108, 1117–1126. [Google Scholar] [CrossRef]
  19. Small, P.; Keith, P.K.; Kim, H. Allergic rhinitis. Allergy Asthma Clin. Immunol. 2018, 14, 51. [Google Scholar] [CrossRef]
  20. Valovirta, E. Managing co-morbid asthma with allergic rhinitis: Targeting the one-airway with leukotriene receptor antagonists. World Allergy Organ. J. 2012, 5, S210–S211. [Google Scholar] [CrossRef]
  21. Bergeron, C.; Hamid, Q. Relationship between Asthma and Rhinitis: Epidemiologic, Pathophysiologic, and Therapeutic Aspects. Allergy Asthma Clin. Immunol. 2005, 1, 81–87. [Google Scholar] [CrossRef]
  22. Kim, H.; Bouchard, J.; Renzi, P.M. The link between allergic rhinitis and asthma: A role for antileukotrienes? Can. Respir. J. 2008, 15, 91–98. [Google Scholar] [CrossRef] [PubMed]
  23. Pawankar, R. Allergic rhinitis and asthma: Are they manifestations of one syndrome? Clin. Exp. Allergy J. Br. Soc. Allergy Clin. Immunol. 2006, 36, 1–4. [Google Scholar] [CrossRef] [PubMed]
  24. Bousquet, J.; Melen, E.; Haahtela, T.; Koppelman, G.H.; Togias, A.; Valenta, R.; Akdis, C.A.; Czarlewski, W.; Rothenberg, M.; Valiulis, A.; et al. Rhinitis associated with asthma is distinct from rhinitis alone: The ARIA-MeDALL hypothesis. Allergy 2023, 78, 1169–1203. [Google Scholar] [CrossRef] [PubMed]
  25. Yuan, H.; Liu, Z.; Dong, J.; Bacharier, L.B.; Jackson, D.; Mauger, D.; Boushey, H.; Castro, M.; Durack, J.; Huang, Y.J.; et al. The Fungal Microbiome of the Upper Airway Is Associated With Future Loss of Asthma Control and Exacerbation Among Children With Asthma. Chest 2023, 164, 302–313. [Google Scholar] [CrossRef]
  26. Perez-Losada, M.; Castro-Nallar, E.; Garcia-Huidobro, J.; Boechat, J.L.; Delgado, L.; Rama, T.A.; Oliveira, M. The nasal mycobiome of individuals with allergic rhinitis and asthma differs from that of healthy controls in composition, structure and function. Front. Microbiol. 2024, 15, 1464257. [Google Scholar] [CrossRef]
  27. Perez-Losada, M.; Castro-Nallar, E.; Garcia-Huidobro, J.; Boechat, J.L.; Delgado, L.; Rama, T.A.; Oliveira, M. Characterization of the oral mycobiome of Portuguese with allergic rhinitis and asthma. Curr. Res. Microb. Sci. 2024, 7, 100300. [Google Scholar] [CrossRef]
  28. Faust, K.; Raes, J. Microbial interactions: From networks to models. Nat. Rev. Microbiol. 2012, 10, 538–550. [Google Scholar] [CrossRef]
  29. Reyman, M.; Clerc, M.; van Houten, M.A.; Arp, K.; Chu, M.; Hasrat, R.; Sanders, E.A.M.; Bogaert, D. Microbial community networks across body sites are associated with susceptibility to respiratory infections in infants. Commun. Biol. 2021, 4, 1233. [Google Scholar] [CrossRef]
  30. Faust, K.; Sathirapongsasuti, J.F.; Izard, J.; Segata, N.; Gevers, D.; Raes, J.; Huttenhower, C. Microbial co-occurrence relationships in the human microbiome. PLoS Comput. Biol. 2012, 8, e1002606. [Google Scholar] [CrossRef]
  31. Li, R.; Li, J.; Zhou, X. Lung microbiome: New insights into the pathogenesis of respiratory diseases. Signal Transduct. Target. Ther. 2024, 9, 19. [Google Scholar] [CrossRef]
  32. Zhang, D.; Li, S.; Wang, N.; Tan, H.-Y.; Zhang, Z.; Feng, Y. The Cross-Talk Between Gut Microbiota and Lungs in Common Lung Diseases. Front. Microbiol. 2020, 11, 301. [Google Scholar] [CrossRef] [PubMed]
  33. Huang, C.; Yu, Y.; Du, W.; Liu, Y.; Dai, R.; Tang, W.; Wang, P.; Zhang, C.; Shi, G. Fungal and bacterial microbiome dysbiosis and imbalance of trans-kingdom network in asthma. Clin. Transl. Allergy 2020, 10, 42. [Google Scholar] [CrossRef] [PubMed]
  34. Pérez-Losada, M. Diversity and interactions of the naso-buccal bacteriome in in-dividuals with allergic rhinitis, asthma and healthy controls. Allergies, 2025; in press. [Google Scholar]
  35. Sey, E.A.; Warris, A. The gut-lung axis: The impact of the gut mycobiome on pulmonary diseases and infections. Oxf. Open Immunol. 2024, 5, iqae008. [Google Scholar] [CrossRef]
  36. Xu, C.; Hao, M.; Zai, X.; Song, J.; Huang, Y.; Gui, S.; Chen, J. A new perspective on gut-lung axis affected through resident microbiome and their implications on immune response in respiratory diseases. Arch. Microbiol. 2024, 206, 107. [Google Scholar] [CrossRef]
  37. Kozich, J.J.; Westcott, S.L.; Baxter, N.T.; Highlander, S.K.; Schloss, P.D. Development of a dual-index sequencing strategy and curation pipeline for analyzing amplicon sequence data on the MiSeq Illumina sequencing platform. Appl. Env. Microbiol. 2013, 79, 5112–5120. [Google Scholar] [CrossRef]
  38. Thompson, L.R.; Sanders, J.G.; McDonald, D.; Amir, A.; Ladau, J.; Locey, K.J.; Prill, R.J.; Tripathi, A.; Gibbons, S.M.; Ackermann, G.; et al. A communal catalogue reveals Earth’s multiscale microbial diversity. Nature 2017, 551, 457–463. [Google Scholar] [CrossRef]
  39. Callahan, B.J.; McMurdie, P.J.; Rosen, M.J.; Han, A.W.; Johnson, A.J.; Holmes, S.P. DADA2: High-resolution sample inference from Illumina amplicon data. Nat. Methods 2016, 13, 581–583. [Google Scholar] [CrossRef]
  40. Nilsson, R.H.; Larsson, K.H.; Taylor, A.F.S.; Bengtsson-Palme, J.; Jeppesen, T.S.; Schigel, D.; Kennedy, P.; Picard, K.; Glockner, F.O.; Tedersoo, L.; et al. The UNITE database for molecular identification of fungi: Handling dark taxa and parallel taxonomic classifications. Nucleic Acids Res. 2019, 47, D259–D264. [Google Scholar] [CrossRef]
  41. Quast, C.; Pruesse, E.; Yilmaz, P.; Gerken, J.; Schweer, T.; Yarza, P.; Peplies, J.; Glockner, F.O. The SILVA ribosomal RNA gene database project: Improved data processing and web-based tools. Nucleic Acids Res. 2013, 41, D590–D596. [Google Scholar] [CrossRef]
  42. Wang, Q.; Garrity, G.M.; Tiedje, J.M.; Cole, J.R. Naive Bayesian classifier for rapid assignment of rRNA sequences into the new bacterial taxonomy. Appl. Environ. Microbiol. 2007, 73, 5261–5267. [Google Scholar] [CrossRef] [PubMed]
  43. Katoh, K.; Standley, D.M. MAFFT multiple sequence alignment software version 7: Improvements in performance and usability. Mol. Biol. Evol. 2013, 30, 772–780. [Google Scholar] [CrossRef] [PubMed]
  44. Price, M.N.; Dehal, P.S.; Arkin, A.P. FastTree 2--approximately maximum-likelihood trees for large alignments. PLoS ONE 2010, 5, e9490. [Google Scholar] [CrossRef] [PubMed]
  45. McMurdie, P.J.; Holmes, S. phyloseq: An R package for reproducible interactive analysis and graphics of microbiome census data. PLoS ONE 2013, 8, e61217. [Google Scholar] [CrossRef]
  46. McMurdie, P.J.; Holmes, S. Waste not, want not: Why rarefying microbiome data is inadmissible. PLoS Comput. Biol. 2014, 10, e1003531. [Google Scholar] [CrossRef]
  47. Love, M.I.; Huber, W.; Anders, S. Moderated estimation of fold change and dispersion for RNA-seq data with DESeq2. Genome Biol. 2014, 15, 550. [Google Scholar] [CrossRef]
  48. Bates, D.; Maechler, M.; Bolker, B.; Walker, S. Fitting linear mixed-effects models using lme4. J. Stat. Softw. 2015, 67, 1–48. [Google Scholar] [CrossRef]
  49. Dixon, P. VEGAN, a package of R functions for community ecology. J. Veg. Sci. 2003, 14, 927–930. [Google Scholar] [CrossRef]
  50. Benjamini, Y.; Hochberg, Y. Controlling the False Discovery Rate: A Practical and Powerful Approach to Multiple Testing. J. R. Stat. Soc. Ser. B (Methodol.) 1995, 57, 289–300. [Google Scholar] [CrossRef]
  51. Cook, R.D. Detection of Influential Observation in Linear Regression. Technometrics 1977, 19, 15–18. [Google Scholar] [CrossRef]
  52. R Core Team. R: A Language and Environment for Statistical Computing; R Foundation for Statistical Computing: Vienna, Austria, 2008; ISBN 3-900051-07-0. [Google Scholar]
  53. RStudio, R.T. Integrated Development for R; RStudio: IncBoston, MA, USA, 2015. [Google Scholar]
  54. De Cáceres, M.; Legendre, P.; Moretti, M. Improving indicator species analysis by combining groups of sites. Oikos 2010, 119, 1674–1684. [Google Scholar] [CrossRef]
  55. Kurtz, Z.D.; Muller, C.L.; Miraldi, E.R.; Littman, D.R.; Blaser, M.J.; Bonneau, R.A. Sparse and compositionally robust inference of microbial ecological networks. PLoS Comput. Biol. 2015, 11, e1004226. [Google Scholar] [CrossRef] [PubMed]
  56. Andersson, M.; Downs, S.; Mitakakis, T.; Leuppi, J.; Marks, G. Natural exposure to Alternaria spores induces allergic rhinitis symptoms in sensitized children. Pediatr. Allergy Immunol. 2003, 14, 100–105. [Google Scholar] [CrossRef] [PubMed]
  57. Oliveira, M.; Oliveira, D.; Lisboa, C.; Boechat, J.L.; Delgado, L. Clinical Manifestations of Human Exposure to Fungi. J. Fungi 2023, 9, 381. [Google Scholar] [CrossRef]
  58. Badiee, P.; Hashemizadeh, Z. Opportunistic invasive fungal infections: Diagnosis & clinical management. Indian. J. Med. Res. 2014, 139, 195–204. [Google Scholar]
  59. Cui, L.; Lucht, L.; Tipton, L.; Rogers, M.B.; Fitch, A.; Kessinger, C.; Camp, D.; Kingsley, L.; Leo, N.; Greenblatt, R.M.; et al. Topographic diversity of the respiratory tract mycobiome and alteration in HIV and lung disease. Am. J. Respir. Crit. Care Med. 2015, 191, 932–942. [Google Scholar] [CrossRef]
  60. Belvoncikova, P.; Splichalova, P.; Videnska, P.; Gardlik, R. The Human Mycobiome: Colonization, Composition and the Role in Health and Disease. J. Fungi 2022, 8, 1046. [Google Scholar] [CrossRef]
  61. Cui, L.; Morris, A.; Ghedin, E. The human mycobiome in health and disease. Genome Med. 2013, 5, 63. [Google Scholar] [CrossRef]
  62. Zelasko, S.; Swaney, M.H.; Sandstrom, S.; Davenport, T.C.; Seroogy, C.M.; Gern, J.E.; Kalan, L.R.; Currie, C.R. Upper respiratory microbial communities of healthy populations are shaped by niche and age. Microbiome 2024, 12, 206. [Google Scholar] [CrossRef]
  63. Maughan, H.; Whiteson, K. Saliva as a window into the human oral microbiome and metabolome. In Salivary Bioscience; Granger, D., Taylor, M., Eds.; Springer: Cham, Switzerland, 2020. [Google Scholar]
  64. Ghannoum, M.A.; Jurevic, R.J.; Mukherjee, P.K.; Cui, F.; Sikaroodi, M.; Naqvi, A.; Gillevet, P.M. Characterization of the oral fungal microbiome (mycobiome) in healthy individuals. PLoS Pathog. 2010, 6, e1000713. [Google Scholar] [CrossRef]
  65. Willger, S.D.; Grim, S.L.; Dolben, E.L.; Shipunova, A.; Hampton, T.H.; Morrison, H.G.; Filkins, L.M.; O’Toole, G.A.; Moulton, L.A.; Ashare, A.; et al. Characterization and quantification of the fungal microbiome in serial samples from individuals with cystic fibrosis. Microbiome 2014, 2, 40. [Google Scholar] [CrossRef] [PubMed]
  66. Man, W.H.; Clerc, M.; de Steenhuijsen Piters, W.A.A.; van Houten, M.A.; Chu, M.; Kool, J.; Keijser, B.J.F.; Sanders, E.A.M.; Bogaert, D. Loss of Microbial Topography between Oral and Nasopharyngeal Microbiota and Development of Respiratory Infections Early in Life. Am. J. Respir. Crit. Care Med. 2019, 200, 760–770. [Google Scholar] [CrossRef] [PubMed]
  67. Surette, M.G.; Bowdish, D.M.E. Loss of Microbial Topography Precedes Infection in Infants. Am. J. Respir. Crit. Care Med. 2019, 200, 660–662. [Google Scholar] [CrossRef] [PubMed]
  68. Whelan, F.J.; Verschoor, C.P.; Stearns, J.C.; Rossi, L.; Luinstra, K.; Loeb, M.; Smieja, M.; Johnstone, J.; Surette, M.G.; Bowdish, D.M. The loss of topography in the microbial communities of the upper respiratory tract in the elderly. Ann. Am. Thorac. Soc. 2014, 11, 513–521. [Google Scholar] [CrossRef]
  69. Dizier, M.H.; Bouzigon, E.; Guilloud-Bataille, M.; Genin, E.; Oryszczyn, M.P.; Annesi-Maesano, I.; Demenais, F. Evidence for a locus in 1p31 region specifically linked to the co-morbidity of asthma and allergic rhinitis in the EGEA study. Hum. Hered. 2007, 63, 162–167. [Google Scholar] [CrossRef]
  70. Lemonnier, N.; Melen, E.; Jiang, Y.; Joly, S.; Menard, C.; Aguilar, D.; Acosta-Perez, E.; Bergstrom, A.; Boutaoui, N.; Bustamante, M.; et al. A novel whole blood gene expression signature for asthma, dermatitis, and rhinitis multimorbidity in children and adolescents. Allergy 2020, 75, 3248–3260. [Google Scholar] [CrossRef]
  71. Perez-Losada, M.; Castro-Nallar, E.; Laerte Boechat, J.; Delgado, L.; Azenha Rama, T.; Berrios-Farias, V.; Oliveira, M. The oral bacteriomes of patients with allergic rhinitis and asthma differ from that of healthy controls. Front. Microbiol. 2023, 14, 1197135. [Google Scholar] [CrossRef]
  72. Perez-Losada, M.; Castro-Nallar, E.; Laerte Boechat, J.; Delgado, L.; Azenha Rama, T.; Berrios-Farias, V.; Oliveira, M. Nasal Bacteriomes of Patients with Asthma and Allergic Rhinitis Show Unique Composition, Structure, Function and Interactions. Microorganisms 2023, 11, 683. [Google Scholar] [CrossRef]
  73. Ramos-Tapia, I.; Reynaldos-Grandon, K.L.; Perez-Losada, M.; Castro-Nallar, E. Characterization of the upper respiratory tract microbiota in Chilean asthmatic children reveals compositional, functional, and structural differences. Front. Allergy 2023, 4, 1223306. [Google Scholar] [CrossRef]
  74. Lynch, M.D.; Neufeld, J.D. Ecology and exploration of the rare biosphere. Nat. Rev. Microbiol. 2015, 13, 217–229. [Google Scholar] [CrossRef]
  75. Litchman, E.; Villeger, S.; Zinger, L.; Auguet, J.C.; Thuiller, W.; Munoz, F.; Kraft, N.J.B.; Philippot, L.; Violle, C. Refocusing the microbial rare biosphere concept through a functional lens. Trends Ecol. Evol. 2024, 39, 923–936. [Google Scholar] [CrossRef] [PubMed]
  76. Wang, X.; Xu, X.; Xia, Y. Further analysis reveals new gut microbiome markers of type 2 diabetes mellitus. Antonie Van. Leeuwenhoek 2017, 110, 445–453. [Google Scholar] [CrossRef] [PubMed]
  77. Ghosh, T.S.; Rampelli, S.; Jeffery, I.B.; Santoro, A.; Neto, M.; Capri, M.; Giampieri, E.; Jennings, A.; Candela, M.; Turroni, S.; et al. Mediterranean diet intervention alters the gut microbiome in older people reducing frailty and improving health status: The NU-AGE 1-year dietary intervention across five European countries. Gut 2020, 69, 1218–1228. [Google Scholar] [CrossRef] [PubMed]
  78. Kong, X.; Liu, J.; Cetinbas, M.; Sadreyev, R.; Koh, M.; Huang, H.; Adeseye, A.; He, P.; Zhu, J.; Russell, H.; et al. New and Preliminary Evidence on Altered Oral and Gut Microbiota in Individuals with Autism Spectrum Disorder (ASD): Implications for ASD Diagnosis and Subtyping Based on Microbial Biomarkers. Nutrients 2019, 11, 2128. [Google Scholar] [CrossRef]
  79. Kim, Y.H.; Jang, H.; Kim, S.Y.; Jung, J.H.; Kim, G.E.; Park, M.R.; Hong, J.Y.; Kim, M.N.; Kim, E.G.; Kim, M.J.; et al. Gram-negative microbiota is related to acute exacerbation in children with asthma. Clin. Transl. Allergy 2021, 11, e12069. [Google Scholar] [CrossRef]
  80. Sanders, D.J.; Inniss, S.; Sebepos-Rogers, G.; Rahman, F.Z.; Smith, A.M. The role of the microbiome in gastrointestinal inflammation. Biosci. Rep. 2021, 41, BSR20203850. [Google Scholar] [CrossRef]
  81. Tang, H.; Du, S.; Niu, Z.; Zhang, D.; Tang, Z.; Chen, H.; Chen, Z.; Zhang, M.; Xu, Y.; Sun, Y.; et al. Nasal, dermal, oral and indoor dust microbe and their interrelationship in children with allergic rhinitis. BMC Microbiol. 2024, 24, 505. [Google Scholar] [CrossRef]
  82. Perez-Garcia, J.; Gonzalez-Carracedo, M.; Espuela-Ortiz, A.; Hernandez-Perez, J.M.; Gonzalez-Perez, R.; Sardon-Prado, O.; Martin-Gonzalez, E.; Mederos-Luis, E.; Poza-Guedes, P.; Corcuera-Elosegui, P.; et al. The upper-airway microbiome as a biomarker of asthma exacerbations despite inhaled corticosteroid treatment. J. Allergy Clin. Immunol. 2023, 151, 706–715. [Google Scholar] [CrossRef]
  83. Hilton, S.K.; Castro-Nallar, E.; Perez-Losada, M.; Toma, I.; McCaffrey, T.A.; Hoffman, E.P.; Siegel, M.O.; Simon, G.L.; Johnson, W.E.; Crandall, K.A. Metataxonomic and Metagenomic Approaches vs. Culture-Based Techniques for Clinical Pathology. Front. Microbiol. 2016, 7, 484. [Google Scholar] [CrossRef]
  84. Perez-Losada, M.; Narayanan, D.B.; Kolbe, A.R.; Ramos-Tapia, I.; Castro-Nallar, E.; Crandall, K.A.; Dominguez, J. Comparative Analysis of Metagenomics and Metataxonomics for the Characterization of Vermicompost Microbiomes. Front. Microbiol. 2022, 13, 854423. [Google Scholar] [CrossRef]
Figure 1. Bar plots of relative mean abundances of the top fungal genera in the mouth (M) and nose (N) of participants with allergic rhinitis (AR), allergic rhinitis with asthma comorbidity (ARAS), asthma (AS) and healthy controls (HC).
Microorganisms 13 01204 g001
Figure 2. Alpha-diversity estimates in mycobiomes from the mouth (M) and nose (N) of participants with allergic rhinitis (AR), allergic rhinitis with asthma comorbidity (ARAS), asthma (AS) and healthy controls (HC). Statistical significance is indicated: * = p ≤ 0.05; ** = p ≤ 0.01; *** = p ≤ 0.001; **** = p ≤ 0.0001; ns = not significant.
Microorganisms 13 01204 g002
Figure 3. Principal coordinates analysis (PCoA) plots of beta-diversity Unifrac distances in mycobiomes from the mouth (M) and nose (N) of participants with allergic rhinitis (AR), allergic rhinitis with asthma comorbidity (ARAS), asthma (AS) and healthy controls (HC).
Microorganisms 13 01204 g003
Figure 4. Co-occurrence networks of naso–oral mycobiomes from participants with allergic rhinitis (AR), allergic rhinitis with asthma comorbidity (ARAS), asthma (AS) and healthy controls (HC). All nodes (ASVs) in the networks were assigned to a cavity (M = mouth, N = nose, NM = mixed or undetermined).
Microorganisms 13 01204 g004
Disclaimer/Publisher’s Note: The statements, opinions and data contained in all publications are solely those of the individual author(s) and contributor(s) and not of MDPI and/or the editor(s). MDPI and/or the editor(s) disclaim responsibility for any injury to people or property resulting from any ideas, methods, instructions or products referred to in the content.

