Abstract
The objective of this study was to evaluate the effect of fecal bacterial community and metabolomics in goats when consuming a lower-protein diet with different energy levels. Eight healthy Leizhou goats, with 11 ± 0.78 kg of body weight, were selected and housed individually in cages. The animals were randomly allocated to a lower-protein diet that varied with four metabolites energy levels (7.01, 8.33, 9.66, and 10.98 MJ/kg DM) in a replicated 4 × 4 Latin square design. Notably, energy-dependent microbial restructuring was observed at both phylum and genus levels. At the phylum level, the relative abundances of Firmicutes and Spirochaetote increased linearly, whereas the Bacteroidota and Patescibacteria decreased linearly with increasing dietary energy levels (p < 0.05). The relative abundances of Verrucomicrobiota increased quadratically, whereas others decreased quadratically with increasing dietary energy levels (p < 0.05). At the genus level, a total of 316 bacteria were identified in the 32 fecal samples. The relative abundances of Christensenellaceae_R-7_group, unclassified_f__Lachnospiraceae, Ruminococcus, norank_o__Clostridia_UCG-014, Treponema, [Eubacterium]_siraeum_group, and [Eubacterium]_ruminantium_group increased linearly, whereas the Oscillospiraceae_UCG-005, norank_f__[Eubacterium]_coprostanoligenes_group, Prevotellaceae_UCG-004, unclassified_c__Clostridia, norank_f__Ruminococcaceae, unclassified_f__ Oscillospiraceae, and others decreased linearly with an increasing dietary energy levels (p < 0.05). In addition, the metabolomic analysis of feces showed that there are many differential metabolites in goats when consuming a lower-protein diet with different energy levels; for example, lipid metabolism and amino acid metabolic pathways were increased in MLE, MHE, and HE groups compared to the LE group. In conclusion, this study provides further information regarding the effects on fecal bacterial community composition and metabolites in goats when consuming a lower-protein diet with different energy levels.
1. Introduction
The Leizhou goat (Capra hircus), also named the Hainan Black goat, is the only indigenous goat breed in the Leizhou Peninsula and Hainan Island. As the tropical, well-adapted small ruminant breeds, Leizhou goats were characterized by high-quality meat and adaptability to humid and hot environments. There are more than 1.5 million Leizhou goats, and their production performance, litter sizes, and carcass yields are lower [1].
Dietary nutritional levels play a vital role in animal production, critically influencing growth performance and economic viability. Previous studies reported that a greater energy level could improve the production performance of Boer goats [2], Yunnan semi-fine wool sheep [3], Tan sheep [4], and Hu lambs [5]. Similarly, higher protein levels could also improve the animal performance in Anhui white goat kids [6] and growing Korean Black goats [7]. However, there is little information focused on the dietary energy and protein levels of Leizhou goats. In addition, high-energy and high-protein diets can lead to a waste of feed ingredients. Therefore, it is necessary to determine the optimal energy and protein levels to maximize animal production and achieve the greatest profit.
Currently, the Chinese government emphasizes developing lower-protein diets in animal production, driven by dual imperatives of mitigating nitrogen pollution and addressing protein feedstock shortages. In addition, this strategic shift gains urgency from the escalating economic and environmental costs associated with conventional high-protein diets for animal production. However, many studies have reported the critical role of fecal bacteria, which is closely related to the immunity, digestion, and production performance of ruminants [8,9]. Previous studies reported that the fecal bacterial communities changed in lactating ewes [10] and dairy cows [11] when consuming a lower-protein diet.
By analyzing alterations in the compositional profiles of metabolites within an organism and their associated metabolic pathways, metabolomics offers a comprehensive and insightful approach to elucidating the physiological changes occurring within the organism. It was reported that 125 differential metabolites were screened in positive ion mode and enriched in 12 metabolic pathways, and in negative ion mode, 100 differential metabolites were screened and enriched in 7 metabolic pathways in pregnant goats [12]. Moreover, the fecal metabolite profiles were also reported on sheep [13] and lactating ewes [10] when consuming a lower-protein diet. Dietary energy is a vital factor affecting the rumen bacterial composition in ruminants [14]. However, there is little information on the fecal bacterial and metabolite changes in Leizhou goats when consuming a lower-protein diet with different energy levels.
In this study, we aimed to investigate the fecal bacterial communities and metabolomics profiles by using 16S rRNA sequencing together with untargeted metabolomics in Leizhou goats when consuming low-protein diets with different energy levels. The results provide further information regarding the changes in fecal bacterial communities and metabolism, which may be useful for developing a dietary formulation for optimizing Leizhou goats.
2. Materials and Methods
This experiment lasted for 16 weeks, from Jul. to Nov. 2024, and was carried out at the goat farm in Zhanjiang City, Guangdong Province, China. The goat farm belongs to the Zhanjiang Experimental Station (ZES), Chinese Academy of Tropical Agricultural Sciences.
2.1. Animals and Experimental Design
A total of 8 healthy Leizhou female goats (8 months, 11 ± 0.78 kg) were used in a replicated 4 × 4 Latin square experimental design, consisting of 4 dietary treatments and 4 periods, with 2 goats per treatment of each period. For each period, an initial 25 d were used for diet adaptation periods, and the final 3 d were used for sampling and data collection periods. The goats were fed an isonitrogenous with low crude protein (~9.91%) but with incremental levels of metabolizable energy (ME), namely 7.01, 8.33, 9.66, and 10.98 MJ/kg DM, respectively. The detailed composition and nutrient analysis of the diets are provided in Supplementary Table S1. Goats were housed individually in metabolic cages, which allowed ad libitum access to the experimental diet, and the water was freely available throughout the experiment. The goats were fed twice daily at 08:00 and 16:30 throughout the experimental periods.
2.2. Fecal Sample Collection
Fecal samples of the experimental goats were collected rectally using sterile gloves before morning feeding on the last 3 days of each period. The fecal samples were mixed and then frozen in liquid nitrogen and stored at −80 °C for subsequent microbiome and metabolomic profiling analysis.
2.3. Microbiome Analysis
A commercial fecal DNA extraction kit (DP328, Tiangen Biotech, Beijing, China) was used to extract the total genomic DNA from the fecal samples, which was extracted from 1.00 g. The DNA quality was checked using a Thermo NanoDrop 2000 UV microphotometer and 1% agarose gel electrophoresis. The V3–V4 regions of the 16S rRNA gene were amplified with primers 338F (5′- ACTCCTACGGGAGGCAGCAG-3′) and 806R (5′- GGACTACHVGGGTWTCTAAT-3′). The bacterial 16S amplification and the quality filtering, clustering, and analysis of the 16S rRNA sequencing data were conducted in accordance with Liu et al.’s (2024) [15] approach. The reaction conditions and procedures of the PCR amplification of the 16S rRNA gene were as follows: initial denaturation at 95 °C for 3 min, followed by 30 cycles, including denaturation at 95 °C for 30 s, annealing at 55 °C for 30 s, and extension at 72 °C for 45 s, with a final extension at 72 °C for 10 min and holding at 10 °C until halter by user. The PCR mixtures were prepared in triplicate in 20 µL volumes, which consisted of 10 µL of 2×Pro Taq, 0.8 µL of forward primer (5 mM), 0.8 µL of reverse primer (5 mM), 10 ng/uL of template DNA, and ddH2O added until 20 µL was reached. Agarose gel (2.0%) electrophoresis (Axygen Biosciences, Union City, CA, USA) was applied to assess the success of PCR reactions. The PCR products were purified, quantified, and sequenced on the Illumina MiSeq PE300 platform (Illumina, San Diego, CA, USA; Majorbio Bio-Pharm Technology Co., Ltd., Shanghai, China). Data were analyzed using the free online Majorbio Cloud Platform (www.Majorbio.com, accessed on 25 February 2025).
2.4. Metabolomic Profiling
A total of 50.0 mg fecal sample of goats was added to a 2 mL centrifuge tube containing a 6 mm diameter grinding bead. Metabolites were extracted from 400 μL extraction solution, which consisted of methanol and water (v:v 4:1) and contained 0.02 mg/mL of L-2-chlorophenylalanine as the internal standard. The mixture samples were ground by a frozen tissue grinder (Wonbio-96c, Shanghai wanbo biotechnology Co., Ltd., Shanghai, China) for 6 min at −10 °C and 50 Hz, and then followed by low-temperature ultrasonic extraction for 30 min at 5 °C and 40 kHz. The samples were kept at −20 °C for 30 min and then centrifuged at 13,000 g for 15 min. The supernatant from each tube was transferred to the injection vial for LC-MS/MS analysis.
The LC-MS/MS analysis of the fecal sample was conducted on a SCIEX UPLC-Triple TOF 5600 system equipped with an ACQUITY HSS T3 column (100 mm × 2.1 mm, 1.8 μm; Waters, USA) at Majorbio Bio-Pharm Technology Co., Ltd. (Shanghai, China). The mobile phases consisted of solvent A (0.1% formic acid in water: acetonitrile; v/v 95:5) and solvent B (0.1% formic acid in acetonitrile/isopropanol/water; 47.5:47.5, v/v). The flow rate was maintained at 0.40 mL/min, and the column temperature was set at 40 °C.
The UPLC system was coupled to a quadrupole-time-of-flight mass spectrometer (Triple TOFTM5600+, Sciex, Boston, MA, USA) with an electrospray ionization (ESI) source operating in both positive mode and negative modes. The optimal conditions were set as follows: source temperature at 550 °C; curtain gas (CUR) at 30 psi; both Ion Source Gas1 and Gas2 at 50 psi; ion-spray voltage floating (ISVF) at −4000 V in negative mode and 5000 V in positive mode, respectively; declustering potential at 80 V; collision energy (CE), 20–60 eV rolling for MS/MS. Data acquisition was performed in the Information Dependent Acquisition (IDA) mode. The detection was carried out over a mass range of 50–1000 m/z.
Raw LC-MS data were preprocessed by Progenesis QI software (Waters Corporation, Milford, CT, USA), and then a three-dimensional data matrix in CSV format was exported. The information in this three-dimensional matrix included sample information, metabolite name, and mass spectral response intensity. Internal standard peaks, as well as any known false positive peaks (including noise, column bleed, and derivatized reagent peaks), were removed from the data matrix, de-redundified, and peak pooled. The metabolites were identified by searching databases, and the main databases were the HMDB (http://www.hmdb.ca/, accessed on 18 March 2025), Metlin (https://metlin.scripps.edu/, accessed on 18 March 2025), and the Majorbio Database.
The data were analyzed through the free online platform of the Majorbio cloud platform (cloud.majorbio.com, accessed on 18 March 2025). Metabolic features detected ≥80% of samples were retained. After filtering, minimum metabolite values were imputed for specific samples in which the metabolite levels fell below the lower limit of quantitation, and each metabolic feature was normalized by sum. To minimize the errors caused by sample preparation and instrument instability, the response intensity of the sample mass spectrum peaks was normalized by the sum normalization method, and then the normalized data matrix was obtained. Meanwhile, variables with relative standard deviation (RSD) >30% of QC samples were excluded. The normalized matrix was log10-transformed for subsequent analysis.
2.5. Statistical Analysis
The data of alpha diversity, the relative abundance of the phylum, and genus (>0.50%) of fecal bacteria communities were analyzed using the mixed model procedure of the SAS statistical package (SAS version 9.4, SAS Inst. Inc., Cary, NC, USA). The model was Yijkl = μ + Si + Rj + Ck + Tl + ϵijkl, where YijklYijkl = observed response for the i-th square, j-th row, k-th column, and l-th treatment; μ = overall mean; Si = effect of the i-th square (i = 1, 2); Rj = effect of the j-th row within the square (j = 1, 2, 3, 4); Ck = effect of the k-th column within the square (k = 1, 2, 3, 4); Tl = effect of the l-th treatment (metabolites energy levels; 7.01, 8.33, 9.66, and 10.98 MJ/kg DM); and ϵijkl = random error associated with the observation. Polynomial contrasts were used to determine whether the effects of dietary energy levels on the measured variables were linear or quadratic. Data were expressed as mean ± SEM. Pearson’s correlation analysis linked microbial taxa with metabolites using the Origin (version 2023) and GraphPad Prism (version 7, Boston, MA, USA). Statistical significance was set at p < 0.05.
3. Results
3.1. Overall Structure of Fecal Bacterial Communities
The 2,354,776 raw reads were generated from the 32 fecal samples, and 2,302,736 high-quality sequences remained after quality filtering and removal of chimeric sequences. The 6660 OTUs were obtained based on 97% nucleotide sequence identity analysis among reads.
The 2134 OTUs were shared among the four treatment groups in the 32 fecal samples, which take up 52.7%, 52.9%, 52.6%, and 59.4% of the total OTUs in LE, MLE, MHE, and HE groups, respectively (Figure 1). Additionally, the specific number of OTUs in the LE, MLE, MHE, and HE groups were 796, 657, 683, and 545, respectively. The Sobs, Shannon, Simpson, ACE, Chao, and coverage indices of fecal bacteria did not differ among the four groups (Table 1).
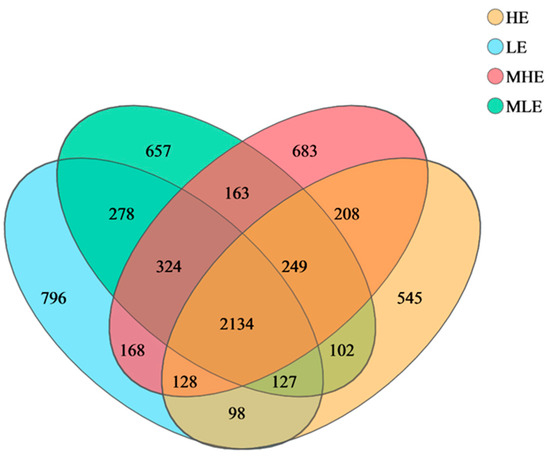
Figure 1.
Veen diagrams of OTUs in the feces of goats when consuming a lower-protein diet with varying energy levels. LE, low metabolizable energy (=7.01 MJ/kg DM) group; MLE, middle–low metabolizable energy (=8.33 MJ/kg DM) group; MHE, middle–high metabolizable energy (=9.66 MJ/kg DM) group; HE, high metabolizable energy (=10.98 MJ/kg DM) group. n = 8 samples per group.

Table 1.
The alpha diversity in the feces of goats when consuming a lower-protein diet with varying energy levels.
Energy is the effect of dietary metabolizable energy levels; Energy-L is the linear effect of dietary metabolizable energy levels; Energy-Q is the quadratic effect of dietary metabolizable energy levels.
3.2. Analysis of Composition and Difference of Microbiota
At the phylum level, 18 bacteria were identified in the 32 fecal samples. The dominant phylum was Firmicutes with 71.2%, 77.1%, 76.6%, and 75.0% in the LE, MLE, MHE, and HE groups, respectively, and then followed by Bacteroidetes with 23.6%, 16.5%, 17.8%, and 17.0% in the LE, MLE, MHE, and HE groups, respectively (Figure 2; Supplementary Table S1). The relative abundances of Firmicutes and Spirochaetote increased linearly, whereas the Bacteroidota and Patescibacteria decreased linearly with increasing dietary energy levels (p < 0.05). The relative abundances of Verrucomicrobiota increased quadratically, whereas others decreased quadratically with increasing dietary energy levels (p < 0.05).
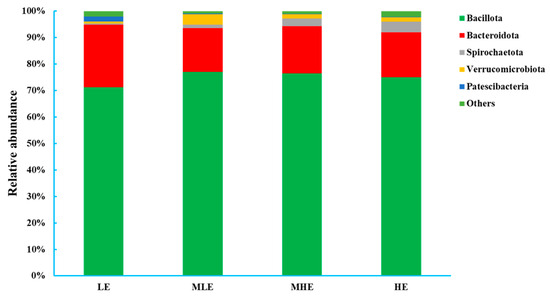
Figure 2.
Relative abundances of bacterial phyla (>0.50% of total reads) in the feces of goats when consuming a lower-protein diet with varying energy levels. LE, low metabolizable energy (=7.01 MJ/kg DM) group; MLE, middle–low metabolizable energy (=8.33 MJ/kg DM) group; MHE, middle–high metabolizable energy (=9.66 MJ/kg DM) group; HE, high metabolizable energy (=10.98 MJ/kg DM) group. n = 8 samples per group.
At the genus level, a total of 316 bacteria were identified in the 32 fecal samples. The dominant genus was Christensenellaceae_R-7_group with 9.28%, 11.34%, 13.2%, and 13.8% in the LE, MLE, MHE, and HE groups, respectively, and the second most abundant genus was unclassified_f__Lachnospiraceae with 8.68%, 11.5%, 12.9%, and 13.2% in the LE, MLE, MHE, and HE groups, respectively (Figure 3; Supplementary Table S2). The relative abundances of Christensenellaceae_R-7_group, unclassified_f__Lachnospiraceae, Ruminococcus, norank_o__Clostridia_UCG-014, Treponema, [Eubacterium]_siraeum_group, and [Eubacterium]_ruminantium_group increased linearly, whereas the relative abundance of Oscillospiraceae_UCG-005, norank_f__[Eubacterium]_coprostanoligenes_group, Prevotellaceae_UCG-004, unclassified_c__Clostridia, norank_f__Ruminococcaceae, unclassified_f__Oscillospiraceae, and others decreased linearly with an increasing dietary energy levels (p < 0.05).
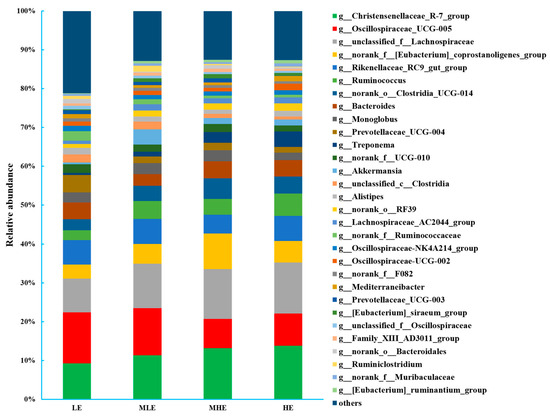
Figure 3.
Bacterial composition at the genus level (>0.50% total reads) in feces of goats when consuming a lower-protein diet with varying energy levels. LE, low metabolizable energy (=7.01 MJ/kg DM) group; MLE, middle–low metabolizable energy (=8.33 MJ/kg DM) group; MHE, middle–high metabolizable energy (=9.66 MJ/kg DM) group; HE, high metabolizable energy (=10.98 MJ/kg DM) group. n = 8 samples per group.
The LEfSe analysis was performed to identify microbial taxa that serve as biomarkers among the four groups (Figure 4A,B). The f_Oscillospiraceae, g_UCG-005, g_norank_f_Ruminococcaceae, o_Saccharimonadales, c_Saccarimonaadia, p_Patescibacteria, f_Saccarimonadaceae, g_Candidatus_Saccharimonas, f_Anaerovoracaceae, and g_norank_o_Bacteroidales remarkably enriched in the LE groups. The o_Oscillospirales, g_Intestinimonas, g_norank_f_Lachnospiraceae, g_norank_f_Peptococcaceae, f_Peptococcaceae, o_Petococcaceae, g_norank_o_Erysipelotrichales, f_norank_o_Erysipelotrichales, and g_Oscillospira remarkably enriched in the MLE group. The g_norank_f_[Eubacterium]_coprostanoli- genes_group, f_[Eubacterium]_coprostanoligenes_group, g_[Eubacterium]_siraeum_ group, and g_GWE2-31-10 remarkably enriched in the MHE group. The g_Ruminococcus, c-Spirochaetia, f_Spirochaetaceae, p_Spirochaetales, g_Treponema, p_Fibrobacterota, c-Fibrobacterota, g_Fibrobacter, and o_Fibrobacterales remarkably enriched in the HE group.
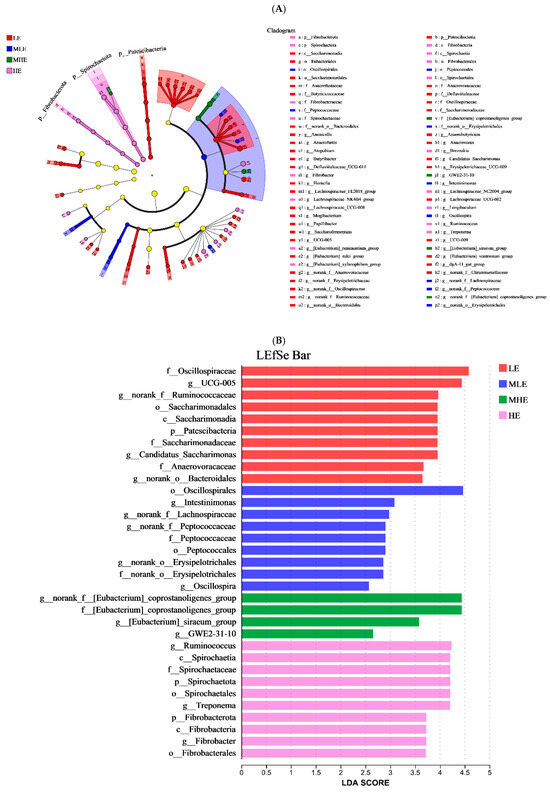
Figure 4.
Linear discriminant analysis effect size (LEfSe) analysis: (A) The cladogram diagram shows the microbial species with significant differences among the 4 groups. (B) Species with significant differences that have an LDA score greater than the estimated value; the default score is 2.0. The length of the histogram represents the LDA score; prefixes represent abbreviations for the taxonomic rank of each taxon, phylum (p_), class (c_), order (o_), family (f_), and genus (g_). LE, low metabolizable energy (=7.01 MJ/kg DM) group; MLE, middle–low metabolizable energy (=8.33 MJ/kg DM) group; MHE, middle–high metabolizable energy (=9.66 MJ/kg DM) group; HE, high metabolizable energy (=10.98 MJ/kg DM) group. n = 8 samples per group.
3.3. Analysis of Differential Metabolites
The principal component analysis (PCA) showed that LE, MLE, MHE, and HE groups could be distinguished, indicating that different treatments change the metabolite diversity of the feces of goats as a whole (Figure 5A). However, the partial least squares discriminant analysis (PLS-DA) model showed significant differences among the four groups (Figure 5B).
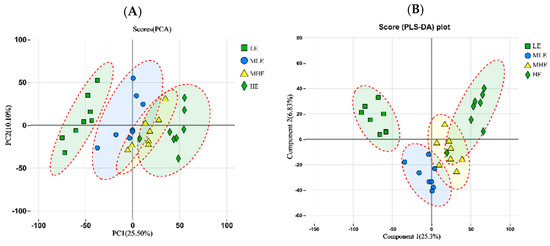
Figure 5.
The principle component analysis (PCA); (A) and partial least squares discrimination analysis (PLS-DA); (B) of metabolic composition on fecal samples in goats when consuming a lower-protein diet with varying energy levels. LE, low metabolizable energy (=7.01 MJ/kg DM) group; MLE, middle–low metabolizable energy (=8.33 MJ/kg DM) group; MHE, middle–high metabolizable energy (=9.66 MJ/kg DM) group; HE, high metabolizable energy (=10.98 MJ/kg DM) group. n = 8 samples per group.
The results of the volcano plot analysis showed that the fecal metabolites of the MLE, MHE, and HE groups compared to the LE group were quite different. The total number of differential metabolites between MLE and LE groups was 858, of which 732 were upregulated, and 126 were down-regulated (Figure 6A). The total number of differential metabolites between MHE and LE groups was 947, of which 654 were upregulated, and 293 were down-regulated (Figure 6B). The total number of differential metabolites between HE and LE groups was 1007, of which 774 were upregulated, and 303 were down-regulated (Figure 6C).
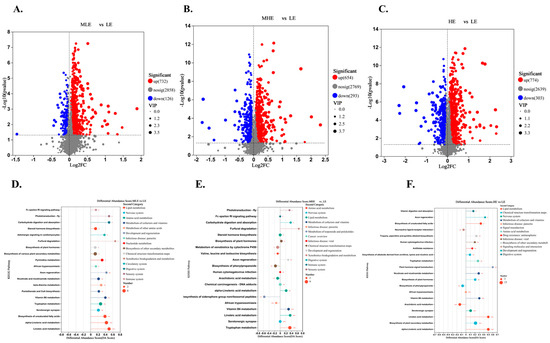
Figure 6.
Effect of fecal metabolites of goats when consuming a lower-protein diet with varying energy levels: (A,D) Results of differential metabolites and metabolic pathway analysis were presented in feces between LE and MLE groups. (B,E) Results of differential metabolites and metabolic pathway analysis were presented in feces between LE and MHE groups. (C,F) Results of differential metabolites and metabolic pathway analysis were presented in feces between LE and HE groups. The figure shows the relative content changes in differential metabolites in the form of bar charts. Upregulated metabolites are represented by red bars, and down-regulated metabolites are represented by blue bars. LE, low metabolizable energy (=7.01 MJ/kg DM) group; MLE, middle–low metabolizable energy (=8.33 MJ/kg DM) group; MHE, middle–high metabolizable energy (=9.66 MJ/kg DM) group; HE, high metabolizable energy (=10.98 MJ/kg DM) group. n = 8 samples per group.
The KEGG enrichment analysis was performed on differential metabolites for fecal samples of goats when consuming a lower-protein diet with varying energy levels. It was found that metabolites from LE and MLE fecal samples were significantly enriched in pathways related to steroid hormone biosynthesis, biosynthesis of various plant secondary metabolites, tryptophan metabolism, biosynthesis of unsaturated fatty acids, alpha-linolenic acid metabolism, linoleic acid metabolism (Figure 6D). The metabolites were significantly enriched in pathways related to tryptophan metabolism, vitamin B6 metabolism, linoleic acid metabolism, and steroid hormone biosynthesis between MHE and LE groups (Figure 6E). The metabolites were significantly enriched in pathways related to biosynthesis of plant secondary metabolites, alpha-linolenic acid metabolism, linoleic acid metabolism, and biosynthesis of unsaturated fatty acids between HE and LE groups (Figure 6F). In addition, the lipid metabolism, for example, the alpha-linolenic acid metabolism, linoleic acid metabolism, fatty acid biosynthesis, and biosynthesis of unsaturated fatty acids was greater in the MLE, MHE, and HE groups than in the LE group (Supplementary File S2). The amino acids, for example, the valine, leucine and isoleucine biosynthesis, lysine biosynthesis, arginine and proline metabolism, tyrosine metabolism, and tryptophan metabolism were greater, whereas the arginine biosynthesis, alanine, aspartate and glutamate metabolism, glycine, serine and threonine metabolism, histidine metabolism, and cysteine and methionine metabolism were lesser in MLE, MHE, and HE groups than in the LE group (Supplementary File S2).
3.4. Pearson Correlation Between Fecal Bacterial Communities (at Genus Level) and Metabolomics
To explore the functional correlation between the fecal bacterial community’s changes and metabolite perturbations, a Pearson correlation matrix was generated by calculating the Pearson correlation coefficient (Figure 7). More interestingly, the cellobiose was positively associated with Treponema, Ruminococcus, Christensenellaceae_R-7_group, unclassified_f_Lachnospiraceae, Lachnospiraceae_AC2044_group, norank_o_RF-039, [Eubacterium]_ruminantium_group, and norank_f__[Eubacterium]_ coprostanoligenes_group, whereas it was negatively associated with norank_o__ Bacteroidales, norank_f__Ruminococcaceae, Oscillospiraceae-NK4A214_group, unclassified_f__Oscillospiraceae, Prevotellaceae_UCG-004, others, Oscillospiraceae _UCG-005, unclassified_c__Clostridia. The Pro-Gln-His was positively associated with Christensenellaceae_R-7_group, unclassified_f__Lachnospiraceae, Akkermansia, Oscillospiraceae-UCG-002, Lachnospiraceae_AC2044_group, norank_o__RF39, [Eubacterium]_ruminantium_group, norank_f__[Eubacterium]_Coprostanoligenes _group, norank_o__Clostridia_UCG-014, [Eubacterium]_ siraeum_group, and negatively associated with Prevotellaceae_UCG-004, others, Oscillospiraceae_UCG-005, Family_XIII_AD3011_group.
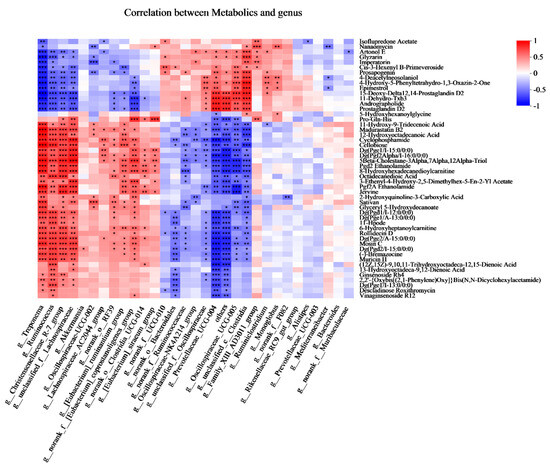
Figure 7.
Correlations analysis between the fecal bacteria (at genus) and fecal metabolites (Top 50) based on Pearson’s rank correlation analysis. * p < 0.05, ** p < 0.01, and *** p < 0.001 according to Pearson’s rank correlation coefficient.
4. Discussion
The present study utilized the Latin square design in animal nutrition, but it had a limited sample size. However, we recognize that the absence of formal power calculations or supporting physiological data may affect the generalizability of our findings, particularly given the inherent variability of microbiome and metabolomic datasets. Future work would benefit from integrating biochemical parameters (e.g., growth performance, plasma metabolites) and prospective power analyses to strengthen causal inferences.
Our results showed that the two most predominant phyla in the fecal samples of the goats were Bacteroidetes and Firmicutes, which is in agreement with previous studies in fecal samples of goats [15], cattle [16], dairy cows [17]. In the present study, the types of the dominant microbiota in fecal samples of the goats were similar, whereas the relative abundance of Firmicutes, Bacteroidota, Spirochaetota, Verrucomicrobiota, Patescibacteria, and others was different among the four groups. This indicates that the fecal microbial communities of goats were relatively stable, and dietary energy levels had no significant effect on the types, whereas they could significantly change the proportion of the dominant microbial community in the feces. The relative abundance of Firmicutes was greater than Bacteroidota, which could be explained by the fact that Firmicutes composed a greater amount of the microbial population in the feces and was followed by Bacteroidota [18]. Our results also reported that the relative abundance of Firmicutes increased and Bacteroidetes decreased in fecal samples of goats when consuming a lower-protein diet with an increasing energy level, which was in agreement with previous reports in the rumen samples of yaks [19] and goats [20]. The Spirochaetota mainly relies on the hydrolysis of complex polysaccharides in the plant cell wall. In the present study, our results showed that the relative abundance of Spirochaetota was increased with increasing dietary energy levels, which is in agreement with a previous study in fecal samples of dairy cows when consuming a diet with energy levels increased (7.03 vs. 7.70 MJ/kg) [21].
In the present study, the Christensenellaceae_R-7_group and unclassified_f__Lachnospiraceae were the top two genera. Previous studies reported that the predominant genera in fecal samples were Rikenellaceae_RC9_gut_group and Ruminococcaceae_UCG-005 in Boer goats [22], UCG-005 and Christensenellaceae_R-7_group in Qianbei goats, and the unclassified_f_Lachnospiraceae and Oscillospiraceae-UCG-005 in Leizhou goats [15]. This difference may be related to the differences in animal breeds and dietary composition among these studies. Chen et al. [23] reported that Lachnospiraceae could potentially serve as probiotics, which could enhance fermentation efficiency, promote host health, and correlate positively with ADG. In addition, numerous studies also reported that average daily gain could increase with increasing dietary energy levels in Boer goats [2], Yunnan semi-fine wool sheep [3], fattening Angus steers [23], and yaks [24]. Hence, this could explain why the relative abundance of unclassified_f__Lachnospiraceae was increased with the dietary energy levels. Akkermansia, a relevant mucin degrader from the vertebrate gut microbiota, is a member of the deeply branched Verrucomicrobiota, as well as the only known member of this phylum to be described as inhabitants of the gut [25]. The relative abundance of Akkermansia was generally decreased with inflammatory bowel disease in mouse models [26]. In this study, we found that the relative abundance of Akkermansia was lower in the LE group. A previous study reported that the abundance of Christensenellaceae_R-7_group, NK4A214_group, Ruminococcus, norank_f__Eubacterium_ coprostanoligenes_group, norank_f__norank_o__Clostridia_UCG-014, Lachnospiraceae_ NK3A20_group, Acetitomaculum, and Family_XIII_AD3011_group increased with increasing concentrate supplementation, while the relative abundance of Rikenellaceae_RC9_gut_ group decreased [27]. In the present study, the relative abundance of Christensenellaceae_R-7_group, Ruminococcus, norank_f__[Eubacterium]_coprostanoligenes _group, and norank_f__norank_o__Clostridia_ UCG-014 increased, whereas the abundance of Rikenellaceae_RC9_gut_ group decreased with increasing dietary energy levels, which partly in agreement with the results from Yi et al. [27]. A previous study reported that Ruminococcus possesses activities that break down cellulose and hemicellulose, resulting in the production of acetic acid, butyric acid, formate, and hydrogen [28]. In the present study, the relative abundance of Ruminococcus increased with increasing dietary energy levels, which is in agreement with a previous study reported that Ruminococcus played a regulatory role in maintaining the stability of the rumen endo-environment in yaks when the dietary energy levels increased [19]. The uncassified Clostridia and unclassified_f__Lachnospiraceae refer to microbiota that have not yet been classified or identified and have various health effects. The ecological or functional role of these genera needs to be clarified in further study.
Metabolomics data can provide a greater insight into the influence of diet on the body. In the present study, the lipid metabolism, for example, the alpha-linolenic acid metabolism, linoleic acid metabolism, fatty acid biosynthesis, and biosynthesis of unsaturated fatty acids was greater in the MLE, MHE, and HE groups than in the LE group. These could be explained by increasing dietary energy levels. Amino acids are essential nutrients for the body. The amino acid metabolism also changed among the four groups. Interestingly, we found that the valine, leucine, and isoleucine biosynthesis were greater with increasing dietary energy levels, which is in agreement with a previous study in yaks and cattle [19].
In the present study, we found that the Christensenellaceae_R-7_group was positively associated with the Pro-Gln-His. This could be explained by the abundance of Lachnospiraceae, which was positively correlated with the metabolism of amino acids [29,30]. A previous study reported that the Rikenellaceae_RC9_gut_group has played an important role in modulating meat amino acid; in particular, it was positively correlated with the amino acid content of histidine in Boer Crossbred goats [31]. Interestingly, in the present study, the results showed that there was no correlation between Rikenellaceae_RC9_gut_group and Pro-Gln-His. We inferred that this difference could be explained by the levels of dietary protein levels. Christensenellaceae was regarded as a fibrolytic bacteria, which produce α-arabinosidase, β-galactosidase, and β-glucosidase [32,33]. Ruminococcus is also regarded as a cellulolytic bacterium that can produce acetic acid, formic acid, ethanol, and lactic acid [19]. The members of Lachnospiraceae, for example, unclassified_f__Lachnospiraceae and Lachnospiraceae_AC2044_group, could degrade plant cellulose and hemicellulose. Cellobiose is a disaccharide of two glucose units linked by a β-1,4ʹ-glycosidic bond. In the present study, we found that the cellobiose was positively associated with Ruminococcus, Christensenellaceae_R-7_group, unclassified_f_Lachnospiraceae, Lachnospiraceae_AC2044_group. Furthermore, more information is needed to clarify the function of these genera.
5. Conclusions
The microbial composition and metabolites of feces were found to be altered in goats when consuming a lower-protein diet with varying energy levels. At the genus level, the relative abundances of Christensenellaceae_R-7_group, unclassified_f__Lachnosp-iraceae, Ruminococcus, norank_o__Clostridia_UCG-014, Treponema, [Eubacterium] _siraeum_group, and [Eubacterium]_ruminantium_group increased linearly, whereas the Oscillospiraceae_UCG-005, norank_f__[Eubacterium] _coprostanoligenes_group, Prevotellaceae_UCG-004, unclassified_c__Clostridia, norank_f__Ruminococcaceae, unclassified_f__Oscillospiraceae, and others decreased linearly with an increasing dietary energy levels. In addition, the amino acids, for example, valine, leucine, and isoleucine biosynthesis, and lipid metabolism, for example, the alpha-linolenic acid metabolism, linoleic acid metabolism, fatty acid biosynthesis, and biosynthesis of unsaturated fatty acids, was greater in the MLE, MHE, and HE groups than in the LE group. This study provides further information regarding the effects of fecal bacterial community composition and metabolites in goats when consuming a lower-protein diet with different energy levels. In the future, more information is needed on growth performance, serum index, welfare, and the relationship between the bacterial communities and metabolite needs in goats when consuming a lower-protein diet with different energy levels.
Supplementary Materials
The following supporting information can be downloaded at: https://www.mdpi.com/article/10.3390/microorganisms13040941/s1, Table S1: Dietary ingredients and chemical composition of the experiment; Table S2: Fecal bacterial relative abundances (at phylum level, >0.05% of total reads) in goats in response to lower protein dietary with different energy levels; Table S3: Fecal bacterial relative abundances (at genus level, >0.05% of total reads) in goats in response to lower protein dietary with different energy levels.
Author Contributions
H.L.: Conceptualization, Methodology, Investigation, Writing–original draft preparation, and Funding acquisition. A.C.: Investigation and Methodology. W.W.: Writing—review and editing. W.P.: Investigation and Methodology. K.M.: Investigation and Methodology. Y.Y.: Investigation. Q.W.: Investigation. K.W.: Investigation. M.Z.: Investigation. J.H.: Methodology, Project administration, and Resources. H.Z.: Project administration, Supervision, Investigation, Resources, and Funding acquisition. All authors have read and agreed to the published version of the manuscript.
Funding
The present work was jointly supported by the Hainan Provincial Natural Science Foundation of China (No. 324QN301), Central Public-interest Scientific Institution Basal Research Fund (No. 1630012025809), Special Research Project of Zhanjiang Experimental Station, Chinese Academy of Tropical Agricultural Sciences (No. ZJSYZ2024002).
Institutional Review Board Statement
Procedures involving experimental animals were performed following the guidelines of the Animal Ethics Committee of ZES, Chinese Academy of Tropical Agricultural Sciences (protocol no. ZES 202405001), approved on 2024-04-29.
Informed Consent Statement
Not applicable.
Data Availability Statement
The data used are confidential and will be made available upon request from the corresponding author.
Conflicts of Interest
The authors declare no conflicts of interest.
References
- China National Commission of Animal Genetic Resources. Animal Genetic Resources in China: Sheep and Goats; China Agriculture Press: Beijing, China, 2011. [Google Scholar]
- Brand, T.S.; Van Der Merwe, D.A.; Swart, E.; Hoffman, L.C. Comparing the effect of age and dietary energy content on feedlot performance of Boer goats. Small Rumin. Res. 2017, 157, 40–46. [Google Scholar] [CrossRef]
- Wang, X.; Zhou, J.; Lu, M.; Zhao, S.; Li, W.; Quan, G.; Xue, B. Effects of Dietary Energy Levels on Growth Performance, Nutrient Digestibility, Rumen Barrier and Microflora in Sheep. Animals 2024, 14, 2525. [Google Scholar] [CrossRef] [PubMed]
- Liu, H.; Yang, G.; Degen, A.; Ji, K.; Jiao, D.; Liang, Y.; Xiao, L.; Long, R.; Zhou, J. Effect of feed level and supplementary rumen protected lysine and methionine on growth performance, rumen fermentation, blood metabolites and nitrogen balance in growing Tan lambs fed low protein diets. Anim. Feed Sci. Technol. 2021, 279, 115024. [Google Scholar] [CrossRef]
- Wang, Y.; Wang, Q.; Dai, C.; Li, J.; Huang, P.; Li, Y.; Ding, X.; Huang, J.; Hussain, T.; Yang, H. Effects of dietary energy on growth performance, carcass characteristics, serum biochemical index, and meat quality of female Hu lambs. Anim. Nutr. 2020, 6, 499–506. [Google Scholar] [CrossRef]
- Zhu, W.; Xu, W.; Wei, C.; Zhang, Z.; Jiang, C.; Chen, X. Effects of decreasing dietary crude protein level on growth performance, nutrient digestion, serum metabolites, and nitrogen utilization in growing goat kids (Capra. hircus). Animals 2020, 10, 151. [Google Scholar] [CrossRef]
- Hwangbo, S.; Choi, S.; Kim, S.; Son, D.; Park, H.; Lee, S.; Jo, I. Effects of crude protein levels in total mixed rations on growth performance and meat quality in growing korean black goats. Asian Australas. Anim. Biosci. 2009, 22, 1133–1139. [Google Scholar] [CrossRef]
- Huang, S.; Ji, S.; Wang, F.; Huang, J.; Alugongo, G.M.; Li, S. Dynamic changes of the fecal bacterial community in dairy cows during early lactation. AMB Express 2020, 10, 167. [Google Scholar] [CrossRef]
- Wang, X.; Zhang, Z.; Li, B.; Hao, W.; Yin, W.; Ai, S.; Han, J.; Wang, R.; Duan, Z. Depicting fecal microbiota characteristic in yak, cattle, yak-cattle hybrid and tibetan sheep in different eco-regions of Qinghai-Tibetan Plateau. Microbiol. Spectr. 2022, 10, e0002122. [Google Scholar] [CrossRef]
- Liang, J.; Ali, S.; Lv, C.; Yang, H.; Zhao, X.; Ni, X.; Li, C.; Danzeng, B.; Wang, Y.; Quan, G. Dietary protein levels modulate the gut microbiome composition through fecal samples derived from lactating ewes. Front. Endocrinol. 2023, 14, 1194425. [Google Scholar] [CrossRef]
- Wei, X.; Wu, H.; Wang, Z.; Zhu, J.; Wang, W.; Wang, J.; Wang, Y.; Wang, C. Rumen-protected lysine supplementation improved amino acid balance, nitrogen utilization and altered hindgut microbiota of dairy cows. Anim. Nutr. 2023, 15, 320–331. [Google Scholar] [CrossRef]
- Jin, B.; Wang, R.; Hu, J.; Wang, Y.; Cheng, P.; Zhang, J.; Zhang, J.; Xue, G.; Zhu, Y.; Zhang, Y.; et al. Analysis of fecal microbiome and metabolome changes in goats with pregnant toxemia. BMC Vet. Res. 2024, 20, 2. [Google Scholar] [CrossRef] [PubMed]
- Ali, S.; Ni, X.; Khan, M.; Zhao, X.; Yang, H.; Danzeng, B.; Raja, I.H.; Quan, G. Effects of dietary protein levels on sheep gut metabolite profiles during the lactating stage. Animals 2024, 14, 121. [Google Scholar] [CrossRef]
- Ge, T.; Yang, C.; Li, B.; Huang, X.Y.; Zhao, L.Y.; Zhang, X.Q.; Tian, L.T.; Zhang, E.P. High-energy diet modify rumen microbial composition and microbial energy metabolism pattern in fattening sheep. BMC Vet. Res. 2023, 19, 32. [Google Scholar] [CrossRef]
- Liu, H.; Mao, K.; Peng, W.; Degen, A.; Zuo, G.; Yang, Y.; Han, J.; Wu, Q.; Wang, K.; Jiang, Q.; et al. Nano-Selenium Reduces Concentrations of Fecal Minerals by Altering Bacteria Composition in Feedlot Goats. Agriculture 2024, 14, 2233. [Google Scholar] [CrossRef]
- Conteville, L.C.; da Silva, J.V.; Andrade, B.G.; Cardoso, T.F.; Bruscadin, J.J.; de Oliveira, P.S.; Mourão, G.B.; Coutinho, L.L.; Palhares, J.C.; Berndt, A.; et al. Rumen and fecal microbiomes are related to diet and production traits in Bos indicus beef cattle. Front. Microbiol. 2023, 14, 1282851. [Google Scholar] [CrossRef]
- Mu, Y.; Lin, X.; Wang, Z.; Hou, Q.; Wang, Y.; Hu, Z. High-production dairy cattle exhibit different rumen and fecal bacterial community and rumen metabolite profile than low-production cattle. Microbiologyopen 2019, 8, e00673. [Google Scholar] [CrossRef] [PubMed]
- Guo, W.; Liu, T.; Wang, W.; Yu, Y.; Neves, A.L.A.; Zhou, M.; Chen, X. Survey of the fecal microbiota of indigenous small ruminants living in different areas of Guizhou. Front. Microbiol. 2024, 15, 1415230. [Google Scholar] [CrossRef]
- Liu, H.; Ran, T.; Zhang, C.F.; Yang, W.Z.; Wu, X.K.; Degen, A.; Long, R.J.; Shi, Z.J.; Zhou, J.W. Comparison of rumen bacterial communities between yaks (Bos grunniens) and Qaidam cattle (Bos taurus) fed a low protein diet with different energy levels. Front. Microbiol. 2022, 13, 982338. [Google Scholar] [CrossRef] [PubMed]
- Min, B.R.; Gurung, N.; Shange, R.; Solaiman, S. Potential role of rumen microbiota in altering average daily gain and feed efficiency in meat goats fed simple and mixed pastures using bacterial tag-encoded FLX amplicon pyrosequencing. J. Anim. Sci. 2019, 97, 3523–3534. [Google Scholar] [CrossRef]
- Liu, S.; Wei, Z.; Deng, M.; Xian, Z.; Liu, D.; Liu, G.; Li, Y.; Sun, B.; Guo, Y. Effect of a high-starch or a high-fat diet on the milk performance, apparent nutrient digestibility, hindgut fermentation parameters and microbiota of lactating cows. Animals 2023, 13, 2508. [Google Scholar] [CrossRef]
- Wang, Y.; Zhang, H.; Zhu, L.; Xu, Y.; Liu, N.; Sun, X.; Hu, L.; Huang, H.; Wei, K.; Zhu, R. Dynamic Distribution of Gut Microbiota in Goats at Different Ages and Health States. Front. Microbiol. 2018, 9, 2509. [Google Scholar] [CrossRef] [PubMed]
- Chen, K.; Shui, Y.; Deng, M.; Guo, Y.; Sun, B.; Liu, G.; Liu, D.; Li, Y. Effects of different dietary energy levels on growth performance, meat quality and nutritional composition, rumen fermentation parameters, and rumen microbiota of fattening Angus steers. Front. Microbiol. 2024, 15, 1378073. [Google Scholar] [CrossRef]
- Yang, C.; Zhang, J.; Ahmad, A.A.; Bao, P.; Guo, X.; Long, R.; Ding, X.; Yan, P. Dietary energy levels affect growth performance through growth hormone and insulin-like growth factor 1 in yak (Bos grunniens). Animals 2019, 9, 39. [Google Scholar] [CrossRef] [PubMed]
- González, D.; Morales-Olavarria, M.; Vidal-Veuthey, B.; Cárdenas, J.P. Insights into early evolutionary adaptations of the Akkermansia genus to the vertebrate gut. Front. Microbiol. 2023, 14, 1238580. [Google Scholar] [CrossRef]
- Rodrigues, V.F.; Elias-Oliveira, J.; Pereira, S.; Pereira, J.A.; Barbosa, S.C.; Machado, M.S.G.; Carlos, D. Akkermansia muciniphila and gut immune system: A good friendship that attenuates inflammatory bowel disease, obesity, and diabetes. Front. Immunol. 2022, 13, 934695. [Google Scholar] [CrossRef]
- Yi, S.; Wu, H.; Liu, Y.; Dai, D.; Meng, Q.; Chai, S.; Liu, S.; Zhou, Z. Concentrate supplementation improves cold-season environmental fitness of grazing yaks: Responsive changes in the rumen microbiota and metabolome. Front. Microbiol. 2023, 14, 1247251. [Google Scholar] [CrossRef] [PubMed]
- Biddle, A.; Stewart, L.; Blanchard, J.; Leschine, S. Untangling the genetic basis of fibrolytic specialization by Lachnospiraceae and Ruminococcaceae in diverse gut communities. Diversity 2013, 5, 627–640. [Google Scholar] [CrossRef]
- Zhang, L.; Wu, W.; Lee, Y.K.; Xie, J.; Zhang, H. Spatial heterogeneity and co-occurrence of mucosal and luminal microbiome across swine intestinal tract. Front. Microbiol. 2018, 9, 48. [Google Scholar] [CrossRef]
- Vahidi, M.F.; Gharechahi, J.; Behmanesh, M.; Ding, X.Z.; Han, J.L.; Salekdeh, G.H. Diversity of microbes colonizing forages of varying lignocellulose properties in the sheep rumen. PeerJ 2021, 9, e10463. [Google Scholar] [CrossRef]
- Wu, Z.L.; Yang, X.; Zhang, J.; Wang, W.; Liu, D.; Hou, B.; Bai, T.; Zhang, R.; Zhang, Y.; Liu, H.; et al. Effects of forage type on the rumen microbiota, growth performance, carcass traits, and meat quality in fattening goats. Front. Vet. Sci. 2023, 10, 1147685. [Google Scholar] [CrossRef]
- Perea, K.; Perz, K.; Olivo, S.K.; Williams, A.; Lachman, M.; Ishaq, S.L.; Thomson, J.; Yeoman, C.J. Feed efficiency phenotypes in lambs involve changes in ruminal, colonic, and small-intestine-located microbiota. J. Anim. Sci. 2017, 95, 2585–2592. [Google Scholar] [CrossRef] [PubMed][Green Version]
- Ma, T.; Deng, K.; Diao, Q. Prediction of methane emission from sheep based on data measured in vivo from open-circuit respiratory studies. Asian Australas. J. Anim. Sci. 2019, 32, 1389–1396. [Google Scholar] [CrossRef] [PubMed]
Disclaimer/Publisher’s Note: The statements, opinions and data contained in all publications are solely those of the individual author(s) and contributor(s) and not of MDPI and/or the editor(s). MDPI and/or the editor(s) disclaim responsibility for any injury to people or property resulting from any ideas, methods, instructions or products referred to in the content. |
© 2025 by the authors. Licensee MDPI, Basel, Switzerland. This article is an open access article distributed under the terms and conditions of the Creative Commons Attribution (CC BY) license (https://creativecommons.org/licenses/by/4.0/).