
Metabolic Reprogramming in Response to Freund’s Adjuvants: Insights from Serum Metabolomics

 , , , , , and
Abstract
1. Introduction
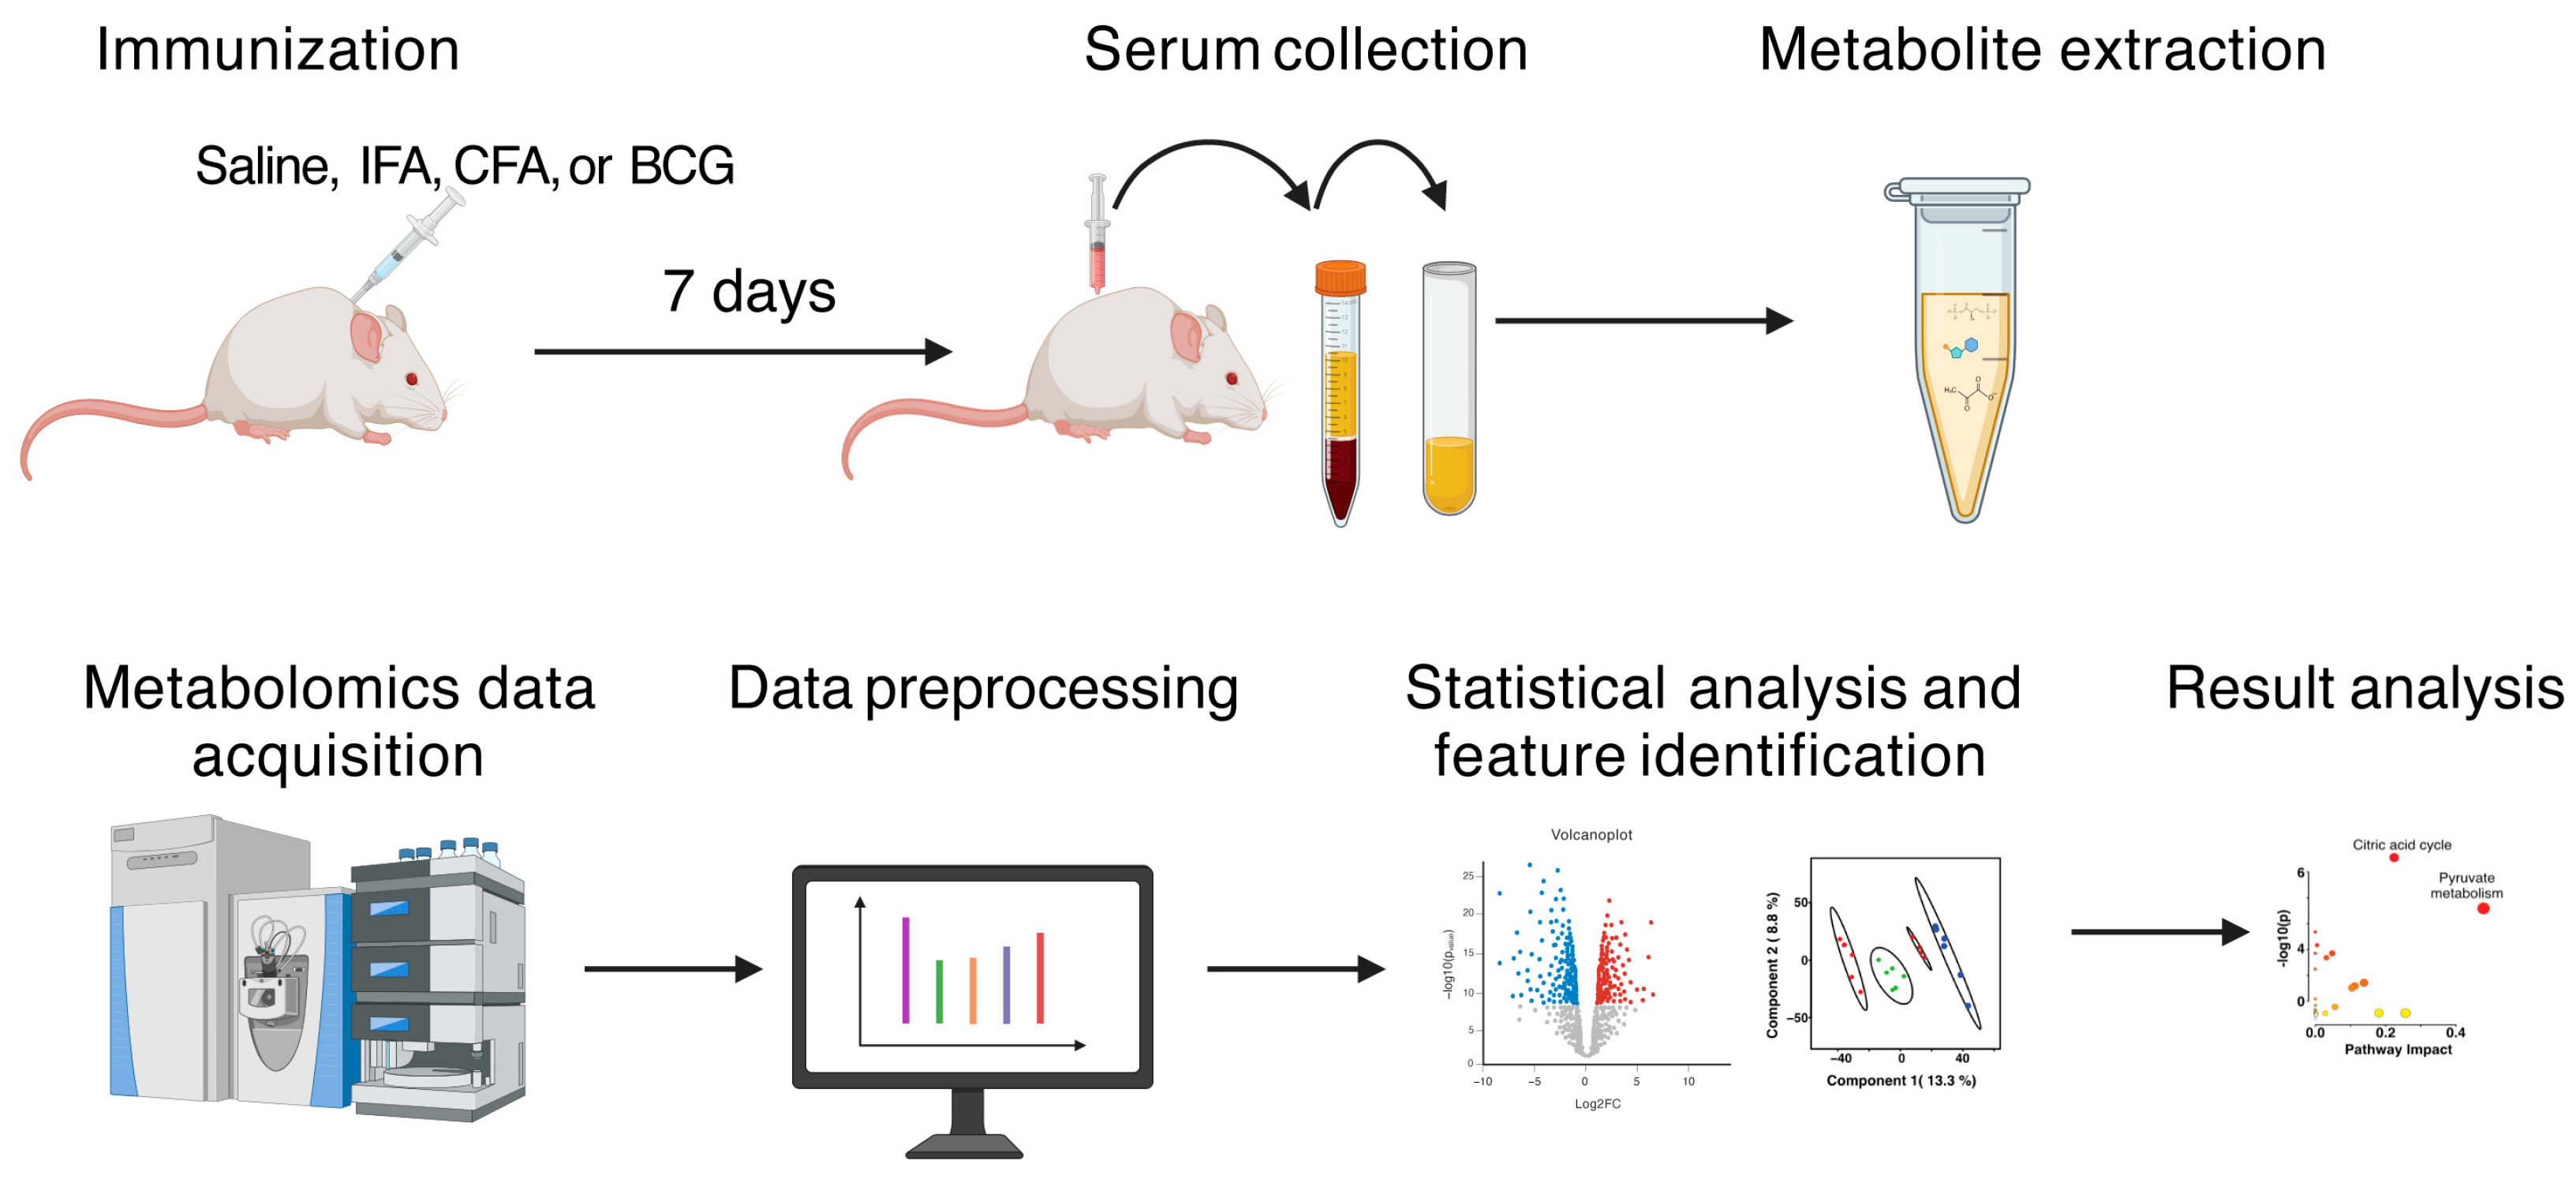
2. Materials and Methods
2.1. Mice
2.2. BCG Propagation and Enumeration
2.3. Immunization
2.4. Metabolite Extraction for Serum Sample
2.5. LC-MS Data Acquisition and Pre-Processing
2.6. Metabolomics Data Processing and Statistical Analysis
2.7. Metabolite Annotation
3. Results and Discussion
3.1. Serum Adjuvants Have Distinct Metabolic Phenotypes
3.2. BCG Reprograms Serum Metabolites Associated with Energy Metabolism
3.3. Minimal Metabolite Perturbation Between BCG and CFA
3.4. Multivariate Analysis of BCG and IFA Serum Metabolites
Supplementary Materials
Author Contributions
Funding
Institutional Review Board Statement
Informed Consent Statement
Data Availability Statement
Acknowledgments
Conflicts of Interest
Abbreviations
| AGC | Automatic gain control |
| APCs | Antigen-presenting cells |
| BCG | Bacillus Calmette–Guérin |
| CFA | Complete Freund’s adjuvant |
| CFU | Colony-forming units |
| CMI | Cell-mediated immune |
| HILIC | Hydrophilic interaction liquid chromatography |
| HPLC | High-performance liquid chromatography |
| IDO1 | Indoleamine 2,3-dioxygenase 1 |
| IFA | Incomplete Freund’s adjuvant |
| KEGG | Kyoto Encyclopedia of Genes and Genomes |
| LC-MS | Liquid chromatography coupled with high-resolution mass spectrometry |
| maxIT | Maximum injection time |
| M. tb | Mycobacterium tuberculosis |
| mTOR | Mammalian target of rapamycin |
| NK | Natural killer |
| NLRP3 | Nucleotide-binding domain, leucine-rich repeat, and pyrin domain-containing protein-3 |
| OADC | Oleic Acid-Albumin-Dextrose-Catalase |
| OD | Optical Density |
| PCA | Principal component analysis |
| PLS-DA | Partial least squares discriminant analysis |
| PPM | Parts per million |
| RT | Retention Time |
| TCA | Tricarboxylic acid |
| Th | T helper |
| TID | Type I diabetes |
| VIP | Variable importance in projection |
References
- Jensen, F.C.; Savary, J.R.; Diveley, J.P.; Chang, J.C. Adjuvant activity of incomplete Freund’s adjuvant. Adv. Drug Deliv. Rev. 1998, 32, 173–186. [Google Scholar] [CrossRef] [PubMed]
- Melssen, M.M.; Fisher, C.T.; Slingluff, C.L.; Melief, C.J.M. Peptide emulsions in incomplete Freund’s adjuvant create effective nurseries promoting egress of systemic CD4+ and CD8+ T cells for immunotherapy of cancer. J. Immunother. Cancer 2022, 10, e004709. [Google Scholar] [CrossRef] [PubMed]
- Wang, M.; Gong, Y.; Kang, W.; Liu, X.; Liang, X. The Role and Development of Peptide Vaccines in Cervical Cancer Treatment. Int. J. Pept. Res. Ther. 2024, 30, 40. [Google Scholar] [CrossRef]
- Billiau, A.; Matthys, P. Modes of action of Freund’s adjuvants in experimental models of autoimmune diseases. J. Leukoc. Biol. 2001, 70, 849–860. [Google Scholar] [CrossRef] [PubMed]
- Steiner, J.W.; Langer, B.; Schatz, D.L. The local and systemic effects of Freund’s adjuvant and its fractions. Arch. Pathol. 1960, 70, 424–434. [Google Scholar]
- Powers, J.G.; Nash, P.B.; Rhyan, J.C.; Yoder, C.A.; Miller, L.A. Comparison of immune and adverse effects induced by AdjuVac and Freund’s complete adjuvant in New Zealand white rabbits (Oryctolagus cuniculus). Lab Anim. 2007, 36, 51–58. [Google Scholar] [CrossRef] [PubMed]
- Lazarevic, M.; Stanisavljevic, S.; Nikolovski, N.; Dimitrijevic, M.; Miljkovic, D. Complete Freund’s adjuvant as a confounding factor in multiple sclerosis research. Front. Immunol. 2024, 15, 1353865. [Google Scholar] [CrossRef]
- Fontes, J.A.; Barin, J.G.; Talor, M.V.; Stickel, N.; Schaub, J.; Rose, N.R.; Cihakova, D. Complete Freund’s adjuvant induces experimental autoimmune myocarditis by enhancing IL-6 production during initiation of the immune response. Immun. Inflamm. Dis. 2017, 5, 163–176. [Google Scholar] [CrossRef] [PubMed]
- Broderson, J.R. A retrospective review of lesions associated with the use of Freund’s adjuvant. Lab. Anim. Sci. 1989, 39, 400–405. [Google Scholar] [PubMed]
- Ribechini, E.; Eckert, I.; Beilhack, A.; Du Plessis, N.; Walzl, G.; Schleicher, U.; Ritter, U.; Lutz, M.B. Heat-killed Mycobacterium tuberculosis prime-boost vaccination induces myeloid-derived suppressor cells with spleen dendritic cell-killing capability. JCI Insight 2019, 5, e128664. [Google Scholar] [CrossRef] [PubMed]
- Tigno-Aranjuez, J.T.; Jaini, R.; Tuohy, V.K.; Lehmann, P.V.; Tary-Lehmann, M. Encephalitogenicity of complete Freund’s adjuvant relative to CpG is linked to induction of Th17 cells. J. Immunol. 2009, 183, 5654–5661. [Google Scholar] [CrossRef]
- Sadelain, M.W.; Qin, H.Y.; Lauzon, J.; Singh, B. Prevention of type I diabetes in NOD mice by adjuvant immunotherapy. Diabetes 1990, 39, 583–589. [Google Scholar] [CrossRef]
- Shehadeh, N.; Etzioni, A.; Cahana, A.; Teninboum, G.; Gorodetsky, B.; Barzilai, D.; Karnieli, E. Repeated BCG vaccination is more effective than a single dose in preventing diabetes in non-obese diabetic (NOD) mice. Isr. J. Med. Sci. 1997, 33, 711–715. [Google Scholar] [PubMed]
- Gebregiworgis, T.; Powers, R. Application of NMR metabolomics to search for human disease biomarkers. Comb. Chem. High Throughput Screen. 2012, 15, 595–610. [Google Scholar] [CrossRef]
- Weiss, H.J.; Angiari, S. Metabolite Transporters as Regulators of Immunity. Metabolites 2020, 10, 418. [Google Scholar] [CrossRef] [PubMed]
- Fu, J.; Zhu, F.; Xu, C.J.; Li, Y. Metabolomics meets systems immunology. EMBO Rep. 2023, 24, e55747. [Google Scholar] [CrossRef] [PubMed]
- Sarkar, I.; Garg, R.; van Drunen Littel-van den Hurk, S. Selection of adjuvants for vaccines targeting specific pathogens. Expert. Rev. Vaccines 2019, 18, 505–521. [Google Scholar] [CrossRef]
- Petrova, T.V.; Koh, G.Y. Biological functions of lymphatic vessels. Science 2020, 369, eaax4063. [Google Scholar] [CrossRef] [PubMed]
- Oliver, G.; Kipnis, J.; Randolph, G.J.; Harvey, N.L. The Lymphatic Vasculature in the 21st Century: Novel Functional Roles in Homeostasis and Disease. Cell 2020, 182, 270–296. [Google Scholar] [CrossRef] [PubMed]
- Hu, Z.; Zhao, X.; Wu, Z.; Qu, B.; Yuan, M.; Xing, Y.; Song, Y.; Wang, Z. Lymphatic vessel: Origin, heterogeneity, biological functions, and therapeutic targets. Signal Transduct. Target. Ther. 2024, 9, 9. [Google Scholar] [CrossRef] [PubMed]
- Zhang, W.; Pan, X.; Xu, Y.; Guo, H.; Zheng, M.; Chen, X.; Wu, H.; Luan, F.; He, Q.; Ding, L.; et al. Mevalonate improves anti-PD-1/PD-L1 efficacy by stabilizing CD274 mRNA. Acta Pharm. Sin. B 2023, 13, 2585–2600. [Google Scholar] [CrossRef]
- Powell, J.D.; Pollizzi, K.N.; Heikamp, E.B.; Horton, M.R. Regulation of immune responses by mTOR. Annu. Rev. Immunol. 2012, 30, 39–68. [Google Scholar] [CrossRef] [PubMed]
- Powell, J.D.; Delgoffe, G.M. The mammalian target of rapamycin: Linking T cell differentiation, function, and metabolism. Immunity 2010, 33, 301–311. [Google Scholar] [CrossRef] [PubMed]
- Akula, M.K.; Shi, M.; Jiang, Z.; Foster, C.E.; Miao, D.; Li, A.S.; Zhang, X.; Gavin, R.M.; Forde, S.D.; Germain, G.; et al. Control of the innate immune response by the mevalonate pathway. Nat. Immunol. 2016, 17, 922–929. [Google Scholar] [CrossRef] [PubMed]
- Krupa, A.; Kowalska, I. The Kynurenine Pathway-New Linkage between Innate and Adaptive Immunity in Autoimmune Endocrinopathies. Int. J. Mol. Sci. 2021, 22, 9879. [Google Scholar] [CrossRef] [PubMed]
- Reddy, P.; Vincent, D.; Hemsworth, J.; Ezernieks, V.; Guthridge, K.; Spangenberg, G.C.; Rochfort, S.J. Effects of ergotamine on the central nervous system using untargeted metabolomics analysis in a mouse model. Sci. Rep. 2021, 11, 19542. [Google Scholar] [CrossRef]
- Pahalagedara, A.; Flint, S.; Palmer, J.; Subbaraj, A.; Brightwell, G.; Gupta, T.B. Antimicrobial Activity of Soil Clostridium Enriched Conditioned Media Against Bacillus mycoides, Bacillus cereus, and Pseudomonas aeruginosa. Front. Microbiol. 2020, 11, 608998. [Google Scholar] [CrossRef]
- Garcia, E.J.; McDowell, T.; Ketola, C.; Jennings, M.; Miller, J.D.; Renaud, J.B. Metabolomics reveals chemical changes in Acer saccharum sap over a maple syrup production season. PLoS ONE 2020, 15, e0235787. [Google Scholar] [CrossRef]
- Kessner, D.; Chambers, M.; Burke, R.; Agus, D.; Mallick, P. ProteoWizard: Open source software for rapid proteomics tools development. Bioinformatics 2008, 24, 2534–2536. [Google Scholar] [CrossRef] [PubMed]
- Schmid, R.; Heuckeroth, S.; Korf, A.; Smirnov, A.; Myers, O.; Dyrlund, T.S.; Bushuiev, R.; Murray, K.J.; Hoffmann, N.; Lu, M.; et al. Integrative analysis of multimodal mass spectrometry data in MZmine 3. Nat. Biotechnol. 2023, 41, 447–449. [Google Scholar] [CrossRef] [PubMed]
- Xia, J.; Psychogios, N.; Young, N.; Wishart, D.S. MetaboAnalyst: A web server for metabolomic data analysis and interpretation. Nucleic Acids Res. 2009, 37, W652–W660. [Google Scholar] [CrossRef]
- Pang, Z.; Lu, Y.; Zhou, G.; Hui, F.; Xu, L.; Viau, C.; Spigelman, A.F.; MacDonald, P.E.; Wishart, D.S.; Li, S.; et al. MetaboAnalyst 6.0: Towards a unified platform for metabolomics data processing, analysis and interpretation. Nucleic Acids Res. 2024, 52, W398–W406. [Google Scholar] [CrossRef] [PubMed]
- Hackstadt, A.J.; Hess, A.M. Filtering for increased power for microarray data analysis. BMC Bioinform. 2009, 10, 11. [Google Scholar] [CrossRef] [PubMed]
- Wieder, C.; Frainay, C.; Poupin, N.; Rodriguez-Mier, P.; Vinson, F.; Cooke, J.; Lai, R.P.; Bundy, J.G.; Jourdan, F.; Ebbels, T. Pathway analysis in metabolomics: Recommendations for the use of over-representation analysis. PLoS Comput. Biol. 2021, 17, e1009105. [Google Scholar] [CrossRef]
- Worley, B.; Halouska, S.; Powers, R. Utilities for quantifying separation in PCA/PLS-DA scores plots. Anal. Biochem. 2013, 433, 102–104. [Google Scholar] [CrossRef]
- Reisdorph, N.A.; Walmsley, S.; Reisdorph, R. A Perspective and Framework for Developing Sample Type Specific Databases for LC/MS-Based Clinical Metabolomics. Metabolites 2019, 10, 8. [Google Scholar] [CrossRef]
- Duhrkop, K.; Fleischauer, M.; Ludwig, M.; Aksenov, A.A.; Melnik, A.V.; Meusel, M.; Dorrestein, P.C.; Rousu, J.; Bocker, S. SIRIUS 4: A rapid tool for turning tandem mass spectra into metabolite structure information. Nat. Methods 2019, 16, 299–302. [Google Scholar] [CrossRef] [PubMed]
- Roberts, L.D.; Souza, A.L.; Gerszten, R.E.; Clish, C.B. Targeted metabolomics. Curr. Protoc. Mol. Biol. 2012, 98, 30.2.1–30.2.24. [Google Scholar] [CrossRef] [PubMed]
- Ai, Z.; Zhang, Y.; Li, X.; Sun, W.; Liu, Y. Widely Targeted Metabolomics Analysis to Reveal Transformation Mechanism of Cistanche Deserticola Active Compounds During Steaming and Drying Processes. Front. Nutr. 2021, 8, 742511. [Google Scholar] [CrossRef]
- Riteau, N.; Radtke, A.J.; Shenderov, K.; Mittereder, L.; Oland, S.D.; Hieny, S.; Jankovic, D.; Sher, A. Water-in-Oil-Only Adjuvants Selectively Promote T Follicular Helper Cell Polarization through a Type I IFN and IL-6-Dependent Pathway. J. Immunol. 2016, 197, 3884–3893. [Google Scholar] [CrossRef]
- Huang, Z.; Gong, H.; Sun, Q.; Yang, J.; Yan, X.; Xu, F. Research progress on emulsion vaccine adjuvants. Heliyon 2024, 10, e24662. [Google Scholar] [CrossRef] [PubMed]
- Olafsdottir, T.A.; Lindqvist, M.; Nookaew, I.; Andersen, P.; Maertzdorf, J.; Persson, J.; Christensen, D.; Zhang, Y.; Anderson, J.; Khoomrung, S.; et al. Comparative Systems Analyses Reveal Molecular Signatures of Clinically tested Vaccine Adjuvants. Sci. Rep. 2016, 6, 39097. [Google Scholar] [CrossRef] [PubMed]
- Melssen, M.M.; Pollack, K.E.; Meneveau, M.O.; Smolkin, M.E.; Pinczewski, J.; Koeppel, A.F.; Turner, S.D.; Sol-Church, K.; Hickman, A.; Deacon, D.H.; et al. Characterization and comparison of innate and adaptive immune responses at vaccine sites in melanoma vaccine clinical trials. Cancer Immunol. Immunother. 2021, 70, 2151–2164. [Google Scholar] [CrossRef]
- Dube, J.Y.; McIntosh, F.; Zarruk, J.G.; David, S.; Nigou, J.; Behr, M.A. Synthetic mycobacterial molecular patterns partially complete Freund’s adjuvant. Sci. Rep. 2020, 10, 5874. [Google Scholar] [CrossRef]
- Avau, A.; Mitera, T.; Put, S.; Put, K.; Brisse, E.; Filtjens, J.; Uyttenhove, C.; Van Snick, J.; Liston, A.; Leclercq, G.; et al. Systemic juvenile idiopathic arthritis-like syndrome in mice following stimulation of the immune system with Freund’s complete adjuvant: Regulation by interferon-gamma. Arthritis Rheumatol. 2014, 66, 1340–1351. [Google Scholar] [CrossRef] [PubMed]
- Pearce, E.L.; Pearce, E.J. Metabolic pathways in immune cell activation and quiescence. Immunity 2013, 38, 633–643. [Google Scholar] [CrossRef] [PubMed]
- Michael, D.B.; Ryan, T.S.; Susan, M.K.; Erika, L.P. Metabolic Instruction of Immunity. Cell 2017, 169, 570–586. [Google Scholar] [CrossRef]
- Lawrence, A. Bacillus Calmette-Guerin (BCG) Revaccination and Protection Against Tuberculosis: A Systematic Review. Cureus 2024, 16, e56643. [Google Scholar] [CrossRef] [PubMed]
- Arts, R.J.W.; Carvalho, A.; La Rocca, C.; Palma, C.; Rodrigues, F.; Silvestre, R.; Kleinnijenhuis, J.; Lachmandas, E.; Goncalves, L.G.; Belinha, A.; et al. Immunometabolic Pathways in BCG-Induced Trained Immunity. Cell Rep. 2016, 17, 2562–2571. [Google Scholar] [CrossRef] [PubMed]
- Xu, J.C.; Chen, Z.Y.; Huang, X.J.; Wu, J.; Huang, H.; Niu, L.F.; Wang, H.L.; Li, J.H.; Lowrie, D.B.; Hu, Z.; et al. Multi-omics analysis reveals that linoleic acid metabolism is associated with variations of trained immunity induced by distinct BCG strains. Sci. Adv. 2024, 10, eadk8093. [Google Scholar] [CrossRef]
- Abdallah, A.M.; Hill-Cawthorne, G.A.; Otto, T.D.; Coll, F.; Guerra-Assuncao, J.A.; Gao, G.; Naeem, R.; Ansari, H.; Malas, T.B.; Adroub, S.A.; et al. Genomic expression catalogue of a global collection of BCG vaccine strains show evidence for highly diverged metabolic and cell-wall adaptations. Sci. Rep. 2015, 5, 15443. [Google Scholar] [CrossRef] [PubMed]
- Angelidou, A.; Diray-Arce, J.; Conti, M.G.; Smolen, K.K.; van Haren, S.D.; Dowling, D.J.; Husson, R.N.; Levy, O. BCG as a Case Study for Precision Vaccine Development: Lessons From Vaccine Heterogeneity, Trained Immunity, and Immune Ontogeny. Front. Microbiol. 2020, 11, 332. [Google Scholar] [CrossRef] [PubMed]
- Skupnevskiy, S.V.; Trukhina, G.M.; Pukhaeva, E.G.; Badtiev, A.K.; Rurua, F.K.; Batagova, F.E.; Farnieva, Z.G. Therapeutic Effects of Citric and Succinic Acids in Rats Exposed to Inactivated M. tuberculosis. Public Health Life Environ.–PHLE 2021, 29, 69–75. [Google Scholar] [CrossRef]
- Liu, H.; Zhang, H.; Zhang, X.; Chen, Q.; Xia, L. Role of succinic acid in the regulation of sepsis. Int. Immunopharmacol. 2022, 110, 109065. [Google Scholar] [CrossRef] [PubMed]
- Tannahill, G.M.; Curtis, A.M.; Adamik, J.; Palsson-McDermott, E.M.; McGettrick, A.F.; Goel, G.; Frezza, C.; Bernard, N.J.; Kelly, B.; Foley, N.H.; et al. Succinate is an inflammatory signal that induces IL-1beta through HIF-1alpha. Nature 2013, 496, 238–242. [Google Scholar] [CrossRef]
- Martinez, Y.; Li, X.; Liu, G.; Bin, P.; Yan, W.; Mas, D.; Valdivie, M.; Hu, C.A.; Ren, W.; Yin, Y. The role of methionine on metabolism, oxidative stress, and diseases. Amino Acids 2017, 49, 2091–2098. [Google Scholar] [CrossRef]
- Du, K.; Grocott, L.; Anichini, G.; O’Neill, K.; Syed, N. Amino Acid Deprivation in Glioblastoma: The Role in Survival and the Tumour Microenvironment-A Narrative Review. Biomedicines 2024, 12, 2481. [Google Scholar] [CrossRef]
- Agbas, A.; Moskovitz, J. The Role of Methionine Oxidation/Reduction in the Regulation of Immune Response. Curr. Signal Transduct. Ther. 2009, 4, 46–50. [Google Scholar] [CrossRef] [PubMed]
- Winter, A.N.; Brenner, M.C.; Punessen, N.; Snodgrass, M.; Byars, C.; Arora, Y.; Linseman, D.A. Comparison of the Neuroprotective and Anti-Inflammatory Effects of the Anthocyanin Metabolites, Protocatechuic Acid and 4-Hydroxybenzoic Acid. Oxid. Med. Cell. Longev. 2017, 2017, 6297080. [Google Scholar] [CrossRef] [PubMed]
- Kou, Y.; Jing, Q.; Yan, X.; Chen, J.; Shen, Y.; Ma, Y.; Xiang, Y.; Li, X.; Liu, X.; Liu, Z.; et al. 4-Hydroxybenzoic acid restrains Nlrp3 inflammasome priming and activation via disrupting PU.1 DNA binding activity and direct antioxidation. Chem. Biol. Interact. 2024, 404, 111262. [Google Scholar] [CrossRef] [PubMed]
- Wang, Q.; Liu, D.; Song, P.; Zou, M.H. Tryptophan-kynurenine pathway is dysregulated in inflammation, and immune activation. Front. Biosci. 2015, 20, 1116–1143. [Google Scholar] [CrossRef]
- Tsuji, A.; Ikeda, Y.; Yoshikawa, S.; Taniguchi, K.; Sawamura, H.; Morikawa, S.; Nakashima, M.; Asai, T.; Matsuda, S. The Tryptophan and Kynurenine Pathway Involved in the Development of Immune-Related Diseases. Int. J. Mol. Sci. 2023, 24, 5742. [Google Scholar] [CrossRef]
- Puccetti, P.; Fallarino, F. T cell fat catabolism: A novel target for kynurenine? EBioMedicine 2022, 75, 103779. [Google Scholar] [CrossRef]
- Wu, G.; Fang, Y.Z.; Yang, S.; Lupton, J.R.; Turner, N.D. Glutathione metabolism and its implications for health. J. Nutr. 2004, 134, 489–492. [Google Scholar] [CrossRef] [PubMed]
- Peterson, J.D.; Herzenberg, L.A.; Vasquez, K.; Waltenbaugh, C. Glutathione levels in antigen-presenting cells modulate Th1 versus Th2 response patterns. Proc. Natl. Acad. Sci. USA 1998, 95, 3071–3076. [Google Scholar] [CrossRef]
- Millman, A.C.; Salman, M.; Dayaram, Y.K.; Connell, N.D.; Venketaraman, V. Natural killer cells, glutathione, cytokines, and innate immunity against Mycobacterium tuberculosis. J. Interferon Cytokine Res. 2008, 28, 153–165. [Google Scholar] [CrossRef]
- Ghezzi, P. Role of glutathione in immunity and inflammation in the lung. Int. J. Gen. Med. 2011, 4, 105–113. [Google Scholar] [CrossRef] [PubMed]
- Droge, W.; Breitkreutz, R. Glutathione and immune function. Proc. Nutr. Soc. 2000, 59, 595–600. [Google Scholar] [CrossRef] [PubMed]
- Cao, R.; Kolloli, A.; Kumar, R.; Owens, J.; Sasaninia, K.; Vaughn, C.; Singh, M.; Truong, E.; Kachour, N.; Beever, A.; et al. Effects of Glutathione Diminishment on the Immune Responses against Mycobacterium tuberculosis Infection. Appl. Sci. 2021, 11, 8274. [Google Scholar] [CrossRef] [PubMed]
- Abnousian, A.; Vasquez, J.; Sasaninia, K.; Kelley, M.; Venketaraman, V. Glutathione Modulates Efficacious Changes in the Immune Response against Tuberculosis. Biomedicines 2023, 11, 1340. [Google Scholar] [CrossRef]
- Feher, J.J. 13.2.11-ATP Production III: Fatty Acid Oxidation and Amino Acid Oxidation. In Quantitative Human Physiology, 2nd ed.; Academic Press: Cambridge, MA, USA, 2016; pp. 241–252. [Google Scholar] [CrossRef]
- Rajas, F.; Gautier-Stein, A.; Mithieux, G. Glucose-6 Phosphate, A Central Hub for Liver Carbohydrate Metabolism. Metabolites 2019, 9, 282. [Google Scholar] [CrossRef] [PubMed]
- Watanabe, R.; Shirai, T.; Namkoong, H.; Zhang, H.; Berry, G.J.; Wallis, B.B.; Schaefgen, B.; Harrison, D.G.; Tremmel, J.A.; Giacomini, J.C.; et al. Pyruvate controls the checkpoint inhibitor PD-L1 and suppresses T cell immunity. J. Clin. Investig. 2017, 127, 2725–2738. [Google Scholar] [CrossRef] [PubMed]
- Martinez-Reyes, I.; Chandel, N.S. Mitochondrial TCA cycle metabolites control physiology and disease. Nat. Commun. 2020, 11, 102. [Google Scholar] [CrossRef]
- Treede, I.; Braun, A.; Sparla, R.; Kuhnel, M.; Giese, T.; Turner, J.R.; Anes, E.; Kulaksiz, H.; Fullekrug, J.; Stremmel, W.; et al. Anti-inflammatory effects of phosphatidylcholine. J. Biol. Chem. 2007, 282, 27155–27164. [Google Scholar] [CrossRef]
- Riesberg, L.A.; McDonald, T.L.; Wang, Y.; Chen, X.M.; Holzmer, S.W.; Tracy, S.M.; Drescher, K.M. Creatinine downregulates TNF-alpha in macrophage and T cell lines. Cytokine 2018, 110, 29–38. [Google Scholar] [CrossRef] [PubMed]
- Leland, K.M.; McDonald, T.L.; Drescher, K.M. Effect of creatine, creatinine, and creatine ethyl ester on TLR expression in macrophages. Int. Immunopharmacol. 2011, 11, 1341–1347. [Google Scholar] [CrossRef]
- Riesberg, L.A. The Novel Function of Creatinine Acting as an Anti-Inflammatory Immunomodulator and Antioxidant. Ph.D. Dissertation, Creighton University, Omaha, CA, USA, 2017. [Google Scholar]
- Thangasamy, T.; Subathra, M.; Sittadjody, S.; Jeyakumar, P.; Joyee, A.G.; Mendoza, E.; Chinnakkanu, P. Role of L-carnitine in the modulation of immune response in aged rats. Clin. Chim. Acta 2008, 389, 19–24. [Google Scholar] [CrossRef] [PubMed]
- Tastekin, N.; Aydogdu, N.; Dokmeci, D.; Usta, U.; Birtane, M.; Erbas, H.; Ture, M. Protective effects of L-carnitine and alpha-lipoic acid in rats with adjuvant arthritis. Pharmacol. Res. 2007, 56, 303–310. [Google Scholar] [CrossRef] [PubMed]
- Jirillo, E.; Altamura, M.; Marcuccio, C.; Tortorella, C.; De Simone, C.; Antonaci, S. Immunological responses in patients with tuberculosis and in vivo effects of acetyl-L-carnitine oral administration. Mediat. Inflamm. 1993, 2, S17–S20. [Google Scholar] [CrossRef]
- Haghighatdoost, F.; Jabbari, M.; Hariri, M. The effect of L-carnitine on inflammatory mediators: A systematic review and meta-analysis of randomized clinical trials. Eur. J. Clin. Pharmacol. 2019, 75, 1037–1046. [Google Scholar] [CrossRef]
- Famularo, G.; De Simone, C.; Trinchieri, V.; Mosca, L. Carnitines and its congeners: A metabolic pathway to the regulation of immune response and inflammation. Ann. N. Y. Acad. Sci. 2004, 1033, 132–138. [Google Scholar] [CrossRef] [PubMed]
- Bottcher, M.; Renner, K.; Berger, R.; Mentz, K.; Thomas, S.; Cardenas-Conejo, Z.E.; Dettmer, K.; Oefner, P.J.; Mackensen, A.; Kreutz, M.; et al. D-2-hydroxyglutarate interferes with HIF-1alpha stability skewing T-cell metabolism towards oxidative phosphorylation and impairing Th17 polarization. Oncoimmunology 2018, 7, e1445454. [Google Scholar] [CrossRef]
- Zhang, L.; Sorensen, M.D.; Kristensen, B.W.; Reifenberger, G.; McIntyre, T.M.; Lin, F. D-2-Hydroxyglutarate Is an Intercellular Mediator in IDH-Mutant Gliomas Inhibiting Complement and T Cells. Clin. Cancer Res. 2018, 24, 5381–5391. [Google Scholar] [CrossRef] [PubMed]
- Williams, N.C.; Ryan, D.G.; Costa, A.S.H.; Mills, E.L.; Jedrychowski, M.P.; Cloonan, S.M.; Frezza, C.; O’Neill, L.A. Signaling metabolite L-2-hydroxyglutarate activates the transcription factor HIF-1alpha in lipopolysaccharide-activated macrophages. J. Biol. Chem. 2022, 298, 101501. [Google Scholar] [CrossRef] [PubMed]
- Ugele, I.; Cardenas-Conejo, Z.E.; Hammon, K.; Wehrstein, M.; Bruss, C.; Peter, K.; Singer, K.; Gottfried, E.; Boesch, J.; Oefner, P.; et al. D-2-Hydroxyglutarate and L-2-Hydroxyglutarate Inhibit IL-12 Secretion by Human Monocyte-Derived Dendritic Cells. Int. J. Mol. Sci. 2019, 20, 742. [Google Scholar] [CrossRef] [PubMed]
- Foskolou, I.P.; Bunse, L.; Van den Bossche, J. 2-hydroxyglutarate rides the cancer-immunity cycle. Curr. Opin. Biotechnol. 2023, 83, 102976. [Google Scholar] [CrossRef]
- de Goede, K.E.; Harber, K.J.; Gorki, F.S.; Verberk, S.G.S.; Groh, L.A.; Keuning, E.D.; Struys, E.A.; van Weeghel, M.; Haschemi, A.; de Winther, M.P.J.; et al. d-2-Hydroxyglutarate is an anti-inflammatory immunometabolite that accumulates in macrophages after TLR4 activation. Biochim. Biophys. Acta Mol. Basis Dis. 2022, 1868, 166427. [Google Scholar] [CrossRef] [PubMed]
- Afsari, F.; McIntyre, T.M. D-2-Hydroxyglutarate Inhibits Calcineurin Phosphatase Activity to Abolish NF-AT Activation and IL-2 Induction in Stimulated Lymphocytes. J. Immunol. 2023, 210, 504–514. [Google Scholar] [CrossRef]
- Cai, M.; Zhao, J.; Ding, Q.; Wei, J. Oncometabolite 2-hydroxyglutarate regulates anti-tumor immunity. Heliyon 2024, 10, e24454. [Google Scholar] [CrossRef] [PubMed]
- Tyrakis, P.A.; Palazon, A.; Macias, D.; Lee, K.L.; Phan, A.T.; Velica, P.; You, J.; Chia, G.S.; Sim, J.; Doedens, A.; et al. S-2-hydroxyglutarate regulates CD8+ T-lymphocyte fate. Nature 2016, 540, 236–241. [Google Scholar] [CrossRef] [PubMed]
- Du, X.; Hu, H. The Roles of 2-Hydroxyglutarate. Front. Cell Dev. Biol. 2021, 9, 651317. [Google Scholar] [CrossRef]
- Liu, J.; Chen, C.; Wang, Y.; Qian, C.; Wei, J.; Xing, Y.; Bai, J. Comprehensive of N1-Methyladenosine Modifications Patterns and Immunological Characteristics in Ovarian Cancer. Front. Immunol. 2021, 12, 746647. [Google Scholar] [CrossRef]
- Xiong, W.; Zhao, Y.; Wei, Z.; Li, C.; Zhao, R.; Ge, J.; Shi, B. N1-methyladenosine formation, gene regulation, biological functions, and clinical relevance. Mol. Ther. 2022, 31, 308–330. [Google Scholar] [CrossRef]
- Sartori, T.; Galvao Dos Santos, G.; Nogueira-Pedro, A.; Makiyama, E.; Rogero, M.M.; Borelli, P.; Fock, R.A. Effects of glutamine, taurine and their association on inflammatory pathway markers in macrophages. Inflammopharmacology 2018, 26, 829–838. [Google Scholar] [CrossRef]
- Ping, Y.; Shan, J.; Liu, Y.; Liu, F.; Wang, L.; Liu, Z.; Li, J.; Yue, D.; Wang, L.; Chen, X.; et al. Taurine enhances the antitumor efficacy of PD-1 antibody by boosting CD8+ T cell function. Cancer Immunol. Immunother. 2023, 72, 1015–1027. [Google Scholar] [CrossRef] [PubMed]
- Nam, S.Y.; Kim, H.M.; Jeong, H.J. The potential protective role of taurine against experimental allergic inflammation. Life Sci. 2017, 184, 18–24. [Google Scholar] [CrossRef]
- Marcinkiewicz, J.; Kontny, E. Taurine and inflammatory diseases. Amino Acids 2014, 46, 7–20. [Google Scholar] [CrossRef]
- Ma, Y.; Zhang, Y.; Li, R.; Deng, S.; Qin, Q.; Ran, C.; Hao, Y.; Zhang, J.; Zhu, L. Mechanism of taurine reducing inflammation and organ injury in sepsis mice. Cell. Immunol. 2022, 375, 104503. [Google Scholar] [CrossRef] [PubMed]
- Ma, S.; Chen, H.; Li, H.; Ji, X.; Deng, Z.; Ding, W.; Zhang, Q. Post-Translational Formation of Aminomalonate by a Promiscuous Peptide-Modifying Radical SAM Enzyme. Angew. Chem. Int. Ed. Engl. 2021, 60, 19957–19964. [Google Scholar] [CrossRef] [PubMed]
- Wang, F.; Xu, L.; Qi, M.; Lai, H.; Zeng, F.; Liang, F.; Wen, Q.; Ma, X.; Zhang, C.; Xie, K. Metabolomic analysis-identified 2-hydroxybutyric acid might be a key metabolite of severe preeclampsia. Open Life Sci. 2023, 18, 20220572. [Google Scholar] [CrossRef] [PubMed]
- Revilla-Nuin, B.; Rodriguez-Aparicio, L.B.; Ferrero, M.A.; Reglero, A. Regulation of capsular polysialic acid biosynthesis by N-acetyl-D-mannosamine, an intermediate of sialic acid metabolism. FEBS Lett. 1998, 426, 191–195. [Google Scholar] [CrossRef] [PubMed]
- Daneshmandi, S.; Cassel, T.; Higashi, R.M.; Fan, T.W.; Seth, P. 6-Phosphogluconate dehydrogenase (6PGD), a key checkpoint in reprogramming of regulatory T cells metabolism and function. Elife 2021, 10, e67476. [Google Scholar] [CrossRef]
- Ananieva, E.A.; Powell, J.D.; Hutson, S.M. Leucine Metabolism in T Cell Activation: mTOR Signaling and Beyond. Adv. Nutr. 2016, 7, 798S–805S. [Google Scholar] [CrossRef] [PubMed]
- Wu, J.; Sun, L.; Chen, X.; Du, F.; Shi, H.; Chen, C.; Chen, Z.J. Cyclic GMP-AMP is an endogenous second messenger in innate immune signaling by cytosolic DNA. Science 2013, 339, 826–830. [Google Scholar] [CrossRef] [PubMed]
- Teh, H.S.; Paetkau, V. Regulation of immune responses. I. Effects of cyclic AMP and cyclic GMP on immune induction. Cell. Immunol. 1976, 24, 209–219. [Google Scholar] [CrossRef] [PubMed]
- Nguyen, T.H.; Axell, A.; Turek, I.; Wright, B.; Meehan-Andrews, T.; Irving, H.R. Modulation of Inflammatory Cytokine Production in Human Monocytes by cGMP and IRAK3. Int. J. Mol. Sci. 2022, 23, 2552. [Google Scholar] [CrossRef]
- Kanoh, H.; Iwashita, S.; Kuraishi, T.; Goto, A.; Fuse, N.; Ueno, H.; Nimura, M.; Oyama, T.; Tang, C.; Watanabe, R.; et al. cGMP signaling pathway that modulates NF-kappaB activation in innate immune responses. iScience 2021, 24, 103473. [Google Scholar] [CrossRef] [PubMed]
- Friebe, A.; Sandner, P.; Schmidtko, A. cGMP: A unique 2nd messenger molecule-recent developments in cGMP research and development. Naunyn Schmiedebergs Arch. Pharmacol. 2020, 393, 287–302. [Google Scholar] [CrossRef] [PubMed]
- Long, C.L.; Dillard, D.R.; Bodzin, J.H.; Geiger, J.W.; Blakemore, W.S. Validity of 3-methylhistidine excretion as an indicator of skeletal muscle protein breakdown in humans. Metabolism 1988, 37, 844–849. [Google Scholar] [CrossRef]
 ), IFA (brown
  ), CFA (green
  ), and BCG (red
  ). The ellipsis represents the 95% confidence limit from a normal distribution for each cluster. The predictive ability of the PLS-DA data were measured by cross-validation, demonstrating high predictive performance with an explained variance of R2 = 0.99 and a predictive variance of Q2 = 0.98. (b,d) Metabolomics tree diagram generated from the scores plot of the PCA and PLS-DA, respectively. The numbers indicate the p-value for each node separation. The coloring of each group in the tree diagram is similar to the scores plot.
), IFA (brown ), CFA (green ), and BCG (red ). The ellipsis represents the 95% confidence limit from a normal distribution for each cluster. The predictive ability of the PLS-DA data were measured by cross-validation, demonstrating high predictive performance with an explained variance of R2 = 0.99 and a predictive variance of Q2 = 0.98. (b,d) Metabolomics tree diagram generated from the scores plot of the PCA and PLS-DA, respectively. The numbers indicate the p-value for each node separation. The coloring of each group in the tree diagram is similar to the scores plot.
). The ellipsis represents the 95% confidence limit from a normal distribution for each cluster. The predictive ability of the PLS-DA data were measured by cross-validation, demonstrating high predictive performance with an explained variance of R2 = 0.99 and a predictive variance of Q2 = 0.98. (b,d) Metabolomics tree diagram generated from the scores plot of the PCA and PLS-DA, respectively. The numbers indicate the p-value for each node separation. The coloring of each group in the tree diagram is similar to the scores plot.
), IFA (brown ), CFA (green ), and BCG (red ). The ellipsis represents the 95% confidence limit from a normal distribution for each cluster. The predictive ability of the PLS-DA data were measured by cross-validation, demonstrating high predictive performance with an explained variance of R2 = 0.99 and a predictive variance of Q2 = 0.98. (b,d) Metabolomics tree diagram generated from the scores plot of the PCA and PLS-DA, respectively. The numbers indicate the p-value for each node separation. The coloring of each group in the tree diagram is similar to the scores plot.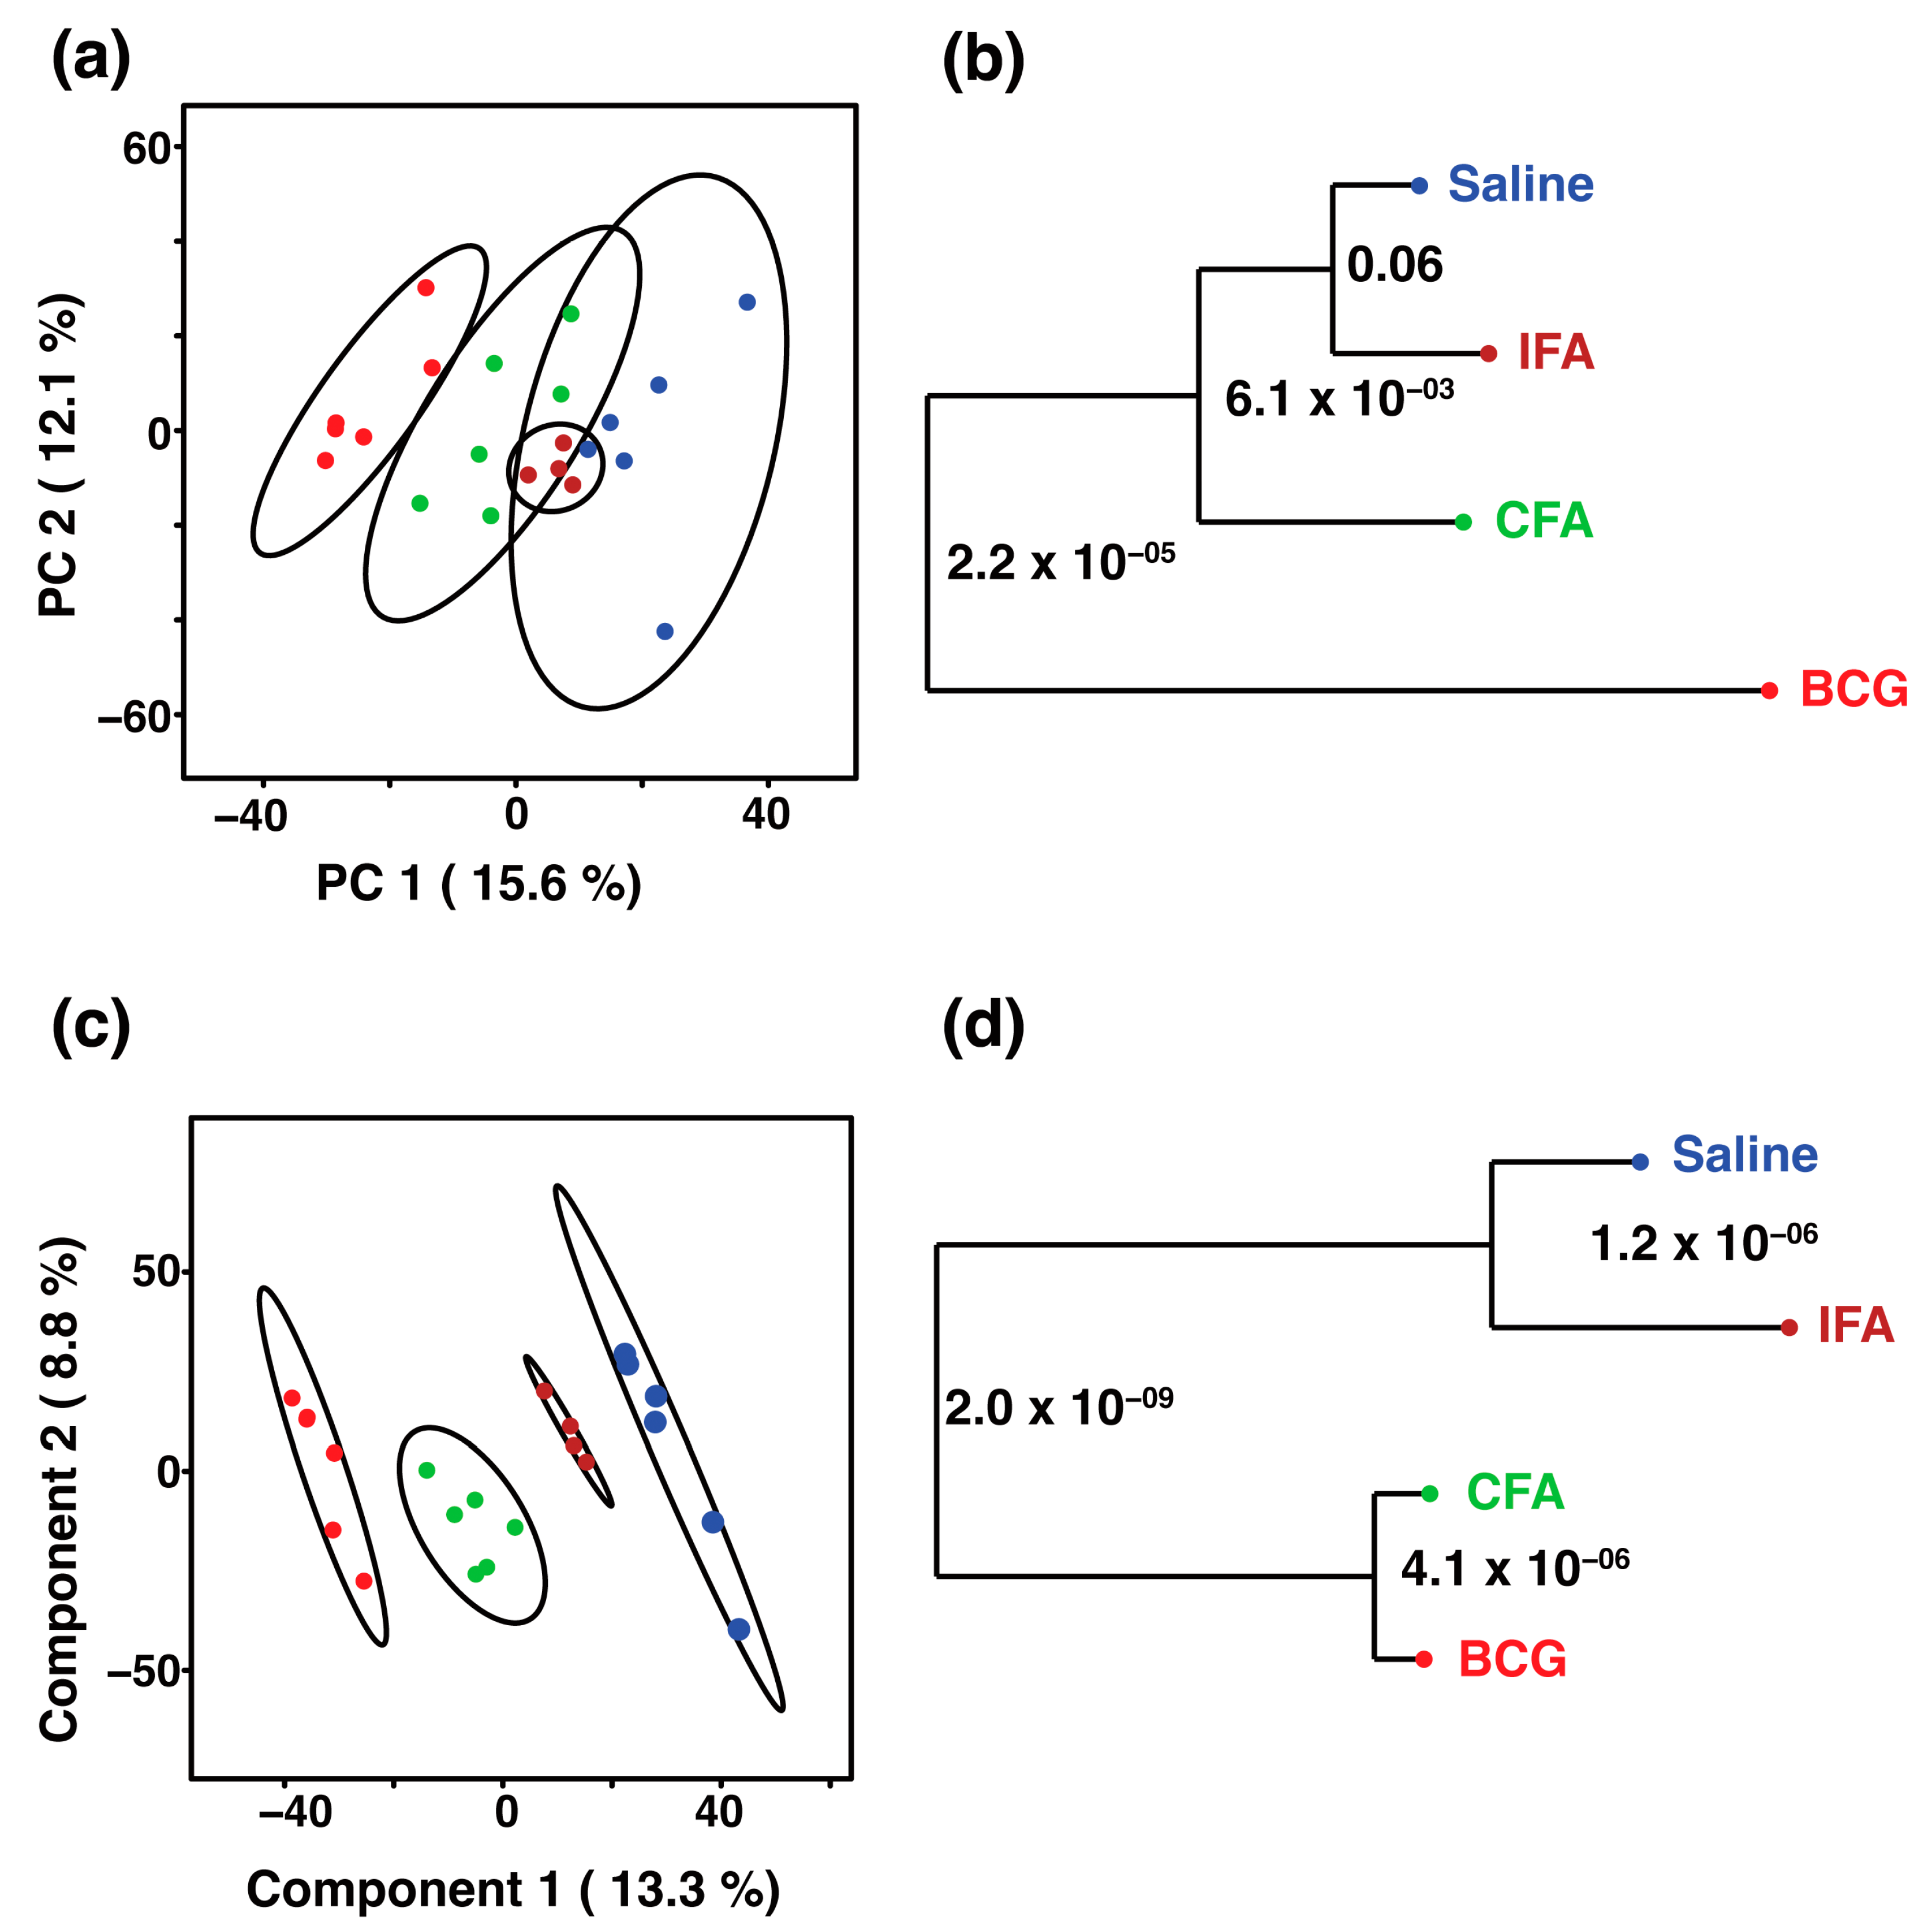 ) and BCG (red ) groups. The ellipsis represents the 95% confidence limit from a normal distribution for each cluster. The predictive ability of the PLS-DA data were measured by cross-validation, demonstrating high predictive performance with an explained variance of R2 = 0.99 and a predictive variance of Q2 = 0.9. (c) VIP scores for metabolites that best differentiate the BCG from the saline group. Higher VIP scores indicate metabolites with greater discriminative power in the model. The top 20 metabolites are listed along the y-axis, with their respective VIP scores on the x-axis. The colored squares to the right indicate the relative levels of each metabolite in the BCG and saline groups, with a gradient color bar showing low (green) to high (red) intensity. (d) Pathway analysis based on metabolites contributing to the separation between BCG and saline groups, as identified in (c). The two major impacted pathways, namely, the citric acid cycle and pyruvate metabolism, as analyzed by using Mus musculus KEGG analysis, are shown.
) and BCG (red ) groups. The ellipsis represents the 95% confidence limit from a normal distribution for each cluster. The predictive ability of the PLS-DA data were measured by cross-validation, demonstrating high predictive performance with an explained variance of R2 = 0.99 and a predictive variance of Q2 = 0.9. (c) VIP scores for metabolites that best differentiate the BCG from the saline group. Higher VIP scores indicate metabolites with greater discriminative power in the model. The top 20 metabolites are listed along the y-axis, with their respective VIP scores on the x-axis. The colored squares to the right indicate the relative levels of each metabolite in the BCG and saline groups, with a gradient color bar showing low (green) to high (red) intensity. (d) Pathway analysis based on metabolites contributing to the separation between BCG and saline groups, as identified in (c). The two major impacted pathways, namely, the citric acid cycle and pyruvate metabolism, as analyzed by using Mus musculus KEGG analysis, are shown.
) and BCG (red ) groups. The ellipsis represents the 95% confidence limit from a normal distribution for each cluster. The predictive ability of the PLS-DA data were measured by cross-validation, demonstrating high predictive performance with an explained variance of R2 = 0.99 and a predictive variance of Q2 = 0.9. (c) VIP scores for metabolites that best differentiate the BCG from the saline group. Higher VIP scores indicate metabolites with greater discriminative power in the model. The top 20 metabolites are listed along the y-axis, with their respective VIP scores on the x-axis. The colored squares to the right indicate the relative levels of each metabolite in the BCG and saline groups, with a gradient color bar showing low (green) to high (red) intensity. (d) Pathway analysis based on metabolites contributing to the separation between BCG and saline groups, as identified in (c). The two major impacted pathways, namely, the citric acid cycle and pyruvate metabolism, as analyzed by using Mus musculus KEGG analysis, are shown.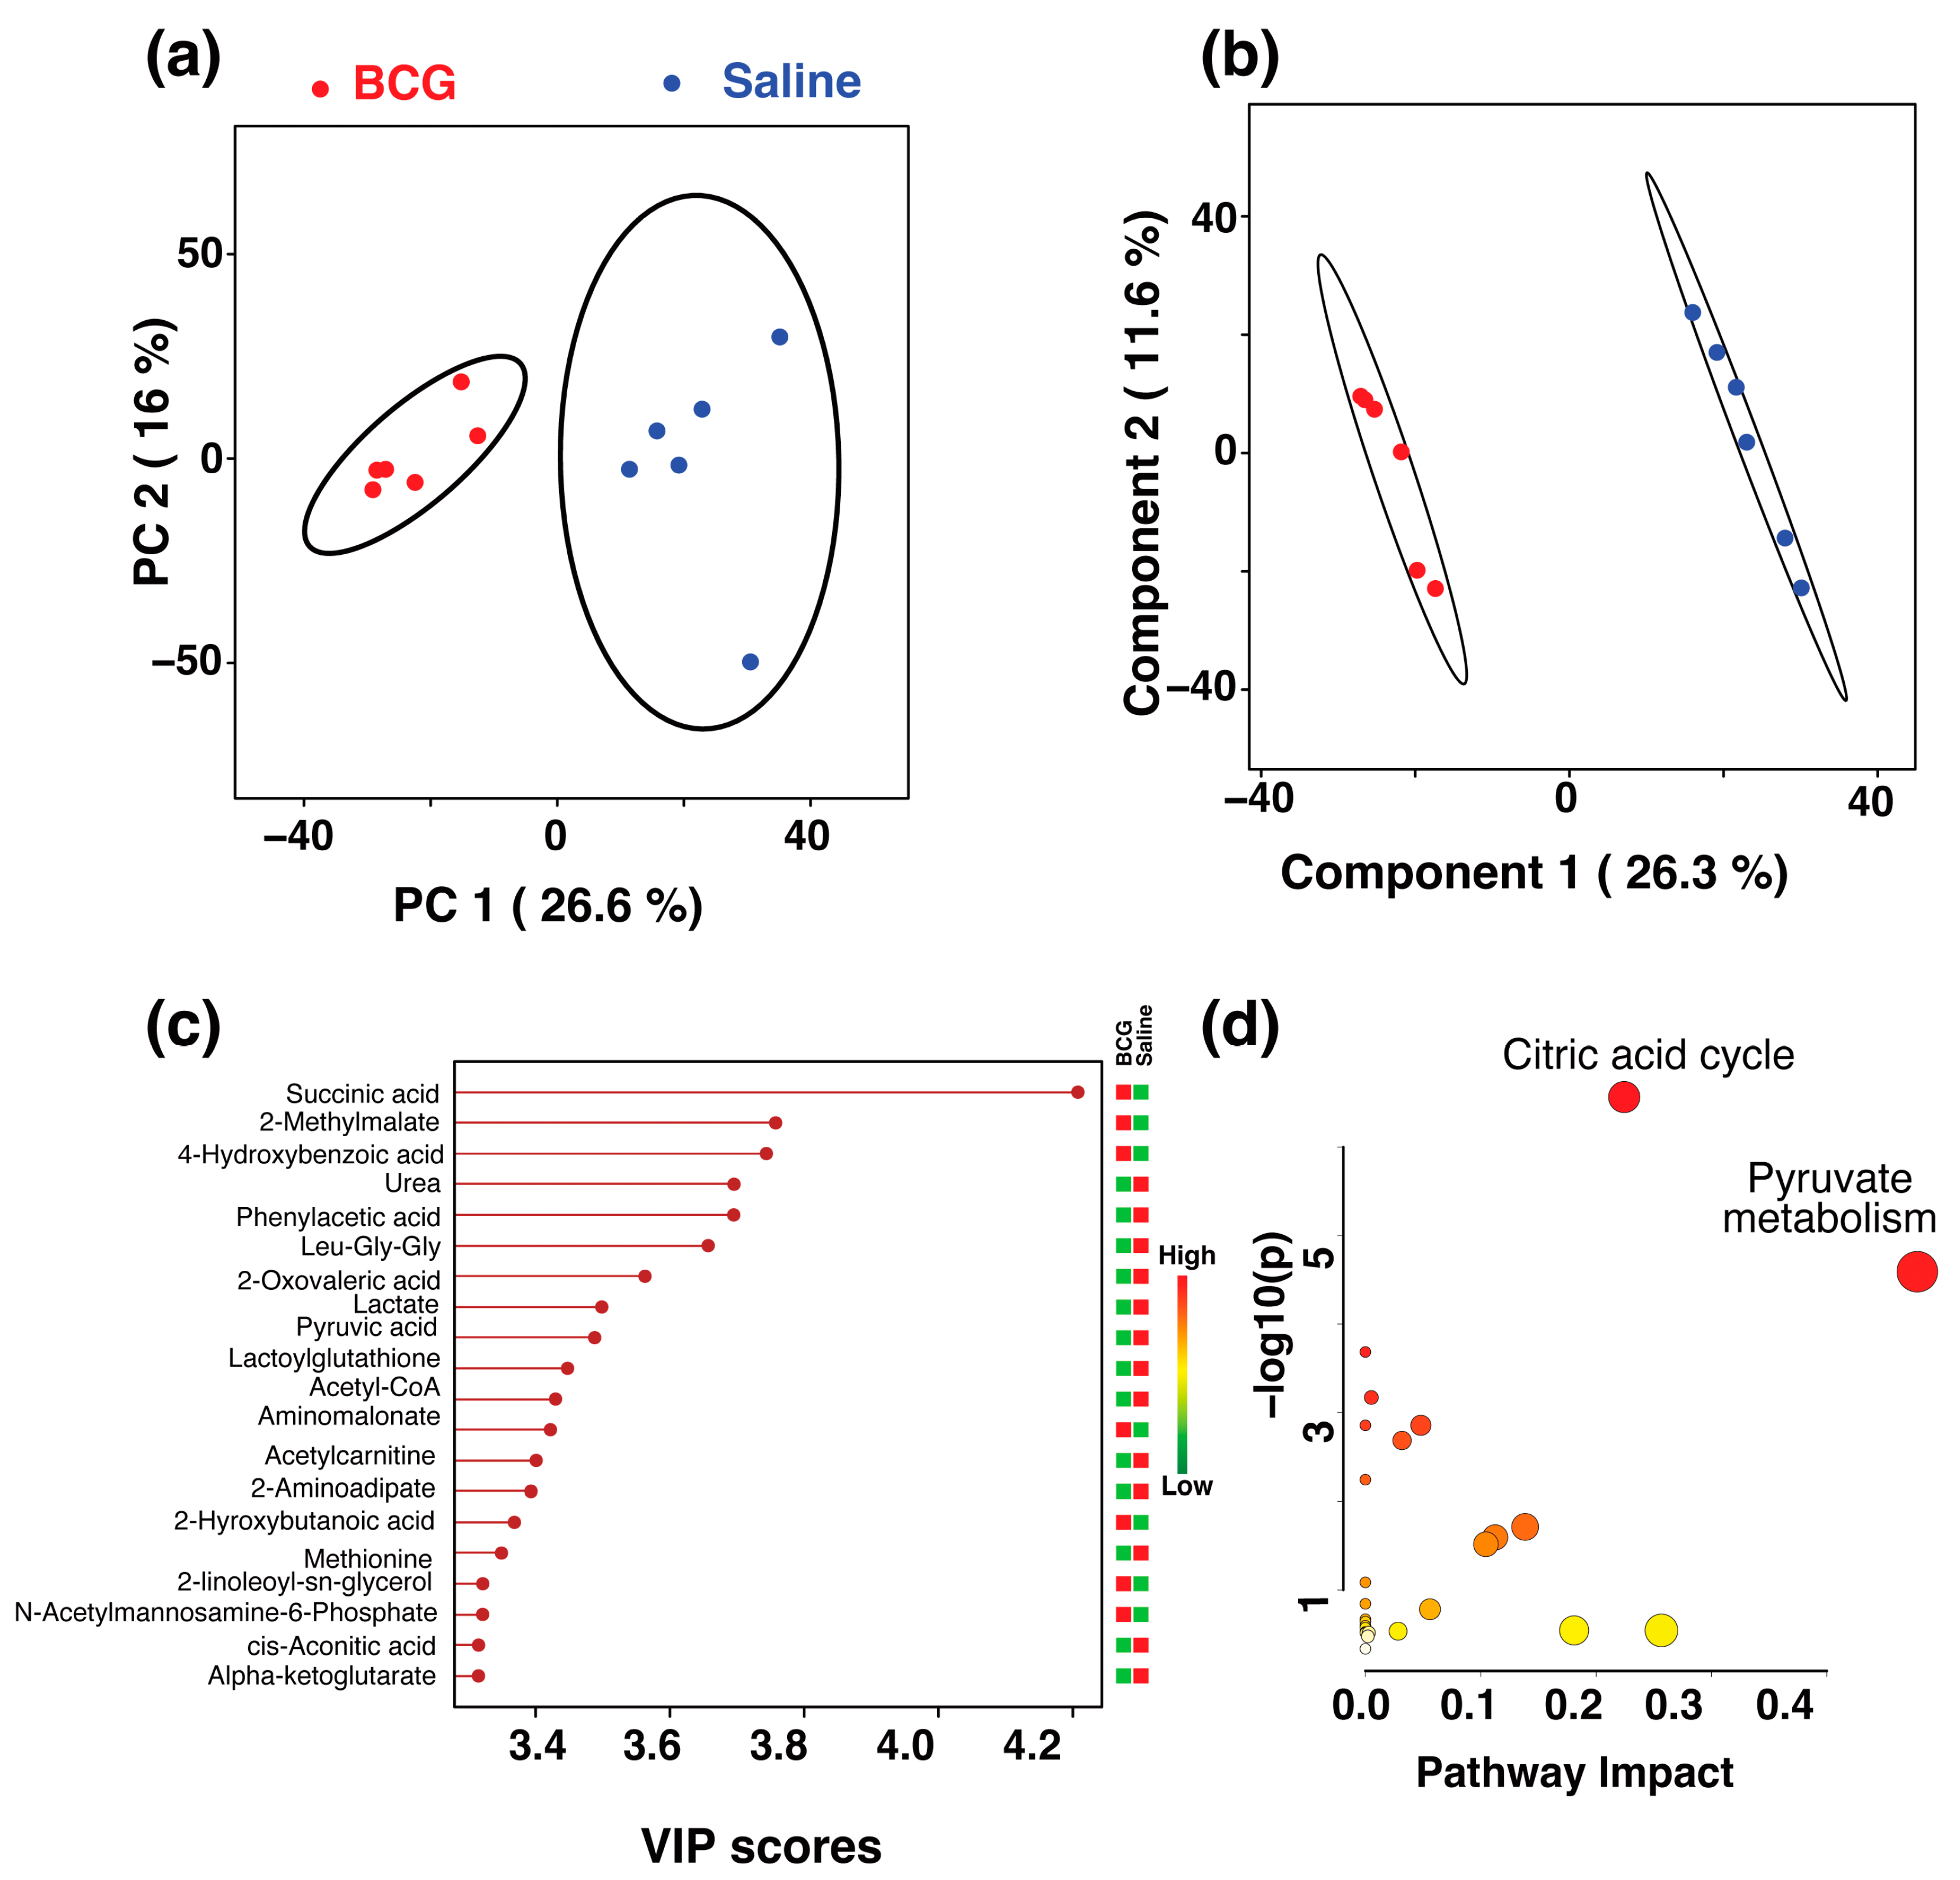 ) and CFA (green ) groups. The percentage of variance explained by each principal component is indicated on the respective axes (PC1: 19.1%, PC2: 18.1%, PC3: 12.3%). The ellipsoids represent a 95% confidence limit from a normal distribution for each cluster. (b) The 2D PLS-DA score plot showing a clear separation between the BCG and CFA metabolic profiles along Component 1 (16.5%) and Component 2 (12.9%) with cross-validation values of R2 = 1 and Q2 = 0.54. (c) VIP scores for metabolites that best differentiate the BCG from the CFA group. Higher VIP scores indicate metabolites with greater discriminative power in the model. The top 15 metabolites are listed along the y-axis, with their respective VIP scores on the x-axis. The colored squares to the right indicate the relative levels of each metabolite in the BCG and CFA groups, with a gradient color bar showing low (green) to high (red) intensity. (d) Pathway analysis based on metabolites contributing to the separation between BCG and CFA groups, as identified in (c). The major impacted pathways, namely, the ubiquinone and other terpenoid-quinone biosynthesis, cysteine and methionine metabolism, phenylalanine, tyrosine, and tryptophan biosynthesis, and glycerophospholipid metabolism as analyzed by using Mus musculus KEGG analysis are shown.
) and CFA (green ) groups. The percentage of variance explained by each principal component is indicated on the respective axes (PC1: 19.1%, PC2: 18.1%, PC3: 12.3%). The ellipsoids represent a 95% confidence limit from a normal distribution for each cluster. (b) The 2D PLS-DA score plot showing a clear separation between the BCG and CFA metabolic profiles along Component 1 (16.5%) and Component 2 (12.9%) with cross-validation values of R2 = 1 and Q2 = 0.54. (c) VIP scores for metabolites that best differentiate the BCG from the CFA group. Higher VIP scores indicate metabolites with greater discriminative power in the model. The top 15 metabolites are listed along the y-axis, with their respective VIP scores on the x-axis. The colored squares to the right indicate the relative levels of each metabolite in the BCG and CFA groups, with a gradient color bar showing low (green) to high (red) intensity. (d) Pathway analysis based on metabolites contributing to the separation between BCG and CFA groups, as identified in (c). The major impacted pathways, namely, the ubiquinone and other terpenoid-quinone biosynthesis, cysteine and methionine metabolism, phenylalanine, tyrosine, and tryptophan biosynthesis, and glycerophospholipid metabolism as analyzed by using Mus musculus KEGG analysis are shown.
) and CFA (green ) groups. The percentage of variance explained by each principal component is indicated on the respective axes (PC1: 19.1%, PC2: 18.1%, PC3: 12.3%). The ellipsoids represent a 95% confidence limit from a normal distribution for each cluster. (b) The 2D PLS-DA score plot showing a clear separation between the BCG and CFA metabolic profiles along Component 1 (16.5%) and Component 2 (12.9%) with cross-validation values of R2 = 1 and Q2 = 0.54. (c) VIP scores for metabolites that best differentiate the BCG from the CFA group. Higher VIP scores indicate metabolites with greater discriminative power in the model. The top 15 metabolites are listed along the y-axis, with their respective VIP scores on the x-axis. The colored squares to the right indicate the relative levels of each metabolite in the BCG and CFA groups, with a gradient color bar showing low (green) to high (red) intensity. (d) Pathway analysis based on metabolites contributing to the separation between BCG and CFA groups, as identified in (c). The major impacted pathways, namely, the ubiquinone and other terpenoid-quinone biosynthesis, cysteine and methionine metabolism, phenylalanine, tyrosine, and tryptophan biosynthesis, and glycerophospholipid metabolism as analyzed by using Mus musculus KEGG analysis are shown.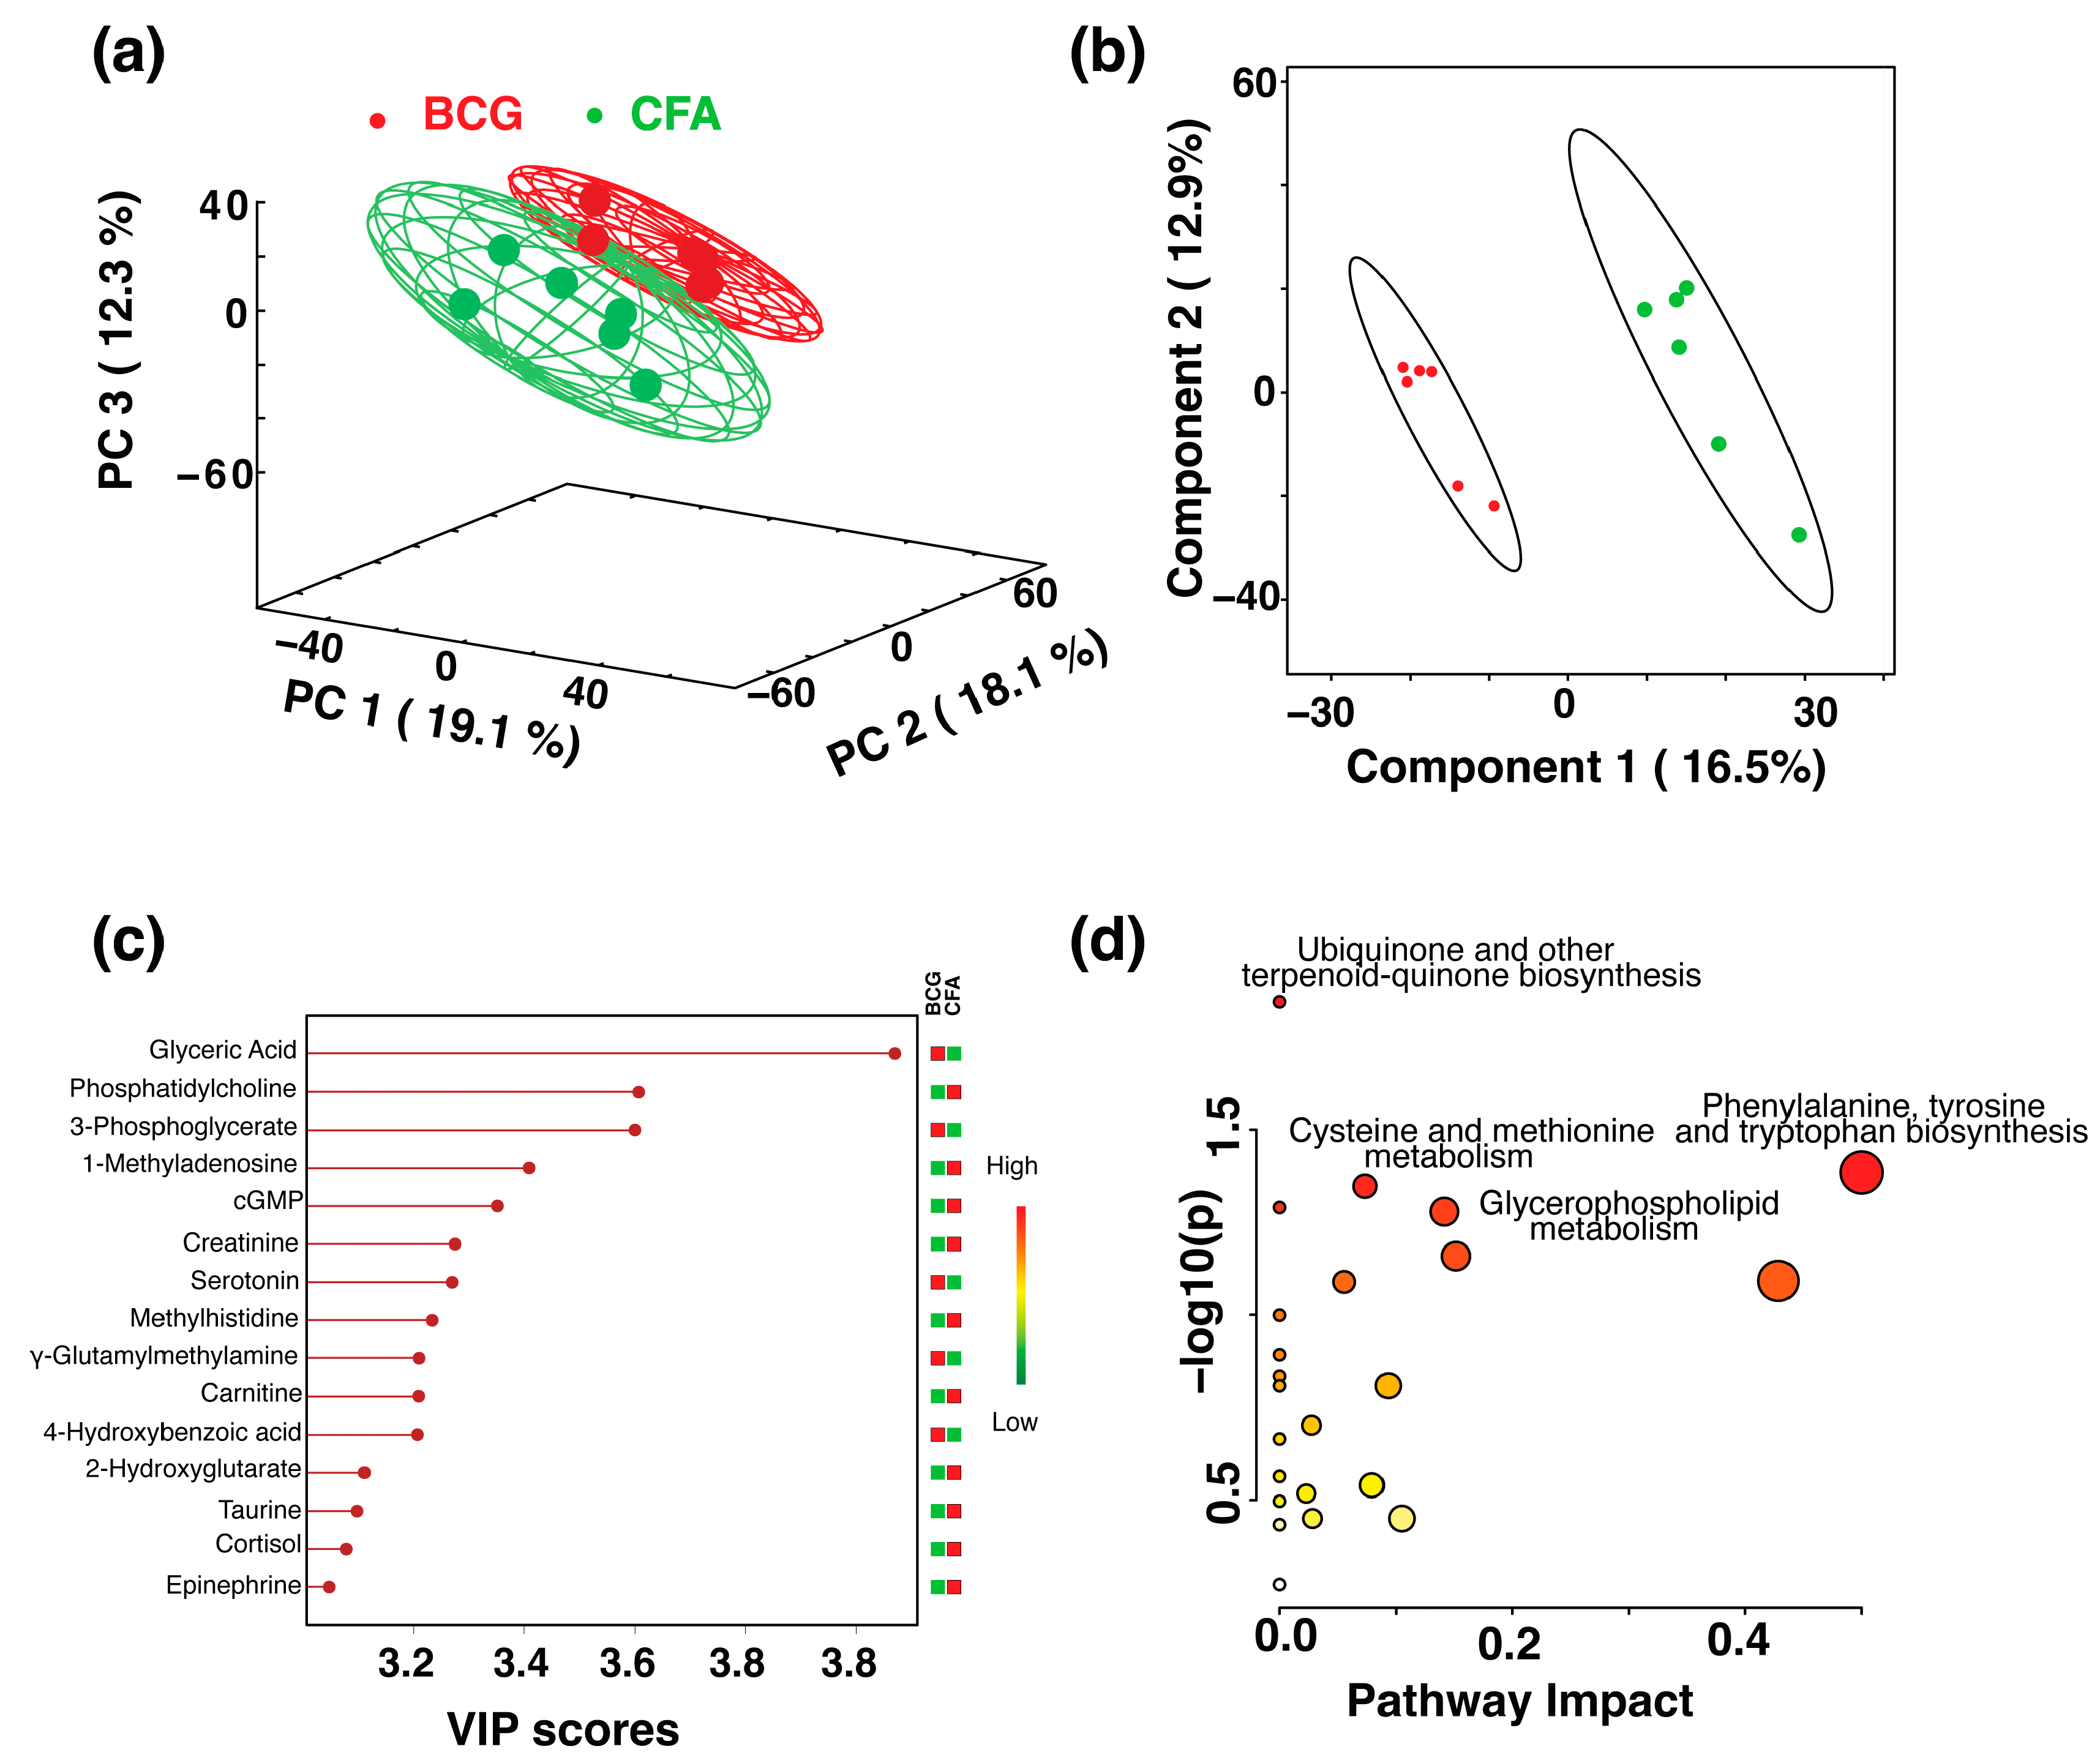 ) and IFA (brown ) groups. The ellipses represent a 95% confidence limit from a normal distribution for each cluster. (b) The 2D PLS-DA score plot showing a clear separation between the BCG and IFA metabolic profiles along the two components with cross-validation values of R2 = 0.99 and Q2 = 0.98 (c) VIP scores for metabolites that best differentiate the BCG from the IFA group. Higher VIP scores indicate metabolites with greater discriminative power in the model. The top 15 metabolites are listed along the y-axis, with their respective VIP scores on the x-axis. The colored squares to the right indicate the relative levels of each metabolite in the BCG and IFA groups, with a gradient color bar showing low (green) to high (red) intensity. (d) Pathway analysis based on metabolites contributing to the separation between the BCG and IFA groups, as identified in (c) The two major impacted pathways, namely, the citric acid cycle, cysteine metabolism, and pyruvate metabolism, as analyzed by using Mus musculus KEGG analysis, are shown.
) and IFA (brown ) groups. The ellipses represent a 95% confidence limit from a normal distribution for each cluster. (b) The 2D PLS-DA score plot showing a clear separation between the BCG and IFA metabolic profiles along the two components with cross-validation values of R2 = 0.99 and Q2 = 0.98 (c) VIP scores for metabolites that best differentiate the BCG from the IFA group. Higher VIP scores indicate metabolites with greater discriminative power in the model. The top 15 metabolites are listed along the y-axis, with their respective VIP scores on the x-axis. The colored squares to the right indicate the relative levels of each metabolite in the BCG and IFA groups, with a gradient color bar showing low (green) to high (red) intensity. (d) Pathway analysis based on metabolites contributing to the separation between the BCG and IFA groups, as identified in (c) The two major impacted pathways, namely, the citric acid cycle, cysteine metabolism, and pyruvate metabolism, as analyzed by using Mus musculus KEGG analysis, are shown.
) and IFA (brown ) groups. The ellipses represent a 95% confidence limit from a normal distribution for each cluster. (b) The 2D PLS-DA score plot showing a clear separation between the BCG and IFA metabolic profiles along the two components with cross-validation values of R2 = 0.99 and Q2 = 0.98 (c) VIP scores for metabolites that best differentiate the BCG from the IFA group. Higher VIP scores indicate metabolites with greater discriminative power in the model. The top 15 metabolites are listed along the y-axis, with their respective VIP scores on the x-axis. The colored squares to the right indicate the relative levels of each metabolite in the BCG and IFA groups, with a gradient color bar showing low (green) to high (red) intensity. (d) Pathway analysis based on metabolites contributing to the separation between the BCG and IFA groups, as identified in (c) The two major impacted pathways, namely, the citric acid cycle, cysteine metabolism, and pyruvate metabolism, as analyzed by using Mus musculus KEGG analysis, are shown.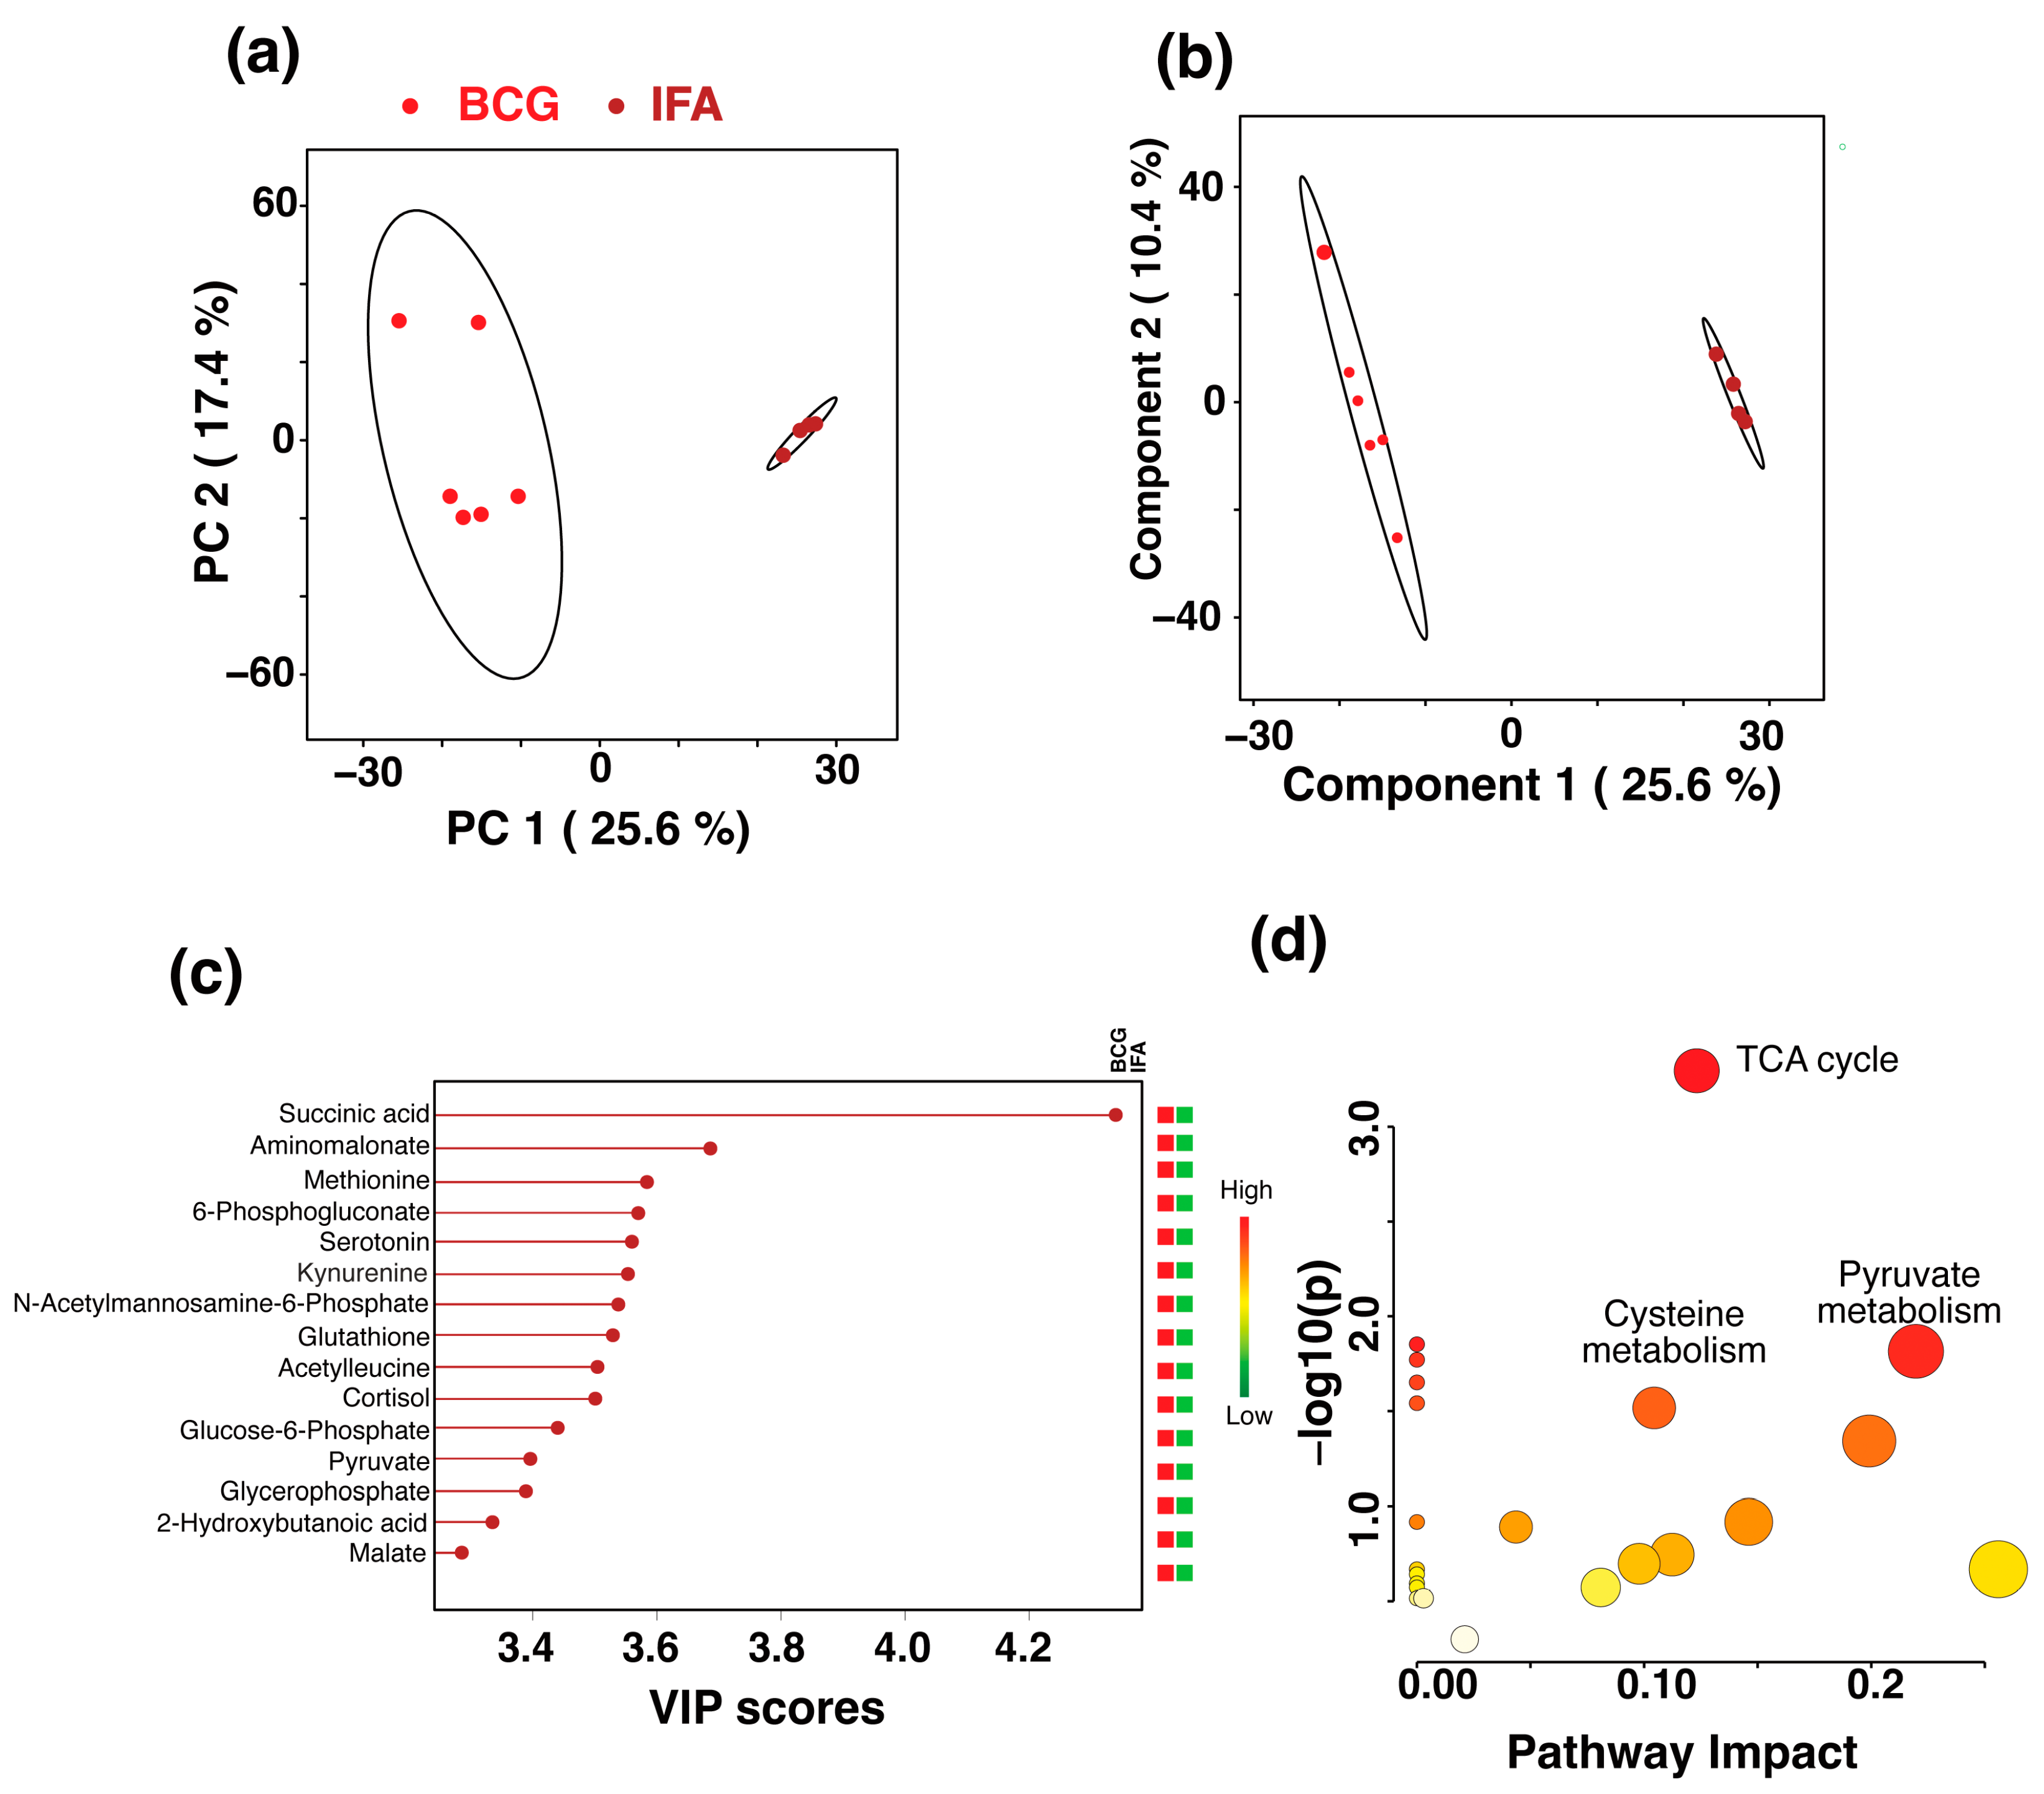

| Metabolite | Major Role | Ref. |
|---|---|---|
| Upregulated metabolites in the BCG group as compared to both saline and IFA groups | ||
| Succinic acid | Intermediate of TCA cycle, metabolic reprogramming, epigenetic regulator and modulator of inflammatory response | [53,54,55] |
| Aminomalonate | Amino acid synthesis | [101] |
| 2-hydroxybutanoic acid | Biomarker of preclampsia | [102] |
| Methionine | Lipid metabolism and ferroptosis | [56,57,58] |
| N-acetylmannosamine-6-phophate | Sialic acid synthesis | [103] |
| Upregulated metabolites in the BCG group as compared to saline group | ||
| 4-hydroxybenzoic acid | NLRP3 inflammasome activation and oxidative stress | [59,60] |
| Upregulated metabolites in the BCG group as compared to IFA group | ||
| 6-phosphogluconate | Reprogramming of Treg cells | [104] |
| Kynurenine | Inflammation, oxidative stress, endothelial dysfunction and immune suppression | [61,62,63] |
| Glutathione | Antioxidant, signaling and NK cell and T cell responses | [64,65,66,67,68,69,70] |
| Acetylleucine | mTOR pathway | [105] |
| Glycerophosphate | Adenosine triphosphate synthesis | [71] |
| Glucose-6-phosphate | Central energy metabolism | [72] |
| Pyruvate | Central energy metabolism, antioxidant and suppression of T cell responses | [73] |
| Malate | TCA cycle intermediate | [74] |
| Upregulated metabolites in the CFA group as compared to BCG group | ||
| Phosphatidylcholine | Anti-inflammatory | [75] |
| 1-methyladenosine | Oncometabolite | [94,95] |
| cGMP | Innate immune signaling | [106,107,108,109,110] |
| Creatinine | Anti-inflammatory, immunomodulator and antioxidant | [76,77,78] |
| Methylhistidine | Biomarker of skeletal muscle breakdown | [111] |
| L-carnitine | Downregulate T cell responses and block inflammation | [79,80,81,82,83] |
| 2-hydroxyglutarte | Oncometabolite, promotes Treg cells, regulates T cell response, anti-inflammatory and blocks NF-AT activation | [84,85,86,87,88,89,90,91,92,93] |
| Taurine | Oncometabolite, pro- and anti-inflammatory | [96,97,98,99,100] |
Disclaimer/Publisher’s Note: The statements, opinions and data contained in all publications are solely those of the individual author(s) and contributor(s) and not of MDPI and/or the editor(s). MDPI and/or the editor(s) disclaim responsibility for any injury to people or property resulting from any ideas, methods, instructions or products referred to in the content. |
© 2025 by the authors. Licensee MDPI, Basel, Switzerland. This article is an open access article distributed under the terms and conditions of the Creative Commons Attribution (CC BY) license (https://creativecommons.org/licenses/by/4.0/).
Share and Cite
Mone, K.; Garcia, E.J.T.; Abdullatif, F.; Rasquinha, M.T.; Sur, M.; Hanafy, M.; Zinniel, D.K.; Singh, S.; Thomas, R.; Barletta, R.G.; et al. Metabolic Reprogramming in Response to Freund’s Adjuvants: Insights from Serum Metabolomics. Microorganisms 2025, 13, 492. https://doi.org/10.3390/microorganisms13030492
Mone K, Garcia EJT, Abdullatif F, Rasquinha MT, Sur M, Hanafy M, Zinniel DK, Singh S, Thomas R, Barletta RG, et al. Metabolic Reprogramming in Response to Freund’s Adjuvants: Insights from Serum Metabolomics. Microorganisms. 2025; 13(3):492. https://doi.org/10.3390/microorganisms13030492
Chicago/Turabian StyleMone, Kiruthiga, Eloy Jose Torres Garcia, Fatema Abdullatif, Mahima T. Rasquinha, Meghna Sur, Mostafa Hanafy, Denise K. Zinniel, Shraddha Singh, Raymond Thomas, Raul G. Barletta, and et al. 2025. "Metabolic Reprogramming in Response to Freund’s Adjuvants: Insights from Serum Metabolomics" Microorganisms 13, no. 3: 492. https://doi.org/10.3390/microorganisms13030492
APA StyleMone, K., Garcia, E. J. T., Abdullatif, F., Rasquinha, M. T., Sur, M., Hanafy, M., Zinniel, D. K., Singh, S., Thomas, R., Barletta, R. G., Gebregiworgis, T., & Reddy, J. (2025). Metabolic Reprogramming in Response to Freund’s Adjuvants: Insights from Serum Metabolomics. Microorganisms, 13(3), 492. https://doi.org/10.3390/microorganisms13030492