Abstract
Changes in cell shape have been shown to be an integral part of the mycobacterial life cycle; however, systematic investigations into its patterns of pleomorphic behaviour in connection with stages or conditions of growth are scarce. We have studied the complete growth cycle of Mycobacterium monacense cultures, a Non-Tuberculous Mycobacterium (NTM), in solid as well as in liquid media. We provide data showing changes in cell shape from rod to coccoid and occurrence of refractive cells ranging from Phase Grey to phase Bright (PGB) in appearance upon ageing. Changes in cell shape could be correlated to the bi-phasic nature of the growth curves for M. monacense (and the NTM Mycobacterium boenickei) as measured by the absorbance of liquid cultures while growth measured by colony-forming units (CFU) on solid media showed a uniform exponential growth. Based on the complete M. monacense genome we identified genes involved in cell morphology, and analyses of their mRNA levels revealed changes at different stages of growth. One gene, dnaK_3 (encoding a chaperone), showed significantly increased transcript levels in stationary phase cells relative to exponentially growing cells. Based on protein domain architecture, we identified that the DnaK_3 N-terminus domain is an MreB-like homolog. Endogenous overexpression of M. monacense dnaK_3 in M. monacense was unsuccessful (appears to be lethal) while exogenous overexpression in Mycobacterium marinum resulted in morphological changes with an impact on the frequency of appearance of PGB cells. However, the introduction of an anti-sense “gene” targeting the M. marinum dnaK_3 did not show significant effects. Using dnaK_3-lacZ reporter constructs we also provide data suggesting that the morphological differences could be due to differences in the regulation of dnaK_3 in the two species. Together these data suggest that, although its regulation may vary between mycobacterial species, the dnaK_3 might have a direct or indirect role in the processes influencing mycobacterial cell shape.
1. Introduction
Ever since the identification of Mycobacterium tuberculosis (Mtb) and Mycobacterium leprae as the etiological agents of tuberculosis and Hansen’s disease (leprosy), respectively, different species of mycobacteria have been the subject of extensive investigations into their growth, metabolism, morphology, pathogenicity and response to stress. The ability of rod-shaped mycobacteria to grow as coccoids, branched and spore-like cells has been noticed in early studies, and it appeared that mycobacterial cells undergo morphological changes upon ageing [1,2,3,4,5,6,7,8,9,10]. Recent studies using modern technologies such as atomic force microscopy confirm that the slow-growing mycobacteria (SGM) Mtb shows variation in cell shape at a late stage of its growth [11]. Moreover, the SGM Mycobacterium marinum (Mmar) and Mycobacterium avium subsp. paratuberculosis (MAP) were reported to form spores while spore-like structures have been detected in Mycobacterium smegmatis mc2155 (Msmeg), Mtb and Mycobacterium bovis BCG and Mycobacterium phlei cultures [7,12,13,14,15,16]. Our understanding of the underlying molecular mechanism dictating changes and variations in cell shape among mycobacteria is, however, limited. To identify the general genetic machinery that might be involved in regulating changes in cell shape in mycobacterial cultures, we examined different mycobacteria that appeared to demonstrate pleomorphic variations at different stages of their growth and/or under stress. Here, we focus on the non-tuberculous (NTM) Mycobacterium monacense (Mmon).
M. monacense was first isolated in 1998 in Germany from the bronchial lavage of an 80-year-old patient suffering from multifocal lung carcinoma and insulin-dependent diabetes mellitus. It forms smooth, yellow, scotochromogenic colonies within 5–7 days after inoculation when grown on solid media and Mmon belongs to the rapidly growing mycobacteria (RGM) [17]. Mmon has also been isolated from patients suffering from lung infections, nodular lesions or open wound infections [18,19,20,21,22]. During a microscopic survey of various mycobacterial species, we noted that the Mmon type strain DSM44395, referred to as MmonT, changed its cell shape in an ageing culture. Hence, we decided to investigate growth, morphological characteristics and search for genes that might influence the cell shape of this RGM.
Here, we present data that MmonT, and Mycobacterium boenickei (Mboe), cultures in liquid medium showing bi-phasic exponential growth curves obtained from absorbance. We determined a roughly four-fold difference in generation time comparing “early” and “late” exponential phases. However, for Mmon the generation times obtained by counting colony-forming units (CFU) did not differ at early or late phases of growth. Microscopy analysis of cells from different stages of growth showed changes in cell morphology from rod-shaped cells to coccoid and spore-like PGB cells upon ageing. This offered a probable explanation for the apparent bi-phasic nature of the growth curve plotted using absorbance data as cylindrical and smaller spherical shapes would scatter light differently [23]. To examine if there were any changes in the expression of genes associated with the growth-dependent changes in cell shapes, we identified genes predicted to be involved in the maintenance of cell shape and cell division using the complete MmonT genome. Their mRNA levels were monitored by RNASeq over time and the dnaK_3 mRNA level increased significantly upon ageing. DnaK_3 is a known heat shock chaperone and analysis of its protein architecture identified a domain of MmonT (and Mmar) DnaK_3 as an MreB-like homolog. Overexpression of dnaK_3Mmon appeared to be lethal in MmonT but its exogenous expression in Mmar resulted in transient changes in cell morphology. Together, our findings provide a basis for discussing a possible role of DnaK_3, whether direct or indirect, in the regulation of cell shape in mycobacteria.
2. Materials and Methods
2.1. Bacterial Strains and Constructs
The wild type strain DSM44395 (MmonT) was obtained from DSMZ (Deutsche Sammlung von Mikroorganismen und Zellkulturen, GmbH) culture centre, Braunschweig, Germany. The MmonRFPHyg and MmonRFPKan were constructed by transforming the MmonT with pDEAM5 and pDEAM2, respectively (permission number to work with M. monacense and introduce gene markers, 202100-2932v54a4, Uppsala University). These plasmids, which carry the red fluorescence protein (RFP) gene and the hygromycin or the kanamycin resistance genes, integrate at the attB site on the chromosome [24]. In order to over-express dnaK_3Mmon in MmonT, the gene was cloned into pBS401 plasmid (see e.g., [25]) behind a tetracycline-inducible promoter (pBS401-dnaK_3Mmon) and screened using plasmid specific-primers (Table S1). Subsequently it was introduced into Mmar CCUG20998 (MmarT) generating MmarpBS401-dnaK3Mmon. A derivative of MmarT expressing the antisense dnaK_3Mmon was also constructed, which is referred to as MmarpBS401-antidnaK3Mmon. Details of the constructs, their nomenclature and primers used have been listed in Tables S1 and S2. For MmonT and MboeT, all the experiments were conducted at 37 °C while in the case of MmarT the experiments were conducted at 30 °C.
2.2. Media, Determination of Generation Times and bi-Phasic Growth Experiments
MiddleBrook 7H9 (liquid) and 7H10 (solid) media were used as standard and prepared according to the manufacturer’s instructions. For cultivation of MmonRFPHyg and MmonRFPKan, hygromycin and kanamycin were added to final concentrations of 100 µg mL−1 and 25 µg mL−1, respectively. For induction of dnaK_3Mmon (and anti-dnaK3Mmon) carried by pBS401, 7H10 plates were supplemented with tetracycline (Tc; final concentration 20 ng mL−1) and hygromycin 100 µg mL−1 (see also Table S2).
The Arret–Kirshbaum agar (AK; BD, Bioscience, Gothenburg, Sweden), modified G media (mG; [26]), Potato Dextrose Agar (PDA; BD, Bioscience, Sweden) [27] and Luria–Bertani (LA) media were prepared according to established protocols.
To determine the generation time, GT, for MmonRFPHyg cultivated in liquid medium a single colony (about 5–7 days old) was used to inoculate in 10 mL 7H9 medium supplemented with hygromycin (100 µg mL−1) and grown for 5–10 days. This primary culture was diluted 1000-fold in fresh media, incubated at 37 °C and OD600 was measured at different time points (see Section 3). Growth curves were generated by plotting OD600 values (Y-axis) against time (X-axis). The generation times were determined by calculating the slope for each curve using the tangent to the curve (exponential trend-line). The slopes (GT) were used to compare the growth phases (fast, slow or stationary) allowing us not to base our comparisons to the initial OD600 of the culture (see Section 3). Determination of the growth curve for each condition was repeated twice with biological triplicates for each repeat. The generation times were calculated based on two repeats with biological triplicates for each repeat and given as average ± error range.
The bi-phasic growth experiments were conducted in 7H9 (see above). A 5–10 days old primary culture of MmonRFPHyg grown at 37 °C was diluted 1000-fold (final volume 120 mL per replicate). OD600 was measured at regular intervals and plotted against time. From the so obtained bi-phasic growth curve, we identified a fast exponential phase Expo I, followed by a slow exponential phase Expo II and stationary phase SP (see Section 3). A fixed volume of Expo II cells (40 mL) was pelleted (in 50 mL falcon tubes) at OD600 ≈ 0.25–0.4 (for MboeT OD600 ≈ 1), and subjected to different media conditions, while the remaining culture was allowed to continue to grow (see Section 3). To test for the depletion of the carbon source, Tween 80 (final concentration 0.05%) and Glycerol (final concentration 0.2%) were added individually to 40 mL cultures in the Expo II phase. Media from the Expo II growth phase cultures were filtered using sterilised filters (0.2 μm; referred to as “spent media”) and used to re-suspend cells from Expo II (referred to as “Re-sus”) and Expo I (referred to as “EP-I in spent media”). As a control, cells from Expo I and Expo II were re-suspended in fresh 7H9 media (supplemented with 100 µg mL−1 hygromycin), referred to as “Expo I in fresh media” and “Expo II in fresh media”, respectively. Also, Expo II cells were pelleted and re-suspended in the same media (without filtration) as a control for the re-suspension step (and referred to as “re-suspended”). The OD600 was measured at regular intervals and growth curves were generated (for details see Section 3). At selected time points, cells were withdrawn and subjected to phase contrast microscopy and the percentage of cells with different cell morphologies were determined as described below. The bi-phasic growth experiments were performed at 37 °C.
For each condition, the experiment was repeated twice with biological triplicates for each repeat. The calculated generation times are given as average ± error range.
2.3. Determination of Growth Rates for Cells Grown on 7H10 Solid Media
Cells from a one-week-old plate grown at 37 °C were re-suspended in 2 mL 7H9 media to an OD600 of ≈0.5–0.7. A ten-fold dilution of this suspension was made and 100 μL of this suspension was plated on 7H10 plates (2–3 plates for each replicate) resulting in a final number of cells per plate corresponding to OD600 ≈ 0.07. Using the wide end of a Pasteur pipette, small areas of the agar was withdrawn from the plate after different times of growth and re-suspended in 1 mL of 7H9. This re-suspension was vortexed thoroughly, serially diluted and followed by plating of 100 µL on 7H10 of each dilution and incubated at 37 °C. After ≈5 days, single colonies were counted and the average colony-forming units (CFU) mL−1 for each time point was calculated and plotted against time. The generation time was determined from the slope of the exponential part of the so obtained plot.
2.4. Phase Contrast Microscopy
Small amounts of cells were scraped from plates and re-suspended in ≈500 µL of PBS. The cell suspension was diluted to obtain an almost clear suspension to have the appropiate amount of cells for microscopy. FM4-64, Mito Tracker Green (MTG) and DAPI (4′,6-diamidino-2-phenylindole) stains (Invitrogen, Carlsbad, CA, USA) were added to 100 µL of the above cell suspension to final concentrations of 5 µg mL−1, 5 µg mL−1 and 3 µg mL−1, respectively, and allowed to stand at room temperature for about 5–10 min. In total, 10 µL of this suspension was placed onto a slide with evenly solidified agarose gel (1% in PBS) and allowed to dry. A glass cover slip was placed over the dried spot and viewed at 100× magnification with a Zeiss Axioplan2 microscope with a CCD AxioCam camera (Carl Zeiss AB, Stockholm, Sweden) linked to the Axiovision 4.7 computerised image analysis software. See Supplementary Information for more information on DAPI staining patterns of Mmon.
2.5. Statistical Analysis
For every time point, a number of non-overlapping fields were viewed under the microscope (phase contrast) and each field was considered as one image for that strain. For each image, the numbers of different cell morphologies (rod, coccoid and PGB cells) were determined. For every time point and condition, a minimum of 350 cells were counted. The sum of all these morphology types was considered as the total number of cells present in the field. The percentages of each cell type and standard deviation were calculated. The average frequency of the occurrence for each cell type was first calculated between biological replicates and then between the repeats of the experiment. These values were then plotted in a bar plot with error bars indicating the standard deviations. The average and standard deviation was calculated for the frequencies obtained from each repeat (2–3 times) of the time course experiment.
2.6. Preparation of Cells for Transmission Electron Microscopy (TEM)
In total, 1 mL of cells were pelleted and fixed by re-suspending the cells in 5 mL 0.1 M sodium cacodylate buffer supplemented with 2.5% glutaraldehyde and rotated at low speed at room temperature for 30 min to keep the cells in suspension. The fixed cells were stored in the dark at 4 °C until initiating preparation for TEM. For a detail description, see Ghosh et al. [14]; see also [28].
2.7. Sample for Illumina and Pacbio Sequencing
For PacBio and Illumina sequencing of MmonT, cells were grown on 7H10 (≈50 plates) for 2–3 days at 37 °C, collected by “scraping” and re-suspended in 40–50 mL PBS followed by centrifugation. For PacBio sequencing of MmonRFPHyg, a 1000 mL culture was grown in 7H9 supplemented with 100 µg mL−1 hygromycin at 37 °C to OD600 ≈ 0.3 to 0.5 and harvested by centrifugation. Chromosomal DNA was extracted as previously described [29] and used for sequencing.
2.8. Genome Sequencing, Assembly and Annotation
The genome of MmonT was sequenced at the SNP&SEQ Technology Platform (HiSeq2000 Illumina platform) at Uppsala University, Uppsala. Illumina sequencing of MmonT generated reads with an average read length of 100 bp, average coverage of 400x, and assembled using the ‘Soapdenovo assembler-version 1.05’ [30] giving rise to contigs with minimum of 200 bps in length. The complete genomes of MmonT and MmonRFPHyg were sequenced at the NGI-Uppsala genome centre (PacBio technology), Uppsala, Sweden. The mean read length in MmonT PacBio sequence was 8625 bp with mean coverage of 58x and for MmonRFPHyg it was 9307 bp and 74x mean coverage. The long reads of the MmonT and MmonRFPHyg PacBio generated sequences were assembled using the SMART portal 2.1 analysis HGAP3 pipeline v3 [31] and polished with Quiver v1 (Pacific Biosciences, Menlo Park, CA, USA). The assembly of the Illumina-sequenced genome was performed as previously reported (see e.g., [32,33]).
Genome annotations for MmonT (Illumina and PacBio) and MmonRFPHyg (PacBio) were conducted using the PROKKA ver 1.10 annotation pipeline [34]. All the coding sequences (CDSs) were predicted using the ‘Prodigal-version 2.60’ [35]; ribosomal RNAs and tRNA using the ‘RNAmmer-version 1.2’ and ‘tRNAScanSE’ ver 1.23 applications [36,37]. The ‘non-coding RNA’ genes were identified using the ‘RFAM database-version 12.0’ [38] along with ‘Infernal-version 1.1.2’ aligner [39]. For generating the subsystem classification data, all the protein sequences predicted by the PROKKA pipeline were mapped to the RAST database (https://rast.nmpdr.org/, last accessed on 19 July 2019) and functionally classified [40] using the RAST webserver to obtain the subsystem classification data.
2.9. dnaK_3 over-Expression—Culture Conditions and Procedure
Single colonies of MmarpBS401-dnaK3Mmar/Mmon (about 5–7 days old) were inoculated into 7H9 medium supplemented with hygromycin (100 µg mL−1), in biological duplicates, and allowed to grow for 7–10 days. From this primary culture, 100 µL was plated onto fresh 7H10 hygromycin (100 µg mL−1) plates and incubated for about 2–3 days (exponential growth, adjusting to solid medium [41]). The cells were then scraped, re-suspended in PBS (to a final OD of about 1) and 100 µL of the suspension was plated onto fresh 7H10 hygromycin (100 µg mL−1) plates (for un-induced) and 7H10 with hygromycin and tetracycline, Tc (for induced condition; 100 µg mL−1 hygromycin and 20 ng mL−1 tetracycline). The plates were incubated at 37 °C and samples were harvested at various time points and prepared for microscopy and qRT-PCR.
2.10. Protein Homology Analysis
HMM (Hidden Markov Model) family of MreB_Mbl (PF06723) was retrieved from the Pfam database and an HMM search (V 3.1b2 with default settings and threshold T: 45) was conducted to identify the MreB_Mbl protein homologs in Mmon. The corresponding homologs were identified using the Simple Modular Architecture Research Tool (SMART; http://smart.embl-heidelberg.de/; last accessed on 26 March 2018 and 9 July 2019) [42] and presented using iTol (interactive Tree of Life V 5.4; see Section 3) [43]. Moreover, the online ‘NCBI BLASTp search’ tool (https://blast.ncbi.nlm.nih.gov/Blast.cgi, lasted accessed on 9 July 2019) was used to identify percentage identity and protein homology.
2.11. RNA Extraction, cDNA Conversion, RNASeq and qRT-PCR Analysis
Cells (two biological replicates) were harvested from plates at different time points and RNA was extracted, purified and converted to cDNA as previously reported [41]. The RNA sequencing (RNASeq) was performed at the SNP&SEQ Technology platform using the Illumina technology at Uppsala University, Uppsala, Sweden. The sequenced short reads of paired ends with a read length of 100 bp were mapped to the reference genome MmonT by creating an index and aligning using the ‘bowtie2-version 2.2.4’ tool [44] and Tophat pipeline-version 2.0.13 [45].
Based on the aligned BAM files, read counts were calculated using the HTSeq (version 0.9.1) [46]. The normalisation and differential expression analysis was performed using the Deseq2 [47] p + adj values, i.e., statistical significance is represented by stars based on the p + adj value range (* p < 0.05, ** p < 0.01 and *** p < 0.001). Finally, the differential mRNA levels were generated using the ggplot2 R-package ver 3.4.0 [48] and the gene synteny plots using the genoplotR R-package ver 0.8.9 [49].
Primers and probe design, and conditions for quantitative real-time PCR (qPCR) are listed in Table S1. A 16S rRNA standard curve was used for relative quantification and as endogenous control [41,50]. Each sample (two biological replicates) was assayed in triplicates and the primer and probe details are listed in Table S1. The dnaK_3 probe was designed to detect both dnaK_3Mmar and dnaK_3Mmon. However, the primers targeting the dnaK_3Mmon was specific to the gene on the plasmid (pBS401-dnaK3Mmon). To distinguish between the transcript levels of chromosomal dnaK_3Mmar and dnaK_3Mmar from the plasmid (pBS401-dnaK3Mmar), a control qPCR was performed (see Section 3) to determine the levels dnaK_3Mmar mRNA derived from the chromosome.
2.12. Preparation of Whole Cell Lysates for β-Galactosidase Assay
Mycobacterial cultures carrying the pIGn empty plasmid and pIGn with dnaK_3-lacZ fusions were grown until exponential (≈0.5 OD600) and stationary phase (≈4.5 OD600) and cells were harvested by centrifugation. The pellet was then re-suspended in 1 mL 10 mM Tris-HCl (pH 8), re-centrifuged and the supernatant was discarded. The cells were once again, re-suspended in 200–400 µL of 10 mM Tris-HCl (pH 8), transferred to a 2 mL screw-capped tube containing 100 µL 0.1 mm zirconia beads and chilled on ice for 2–3 min. The cells were disrupted using FastPrep24 bead-beater for 45 s at speed 6.0 and chilled on ice for 2–3 min before centrifuging the lysates for 3 min at maximum speed to remove cell debris. The supernatant was transferred to clean 1.5 mL Eppendorf tubes and used for β-gal assay and Bradford assay for estimating total protein concentration.
2.13. Bradford and β-Galactosidase Assay
Reagents and protocol for Bradford assay for estimating the total protein was followed as recommended by BioRad (Bio Rad Laboratories AB, Solna, Sweden). The reading was measured in technical triplicates and biological duplicates for each sample using a 96-well plate reader (spectrophotometer) at 574 nm wavelength. Bovine serum albumin (BSA) provided in the BioRad kit was used as the standard.
For β-galactosidase assay, CPRG (Chlorophenol Red β-Galactopyranoside) prepared in Buffer X (KH2PO4 50 mM at pH 7.8 and MgCl2 1 mM) was used as substrate. In total, 15 µL of the sample lysate, 135 µL of Buffer X and 30 µL of CPRG (final concentration 1 mM) were added to each well, respectively. Readings were taken for 90 min with a time interval of 15 min between each reading (0 to 90 min) using a 96-well plate reader (spectrophotometer) at 574 nm wavelength.
3. Results
3.1. Growth of M. monacense in Liquid Media: Influence of hygR and the Red Fluorescence Protein (rfp) Gene
The type of strain Mmon DSM44395 (MmonT) forms round, smooth and pale yellow colonies after 5–7 days of growth on MiddleBrook 7H10 (solid; Fisher Scientific, Gothenburg, Sweden) medium at 37 °C [17]. MmonT was also grown on other solid media, viz., Arret–Kirshbaum (AK), modified G (mG; a modified medium based on one known to promote sporulation in Bacillus subtilis [26]), LA and Potato Dextrose Agar (PDA; for details, see Section 2). Growth on LA, PDA and mG plates was slower and poorer, but similar pale yellow to yellow colonies did appear after 15 days at 37 °C (Table 1; Figure S1). Moreover, MmonT appeared to grow poorly (if at all) in liquid media (7H9, LB or mG). Some growth was, however, apparent in liquid LB and mG cultures after five days of incubation but with heavy clumping that made estimation of growth rates by measuring OD600 unreliable (Table 2).

Table 1.
Compilation of the colony morphology characteristics of MmonT grown on different media. Observations were made after 15 days of growth at 37 °C.
Table 2.
Compilation of OD600 measurements for MmonT derivatives in various liquid media supplemented with different antibiotics as indicated. The measurements were made after 5 days of growth at 37 °C.
To track MmonT (and ensure absence of contamination), we introduced the hygromycin and kanamycin resistance genes linked to the red fluorescent protein (RFP) gene into the attB site on the MmonT chromosome (see below and Section 2). These derivatives are referred to as MmonRFPHyg and MmonRFPKan, respectively (Table S2). The MmonRFPHyg grew in 7H9 liquid media supplemented with hygromycin while the MmonRFPKan did not show any detectable growth in 7H9 containing kanamycin (Table 2). Since MmonT transformed with the non-integrative plasmid pBS401 carrying hygR (referred to as MmonpBS401; Table S2) grew in 7H9 media supplemented with hygromycin (Table 2) it seemed that the growth was promoted by the presence of hygromycin in 7H9 liquid media and not a consequence of the chromosomal integration of pDEAM5 at the attB site (see below). Also, growth of MmonRFPHyg in liquid 7H9 medium without hygromycin resulted in heavy clumping. This would be consistent with earlier observations where hygromycin resistance appeared to confer a growth advantage (compared to kanamycin resistance) upon mycobacteria in the presence of respective antibiotics [51]. Unless stated otherwise, the experiments below were conducted in the standard media, 7H9 or 7H10.
3.2. Bi-Phasic Pattern of Growth Curves Plotted from Absorbance Measurements
Since MmonT and MmonRFPHyg grew differently in liquid medium, we compared their growth rates on solid medium, by following their growth on 7H10 plates without and with hygromycin (100 μg/mL). Identical aliquots of bacterial lawns from plates smeared with equal number of cells and maintained at 37 °C were collected at intervals and re-suspended into 0.1 mL PBS buffer. The number of bacteria counted by plating were plotted as CFU/mL against time (see Section 2). Figure 1A shows the growth curves for MmonT and MmonRFPHyg grown on 7H10 agar plates over a period for >100 h. Trend lines (marked in red) were drawn to estimate generation times (GT). The growth curves are almost parallel showing very similar growth rates for the two strains; viz., with GT, 5.9 ± 0.5 and 5.1 ± 0.9 h for MmonT and MmonRFPHyg, respectively. Moreover, the polymorphic cell patterns (see below) for the two strains with ageing of the plate cultures were similar. Hence, the observed MmonRFPHyg growth and pleomorphism was taken to represent that of Mmon in general and we used MmonRFPHyg to investigate growth in liquid 7H9 medium containing 100 μg/mL hygromycin (see Section 2).
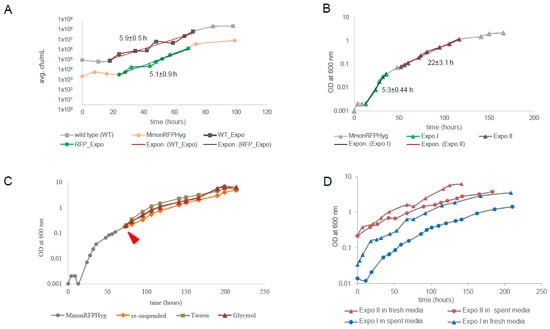
Figure 1.
The representative growth curves for MmonT and MmonRFPHyg cultivated under various conditions. (A) The growth curve for MmonT (marked with squares) and MmonRFPHyg (marked with circles) cultivated on 7H10 (supplemented with hygromycin in the case of MmonRFPHyg) plates with average generation times ± deviations in hours (h). WT_Expo and RFP_Expo represent exponential growth phases and the trend lines representing the slope of the growth curves are marked in red. The growth was generated by plotting the average values for each time point. The average CFU/mL was calculated from two biological replicates for each strain (see Section 2) and the generation times are given in hours ± error range. (B) The growth curve for MmonRFPHyg in liquid 7H9 media with two exponential growth phases, Expo I and Expo II (highlighted dark) and trend lines representing the slope of the curve in red used to calculate the generation times (see Section 2) ± error range as indicated. (C) The “normal” growth curve for MmonRFPHyg (in grey) and the growth curves after subjecting Expo II cells to various conditions, “re-suspended” in orange, addition of “Tween” in green, and addition of “glycerol” in red (for details see Section 2). The red arrow marks the time when cells were harvested and subjected to various conditions as outlined in see Section 2. (C,D) show representative best fit curves (with R2-values ≈ 1) to the observed bi-phasic growth pattern (see also Table S3). (D) The growth curves for Expo I cells (MmonRFPHyg) inoculated into “fresh media” (blue triangles) and “spent media” (blue circles) and for Expo II cells inoculated into “fresh media” (red triangles) and “spent media” (red circles).
In order to follow the growth curve of MmonRFPHyg in liquid cultures, single colonies were inoculated into 7H9 medium supplemented with hygromycin and the growth rate was measured following OD600 with time for over 150 h (Figure 1B; see Section 2). Attempts to estimate GT by drawing trend lines through the time points showed two distinct rates of exponential growth with GT = 5.3 ± 0.44 h during the early phase (Expo I) followed by a much slower exponential growth rate, GT = 22 ± 3.1 h (Expo II) as shown in Figure 1B (see Section 2). The early growth rate is similar to GT (5.1 ± 0.9 h and 5.9 ± 0.5 h for MmonRFPHyg and MmonT, respectively) for growth measured by cell counts on solid media (7H10; see Figure 1A). Upon longer incubation, the cultures appeared to reach stationary phase at OD600 ~3 (Figure 1B and Figure S2A). The bi-phasic growth could be attributed to the following: (i) depletion of a preferred nutrient such as carbon source resulting in a diauxic growth curve; (ii) accumulation of inhibitor(s) in the medium (after a critical concentration is reached) that reduced the growth rate; (iii) cell density-dependent quorum sensing; or (iv) inherent growth phase dependent heterogeneity in cell size/shape [52,53,54,55,56,57,58]. To distinguish between these possibilities, we tested several growth conditions for MmonRFPHyg including fresh inoculation into “spent” media from Expo II phase cultures, cultivation of “Expo II-cells” in fresh media, addition of fresh carbon sources (glycerol or Tween 80) and different dilutions of “Expo II-cells” (for details, see Section 2).
Addition of glycerol or Tween 80 to Expo II cultures did not change the growth rate. Therefore, the transition from Expo I to Expo II cannot be attributed to depletion of these carbon sources [scenario (i); Figure 1C; Table S3]; however, we cannot rule out that other carbon sources in the 7H9 media such as dextrose, which is present in the growth supplement Oleic Albumin Dextrose Catalase (OADC), might have an impact, but see below. Cells in the Expo I-phase continued to grow with “Expo I-growth rates” irrespective of the media added (filtered media from the Expo II-cultures, “spent media”, or addition of fresh media; Figure 1D and Table S3; see Section 2). Moreover, filtered and washed “Expo II-cells” continued to grow with “Expo II-rates” when inoculated into “fresh media” or re-suspended in the same filtered “Expo II-media” (with no apparent change in cell density; Figure 1D). These findings suggested that alternative (ii) is unlikely to be the reason for the slower “Expo-II growth rates”. This also suggests that depletion of carbon source may not be a factor causing the bi-phasic nature as re-suspension of Expo II cells in fresh media (complete media with all carbon sources) did not result in the Expo I growth rates. When “Expo II-cells” were re-suspended into “fresh” or “spent media” (see above) at the same cell density, the growth rates were similar to the “Expo II-rates”. However, when “Expo II-cells” were diluted 1000-fold, with “fresh” or “spent media”, the growth rate returned to “Expo I-growth rates” (similar results were obtained using cells from the Expo I-phase; Table S3). Thus, any role of the altered composition of the culture medium with growth, either depletion of nutrients or a rise in the level of toxins released by the cells, could be ruled out as the reasons for the bi-phasic nature of the growth curve. Rather, the increase in cell density as the culture grew appeared to be the regulating factor altering the cell shape and size, suggesting the possibility of high cell density-dependent control of cell size heterogeneity in the cell population as the probable reason for the observed bi-phasic growth pattern. The involvement of a cell-density-associated quorum-sensing signal in causing the transition from rod-shaped to coccoid cells seems to be a possibility.
To further investigate the bi-phasic exponential growth shown by MmonRFPHyg we analysed the growth pattern of the RGM M. boenickei (type strain DSM44677; referred to as MboeT) for which our data show similar results as MmonRFPHyg (Figure S2B,C) along with variations in cell shape as observed in MmonT and MmonRFPHyg cultures (see below). The GT for MboeT growing in the Expo I phase was estimated to be 3 ± 0.1 h, while for cells in Expo II it was 11.7 ± 0.9 h. The addition of a carbon source (Tween 80 or glycerol) did not change the GT, nor did re-suspension (Figure S2C), which is similar to the findings for MmonRFPHyg grown in liquid media. Hence, the apparent bi-phasic pattern of the growth curve estimated from absorbance is not specific to MmonRFPHyg; rather, it might be a common growth pattern among mycobacteria. Thus, we entertain the idea that inherent cell size heterogeneity in growing cell populations might be a common characteristic and plausible reason for bi-phasic growth pattern among mycobacteria.
3.3. Variation in Cell Morphology in Ageing Cultures
To further understand the nature of the bi-phasic growth pattern we followed the cell shape distribution of MmonT and MmonRFPHyg after growth on 7H10 (solid) media at 37 °C for 2, 8, 14 and 30 days by microscopy. MmonT cells were stained for membrane (FM4-64) and DNA [DAPI (4′,6-diamidino-2-phenylindole)], while MmonRFPHyg was stained with mitochondria tracking green (MTG), which stains outer as well as internal membranes [59], and DAPI (see Section 2). For each sample, we sequenced 16S rDNA as an additional control to rule out contaminations.
Three different cell morphologies were observed when viewed under the microscope (Figure S3A): rods, coccoids and cells that appeared Phase Grey or phase Bright (PGB). The average cell sizes, measured for a minimum of 100 cells for each morphology type, were as follows: rods, 1.8 ± 0.31 µm (including both short rods of average length 1.6 ± 0.26 µm and longer rods of average length 1.9 ± 0.3 µm) and coccoids with 0.8 ± 0.19 µm diameters. This provided a qualitative basis for distinguishing between the different morphologies. For simplicity, rod-shaped cells detected in old cultures, although they were shorter than the exponentially growing rods, were still considered under the “rods” category.
At early stages of growth (1–2 days), the larger fractions of MmonT and MmonRFPHyg cells were rod-shaped, closely followed by coccoid-shaped cells (Figure 2A–D). After three days, we detected increasing appearance of coccoid shaped cells while the cells classified as PGB started to appear at later time points (after eight days). The different time points were chosen based on their relevance to the growth phase as shown in Supplementary Figure S3B. Thus, time points from 1 to 3 days belonged to the exponential growth phase and the rest of the time points were different stages in the early (5–8 days) and late stationary phase (14 days and beyond).
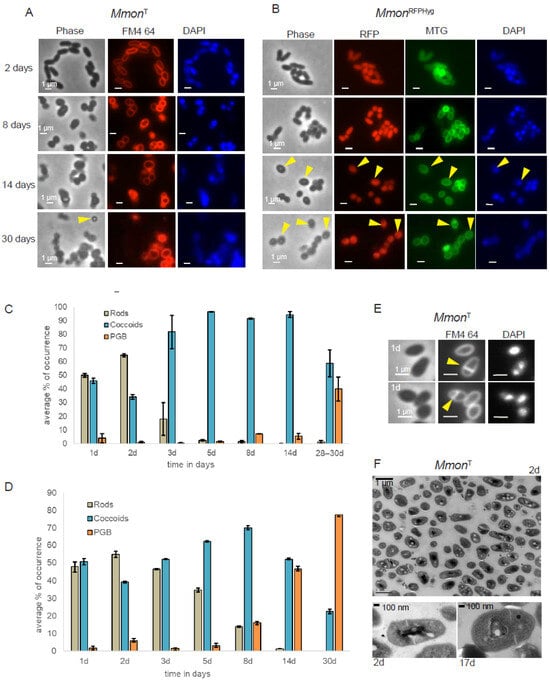
Figure 2.
Microscopy of MmonT and MmonRFPHyg grown on 7H10 media and 37 °C. (A) Cells stained with FM4-64 (red) and DAPI (blue). Yellow arrows represent the PGB morphologies observed at different time points. Scale bar = 1 µm. (B) MmonRFPHyg cells expressing RFP (red) stained with MTG (green) and DAPI (blue). Yellow arrows indicate the PGB cell morphology. Scale bar = 1 µm. (C,D) Statistical representation of average percentage of occurrence of the various cell morphology types, MmonT (C) and MmonRFPHyg (D). A minimum of 350 cells were analysed for each time point. “d” = number of days. (E) One day old MmonT cells (rods and coccoids, yellow arrows mark the division site) stained with FM4-64 and DAPI depicting asymmetric septum formation (see top panel). Scale bar = 1 mm. (F) TEM image of a two days old culture showing dividing cells in the top panel. The bottom panel shows a TEM image of 2 and 17 days old coccoid MmonT cells showing asymmetric division sites. For each time point and condition, a minimum of 350 cells were counted. Error bars represent standard deviation. Plots represent the final averages of percentage of occurrence (see Section 2 for details).
A heterogenous cell population of rods and coccoids was also observed when MmonT cells were examined by transmission electron microscopy, TEM. For MmonT, FM4-64 staining and TEM further suggested asymmetric septum formation (Figure 2E,F) in keeping with what has been reported for other mycobacteria [25,60,61,62,63,64]. Moreover, similar changes in cell shapes as a function of time were also detected when cultivated on solid mG medium (Figure S4A,B). However, the frequency of distribution in mG medium pertaining to PGB structures differed from growth on 7H10 medium, MmonT (Figure S4A) and MmonRFPHyg (Figure S4B). We emphasise that a change from the rod shape to coccoid was also observed in MmonRFPHyg liquid cultures (7H9 medium; Figure S4C).
As for Mmon, the MboeT cell shape changed from rod to coccoid upon prolonged incubation on 7H10 medium at 37 °C, and PGB cells were observed after 14 days of incubation (Figure S4D). The apparent change in the average cell size was also detected in liquid MboeT cultures (7H9 medium; Figure S4E). We conclude that these two mycobacteria change their cell shape upon ageing, as reported previously for other mycobacteria (see e.g., [33] and the refs. therein).
3.4. Spore-like PGB Structures in M. monacense Culture
Micrographs of MmonT and MmonRFPHyg showed the appearance of the PGB structures at later stages of growth (Figure 2A,B; yellow arrows). One month old cultures of MmonT grown on 7H10 solid media at 37 °C, which had the highest frequency of PGB (Figure 2C and Figure 3A), was examined by TEM. We observed “round-shaped” dark grey bodies that appeared to originate from “mother” cells, since some of the structures were partly surrounded by membrane-like structures resembling spore-like cells (Figure 3B; red arrows). Staining with FM4-64 visualised outer membranes while MTG also showed presence of internal structures (Figure 3C). Re-inoculation of cells from the month-old cultures on a fresh 7H10 medium resulted in growth and the re-appearance of rod-shaped cells with a decrease in the frequency of PGB structures (Figure 3D; see also Section 4). However, these PGB structures did not meet the requirements of endospores; they were neither heat resistant when subjected to wet-heat treatment at 65 °C, nor did they show presence of dipicolinic acid (DPA). At all different steps, we confirmed that we were studying Mmon by 16S rDNA gene sequencing. These data suggested that the Mmon spore-like PGB structures are different compared to Mmar and MAP spores [14,16].
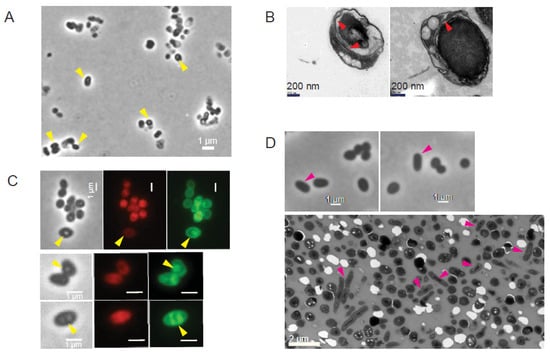
Figure 3.
Visualisation of old MmonT and MmonRFPHyg cells grown on 7H10 media at 37 °C by phase contrast and transmission electron microscopy as indicated. (A) Phase contrast microscopy of 28 days old MmonT cells after enrichment for spores (see Section 2). Yellow arrows mark refractive PGB cells. Scale bar = 1 mm. (B) TEM images of 28 days old MmonT cells after spore enrichment. Red arrows mark internal membrane structures. (C) Internal structures (yellow arrows) observed in PGB cells detected in old MmonRFPHyg cultures (48 days old, top row; 14 days old, middle and bottom rows). Cells were stained with MTG (green) while red is the result of the presence of rfp. Scale bar = 1 mm. (D) MmonT cells one week after growth of enriched PGB cells on fresh 7H10 media. Phase contrast microscopy (top panels; Scale bar = 1 mm) and TEM (bottom panel; Scale bar = 2 mm). Pink arrows mark appearance of rod-shaped cells, see (A) for comparison.
3.5. Genome Analysis of M. monacense
Several Mmon draft genomes and the complete genome of the type strain DSM44395 (MmonT; e.g., Bioproject id. PRJNA521103) are available (Figure 4A) [65,66]. As a complement to this, we sequenced MmonRFPHyg using PacBio technology with mean coverage of 74x. Whole-genome alignment of MmonT and MmonRFPHyg showed high similarity and confirmed the insertion of the rfp and hygR genes at the attB site. We used the two complete genomes (MmonT and MmonRFPHyg) and draft MmonT genome to map and identify genes associated with cell shape maintenance, cell division or development of the cell membrane.
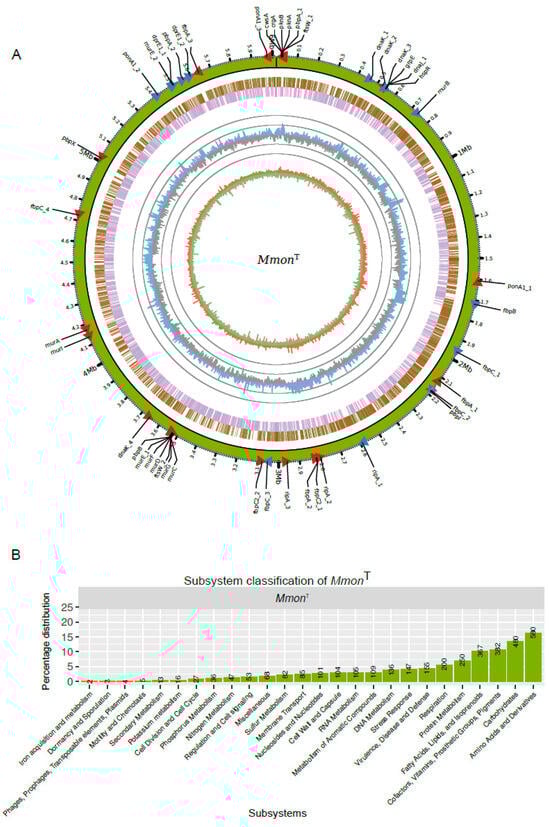
Figure 4.
MmonT genome and functional classification of genes. (A) Overview of the MmonT complete genome. From the outer to inner circle: Green track illustrates the genome overlapping with scale along the genome length and position of genes (red and blue arrow heads mark the direction of transcription) listed in Table S4. The next two circles represent genes in forward (brown) and reversed (purple) strands. The next circle shows the GC-content distribution calculated with a sliding window of 1000 bp, blue (higher than mean value) and grey (lower than mean value) “spikes” correspond to variations of the mean GC-content 68.4% in ±10 and ±20 units, i.e., outer grey circle = 88.4% and inner grey circle = 48.4%. The inner circle, red (positive) and green (negative) correspond to the GC-skew obtained using a sliding window of 1000 bp. Generation of circus plot, see http://circos.ca (last accessed on 9 July 2019). (B) Subsystem classification of 3557 MmonT genes as indicated.
The predicted number of genes in the complete MmonT genome was 5864, including 5772 coding sequences (CDS), 6 rRNAs (two rRNA operons), 47 tRNAs, 1 tmRNA, 1 RNase P RNA and 37 non-coding RNAs (see also [66]). Of the 5772 CDS, 3557 were functionally classified in at least one functional category (Figure 4B; see also e.g., [29,67]). Among functionally classified genes, a large fraction (1809 genes, ≈51%) were categorised in the “Amino acid and Derivatives”, “Carbohydrates”, “Fatty Acids, Lipids, and Isoprenoids” and “Cofactors, Vitamins, Prosthetic Groups, Pigments” subsystems while 155 (≈4.4%) genes were classified in the subsystem “Virulence, Disease and Defense” (for comparison, of 3906 CDSs almost 9% are classified as virulence genes in Mtb [67]).
Together, these data provide new insights into the biology of Mmon and as such might be of assistance for the identification of biomarkers that could be useful in developing diagnostic tools and new drugs targeting mycobacteria. With respect to the genes involved in cell wall synthesis and cell division, see below; their location on the chromosome is depicted in Figure 4A.
3.6. Analysis of Selected M. monacense Gene Transcripts at Different Growth Stages
Of the 3557 functionally classified genes in MmonT ≈3.7% were categorised into the subsystems “Cell Wall and Capsule” (104 genes) and “Cell Division and Cell Cycle” (27 genes; Figure 4B). This is comparable to other mycobacteria, see, e.g., Refs [29,33,67,68]. To analyse the mRNA levels at different growth stages we focused on selected genes with relevance to cell shape and as such might be involved in various stages of the formation of the peptidoglycan, septum, divisome complex and arabinogalactan (Table S4) [69,70,71,72,73,74,75]. The time points were chosen based on the frequency of occurrence of the different morphologies observed in order to have a more homogenous population (Figures S3B and S4F). Albeit coccoids occurred at all growth phases, the majority of cells were rods at early time points (exponential, i.e., 2 to 3 days), coccoids between 5 and 14 days and PGB structures at ≈1.5 months (48 days; for viability details of old cells see Figure S4G). Hence, we isolated total RNA from MmonRFPHyg cells at different growth stages, determined mRNA levels by RNASeq (see Section 2) and mapped the transcripts to the MmonT complete genome. On the basis of the log2-fold change (Table S3), mRNA levels for the majority of genes involved in formation of cell wall components were higher in exponentially growing cells compared to mRNA levels detected in cells from old cultures (14 and 48 days; Figure 5A–C; Table S4): cell envelope genes, ftsW_1, pbpB, pbpI, ripA_1, ripA_3, fbpA_1, fbpA_2, fbpC_3 and dprE1_2. The mRNA levels for some gene transcripts, cwsA, fbpC_4 and fbpC2_1, were higher in cells from older cultures while those for ponA1_1 and dprE1_1 increased initially with age followed by a reduced level in 48 days old cells (Figure 5A–C; Table S4). For ftsZ and wag31 (a divIVA homologue [71]) we detected lower mRNA levels in old cells compared to cells growing exponentially as would be expected (Table S4). Noteworthy, we cannot distinguish whether the change in mRNA levels is due to transcription/expression or degradation (but see Section 4).
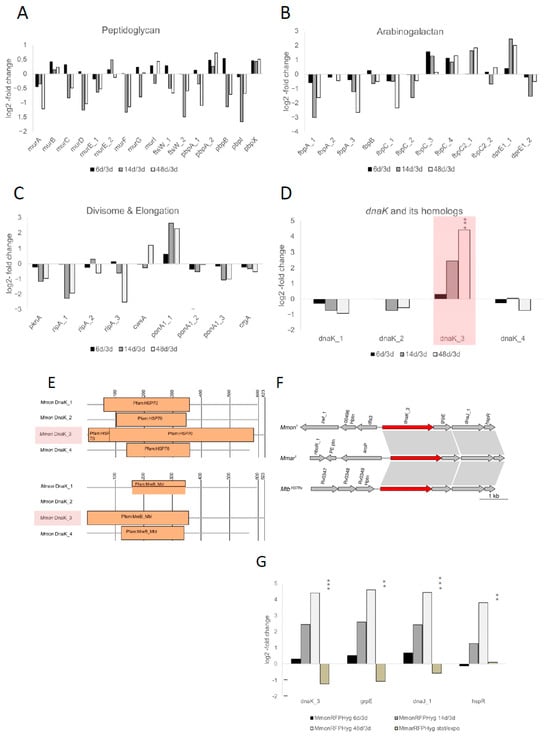
Figure 5.
Analysis of mRNA levels of selected genes and dnaK paralogs in MmonT. (A–D) Change in mRNA levels as indicated comparing MmonRFPHyg cells of different ages (6, 14 and 48 days) relative to 3 days old cells. The changes are expressed as log2-fold change and the selected genes were grouped as indicated. (A) Peptidoglycan-associated genes, (B) divisome- and elongation-associated genes, (C) arabinogalactan-associated genes and (D) dnaK homologs, the highlighted bars correspond to the change observed for dnaK_3. (E) Illustration of the domain architecture of the four DnaK proteins in MmonT. Along with the expected Hsp70 domain, DnaK_3 (highlighted) is suggested to carry a MreB-Mbl domain while the other three lack this element. Notably, according to the Pfam database the average length of MreB-Mbl proteins encompass 313 amino acids. (F) Gene synteny for dnaK_3, grpE, dnaJ and hspR in MmonT, MmarT and MtbH37Rv. The arrows represent the genes as indicated. (G) Change in DnaK_3, GrpE, DnaJ and HspR mRNA levels expressed as log2-fold change as indicated. For MmonRFPHyg, mRNA levels at different time points (6, 14 and 48 days of growth) relative to levels in exponentially growing cells (3 days of growth). In the case of MmarRFPHyg mRNA levels in exponentially growing cells (OD600 = 0.5) compared to levels in stationary cells (OD600 ≈ 3). Statistical significance, ** p < 0.01; *** p < 0.001.
Mycobacteria are equipped with several serine threonine protein kinases, STPKs, and among these, pknA and pknB influence cell morphology [70,76]. For MmonT, 18 were annotated as STPK genes and four among these lack the kinase domain (Table S4); the mRNA levels for most of these were either lower in cells in older cultures or did not vary significantly between the growth phases of MmonRFPHyg (6 d, 14 d, 48 d; Figure S5 and Table S4). For pknA, the mRNA level is higher in exponential cells in keeping with what has been reported for Mtb [70], while for pknB_1 (positioned adjacent and downstream of pknA), we did not detect any significant change in the mRNA level. Moreover, the transcripts of pknK and one of the annotated pknH copies, pknH_5 (which lacks the kinase domain) were higher in the stationary phase than in the exponential phase (Figure S5; Table S4). The function of pknK is not well-established although it has been shown to be higher during stationary phase and may be linked to secondary metabolite metabolism [77,78]. The pknH is known to be involved in the regulation of the embCAB operon, which encodes the membrane-associated ethambutol target arabinosyl transferase (EMB), and might control intracellular bacterial growth during infection [79,80,81,82,83,84]. Finally, we detected a significant increase in dnaK_3 mRNA levels, from 0.31-fold (log2) in exponential phase (6 vs. 3 days) to 2.5- and 4.4-fold (log2), in 14 and 48 days old MmonRFPHyg cells (Figure 5D; see below).
3.7. Identification of an MreB Homolog Within DnaK_3
A protein BLAST homology search (BLASTp) revealed that the Streptomyces coelicolor MreB (SCO2611) is ~30% identical with ~56% query coverage to that of Mmon DnaK3 (MMONDSM_00498; dnaK_3Mmon). On the basis of protein domain similarity to the MreB-like domain MreB_Mbl, this raises the possibility that dnaK_3 might function as an mreB homolog (Figure 5E; see Section 2). The actin homolog MreB is involved in attributing and controlling the rod shape of cells in both Gram-negative and Gram-positive bacteria, e.g., Escherichia coli, Caulobacter crescentus and B. subtilis [85,86,87,88,89]. Specifically, MreB_Mbl proteins are constituents of the bacterial cytoskeleton and have mainly been reported for rod-shaped cells, the MreB_Mbl proteins/mreB or mreB-like genes have not been identified in coccoid species or in mycobacteria [10,60,90]. In this context, it should be mentioned that the MreB inhibitor A22 [91] prevents growth of both MmonT and MboeT, which makes it tempting to speculate that the MreB domain of DnaK_3 might influence cytoskeletal functions essential for viability of MmonT and MboeT. However, the possibility that the MreB-like function is provided by some yet unknown protein cannot be ruled out.
DnaK is a well-known heat shock chaperonin with a Hsp70 protein domain [92,93], and its N-terminal domain shows MreB_Mbl domain architecture homology also in some other bacteria (Figure S6A). Moreover, E. coli dnaK mutants were found to affect (directly or indirectly) cell shapes and division [94,95,96,97,98]. The mycobacterial dnaK_3 gene is localised together with the nucleotide exchange protein gene, grpE, the chaperone dnaJ_1, and the transcriptional repressor hspR (Figure 5F) [92,99]. The mRNA levels for these transcripts also showed increments parallel to that of dnaK_3 with ageing (Figure 5G; Table S4) suggesting that dnaK_3, grpE, dnaJ_1 and hspR constitute a transcriptional unit in keeping with previous findings, see, e.g., ([100,101] and the Refs therein).
Three additional genes were annotated as dnaK in the MmonT genome, dnaK_1, dnaK_2 and dnaK_4. We therefore included these in the transcriptome analysis. However, in contrast to DnaK_3, these proteins either lack the MreB-Mbl domain (DnaK_2) or did not have a complete MreB-Mbl domain (DnaK_1 and DnaK_4), which encompasses 355 amino acids in DnaK_3 (Figure 5E; based on the Pfam database the average length for MreB_Mbl domains is ≈313 amino acids and for DnaK_1 and DnaK_4 ≈ 200 amino acids are present that relate to the MreB_Mbl domain). Comparing the transcript levels for the dnaK homologs in MmonRFPHyg revealed that the mRNA level for dnaK_3 increased upon ageing, 2.5- and 4.4-fold dependent on ‘age’ (log2; see above), while dnaK_1, dnaK_2 and dnaK_4 mRNA levels were marginally higher in exponentially growing cells relative to older cells (Figure 5D; Table S4).
3.8. Expression of dnaK_3Mmon in M. marinum Resulted in a Transient Change in Cell Morphology
Morphological changes correlated with increased dnaK_3 mRNA levels upon ageing of the cell culture. Hence, to examine whether overexpression of dnaK_3 affect cell morphology we cloned dnaK_3Mmon in plasmid pBS401 behind the inducible tetracycline (tet) promoter. The resulting plasmid (pBS401-dnaK_3Mmon) was introduced in MmonT. However, we were unable to obtain any transformants after several trials, suggesting that an increase in copy number of dnaK_3Mmon is probably lethal to MmonT.
Since we could not overexpress dnaK_3Mmon in MmonT, we tried to introduce the pBS401-dnaK_3Mmon construct into the rod-shaped M. marinum CCUG20998 type strain (MmarT, see Section 2) to investigate whether a higher dnaK_3Mmon expression affected the MmarT cell morphology. The MmonT DnaK_3 protein is 94% identical to MmarT DnaK_3 (gene identity CCUG20998_00587 [66]) and the gene synteny of the dnaK_3 transcriptional units in these two mycobacteria are identical pertaining to grpE, dnaJ and hspR (Figure 5F).
First, the natural frequencies of appearance of the various cell morphotypes in MmarT was compared with that of MmonT (see below) as control. For this purpose, a red fluorescence-tagged MmarT strain [41], similar to MmonRFPHyg, was used and is referred to as MmarRFPHyg (see Table S2). The transformation of MmarRFPHyg with pBS401-dnaK_3Mmon was successful. The resulting strain, MmarpBS401-dnaK3Mmon, was examined for patterns of morphotype variations with growth, which appeared to be opposite to the pattern for MmonRFPHyg: MmarRFPHyg showed higher frequencies of PGB cells during the early time points (Figure 6A) contrary to the pattern observed in MmonRFPHyg (Figure 2). Consistently, the dnaK_3 mRNA transcript levels in the two species with respect to growth phase differed, with an increase in ageing MmonRFPHyg cells while a decrease was detected in MmarRFPHyg (Figure 5G).
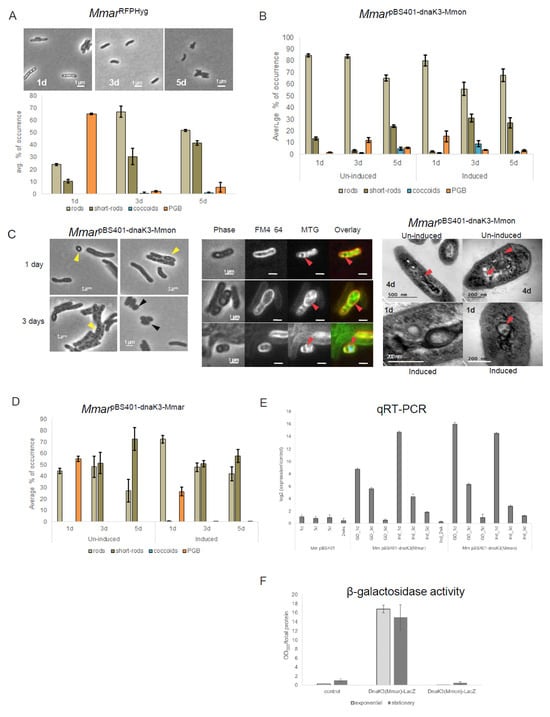
Figure 6.
Analysis of the over-expression of dnaK_3Mmon and dnaK_3Mmar in MmarT. (A) Represents time course microscopy of MmarRFPHyg (top panel) with the corresponding average frequencies of occurrence of the different cell morphotypes (bottom panel). Scale bar = 1 mm. (B) Statistical distribution of the different cell morphologies in MmarpBS401-dnaK3Mmon (un-induced and induced conditions) observed in the cell cultures. (C) Staining and microscopy of samples corresponding to (B). Left panel: microscopy of MmarpBS401-dnaK3Mmon at two time points (1 day and 3 days) exhibiting occurrence of PGB cells (yellow arrows) and coccoids (black arrows) under un-induced condition. Scale bar = 1 mm. Middle panel: MTG and FM4-64 staining of MmarpBS401-dnaK3Mmon cells showing internal membrane formation and compartmentalisation (red arrows). Scale bar = 1 mm. Right panel: TEM images of 4 days old MmarpBS401-dnaK3Mmon cells (un-induced and after 24 h induction). Red arrows mark the internal membrane formation and presence of internal structures. All cultures were grown on 7H10 media supplemented with hygromycin (100 μg mL−1) at 30 °C. (D) Statistical distribution of the different cell morphologies in MmarpBS401-dnaK3Mmar (un-induced and ‘Tet’ induced conditions) observed in the cell cultures. (E) Expression of dnaK_3Mmon carried on pBS401 in MmarT as determined by qPCR. Cell extracts from three different time points (1 day, 3 days and 5 days) with and without tetracycline induction were considered, “d” = days. The log2-fold change was normalised to the “1 day-induction”. (F) Analysis of the expression of DnaK_3Mmar and DnaK_3Mmon in MmarT by β-galactosidase assay. β-galactosidase activity (DnaK_3-LacZ fused protein) upon addition of the CPRG substrate with (substrate) was measured using a spectrophotometer at 595 nm. The measured absorbance normalised with the total protein content for each sample as shown in the plots. The samples were protein extracts from Mmar cells carrying pIGN vector with dnaK3Mmar-lacZ or dnaK3Mmon-lacZ. The empty vector was used as control (see Section 2 for details). The numbers represent an average based on two independent experiments (round 1 and round 2) with two biological replicates.
Microscopy and statistics of the different cell morphotypes showed a decrease in the frequency of PGB structures after 24 h incubations (Figure 6B, un-induced) compared to the control (MmarRFPHyg; Figure 6A bottom panel). Upon “tet-induction” however, there seemed to be a transient increase in the frequency of PGB cells (up ≈ 15%) compared to the un-induced condition (Figure 6B). Compared to MmarRFPHyg the overall frequency of PGB cells decreased in MmarpBS401-dnaK3Mmon irrespective of induced or un-induced conditions. Thus, the increased transcription of dnaK_3Mmon in MmarRFPHyg resulted in a decrease in the frequency of PGB cells. As shown in Figure 6C, phase contrast microscopy (Figure 6C, left panel) and MTG staining of cells from these cultures (Figure 6C, middle panel) indicated formation of internal membrane structures. Examination of the MmarpBS401-dnaK3Mmon cells with TEM also showed and confirmed the appearance of internal membrane structures (Figure 6C, right panel). Introduction of an “antisense-dnaK_3Mmon” (MmarpBS401-antidnaK3Mmon) targeting the chromosomal dnaK_3Mmar gene in MmarT did not result in such changes in cell morphology (Figure S6B) and appeared similar to MmarRFPHyg (Figure 6A). Moreover, a plasmid carrying dnaK_3Mmar behind a ‘Tet’-inducible promoter (pBS401-dnaK3Mmar) in MmarT (MmarpBS401-dnaK3Mmar; Figure 6D), showed similar patterns of morphological variations as seen for MmarpBS401-dnaK3Mmon under tet-induced/un-induced condition with a decrease in the frequency of PGB cells (cf. Figure 6B,D). Thus, a reduction in the frequency of PGB cells in response to over-expression of either dnaK_3Mmar or dnaK_3Mmon (induced condition) in MmarT was consistent.
The dnaK_3Mmon and dnaK_3Mmar transcript levels in MmarpBS401-dnaK3Mmon and MmarpBS401-dnaK3Mmar, respectively, were verified by qRT-PCR (see Section 2). As a control, we determined the dnaK_3Mmar (chromosomal) mRNA levels in the MmarpBS401 strain (see Table S2). These data showed that both dnaK_3Mmon and dnaK_3Mmar mRNA levels were higher at the early time point (Figure 6E, 1 d time point) both under un-induced and ‘Tet’-induced conditions followed by a decrease upon prolonged incubation. This revealed that plasmids carrying dnaK_3Mmar or dnaK_3Mmon were transcribed in Mmar. In addition, these changes in transcript levels correlated with the differences in the frequency of appearance of PGB cells discussed above (un-induced and induced conditions; Figure 6B,D). Continued incubation/induction beyond four to five days did not change the frequencies of different cell morphologies significantly, nor did we observe such transient changes in the controls (Figure S6C).
Taken together, these data support the speculation that dnaK_3 might indeed have an influence on cell morphology, although it is unclear how, and may be considered to possess an MreB-like function in modulating cell shape and/or size (see also Section 4).
3.9. Difference in dnaK_3Mmar and dnaK_3Mmon Expression in M. marinum
In contrast to MmonRFPHyg, mRNA levels of dnaK_3 in MmarRFPHyg were higher at exponential phase when compared to stationary phase (Figure 5G and Table S4, in 48 days old MmarRFPHyg cultures dnaK_3 mRNA levels were higher than in exponentially growing cells) suggesting different regulatory pathways of the dnaK_3 expression in the two species.
To verify this, dnaK_3Mmar-lacZ and dnaK_3Mmon-lacZ fusions including ≈250 bps of the respective upstream regions were generated using the pIGn plasmid (see Section 2; Table S2). These constructs were introduced into MmarRFPHyg and we determined β-galactosidase activities in exponentially growing and stationary cells. As shown in Figure 6F we did detect β-galactosidase activity for the dnaK_3Mmar-lacZ construct while for the dnaK_3Mmon-lacZ construct resulted in no activity relative to the controls. This indicated differences in the expression of DnaK_3Mmar and DnaK_3Mmon in MmarRFPHyg irrespective of growth phase. This difference in the basal levels of DnaK_3 expression could be part of the reason to the inverse correlation patterns between cell morphology and DnaK_3 expression in Mmar and Mmon.
3.10. Identification of Putative Promoters, Sigma Factors and Regulatory “Elements”
Comparison of the upstream regions (300 bps) of the dnaK_3Mmon, dnaK_3Mmar and dnaKMtbH37Rv revealed putative sigma factor binding sequences. SigH was reported to regulate the expression of dnaK in Mtb [102]. On the basis of this and sequence similarity comparing the upstream regions, we predict that SigH is also involved in regulating dnaK_3 expression in both MmonT and MmarT (referred to as SigHP1; Figure S7). In this context, in E. coli suppressors of a mutant lacking dnaK map in rpoH, the heat shock specific sigma factor [97].
Further analysis indicated that transcription of dnaK_3Mmon might involve several sigma factors SigE, SigG, SigH and SigM and possibly also SigB (see Supplementary Materials and Figure S7). The putative dnaK_3Mmar promoter region included possible SigD, SigE, and SigH binding sequences where SigE and SigH being common to both of dnaK_3Mmon and dnaK_3Mmar. We also predicted other regulatory regions upstream of dnaK_3 such as putative binding sites for the transcription repressor HspR, HAIR (HspR associated inverted repeat) [99] and two CRP binding sites (catabolite repressor protein; see also Supplementary Material and Table S5) [103,104]. In this context, we also identified putative binding sites for RegX (see e.g., [105]) upstream of dnaK_3 in MmonT (Figure S7). Our RNASeq data for MmonRFPHyg showed an increase in senX3 and regX3 mRNA levels over time in MmonT in contrast to MmarT where the levels of these transcripts did not change with growth phase (Figure S8).
For MmonRFPHyg, RNASeq data showed increased mRNA levels for some sigma factors, e.g., SigG, SigH2 and in particular SigL2 in late stationary cells (48 days old cells), while for SigB, SigE and SigM the mRNA levels did not vary much with time (Figure S9A–G). Further comparison of sigma factor mRNA levels in MmonRFPHyg and MmarRFPHyg (Figure S9A–J; note that Figure S9H–J correspond to Figure S5A–C in Ref [62] and were included for comparison) revealed that in exponentially growing MmarRFPHyg cells almost 40% of the total sigma factor mRNA transcripts is represented by SigA mRNA. Reaching stationary phase SigA mRNA level is reduced while the fraction of SigB and SigE transcripts increased and together represent ≈80% (Figure S9; see also [41,67]). In contrast, the fraction of SigB and SigE mRNAs for MmonRFPHyg is already high (≈45%) after three days of growth, while SigA mRNA is significantly lower (Figure S9D–G; for details, see also Figure S10).
Taken together, these findings emphasise similarities but also differences that might rationalise the divergent expression of dnaK_3 in MmonT and MmarT. Furthermore, comparing the RGM Mmon and SGM Mmar suggested that the sigma factor mRNA levels vary depending on mycobacterium indicating differences in the regulation of sigma factor genes in response to changes in growth conditions, which likely will have an impact on the expression of other genes including dnaK_3. In addition, the presence of multiple sigma factor binding sites in the upstream region of dnaK_3 might reflect control of its expression in response to diverse environmental stress signals.
4. Discussion
Mmon is described as an “acid fast bacillus” belonging to the rapid growing mycobacteria, RGM [17]. A handful of reports on clinical isolates of Mmon exist [18,19] but a detailed account of the link between cellular morphology and its life cycle is missing. Therefore, to obtain insights into the life cycle of an RGM we have characterised the Mmon complete growth cycle focusing on cell morphology, growth characteristics and gene expression patterns at different growth phases. While the size and pigmentation of colonies did not vary much in different solid media, the impact of media was more dramatic when we attempted to grow MmonT in liquid media (Table 1 and Figure S1). A well-dispersed, measurable growth in liquid media with reproducible doubling time of about 5 h could be obtained for MmonT only when the hygromycin B resistance gene was introduced into the cells (Figure 1 and Table 1; growth of MmonRFPHyg in liquid 7H9 medium without hygromycin B resulted in a clumped and undispersed growth. Although the ribosome is the major target for hygromycin B (or its metabolic degradation products) in the bacterial cell leading to inhibition of growth [106], it is unclear how this could enable growth of MmonRFPHyg in liquid media (but see [51]). Furthermore, monitoring growth in liquid media by absorbance showed two distinct rates of exponential growth, a ‘fast’ and a ‘slow’ phase with generation times of ≈5 h and ≈22 h, respectively. Similarly, bi-phasic growth in liquid culture was also detected for the RGM MboeT (Figure S2B), suggesting that it is not unique for the RGM Mmon.
4.1. Variation in Cell Shape and Growth Phase
The possibility of reduced growth rate due to depletion of nutrients or accumulation of growth inhibitors in ageing cultures was discounted from resuspension experiments (see Section 3). But cell density in the culture appeared to be critical since growth rates could be adjusted by the cell density levels. Since growth on solid media, as measured by CFU, did not appear to suggest a bi-phasic growth pattern, changes in cell shape and/or size with age causing a shift in absorbance resulting in the observed bi-phasic growth in liquid media seemed plausible. Since coccoid shaped cells scatter light differently compared to rods [23] an increasing population of coccoid cells may manifest as apparent reduction in turbidity measurements and hence bi-phasic growth.
Genotypically clonal mycobacterial cells are known to exhibit phenotypic heterogeneity that is reflected in cell size, among other characteristics [25,61]. Transition from rod to coccoid or to smaller rods has been observed in mycobacteria isolated from infected cells or organs [107,108]. Nutrient starvation or microaerobic conditions have been reported to result in rod to coccoid transitions in laboratory cultures (liquid media/agar plates) [109]. Such a change in morphology has been associated with rise in the intracellular level of (p)ppGpp in M. smegmatis [110]. Also, reduction in size in stationary phase cells has often been attributed to division without growth undertaken by the bacterial cell as an adaptive measure against nutritional deprivation [111,112]. In the present study, however, MmonT/MmonRFPHyg cells showed a heterogenous population of cells with different cell shapes. A shift in the frequency of occurrence from rods to coccoids as early as 3 days was observed, while the cells were still in their exponential growth phase (Figure 2 and Figure S3B), suggesting factors other than stress or ageing as the cause for such natural pleomorphism. The cause for such a change from rod-shaped cells to coccoids (Figure 2) in MmonT/MmonRFPHyg with increasing cell density is however, not clear. Moreover, the rod to coccoid transition in MmonRFPHyg with increasing cell density was reversed by dilution to the original cell density with either ‘fresh’ or ‘spent media’ (Table S3) apparently without any help from factors released into media with ageing. How higher cell density generates this signal is not clear and whether such signalling is mediated through stringent control remains to be investigated.
The distribution of diverse cell types at different stages of growth from 2 to 30 days in MmonT and MmonRFPHyg are shown in Figure 2 [MboeT (Figure S4D)]. Despite their appearance in phase microscopy, the PGB cells did not demonstrate heat resistance or DPA-content. However, use of membrane-specific stains (FM4-64 and MTG) and TEM revealed internal membrane structures and compartmentalisation (Figure 3). In addition, endospore staining (Schaeffer–Fulton stain) of cells from old cultures also indicated the possibility that these refractive structures could be endospore-like structures (Figures S11 and S12), supporting the possibility that mycobacteria such as Mmon might have evolved a pathway to undergo a transition from standard rods to more spherical/coccoid and/or spore-like PGB cell shapes. This pathway would be different from the well-known endosporulation process in Firmicutes, spore formation in Actinobacteria such as Streptomyces spp., and in the SGM MmarT and M. avium subsp. paratuberculosis in response to various stress/growth conditions [14,16,113,114,115,116].
4.2. M. monacense Genes Involved in Cell Division, Cell Shape Maintenance, Peptidoglycan Formation and Other Membrane/Cell Wall Related Functions and Their mRNA Levels
Based on the complete MmonT (and MmonRFPHyg) genome we annotated genes involved in cell division, cell shape maintenance, peptidoglycan formation and other membrane/cell wall related functions (Table S4). Our RNASeq data for MmonRFPHyg suggested lower mRNA levels in stationary phase than in exponentially growing cells for these genes with some PBP (Penicillin-Binding Protein) gene transcripts marginally higher. In contrast, the dnaK_3Mmon (MMON_00498) mRNA level increased upon ageing reaching a 4.4-fold (log2) higher level at 48 days (Figure 5D,G; Table S4). On the basis of protein domain similarity to Mbl (MreB-like protein; Figure 5E) we identified a domain in DnaK_3Mmon as an MreB homolog and as in other bacteria dnaK_3 is positioned upstream of grpE, dnaJ_1 and hspR both in Mmon and in MmarT (Figure 5F) [117,118,119]. Also, dnaK_3 from these two mycobacteria is well-conserved (94% identity). The MreB and Mbl proteins are involved in determining the cell shape in different bacteria such as E. coli and B. subtilis [85,86,120,121,122]. These proteins have been reported to interact with PBPs, FtsZ and Rod in these bacteria [122,123]. Moreover, E. coli dnaK mutants show defects in cell division, chromosome segregation and filamentous growth ([94,95,96,97]; for the effects in DdnaK Dtig double B. subtilis mutants see [98]). Studies of the chaperone DnaK in B. subtilis suggests that it is membrane associated and involved in cells’ recovery in response to certain stresses [124]. Moreover, higher levels of DnaK have been identified in germinating spores of Streptomyces granaticolor [125]. Data further suggest that DnaK has an essential, non-redundant role in cellular growth and protein folding in M. smegmatis [126]. Moreover, it appears that MtbDnaK binds to HspR when it is bound to HAIR (e.g., the HspR binding sites upstream of Mtb dnaK, which are also present upstream of dnaK_3 in MmonT and MmarT; Figure S7) and as such influence the regulation of the dnaK operon [101,127,128].
4.3. Cell Shape and Possible Role of the DnaK_3 Chaperone
Apart from MreB, many bacteria also code for DnaK and DnaJ-like heat shock proteins with MreB_Mbl protein domains in addition to the Hsp70 domain (Figure S6A). Mutations in such genes affect protein folding, temperature-sensitivity and growth rate to name a few [129,130,131]. Three-dimensional structure predictions and amino acid sequence motif comparisons of some functionally different proteins have shown that, despite their differences in function and low amino acid similarity, the folding of some proteins, e.g., DnaK/Hsp70, ParM, MreB and FtsA, are similar to that of actin proteins [132,133].
We could not successfully over-express the dnaK_3Mmon in MmonT, which might indicate that increasing the number of dnaK_3Mmon gene copies is lethal to MmonT. However, we provide data that show the introduction and expression of dnaK_3Mmon in MmarT correlated with changes in cell morphology raising a possible role (direct or indirect) for dnaK_3 in cell shape maintenance. The observed changes in cell morphology were transient with respect to coccoids and PGB cells, which was also true for the expression of dnaK_3Mmar in MmarT. Similar pattern of occurrence for PGB cells was observed when dnaK_3Mmar was over-expressed in MmarT; however, there seemed to be no impact on the coccoid cell shape. These changes in cell morphology were not observed when a plasmid carrying an antisense-dnaK_3 (pBS401antidnaK3Mmon) gene was introduced into MmarT (Figure S6B). In contrast to MmonRFPHyg, the dnaK_3Mmar mRNA (and grpE, dnaJ_1 and hspR) level is lower in cells in stationary phases compared to exponentially growing cells (Figure 5G; however, in late stationary cells, 48 days old cultures, we observed ≤1.3 log2-fold higher levels than in exponentially growing cells) and we observed many PGB cells during the early time points (1 day) after which the frequency decreases (Figure 6A). Together, the results indicate that dnaK_3 may be involved in cell shape maintenance indirectly or directly albeit, dnaK_3Mmar and dnaK_3Mmon appear to be regulated differently in these two mycobacteria (discussed below). We also emphasise that the MreB inhibitor A22 [91] prevented growth of both MmonT and MboeT.
These differences in the frequencies of occurrence of the various morphologies observed in response to dnaK_3Mmon vs. dnaK_3Mmar (behind ‘Tet’ inducible promoters) over-expression in MmarT suggests possible differences in the regulation of dnaK_3 expression. This is supported by our data suggesting that the expression of the native dnaK_3 MmarT and MmonT/MmonRFPHyg genes (with their respective upstream regions) fused to the lacZ gene differed when expressed in MmarT (Figure 6F). In keeping with this, our genomic analysis suggested that the dnaK_3 regulatory regions differ with respect to predicted promoter sequences in MmonT/MmonRFPHyg and MmarT; SigB, SigE, SigH, SigG and SigM promoters for MmonT, and SigD, SigE and SigH promoters for MmarT (Figure S7). Also, we observed variations in sigma factor mRNA levels upon ageing comparing MmonRFPHyg and MmarRFPHyg. It could be argued that the stability of the dnaK_3 mRNA in MmonT and MmarRFPHyg differ. However, our unpublished data suggest that the half-lives are similar, 5.6 ± 0.67 (MmonT) and 5.0 ± 0.81 (MmarRFPHyg) min (to be published elsewhere). Together, this indicates that the difference in the dnaK_3 regulatory region in these two mycobacteria might be the reason for the observed difference in the dnaK_3 mRNA levels in MmonRFPHyg and MmarRFPHyg as well as the appearance of a transient level of dnaK_3Mmon mRNA when introduced into MmarT. Nevertheless, with respect to documentations of mycobacterial cell morphologies at different growth stages and conditions with respect to dnaK_3 gene expression the data provide new insights and as such pave the way for deciphering the mycobacterial life cycle.
4.4. Concluding Remarks
The dnaK_3, grpE, dnaJ_1 and hspR constitute a transcriptional unit in the RGM Mmon and SGM Mmar, where dnaK_3 encodes for a chaperone belonging to a family of heat shock proteins. DnaK in, e.g., E. coli, has a key role in protein homeostasis. The grpE and dnaJ_1 encode for a nucleotide exchange factor and a co-chaperone, respectively, both having crucial functions in protein homeostasis while HspR represents a transcription repressor [93,134]. Both Mmon and Mmar carry several dnaK genes while Mtb has only one positioned in an operon together with grpE, dnaJ_1 and hspR [135]. It has been discussed that chaperones in Mtb, including DnaK, have moonlighting functions mainly related to virulence. For example, Mtb DnaK functions as a signalling molecule and in Lactococcus lactis DnaK binds the host cell invertase that subsequently influence its virulence [119,136,137]. Our findings that dnaK_3 might be a factor influencing cell morphology might be an additional example of a protein with moonlighting function in mycobacteria. However, at present we cannot exclude the possibility that the intracellular level of DnaK_3 affects the expression and/or function of other genes that are more directly responsible for the observed changes in cell morphology. In this context, E. coli DnaK is suggested to have a role in cell division and segregation and its deletion results in filamentous growth [95,97,138]. Moreover, DnaK is involved in the control and level of RpoS and RpoH (σ32) when E. coli is subjected to stresses such as heat shock and glucose starvation, and it binds to RpoH [139,140,141]. These scenarios might therefore also apply to mycobacteria.
In conclusion, our findings provide insights into the biology of M. monacense and the possible role of the chaperone DnaK_3. As such, they may be used in identifying biomarkers that could be useful in the process to develop diagnostic tools and new drugs targeting mycobacteria.
Supplementary Materials
The following supporting information can be downloaded at: https://www.mdpi.com/article/10.3390/microorganisms13030475/s1, Figure S1: Colony morphology of MmonT on different media; Figure S2: Growth curves for MmonT and MboeT; Figure S3: Classification of observed cell morphologies; Figure S4: Change in cell morphology in MmonT and MboeT cultures; Figure S5: Differential expression and percentage distribution of Serine Threonine kinases (STPKs) in Mmon; Figure S6: dnaK_3 analysis: protein domain architecture, controls for the observed morphology changes (statistics); Figure S7: Analysis of the dnaK_3 regulatory region; Figure S8: Differential mRNA levels of regX3 and senX3 in MmonRFPHyg and MmarRFPHyg; Figure S9: Sigma factor mRNA levels in MmonRFPHyg and MmarRFPHyg as a function of growth on 7H10 plates at 37 °C as determined by RNASeq; Figure S10: Genome-wide distribution of sigma factors in MmonRFPHyg and MmarRFPHyg; Figure S11: Microscopy images of Mmon (28 days old) cells stained with Malachite and Safranin; Figure S12: DAPI staining of MmonT cells; Table S1: Compilation of primers and probes used in this study; Table S2: Compilation of strains used in this work with their corresponding nomenclature; Table S3: Generation times (GT) for MmonRFPHyg grown on different media and conditions as described in Section 2; Table S4: Compilation of mRNA levels for selected genes in MmonRFPHyg at three different time points (6 days, 14 days and 48 days) relative to the levels in exponentially growing cells (3 days time point); Table S5: Compilation of predicted adenylate cyclase genes with their locus tags in MmonT and MmarT. Refs. [142,143,144,145,146,147,148,149,150,151,152,153,154,155,156,157] are cited in the Supplementary Materials.
Author Contributions
L.A.K. and S.D. conceived the study. M.R. performed the experiments. P.R.K.B. performed the bioinformatics computations and bioinformatics analysis. M.R. and B.M.F.P. isolated DNA and RNA for genome sequencing and RNASeq analysis. M.R., S.D., P.R.K.B. and L.A.K. analysed and interpreted the data. M.R., P.R.K.B., S.D. and L.A.K. wrote the manuscript. All authors have read and agreed to the published version of the manuscript.
Funding
The Swedish Research Council (M, grant VR-M 521-2012-1924), the Swedish Research Council for Environment, Agricultural Sciences, and Spatial Planning (FORMAS, grant 2012-492), and the Uppsala RNA Research Center (Swedish Research Council Linneus support, grant VR 349-2006-267) to L.A.K.
Institutional Review Board Statement
Not applicable.
Informed Consent Statement
Not applicable.
Data Availability Statement
The original contributions presented in this study are included in the article/Supplementary Material. Further inquiries can be directed to the corresponding author.
Acknowledgments
We acknowledged our colleagues for discussions. Sequencing was performed by the SNP&SEQ Technology Platform in Uppsala, which is part of the National Genomics Infrastructure (NGI) Sweden and Science for Life Laboratory, and PacBio sequencing at the Uppsala Genome Center. The SNP&SEQ Platform is supported by the Swedish Research Council and the Knut and Alice Wallenberg Foundation.
Conflicts of Interest
The authors declare no competing interests.
References
- Miller, F.R. The Induced Development of Non-Acid-Fast Forms of Bacillus Tuberculosis and Other Myco-Bacteria. J. Exp. Med. 1932, 56, 411–424. [Google Scholar] [CrossRef] [PubMed]
- Wyckoff, R.W.; Smithburn, K.C. Micromotion Pictures of the Growth of Mycobacterium phlei. J. Infect. Dis. 1933, 53, 201–209. [Google Scholar] [CrossRef]
- Wyckoff, R.W. Bacterial growth and multiplication as disclosed by micro motion pictures. J. Exp. Med. 1934, 59, 381–391. [Google Scholar] [CrossRef]
- McCarter, J.; Hastings, E.G. The Morphology of Mycobacteria. J. Bacteriol. 1935, 29, 503–513. [Google Scholar] [CrossRef] [PubMed]
- Vera, H.D.; Rettger, L.F. Morphological variation of the tubercle bacillus and certain recently isolated soil acid fasts, with emphasis on filtrability. J. Bacteriol. 1940, 39, 659–687. [Google Scholar] [CrossRef]
- Lack, C.H.; Tanner, F. The Significance of Pleomorphism in Mycobacterium tuberculosis var. hominis. J. Gen. Microbiol. 1953, 8, 18–26. [Google Scholar] [CrossRef] [PubMed]
- Csillag, A. Spore Formation and “Dimorphism” in the Mycobacteria. J. Gen. Microbiol. 1961, 26, 97–109. [Google Scholar] [CrossRef] [PubMed]
- Csillag, A. Development of form 2 mycobacteria on autoclaved Löwenstein-Jensen medium. Tubercle 1962, 43, 439–443. [Google Scholar] [CrossRef]
- Stewart-Tull, D.E.S. Occurrence of Dimorphic Forms of Mycobacterium phlei. Nature 1965, 208, 603–605. [Google Scholar] [CrossRef]
- Kirsebom, L.A.; Dasgupta, S.; Pettersson, B.M.F. Pleiomorphism in Mycobacterium. Adv. Appl. Microbiol. 2012, 80, 81–112. [Google Scholar] [PubMed]
- Velayati, A.A.; Farnia, P.; Masjedi, M.R.; Zhavnerko, G.K.; Merza, M.A.; Ghanavi, J.; Tabarsi, P.; Farnia, P.; Poleschuyk, N.N.; Ignatyev, G. Sequential adaptation in latent tuberculosis bacilli: Observation by atomic force microscopy (AFM). Int. J. Clin. Exp. Med. 2011, 4, 193–199. [Google Scholar] [PubMed]
- Brieger, E.M.; Glauret, A.M. Spore-like Structures in the Tubercle Bacillus. Nature 1956, 178, 544. [Google Scholar] [CrossRef] [PubMed]
- Anuchin, A.M.; Mulyukin, A.L.; Suzina, N.E.; Duda, V.I.; El-Registan, G.I.; Kaprelyants, A.S. Dormant forms of Mycobacterium smegmatis with distinct morphology. Microbiology 2009, 155, 1071–1079. [Google Scholar] [CrossRef] [PubMed]
- Ghosh, J.; Larsson, P.; Singh, B.; Pettersson, B.M.F.; Islam, N.M.; Sarkar, S.N.; Dasgupta, S.; Kirsebom, L.A. Sporulation in mycobacteria. Proc. Natl. Acad. Sci. USA 2009, 106, 10781–10786. [Google Scholar] [CrossRef] [PubMed]
- Shleeva, M.O.; Kudykina, Y.K.; Vostroknutova, G.N.; Suzina, N.E.; Mulyukin, A.L.; Kaprelyants, A.S. Dormant ovoid cells of Mycobacterium tuberculosis are formed in response to gradual external acidification. Tuberculosis 2011, 91, 146–154. [Google Scholar] [CrossRef]
- Lamont, E.A.; Bannantine, J.P.; Armién, A.; Ariyakumar, D.S.; Sreevatsan, S. Identification and characterization of a spore-like morphotype in chronically starved Mycobacterium avium subsp. paratuberculosis cultures. PLoS ONE 2012, 7, e306648. [Google Scholar] [CrossRef] [PubMed]
- Reischl, U.; Melzl, H.; Kroppendstedt, R.M.; Miethke, T.; Naumann, L.; Mariottini, A.; Mazzarelli, G.; Tortoli, E. Mycobacterium monacense sp. nov. Int. J. Syst. Evol. Microbiol. 2006, 56, 2575–2578. [Google Scholar] [CrossRef] [PubMed]
- Hogardt, M.; Schreff, A.M.; Naumann, L.; Reischl, U.; Sing, A. Mycobacterium monacense in a Patient with a Pulmonary Tumor. Jpn. J. Infect. Dis. 2008, 61, 77–78. [Google Scholar] [CrossRef] [PubMed]
- Taieb, A.; Ikeguchi, R.; Yu, V.L.; Rihs, J.D.; Sharma, M.; Wolfe, J.; Wollstein, R. Mycobacterium monacense: A Mycobacterial Pathogen That Causes Infection of the Hand. J. Hand Surg. 2008, 3, 94–96. [Google Scholar] [CrossRef]
- Lily Therese, K.; Gayathri, R.; Thiruppathi, K.; Madhavan, H.N. First report on isolation of Mycobacterium monacense from sputum specimen in India. Lung India 2011, 28, 124–126. [Google Scholar] [CrossRef] [PubMed]
- Shojaei, H.; Hashemi, A.; Heidarieh, P.; Hosseini, N.; Naser, A.D. Chronic Pulmonary Disease Due to Mycobacterium monacense Infection: The First Case from Iran. Ann. Lab. Med. 2012, 32, 87–90. [Google Scholar] [CrossRef][Green Version]
- Romero, J.J.; Herrera, P.; Cartelle, M.; Barba, P.; Tello, S.; Zurita, J. Panniculitis caused by Mycobacterium monacense mimicking erythema induratum: A case in Ecuador. New Microbes New Infect. 2016, 10, 112–115. [Google Scholar] [CrossRef] [PubMed]
- Stevenson, K.; Mcvey, A.F.; Clark, I.B.N.; Swain, P.S.; Pilizota, T. General calibration of microbial growth in microplate readers. Sci. Rep. 2016, 6, 38828. [Google Scholar] [CrossRef]
- Mutoji, K.N.; Ennis, D.G. Expression of common fluorescent reporters may modulate virulence for Mycobacterium marinum: Dramatic attenuation results from Gfp over-expression. Comp. Biochem. Physiol. C Toxicol. Pharmacol. 2012, 155, 39–48. [Google Scholar] [CrossRef] [PubMed]
- Singh, B.; Nitharwal, R.G.; Ramesh, M.; Pettersson, B.M.F.; Kirsebom, L.A.; Dasgupta, S. Asymmetric growth and division in Mycobacterium spp.: Compensatory mechanisms for non-medial septa. Mol. Microbiol. 2013, 88, 64–76. [Google Scholar] [CrossRef] [PubMed]
- Nakata, H.M. Effect of pH on intermediates produced during growth and sporulation of Bacillus cereus. J. Bacteriol. 1963, 86, 577–581. [Google Scholar] [CrossRef] [PubMed]
- Robinow, C.F. Observations on the structure of Bacillus spores. J. Gen. Microbiol. 1951, 5, 439–457. [Google Scholar] [CrossRef][Green Version]
- Lackner, P.; Beer, R.; Helbok, R.; Broessner, G.; Engelhardt, K.; Brenneis, C.; Schmutzhard, E.; Pfaller, K. Scanning electron microscopy of the neuropathology of murine cerebral malaria. Malar. J. 2006, 5, 116. [Google Scholar] [CrossRef]
- Das, S.; Pettersson, B.M.F.; Behra, P.R.K.; Ramesh, M.; Dasgupta, S.; Bhattacharya, A.; Kirsebom, L.A. The Mycobacterium phlei Genome: Expectations and Surprises. Genome Biol. Evol. 2016, 8, 975–985. [Google Scholar]
- Li, R.; Zhu, H.; Ruan, J.; Qian, W.; Fang, X.; Shi, Z.; Li, Y.; Li, S.; Shan, G.; Kristiansen, K.; et al. De novo assembly of human genomes with massively parallel short read sequencing. Genome Res. 2010, 20, 265–272. [Google Scholar] [CrossRef] [PubMed]
- Chin, C.-S.; Alexander, D.H.; Marks, P.; Klammer, A.A.; Drake, J.; Heiner, C.; Clum, A.; Copeland, A.; Huddleston, J.; Eichler, E.E.; et al. Nonhybrid, finished microbial genome assemblies from long-read SMRT sequencing data. Nat. Methods 2013, 10, 563–569. [Google Scholar] [CrossRef] [PubMed]
- Pettersson, B.M.F.; Behra, P.R.K.; Manduva, S.; Das, S.; Dasgupta, S.; Bhattacharya, A.; Kirsebom, L.A. Draft Genome Sequence of Saccharopolyspora rectivirgula. Genome Announc. 2014, 2, e01117-13. [Google Scholar] [CrossRef] [PubMed]
- Das, S.; Pettersson, B.M.F.; Behra, P.R.K.; Ramesh, M.; Dasgupta, S.; Bhattacharya, A.; Kirsebom, L.A. Characterization of three Mycobacterium spp. with potential use in bioremediation by genome sequencing and comparative genomics. Genome Biol. Evol. 2015, 7, 1871–1886. [Google Scholar] [CrossRef]
- Seemann, T. Prokka: Rapid prokaryotic genome annotation. Bioinformatics 2014, 30, 2068–2069. [Google Scholar] [CrossRef] [PubMed]
- Hyatt, D.; Chen, G.L.; Locascio, P.F.; Land, M.L.; Larimer, F.W.; Hauser, L.J. Prodigal: Prokaryotic gene recognition and translation initiation site identification. BMC Bioinform. 2010, 11, 119. [Google Scholar] [CrossRef]
- Lagesen, K.; Hallin, P.; Rødland, E.A.; Stærfeldt, H.-H.; Rognes, T.; Ussery, D.W. RNAmmer: Consistent and rapid annotation of ribosomal RNA genes. Nucleic Acids Res. 2007, 35, 3100–3108. [Google Scholar] [CrossRef]
- Lowe, T.M.; Eddy, S. tRNAscan-SE: A program for improved detection of transfer RNA genes in genomic sequence. Nucleic Acids Res. 1997, 25, 955–964. [Google Scholar] [CrossRef]
- Nawrocki, E.P.; Burge, S.W.; Bateman, A.; Daub, J.; Eberhardt, R.Y.; Eddy, S.R.; Floden, E.W.; Gardner, P.P.; Jones, T.A.; Tate, J.; et al. Rfam 12.0: Updates to the RNA families database. Nucleic Acids Res. 2015, 43, D130–D137. [Google Scholar] [CrossRef]
- Nawrocki, E.P.; Eddy, S.R. Infernal 1.1: 100-fold faster RNA homology searches. Bioinformatics 2013, 29, 2933–2935. [Google Scholar] [CrossRef]
- Aziz, R.K.; Bartels, D.; Best, A.A.; DeJongh, M.; Disz, T.; Edwards, R.A.; Formsma, K.; Gerdes, S.; Glass, E.M.; Kubal, M.; et al. The RAST Server: Rapid Annotations using Subsystems Technology. BMC Genom. 2008, 9, 75. [Google Scholar] [CrossRef]
- Pettersson, B.M.F.; Das, S.; Behra, P.R.K.; Jordan, H.R.; Ramesh, M.; Mallick, A.; Root, K.M.; Cheramie, M.N.; De La Cruz Melara, I.; Small, P.L.C.; et al. Comparative sigma factor-mRNA levels in Mycobacterium marinum under stress conditions and during host infection. PLoS ONE 2015, 10, e0139823. [Google Scholar] [CrossRef] [PubMed]
- Letunic, I.; Bork, P. 20 years of the SMART protein domain annotation resource. Nucleic Acids Res. 2018, 46, D493–D496. [Google Scholar] [CrossRef]
- Letunic, I.; Bork, P. Interactive tree of life (iTOL) v4: Recent updates and new developments. Nucleic Acids Res. 2019, 47, W256–W259. [Google Scholar] [CrossRef]
- Langmead, B.; Salzberg, S.L. Fast gapped-read alignment with Bowtie 2. Nat. Methods 2012, 9, 357–359. [Google Scholar] [CrossRef] [PubMed]
- Kim, D.; Pertea, G.; Trapnell, C.; Pimentel, H.; Kelley, R.; Salzberg, S.L. TopHat2: Accurate alignment of transcriptomes in the presence of insertions, deletions and gene fusions. Genome Biol. 2013, 14, R36. [Google Scholar] [CrossRef] [PubMed]
- Anders, S.; Pyl, P.T.; Huber, W. HTSeq-a Python framework to work with high-throughput sequencing data. Bioinformatics 2015, 31, 166–169. [Google Scholar] [CrossRef] [PubMed]
- Love, M.I.; Huber, W.; Anders, S. Moderated estimation of fold change and dispersion for RNA-Seq data with DESeq2. Genome Biol. 2014, 15, 550. [Google Scholar] [CrossRef]
- Wickham, H. ggplot2: Elegant Graphics for Data Analysis, 2nd ed.; Use R! Springer International Publishing: Cham, Switzerland, 2016. [Google Scholar]
- Guy, L.; Kultima, J.R.; Andersson, S.G. genoPlotR: Comparative gene and genome visualization in R. Bioinformatics 2010, 26, 2334–2335. [Google Scholar] [CrossRef] [PubMed]
- Pettersson, B.M.F.; Nitharwal, R.G.; Das, S.; Behra, P.R.K.; Benedik, E.; Arasu, U.T.; Islam, N.M.; Dasgupta, S.; Bhattacharya, A.; Kirsebom, L.A. Identification and expression of stressosomal proteins in Mycobacterium marinum under various growth and stress conditions. FEMS Microbiol. Lett. 2013, 342, 98–105. [Google Scholar] [CrossRef] [PubMed][Green Version]
- Garbe, T.R.; Barathi, J.; Barnini, S.; Zhang, Y.; Abou-Zeid, C.; Tang, D.; Mukherjee, R.; Young, D.B. Transformation of mycobacterial species using hygromycin resistance as selectable marker. Microbiology 1994, 140, 133–138. [Google Scholar] [CrossRef] [PubMed][Green Version]
- Goldman, D.S. Enzyme systems in the mycobacteria XV: Initial steps in the metabolism of glycerol. J. Bacteriol. 1963, 86, 30–37. [Google Scholar] [CrossRef] [PubMed]
- Winder, F.G.; Brennan, P.J. Initial steps in the metabolism of glycerol by Mycobacterium tuberculosis. J. Bacteriol. 1966, 92, 1846–1847. [Google Scholar] [CrossRef] [PubMed]
- Stinson, M.W.; Solotorovsky, M. Interaction of Tween 80 detergent with mycobacteria in synthetic medium. Am. Rev. Respir. Dis. 1971, 104, 717–727. [Google Scholar] [PubMed]
- Tsukamura, M.; Toyama, H.; Fukaya, Y. “Tween Egg Medium” for isolating mycobacteria from sputum specimens. Microbiol. Immunol. 1979, 23, 833–838. [Google Scholar] [CrossRef] [PubMed]
- Kovárová-Kovart, K.; Egli, T. Growth kinetics of suspended microbial cells: From single-substrate-controlled growth to mixed-substrate kinetics. Microbiol. Mol. Biol. Rev. 1998, 62, 646–666. [Google Scholar] [CrossRef] [PubMed]
- Görke, B.; Stülke, J. Carbon catabolite repression in bacteria: Many ways to make the most out of nutrients. Nat. Rev. Microbiol. 2008, 6, 613–624. [Google Scholar] [CrossRef]
- de Carvalho, L.P.S.; Fischer, S.M.; Marrero, J.; Nathan, C.; Erht, S.; Rhee, K.Y. Metabolomics of Mycobacterium tuberculosis reveals compartmentalized co-catabolism of carbon substrates. Chem. Biol. 2010, 17, 1122–1131. [Google Scholar] [CrossRef] [PubMed]
- Aung, S.; Shum, J.; Abanes-De Mello, A.; Broder, D.H.; Fredlund-Gutierrez, J.; Chiba, S.; Pogliano, K. Dual localization pathways for the engulfment proteins during Bacillus subtilis sporulation. Mol. Microbiol. 2007, 65, 1534–1546. [Google Scholar] [CrossRef] [PubMed]
- Singh, B.; Ghosh, J.; Islam, N.M.; Dasgupta, S.; Kirsebom, L.A. Growth, cell division and sporulation in mycobacteria. Antonie Van Leeuwenhoek 2010, 98, 165–177. [Google Scholar] [CrossRef]
- Aldridge, B.B.; Fernandez-Suarez, M.; Heller, D.; Ambravaneswaran, V.; Irimia, D.; Toner, M.; Fortune, S.M. Asymmetry and aging of mycobacterial cells lead to variable growth and antibiotic susceptibility. Science 2012, 335, 100–104. [Google Scholar] [CrossRef] [PubMed]
- Santi, I.; Dhar, N.; Bousbaine, D.; Wakamoto, Y.; McKinney, J.D. Single-cell dynamics of the chromosome replication and cell division cycles in mycobacteria. Nat. Commun. 2013, 4, 2470. [Google Scholar] [CrossRef] [PubMed]
- Vijay, S.; Mukkayyan, N.; Ajitkumar, P. Highly Deviated Asymmetric Division in Very Low Proportion of Mycobacterial Mid-log Phase Cells. Open Microbiol. J. 2014, 8, 40–50. [Google Scholar] [CrossRef]
- Vijay, S.; Nagaraja, M.; Sebastian, J.; Ajitkumar, P. Asymmetric cell division in Mycobacterium tuberculosis and its unique features. Arch. Microbiol. 2014, 196, 157–168. [Google Scholar] [CrossRef]
- Tortoli, E.; Fedrizzi, T.; Meehan, C.J.; Trovato, A.; Grottola, A.; Giacobazzi, E.; Serpini, G.F.; Tagliazucchi, S.; Fabio, A.; Bettua, C.; et al. The new phylogeny of the genus Mycobacterium: The old and the news. Infect. Genet. Evol. 2017, 56, 19–25. [Google Scholar] [CrossRef] [PubMed]
- Behra, P.R.K.; Pettersson, B.M.F.; Das, S.; Dasgupta, S.; Kirsebom, L.A. Comparative genome analysis of mycobacteria focusing on tRNA and non-coding RNA. BMC Genom. 2022, 23, 704. [Google Scholar] [CrossRef]
- Behra, P.R.K.; Pettersson, B.M.F.; Ramesh, M.; Dasgupta, S.; Kirsebom, L.A. Insight into the biology of Mycobacterium mucogenicum and Mycobacterium neoaurum clade members. Sci. Rep. 2019, 9, 19259. [Google Scholar] [CrossRef]
- Behra, P.R.K.; Pettersson, B.M.F.; Das, S.; Dasgupta, S.; Kirsebom, L.A. Comparative genomics of Mycobacterium mucogenicum and Mycobacterium neoaurum clade members emphasizing tRNA and non-coding RNA. BMC Evol. Biol. 2019, 19, 124. [Google Scholar] [CrossRef] [PubMed]
- Brand, S.; Niehaus, K.; Pühler, A.; Kalinowski, J. Identification and functional analysis of six mycolyltransferase genes of Corynebacterium glutamicum ATCC 13032: The genes cop1, cmt1, and cmt2 can replace each other in the synthesis of trehalose dicorynomycolate, a component of the mycolic acid layer of. Arch. Microbiol. 2003, 180, 33–44. [Google Scholar] [CrossRef]
- Kang, C.M.; Abbott, D.W.; Sang, T.P.; Dascher, C.C.; Cantley, L.C.; Husson, R.N. The Mycobacterium tuberculosis serine/threonine kinases PknA and PknB: Substrate identification and regulation of cell shape. Genes Dev. 2005, 19, 1692–1704. [Google Scholar] [CrossRef]
- Kang, C.M.; Nyayapathy, S.; Lee, J.Y.; Suh, J.W.; Husson, R.N. Wag31, a homologue of the cell division protein DivIVA, regulates growth, morphology and polar cell wall synthesis in mycobacteria. Microbiology 2008, 154, 725–735. [Google Scholar] [CrossRef] [PubMed]
- Datta, P.; Dasgupta, A.; Singh, A.K.; Mukherjee, P.; Kundu, M.; Basu, J. Interaction between FtsW and penicillin-binding protein 3 (PBP3) directs PBP3 to mid-cell, controls cell septation and mediates the formation of a trimeric complex involving FtsZ, FtsW and PBP3 in mycobacteria. Mol. Microbiol. 2006, 62, 1655–1673. [Google Scholar] [CrossRef] [PubMed]
- Hett, E.C.; Chao, M.C.; Rubin, E.J.; Bishai, W.R. Interaction and Modulation of Two Antagonistic Cell Wall Enzymes of Mycobacteria. PLoS Pathog. 2010, 6, e1001020. [Google Scholar] [CrossRef] [PubMed]
- Plocinski, P.; Ziolkiewicz, M.; Kiran, M.; Vadrevu, S.I.; Nguyen, H.B.; Hugonnet, J.; Veckerle, C.; Arthur, M.; Dziadek, J.; Cross, T.A.; et al. Characterization of CrgA, a New Partner of the Mycobacterium tuberculosis Peptidoglycan Polymerization Complexes. J. Bacteriol. 2011, 193, 3246–3256. [Google Scholar] [CrossRef] [PubMed]
- Plocinski, P.; Martinez, L.; Sarva, K.; Plocinska, R.; Madiraju, M.; Rajagopalan, M. Mycobacterium tuberculosis CwsA overproduction modulates cell division and cell wall synthesis. Tuberculosis 2013, 93, S21–S27. [Google Scholar] [CrossRef]
- Nagarajan, S.N.; Upadhyay, S.; Chawla, Y.; Khan, S.; Naz, S.; Subramanian, J.; Gandotra, S.; Nandicoori, V.K. Protein Kinase a (PknA) of Mycobacterium tuberculosis is independently activated and is critical for growth in vitro and survival of the pathogen in the host. J. Biol. Chem. 2015, 290, 9626–9645. [Google Scholar] [CrossRef] [PubMed]
- Av-Gay, Y.; Everett, M. The eukaryotic-like Ser/Thr protein kinases of Mycobacterium tuberculosis. Trends Microbiol. 2000, 8, 238–244. [Google Scholar] [CrossRef]
- Narayan, A.; Sachdeva, P.; Sharma, K.; Saini, A.K.; Tyagi, A.K.; Singh, Y. Serine threonine protein kinases of mycobacterial genus: Phylogeny to function. Physiol. Genom. 2007, 29, 66–75. [Google Scholar] [CrossRef] [PubMed]
- Mikusova, K.; Slayden, R.A.; Besra, G.S.; Brennan, P.J. Biogenesis of the mycobacterial cell wall and the site of action of ethambutol. Antimicrob. Agents Chemother. 1995, 3, 567–570. [Google Scholar] [CrossRef] [PubMed]
- Telenti, A.; Philipp, W.J.; Sreevatasan, S.; Bernasconi, C.; Stockbauer, K.E.; Wieles, B.; Musser, J.M.; Jacobs, W.R., Jr. The emb operon, a gene cluster of Mycobacterium tuberculosis involved in resistance to ethambutol. Nat. Med. 1997, 3, 567–570. [Google Scholar] [CrossRef]
- Papavinasasundaram, K.G.; Chan, B.; Chung, J.-H.; Colston, M.J.; Davis, E.O.; Av-Gay, Y. Deletion of the Mycobacterium tuberculosis pknH gene confers a higher bacillary load during the chronic phase of infection in BALB/c mice. J. Bacteriol. 2005, 187, 5751–5760. [Google Scholar] [CrossRef]
- Sharma, K.; Gupta, M.; Pathak, M.; Gupta, N.; Koul, A.; Sarangi, S.; Baweja, R.; Singh, Y. Transcriptional control of the mycobacterial embCAB operon by PknH through a regulatory protein, EmbR, in vivo. J. Bacteriol. 2006, 188, 2936–2944. [Google Scholar] [CrossRef]
- Safi, H.; Ligaraju, S.; Amin, A.; Kim, S.; Jones, M.; Holmes, M.; McNeil, M.; Peterson, S.N.; Chatterji, D.; Fleischmann, R.; et al. Evolution of high-level ethambutol-resistant tuberculosis through interacting mutations in decaprenylphosphorul-beta-D-arbabinose biosynthetic and utilization pathway genes. Nat. Genet. 2013, 45, 1190–1197. [Google Scholar] [CrossRef] [PubMed]
- Sun, Q.; Xiao, T.; Liu, H.; Zhao, X.; Liu, Z.; Li, Y.; Zeng, H.; Zhao, L.; Wan, K. Mutations within embCAB are associated with variable level of ethambutol resistance in Mycobacterium tuberculosis isolates from China. Antimicrob. Agents Chemother. 2017, 62, e01279-17. [Google Scholar] [CrossRef]
- Jones, L.J.F.; Carballido-Ló Pez, R.; Errington, J. Control of Cell Shape in Bacteria: Helical, Actin-like Filaments in Bacillus subtilis. Cell 2001, 104, 913–922. [Google Scholar] [CrossRef] [PubMed]
- Figge, R.M.; Divakaruni, A.V.; Gober, J.W. MreB, the cell-shape determining bacterial actin homolog, coordinates cell wall morphogenesis in Caulobacter crescentus. Mol. Microbiol. 2004, 51, 1321–1332. [Google Scholar] [CrossRef]
- Susin, M.F.; Baldini, R.L.; Gueiros-Filho, F.; Gomes, S.L. GroES/GroEL and DnaK/DnaJ have distinct roles in stress responses and during cell cycle progression in Caulobacter crescentus. J. Bacteriol. 2006, 188, 8044–8053. [Google Scholar] [CrossRef] [PubMed]
- Errington, J. Bacterial morphogenesis and the enigmatic MreB helix. Nat. Rev. Microbiol. 2015, 13, 241–248. [Google Scholar] [CrossRef] [PubMed]
- Shi, H.; Bratton, B.P.; Gitai, Z.; Huang, K.C. How to Build a Bacterial Cell: MreB as the Foreman of E. coli Construction. Cell 2018, 172, 1294–1305. [Google Scholar] [CrossRef]
- Mayer, F. Status report and hypotheses Cytoskeletons in prokaryotes. Cell Biol. Int. 2003, 27, 429–438. [Google Scholar] [CrossRef]
- Bean, G.J.; Flickinger, S.T.; Westler, W.M.; McCully, M.E.; Sept, D.; Weibel, D.B.; Amann, K.J. A22 disrupts the bacterial actin cytoskeleton by directly binding and inducing a low-affinity state in MreB. Biochemistry 2009, 48, 4852–4857. [Google Scholar] [CrossRef] [PubMed]
- Bracher, A.; Verghese, J. The nucleotide exchange factors of Hsp70 molecular chaperones. Front. Mol. Biosci. 2015, 2, 10. [Google Scholar] [CrossRef] [PubMed]
- Genest, O.; Wickner, S.; Doyle, S.M. Hsp90 and Hsp70 chaperones: Collaborators in protein remodeling. J. Biol. Chem. 2019, 294, 2109–2120. [Google Scholar] [CrossRef] [PubMed]
- Paek, K.-H.; Walker, G.C. Escherichia coli dnaK null mutants are inviable at high temperature. J. Bacteriol. 1987, 169, 283–290. [Google Scholar] [CrossRef] [PubMed]
- Bukau, B.; Walker, G.C. Cellular defects caused by deletion of the Escherichia coli dnaK gene indicate roles for heat shock protein in normal metabolism. J. Bacteriol. 1989, 171, 2337–2346. [Google Scholar] [CrossRef] [PubMed]
- Bukau, B.; Walker, G.C. Mutations altering heat shock specific subunit of RNA polymerase suppress major cellular defects of E. coli mutants lacking the DnaK chaperone. EMBO J. 1989, 9, 4027–4036. [Google Scholar] [CrossRef] [PubMed]
- Bukau, B.; Walker, G.C. ∆dnaK52 mutants of Escherichia coli have defects in chromosome segregation and plasmid maintenance at normal growth temperatures. J. Bacteriol. 1989, 171, 6030–6038. [Google Scholar] [CrossRef]
- Matavacas, J.; Hallgren, J.; von Wachenfeldt, C. Bacillus subtilis forms twisted cells with cell wall integrity defects upon removal of the molecular chaperones DnaK and trigger factor. Front. Microbiol. 2023, 13, 988768. [Google Scholar] [CrossRef] [PubMed]
- Stewart, G.R.; Snewin, V.A.; Walzl, G.; Hussell, T.; O’Gaora, P.; Goyal, M.; Betts, J.; Brown, I.N.; Young, D.B. Overexpression of heat-shock proteins reduces survival of Mycobacterium tuberculosis in the chronic phase of infection. Nat. Med. 2001, 7, 732–737. [Google Scholar] [CrossRef] [PubMed]
- Schröder, H.; Langer, T.; Hartl, F.U.; Bukau, B. DnaK, DnaJ and GrpE form a cellular chaperone machinery capable of repairing heat-induced protein damage. EMBO J. 1993, 12, 4137–4144. [Google Scholar] [CrossRef] [PubMed]
- Parijat, P.; Batra, J.K. Role of DnaK in HspR-HAIR interaction of Mycobacterium tuberculosis. IUBMB Life 2015, 67, 816–827. [Google Scholar] [CrossRef] [PubMed]
- Raman, S.; Song, T.; Puyang, X.; Bardarov, S.; Jacobs, W.R., Jr.; Husson, R.N. The alternative sigma factor SigH regulates major components of oxidative and heat stress responses in Mycobacterium tuberculosis. J. Bacteriol. 2006, 183, 6119–6125. [Google Scholar] [CrossRef] [PubMed]
- Bai, G.; McCue, L.A.; McDonough, K.A. Characterization of Mycobacterium tuberculosis Rv3676 (CRPMt), a cyclic AMP receptor protein-like DNA binding protein. J. Bacteriol. 2005, 187, 7795–7804. [Google Scholar] [CrossRef] [PubMed]
- Choudhary, E.; Bishai, W.; Agarwal, N. Expression of a subset of heat stress induced genes of Mycobacterium tuberculosis is regulated by 3′,5′-cyclic AMP. PLoS ONE 2014, 9, e89759. [Google Scholar] [CrossRef] [PubMed]
- Elliot, S.R.; Tischler, A.D. Phosphate starvation: A novel signal that triggers ESX-5 secretion in Mycobacterium tuberculosis. Mol. Microbiol. 2016, 100, 510–526. [Google Scholar] [CrossRef] [PubMed]
- Borovinskaya, M.A.; Shoji, S.; Fredrick, K.; Cate, J.H.D. Structural basis for hygromycin B inhibition of protein biosynthesis Structural basis for hygromycin B inhibition of protein biosynthesis. RNA 2008, 14, 1590–1599. [Google Scholar] [CrossRef] [PubMed]
- Cantwell, A.R., Jr. Histologic Observations of variably acid-fast coccoid forma suggestive of cell wall deficient bacteria in Hodgkin’s Disease: A report of four cases. Growth 1981, 45, 168–187. [Google Scholar] [PubMed]
- Chatterjee, B.R. A non-acid-fast coccoid precursor—Possible cultivable phase of Mycobacteria leprae. Lepr. India 1976, 48, 398–405. [Google Scholar]
- Nyka, W. Studies on the effects of starvation on mycobacteria. Infect. Immun. 1974, 9, 843–850. [Google Scholar] [CrossRef] [PubMed]
- Ojha, A.K.; Mukherjee, T.K.; Chatterji, D. High intracellular level of Guanosine Tetraphosphate in Mycobacterium smegmatis changes the morphology of the bacterium. Infect. Immun. 2000, 9, 4084–4091. [Google Scholar] [CrossRef] [PubMed]
- Kolter, R.; Siegele, D.A.; Tomo, A. The stationary phase of the bacterial life cycle. Annu. Rev. Microbiol. 1993, 47, 855–874. [Google Scholar] [CrossRef] [PubMed]
- Zambrano, M.M.; Kolter, R. GASPing for life in stationary phase. Cell 1996, 86, 181–184. [Google Scholar] [CrossRef] [PubMed]
- Quirós, L.M.; Hardisson, C.; Salas, J.A. Isolation and properties of Streptomyces spore membranes. J. Bacteriol. 1986, 165, 923–928. [Google Scholar] [CrossRef]
- Errington, J. Regulation of endospore formation in Bacillus subtilis. Nat. Rev. Microbiol. 2003, 1, 117–126. [Google Scholar] [CrossRef]
- Daza, A.; Martin, J.F.; Dominguez, A.; Gil, J.A. Sporulation of Several Species of Streptomyces in Submerged Cultures after Nutritional Downshift. Microbiology 2009, 135, 2483–2491. [Google Scholar] [CrossRef]
- Hutchison, E.A.; Miller, D.A.; Angert, E.R. Sporulation in Bacteria: Beyond the Standard Model. Microbiol. Spec. 2014, 2, TBS-0013-2012. [Google Scholar] [CrossRef] [PubMed]
- Wetzstein, M.; Völker, U.; Dedio, J.; Löbau, S.; Zuber, U.; Schiesswohl, M.; Herget, M.; Schumann, W. Cloning, sequencing, and molecular analysis of the dnaK locus from Bacillus subtilis. J. Bacteriol. 1992, 174, 3300–3310. [Google Scholar] [CrossRef] [PubMed]
- Segal, G.; Ron, E.Z. Regulation and organization of the groE and dnaK operons in Eubacteria. FEMS Microbiol. Lett. 1996, 138, 1–10. [Google Scholar] [CrossRef] [PubMed]
- Ghazaei, C. Role and mechanism of the Hsp70 molecular chaperone machines in bacterial pathogens. J. Med. Microbiol. 2017, 66, 259–265. [Google Scholar] [CrossRef] [PubMed]
- Doi, M.; Wachi, M.; Ishino, F.; Tomioka, S.; Ito, M.; Sakagami, Y.; Suzuki, A.; Matsuhashi, M. Determinations of the DNA sequence of the mreB gene and of the gene products of the mre region that function in formation of the rod shape of Escherichia coli cells. J. Bacteriol. 1988, 170, 4619–4624. [Google Scholar] [CrossRef]
- Matsuhashi, M.; Wachi, M.; Ishino, F. Machinery for cell growth and division: Penicillin-binding proteins and other proteins. Res. Microbiol. 1990, 141, 89–103. [Google Scholar] [CrossRef] [PubMed]
- Heichlinger, A.; Ammelburg, M.; Kleinschnitz, E.-M.; Latus, A.; Maldener, I.; Flärdh, K.; Wohlleben, W.; Muth, G. The MreB-Like Protein Mbl of Streptomyces coelicolor A3(2) Depends on MreB for Proper Localization and Contributes to Spore Wall Synthesis. J. Bacteriol. 2011, 193, 1533–1542. [Google Scholar] [CrossRef] [PubMed]
- Woldemeskel, S.A.; Goley, E.D. Shapeshifting to Survive: Shape Determination and Regulation in Caulobacter crescentus. Trends Microbiol. 2017, 25, 673–687. [Google Scholar] [CrossRef]
- Seydlová, G.; Halada, P.; Fišer, R.; Toman, O.; Ulrych, A.; Svobodová, J. DnaK and GroEL chaperones are recruited to the Bacillus subtilis membrane after short-term ethanol stress. J. Appl. Microbiol. 2012, 112, 765–774. [Google Scholar] [CrossRef] [PubMed]
- Bobek, J.; Halada, P.; Angelis, J.; Vohradský, J.; Mikulík, K. Activation and expression of proteins during synchronous germination of aerial spores of Streptomyces granaticolor. Proteomics 2004, 4, 3864–3880. [Google Scholar] [CrossRef] [PubMed]
- Fay, A.; Glickman, M.S. An Essential Nonredundant Role for Mycobacterial DnaK in Native Protein Folding. PLoS Genet. 2014, 9, e1004516. [Google Scholar] [CrossRef] [PubMed]
- Das Gupta, T.; Bandyopadhyay, B.; Das Gupta, S.K. Modulation of DNA-binding activity of Mycobacterium tuberculosis HspR by chaperones. Microbiol. 2008, 154, 484–490. [Google Scholar] [CrossRef][Green Version]
- Bandyopadhyay, B.; Das Gupta, T.; Roy, D.; Das Gupta, S.K. DnaK dependence of the mycobacterial stress-responsive regulator HspR is mediated through its hydrophobic C-terminal tail. J. Bacteriol. 2012, 194, 4688–4697. [Google Scholar] [CrossRef]
- Koch, B.; Kilstrup, M.; Vogensen, F.K.; Hammer, K. Induced levels of heat shock proteins in a dnaK mutant of Lactococcus lactis. J. Bacteriol. 1998, 180, 3873–3881. [Google Scholar] [CrossRef]
- Selby, K.; Lindström, M.; Somervuo, P.; Heap, J.T.; Minton, N.P.; Korkeala, H. Important role of class I heat shock genes hrcA and dnaK in the heat shock response and the response to pH and NaCl stress of group I Clostridium botulinum strain ATCC 3502. Appl. Environ. Microbiol. 2011, 77, 2823–2830. [Google Scholar] [CrossRef] [PubMed]
- Jain, S.; Smyth, D.; O’Hagan, B.M.G.; Heap, J.T.; McMullan, G.; Minton, N.P.; Ternan, N.G. Inactivation of the dnaK gene in Clostridium difficile 630 Δerm yields a temperature-sensitive phenotype and increases biofilm-forming ability. Sci. Rep. 2017, 7, 17522. [Google Scholar] [CrossRef]
- Bork, P.; Sander, C.; Valencia, A. An ATPase domain common to prokaryotic cell cycle proteins, sugar kinases, actin, and hsp70 heat shock proteins. Proc. Natl. Acad. Sci. USA 1992, 89, 7290–7294. [Google Scholar] [CrossRef] [PubMed]
- Carballido-López, R. The bacterial actin-like cytoskeleton. Microbiol. Mol. Biol. Rev. 2006, 70, 888–909. [Google Scholar] [CrossRef] [PubMed]
- Rosenzweig, R.; Nillegoda, N.B.; Mayer, M.P.; Bukay, B. The Hsp70 chaperone network. Nat. Rev. Mol. Cell Biol. 2019, 20, 665–680. [Google Scholar] [CrossRef] [PubMed]
- Cole, S.T.; Brosch, R.; Parkhill, J.; Garnier, T.; Churcher, C.; Harris, D.; Gordon, S.V.; Eiglmeier, K.; Gas, S.; Barry Iii, C.E.; et al. Deciphering the biology of Mycobacterium tuberculosis from the complete genome sequence. Nature 1998, 393, 537–544. [Google Scholar] [CrossRef] [PubMed]
- Henderson, B.; Lund, P.A.; Coates, A.R.M. Multiple moonlighting functions of mycobacterial chaperones. Tuberculosis 2012, 90, 119–124. [Google Scholar] [CrossRef] [PubMed]
- Ghazaei, C.; El Helou, M.L. Beyond proteostasis: Roles of type I chaperonins in bacterial pathogenesis. J. Med. Microbiol. 2018, 67, 1203–1211. [Google Scholar] [CrossRef] [PubMed]
- Hesterkamp, T.; Bukau, B. Role of the DnaK and HscA homologs of Hsp70 chaperones in protein folding in E. coli. EMBO J. 1998, 17, 4818–4828. [Google Scholar] [CrossRef]
- McCarty, J.S.; Rüdiger, S.; Schönfeld, H.-J.; Schneider-Mergener, J.; Nakahigashi, K.; Yura, T.; Bukau, B. Regulatory region C of the E. coli heat shock transcription factor, σ32, constitutes a DnaK binding site and is conserved among eubacteria. J. Mol. Biol. 1996, 256, 829–837. [Google Scholar] [CrossRef] [PubMed]
- Muffler, A.; Barth, M.; Marschall, C.; Henge-Aronis, R. Heat shock regulation of σS turnover: A role for DnaK and relationship between stress responses mediated by σS and σ32 in Escherichia coli. J. Bacteriol. 1997, 179, 445–452. [Google Scholar] [CrossRef]
- Rockabrand, D.; Livers, K.; Austin, T.; Kaiser, R.; Jensen, D.; Burgess, R.; Blum, P. Roles of DnaK and RpoS in stravation-induced thermotolerance of Escherichia coli. J. Bacteriol. 1998, 180, 846–854. [Google Scholar] [CrossRef] [PubMed]
- Newton-Foot, M.; Gey Van Pittius, N.C. The complex architecture of mycobacterial promoters. Tuberculosis 2013, 93, 60–74. [Google Scholar] [CrossRef] [PubMed]
- Chatterjee, A.; Sharma, A.K.; Mahatha, A.C.; Banerjee, S.K.; Kumar, M.; Saha, S.; Basu, J.; Kundu, M. Global mapping of MtrA-binding sites links MtrA to regulation of its targets in Mycobacterium tuberculosis. Microbiology 2018, 164, 99–110. [Google Scholar] [CrossRef] [PubMed]
- Schaeffer, A.B.; Fulton, M.D. A simplified method of staining endospores. Science 1933, 77, 194. [Google Scholar] [CrossRef] [PubMed]
- Oktari, A.; Supriatin, Y.; Kamal, M.; Syafrullah, H. The bacterial endospore stain on Scaheffer Fulton using variation of Methylen Blue solution. J. Phys. Conf. Ser. 2017, 812, 012066. [Google Scholar] [CrossRef]
- Munshi, T.; Gupta, A.; Evangelopoulos, D.; Guzman, J.D.; Gibbons, S.; Keep, N.H.; Bhakta, S. Characterisation of ATP-dependent Mur ligases involved in the biogenesis of cell wall peptidoglycan in Mycobacterium tuberculosis. PLoS ONE 2013, 8, e60143. [Google Scholar] [CrossRef]
- Datta, P.; Dasgupta, A.; Bhakta, S.; Basu, J. Interaction between FtsZ and FtsW of Mycobacterium tuberculosis. J. Biol. Chem. 2002, 277, 24983–24987. [Google Scholar] [CrossRef]
- Wu, H.; Fan, Z.; Jiang, X.; Chen, J.; Chen, G.Q. Enhanced production of polyhydroxybutyrate by multiple dividing E. coli. Microb. Cell Fact. 2016, 15, 128. [Google Scholar] [CrossRef]
- Kieser, K.J.; Rubin, E.J. How sisters grow apart: Mycobacterial growth and division. Nat. Rev. Microbiol. 2014, 12, 550–562. [Google Scholar] [CrossRef]
- Chao, M.C.; Kieser, K.J.; Minami, S.; Mavrici, D.; Aldridge, B.B.; Fortune, S.M.; Alber, T.; Rubin, E.J. Protein complexes and proteolytic activation of the cell wall hydrolase RipA regulate septal resolution in mycobacteria. PLoS Pathog. 2013, 9, e1003197. [Google Scholar] [CrossRef]
- Squeglia, F.; Ruggiero, A.; Romano, M.; Vitagliano, L.; Berisio, R. Mutational and structural study of RipA, a key enzyme in Mycobacterium tuberculosis cell division: Evidence for the L-to-D inversion of configuration of the catalytic center. Acta Crystallogr. D. Biol. Crystallogr. 2014, 70, 2295–2300. [Google Scholar] [CrossRef] [PubMed]
- Martinelli, D.J.; Pavelka, M.S., Jr. The RipA and RipB peptidoglycan endopeptidases are individually nonessential to Mycobacterium smegmatis. J. Bacteriol. 2016, 198, 1464–1475. [Google Scholar] [CrossRef]
- Billman-Jacobe, H.; Haites, R.E.; Coppel, R.L. Characterization of a Mycobacterium smegmatis mutant lacking penicillin binding protein 1. Antimicrob. Agents Chemother. 1999, 43, 3011–3013. [Google Scholar] [CrossRef] [PubMed]
- Mukherjee, P.; Sureka, K.; Datta, P.; Hossain, T.; Barik, S.; Das, K.P.; Kundu, M.; Basu, J. Novel role of Wag31 in protection of mycobacteria under oxidative stress. Mol. Microbiol. 2009, 73, 103–119. [Google Scholar] [CrossRef] [PubMed]
- Varma, A.; Young, K.D. In Escherichia coli, MreB and FtsZ direct the synthesis of lateral cell wall via independent pathways that require PBP 2. J. Bacteriol. 2009, 191, 3526–3533. [Google Scholar] [CrossRef] [PubMed]
- Nguyen, L.; Chinnapapagari, S.; Thompson, C.J. FbpA-dependent biosynthesis of trehalose dimycolate is required for the intrinsic multidrug resistance, cell wall structure, and colonial morphology of Mycobacterium smegmatis. J. Bacteriol. 2005, 187, 6603–6611. [Google Scholar] [CrossRef]
- Jankute, M.; Cox, J.A.G.; Harrison, J.; Besra, G.S. Assembly of the mycobacterial cell wall. Annu. Rev. Microbiol. 2015, 69, 405–423. [Google Scholar] [CrossRef] [PubMed]


Disclaimer/Publisher’s Note: The statements, opinions and data contained in all publications are solely those of the individual author(s) and contributor(s) and not of MDPI and/or the editor(s). MDPI and/or the editor(s) disclaim responsibility for any injury to people or property resulting from any ideas, methods, instructions or products referred to in the content. |
© 2025 by the authors. Licensee MDPI, Basel, Switzerland. This article is an open access article distributed under the terms and conditions of the Creative Commons Attribution (CC BY) license (https://creativecommons.org/licenses/by/4.0/).