Abstract
Background: Previous studies have confirmed the involvement of EmaSR (ethanol metabolism a sensor/regulator) in the regulation of Acinetobacter baumannii ATCC 19606 ethanol and acetate metabolism. RNA-seq analysis further revealed that DJ41_568-571, DJ41_2796, DJ41_3218, and DJ41_3568 regulatory gene clusters potentially participate in ethanol and acetate metabolism under the control of EmaSR. Methods: This study fused the EmaSR regulon promoter segments with reporter genes and used fluorescence expression levels to determine whether EmaSR influences regulon expression in ethanol or acetate salt environments. The enzymatic function and kinetics of significantly regulated regulons were also studied. Results: The EmaSR regulons P2796 and P3218 exhibited > 2-fold increase in fluorescence expression in wild type compared to mutant strains in both ethanol and acetate environments, and PemaR demonstrated a comparable trend. Moreover, increases in DJ41_2796 concentration enhanced the conversion of acetate and succinyl-CoA into acetyl-CoA and succinate, suggesting that DJ41_2796 possesses acetate: succinyl-CoA transferase (ASCT) activity. The kcat/KM values for DJ41_2796 with potassium acetate, sodium acetate, and succinyl-CoA were 0.2131, 0.4547, and 20.4623 mM−1s−1, respectively. Conclusions: In A. baumannii, EmaSR controls genes involved in ethanol and acetate metabolism, and the EmaSR regulon DJ41_2796 was found to possess ASCT activity.
1. Introduction
Ethanol is a widely-used disinfectant, but previous research has shown that sub-inhibitory concentrations of ethanol are not only unable to eradicate bacteria but can conversely promote biofilm formation to increase bacterial resistance [1,2,3,4]. Ethanol concentrations of 2.3–3.5% enhance the ability of Staphylococcus aureus to form biofilms, while 1–2% concentrations are sufficient to induce biofilm formation in Pseudomonas aeruginosa [1,2,3,4]. The presence of alcohol dehydrogenases (Adhs) can further help bacteria to degrade alcohols, reducing ethanol-induced damage and transforming ethanol into a carbon source for growth instead [5,6].
Acetate is a type of short-chain fatty acid (SCFA) produced during ethanol metabolism. Previous research has shown that SCFAs inhibit toxin-producing bacteria such as Bacillus cereus and Clostridium difficile, as well as foodborne pathogens such as Campylobacter and Salmonella [7]. Additionally, it has been found that acetate increases the activity of macrophages to enhance their lethality against Streptococcus pneumoniae [8]. However, many types of bacteria can also metabolize acetate; for example, Escherichia coli can convert acetate into acetyl-CoA via acetate kinase (AckA) and phosphotransacetylase (Pta), or through acetyl-CoA synthetase [9]. Both of these pathways require the consumption of ATP, but in Pseudomonas sp., Klebsiella pneumoniae, and Acetobacter, it has been observed that acetate:succinyl-CoA transferase (ASCT) can transfer the CoA from succinyl-CoA to acetate to produce acetyl-CoA without consuming ATP [10].
Bacteria often use a two-component system (TCS) to detect and respond to changes in the environment. A typical two-component system consists of a histidine sensor kinase and a response regulator. Previous research has identified an ErdSR TCS that regulates ethanol metabolism [11,12]; in addition, MxtR/ErdR in Pseudomonas putida KT2440 was found to regulate the metabolism of acetate and pyruvate, partly through enzymes such as ScpC (PP_0154), which functions as an ASCT [13]. Recent research on Acinetobacter baumannii, K. pneumoniae, and S. aureus has also confirmed that many of their TCSs have regulatory functions in metabolism [14,15,16].
A. baumannii is a common pathogen in nosocomial infections. Previous research identified seven Adh genes in the genome of A. baumannii ATCC 19606, of which Adh exhibits a higher affinity for ethanol over other alcohols; the absence of Adh4 specifically hindered bacterial growth in low concentrations of ethanol, propanol, and butanol [17]. Subsequently, it was confirmed that the absence of the emaSR TCS in A. baumannii leads to an inability to grow in low concentrations of ethanol, as EmaSR was shown to regulate ethanol metabolism. Additionally, it was discovered that EmaSR shares approximately 40% or more amino acid sequence similarity with ErdSR and MxtR/ErdR, which regulate ethanol metabolism in P. aeruginosa PAO1. Furthermore, the loss of EmaSR was found to lead to growth defects in A. baumannii when exposed to a 20 mM acetate environment [18]. However, in low-concentration ethanol environments, transcriptome analysis revealed that EmaSR significantly upregulated several genes annotated for involvement in acetate and pyruvate metabolic pathways (Figure 1), including DJ41_568-571, DJ41_2796, DJ41_3218, and DJ41_3568 [18]. Considering that the presence of ethanol, which is widely used in hospital environments as a disinfectant, has been reported to induce stress responses in A. baumannii that can lead to increased virulence [17], understanding ethanol and acetate metabolic pathways can be crucial to formulating new strategies aimed at preventing or mitigating nosocomial and opportunistic infections.
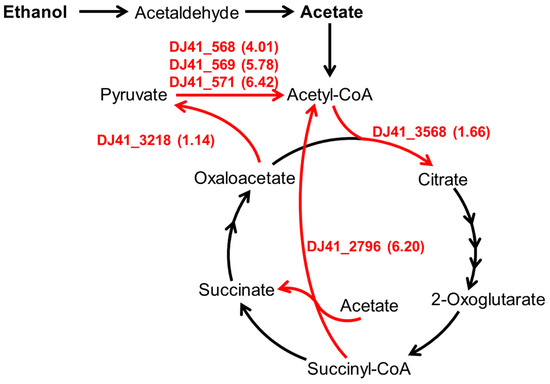
Figure 1.
The carbon metabolism pathway regulated by EmaSR regulons. Based on gene function annotations from the National Center for Biotechnology Information (NCBI) database for A. baumannii ATCC 19606 and the metabolic pathways of the relevant Kyoto Encyclopedia of Genes and Genomes (KEGG) pathway. The numbers listed in parentheses beside the EmaSR regulons represent the log2 fold-change in gene expression between strains with and without emaSR in 0.5% ethanol, as derived from EmaSR transcriptome analysis.
In this study, we investigated the expression of a reporter gene fused with the promoter of EmaSR regulons, in order to confirm the metabolic pathways through which EmaSR regulates bacterial metabolism of ethanol and acetate. We also conducted an enzymatic analysis to identify EmaSR regulons with crucial enzymatic activity in the A. baumannii metabolism of ethanol and acetate. Our results provide further insight into the role of the EmaSR TCS in A. baumannii resilience and may have implications for other pathogenic bacterial species as well.
2. Materials and Methods
2.1. Bacterial Strains, Plasmids, Primers, and Growth of Strains
All strains of E. coli and A. baumannii were grown in LB medium at 37 °C with shaking to increase the bacterial count; however, the fluorescence expression experiments were carried out with cultures using an M9 medium (composition described in Section 2.2). Based on the antibiotic resistance of each strain, the culture medium was supplemented with a final concentration of 50 µg/mL ampicillin, 50 µg/mL kanamycin, or 12.5 µg/mL tetracycline. Bacterial strains and plasmids are described in Table 1 and Table 2, respectively. Primers used for the construction and verification of the recombinant strains are presented in Table 3.

Table 1.
Bacterial strains used in this study.
Table 2.
Plasmids used in this study.
Table 3.
Primers used in this study.
2.2. Green Florescence Assay
TCSG represents the abbreviation of the two-component system with gfp gene. This reporter system utilized the PstI and XbaI restriction enzyme sites to combine the promoter fragment with gfpuv, which contains three amino acid modifications that significantly increase fluorescence emissions without affecting emission wavelength [22]. Each promoter-gfpuv fragment were then recombined into pWH1266 using Gibson assembly (E2611, NEB, Ipswich, MA, USA). The recombinant plasmids were introduced into A. baumannii strains by electroporation at 1.8 kV. The construction of each strain was confirmed by a colony PCR, and the analysis results are presented in Figures S1–S5.
Strains with the pWH1266G reporter plasmid were cultured in an M9 medium (33.7 mM Na2PO4, 22 mM KH2PO4, 8.55 mM NaCl, 9.35 mM NH4Cl, 1 mM MgSO4, 0.3 mM CaCl2), With 5 mM citrate, supplemented with 0.5% ethanol or 20 mM potassium acetate. Each strain was grown at 37 °C with an initial OD600 of 0.1, with continuous shaking. The samples were collected periodically to analyze fluorescence and bacterial growth. Samples were diluted 10-fold in 0.9% NaCl, and fluorescence expression was measured using a Varioskan LUX Multimode Microplate Reader (3020-80145, ThermoFisher, Waltham, MA, USA) with excitation at 395 nm and emission at 509 nm. Samples for growth curve determination were collected simultaneously, diluted in 0.9% NaCl, and then assessed for changes in OD600 using the same instrument.
2.3. Purification of DJ41_2796 and Enzymatic Assay
Following the methodology described in previous research [18], the DJ41_2796 gene was cloned into pQE80LK, which was derived by substituting the ampicillin resistance gene of pQE80L (Qiagen, Hilden, Germany) with kanamycin. A gene fragment of DJ412796, 1515 bp in length, was ligated with a pQE80LK cutting by BamHI and PstI. The resulting construct, pQE80LK-DJ41_2796, was then transformed into E. coli DH5α for protein expression and purification (Figure S6). A total of 100 mL of bacteria were cultured, with OD600 of 0.1 at initiation. Protein expression was induced by 0.5 mM isopropyl ß-D-1-thiogalactopyranoside (IPTG) after OD600 reached 0.6 for three hours. The cultures were then harvested and lysed using a high-pressure homogenizer CF1 (Constant Systems Ltd., Daventry, UK), and purification of DJ41_2796 from the supernatant was conducted at 4 °C using NGC Chromatography Systems (Bio-rad, Hercules, CA, USA). In this system, the supernatant was passed through a nickel-affinity column (Nuvia IMAC Ni-Charge, Bio-rad, Hercules, CA, USA). The histidine-tag fusion protein was purified by increasing the concentration of imidazole from 5 mM to 1 M in the buffer [17].
The purified protein was utilized for enzyme activity analysis in accordance with the experimental design of previous studies [23,24]. Each 1 mL reaction sample for testing the dose response of DJ41_2796 contained a final concentration of 100 mM phosphate buffer solution, 10 mM potassium acetate, 0.2 mM succinyl-CoA, 0~10 µM DJ41_2796, and 0.1 mM Ellman’s Reagent (5,5′-dithio-bis-(2-nitrobenzoic acid), DTNB). After the reaction between DTNB and CoA, TNB (extinction coefficient: 14.15 M−1cm−1) was produced [25]. The changes in OD412 were monitored every 30 s within a 1.5 min timeframe, using the Multiskan SkyHigh Microplate Spectrophotometer (ThermoFisher, Waltham, MA, USA). Enzyme activity was then determined according to the conversion rate of acetate into acetyl-CoA, in nanomoles per minute.
3. Results
3.1. Genes of EmaSR Regulons Were Upregulated in a Low-Concentration Ethanol Environment
Binding-box analysis was conducted on sequences of approximately 250 base pairs upstream of each gene, and a sequence of AAxCTTAxxxxTAxxxTTxxxx upstream of the EmaSR regulon was found to be highly conserved (Table 4). This same sequence was identified upstream of emaS and emaR, thereby suggesting that these genes might be regulated by EmaR. This study constructed plasmid TCSG to confirm that EmaSR regulons were indeed upregulated in low-ethanol conditions. TCSG enables the expression of emaS and emaR, along with gfpuv (Figure S1). Approximately 250 bp upstream of each EmaSR regulon were combined with the gfpuv of the TCSG reporter plasmid to construct derivative plasmids, and after confirming its successful construction and transformation using colony PCR (Figure S2), each clone was observed for fluorescence expression in LB medium containing 1% ethanol (Figure S7). However, differences in fluorescence expression among all strains, including the control group, did not exceed 6% of the average fluorescence value. There was no significant difference in the expression levels of each EmaSR regulon compared to the control group (Figure S7). Since gene expression in E. coli cultured in LB medium differs from the growth of A. baumannii in low-concentration ethanol conditions, we inferred that the TCSG reporter system in E. coli is unsuitable for analyzing EmaSR regulon expression; therefore, DNA fragments combining the regulon promoters with gfpuv were transferred from TCSG to the E. coli and A. baumannii shuttle vector pWH1266 (Figure S3) for further analysis. The successful establishment of each pWH1266 reporter strain was subsequently confirmed by the colony PCR (Figures S4 and S5).
Table 4.
EmaR binding boxes on EmaSR regulons.
During the analysis, it was observed that A. baumannii wild-type strains carrying reporter plasmids, such as DJ41_566-571 (P571), DJ41_2796 (P2796), DJ41_3218 (P3218), and DJ41_3568 (P3568), exhibited slightly higher fluorescence levels after 24 h compared to wild-type strains carrying an empty reporter plasmid (Pgfp) under citrate conditions (Figure 2A). In addition, under 0.5% ethanol culture conditions, fluorescence expression levels of EmaSR regulons increased by four to six times over the control group (Figure 2C). Although growth curves leveled out after 24 h for all strains, statistically significant differences in fluorescence expression continued to be observed between different strains, indicating that the differences in fluorescence were unlikely to be influenced by growth fluctuation (Figure 2B,D). The fluorescence expression of P2796 and P3218 significantly increased under 0.5% ethanol culture conditions, respectively, reaching approximately 3-fold and 2-fold higher than the control (Figure 2C). By contrast, fluorescence expression levels for P571 and P3568 were not significantly different from Pgfp at 48 h. These results suggest that DJ41_2796 and DJ41_3218 are regulated by EmaSR in ethanol-containing culture conditions. PemaR also exhibited significant differences in fluorescence expression compared to the control from 24 h onwards in 0.5% ethanol-containing cultures, but unexpectedly, there were no significant differences in the fluorescence expression for PemaS in comparison to the control. These results confirm that PemaR, P2796, and P3218 are induced in the presence of ethanol (Figure 2C).
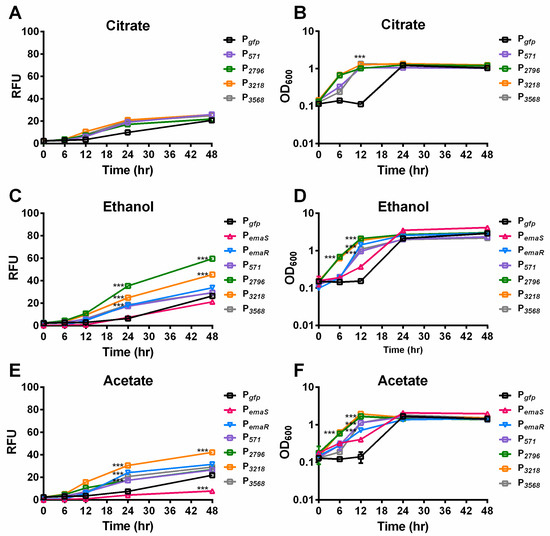
Figure 2.
Mean fluorescence expression levels and growth of EmaSR regulon-transformed A. baumannii strains under 0.5% ethanol and 20 mM potassium acetate culture conditions. Wild-type strains of A. baumannii containing pWH1266G (black), pWH-P571G (purple), pWH-P2796G (green), pWH-P3218G (orange), pWH-P3568G (gray), pWH-PemaSG (red triangle), and pWH-PemaRG (blue inverted triangle) were grown in final concentrations of (A,B) 5 mM citrate; (C,D) 5 mM citrate and 0.5% ethanol; and (E,F) 5 mM citrate and 20 mM potassium acetate as carbon sources. Fluorescence expression (A,C,E) and growth curves (B,D,F) are shown. *** p < 0.0001, multiple t-test, derived from the comparison of strains with promoter and empty vector pWH1266G. RFU, relative fluorescence units. OD600, optical density. Data were collected from at least three replicates.
To further confirm the upregulation of EmaSR regulons, the expression levels of P2796 and P3218 were analyzed in wild-type and mutant strains (∆emaS, ∆emaR, and ∆emaSR), cultured under low-concentration ethanol conditions. Similar expression levels at 48 h were observed in the wild-type strain as previously noted (Figure 3 black and gray slash, Figures S8A and S9A). However, in mutants ∆emaS, ∆emaR, and ∆emaSR, there was no significant elevation in fluorescence expression for P2796and P3218 (Figure 3 black and gray slash, Figures S8A and S9A). Although the wild-type strain grew approximately 4- to 6-fold higher than mutant strains initially, all strains reached similar growth levels after 48 h (Figures S8B and S9B). This confirmed that at least by 48 h, the difference in expression levels of P2796 and P3218 between wild-type and mutant strains was not due to growth defects and demonstrated that the increase in fluorescence expression levels in low-concentration ethanol culture conditions was indeed regulated by EmaSR.
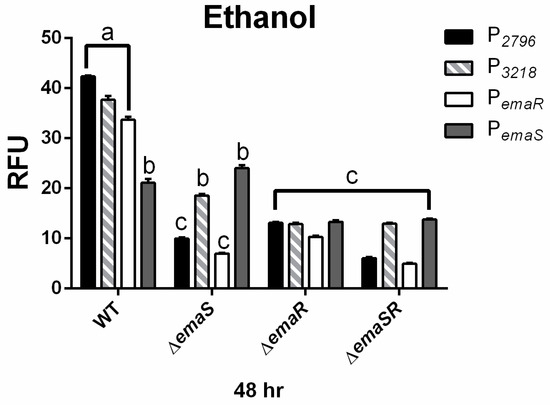
Figure 3.
EmaSR regulon mean fluorescence expression levels in different A. baumannii strains cultured in low-concentration ethanol after 48 h. Changes in fluorescence levels at 48 h were observed in wild-type, ∆emaS, ∆emaR, and ∆emaSR strains of A. baumannii, each carrying the pWH-P2796G (black), pWH-P3218G (gray slash), pWH-PemaRG (white) or pWH-PemaSG (dark gray) reporter plasmid. Strains were cultured with 0.5% ethanol. The a, b, and c labels indicate the comparisons for which p < 0.0001, multiple t-test. RFU, relative fluorescence units. Data were derived from at least three independent experiments.
3.2. EmaSR Regulates DJ41_2796 and DJ41_3218 in Acetate Culture Conditions
In previous research, it was discovered that EmaSR may be involved not only in the regulation of ethanol metabolism, but also in acetate metabolism [18]. To confirm whether EmaSR regulates acetate metabolism via regulons, the fluorescence expression of EmaSR regulons was observed under low-concentration acetate culture conditions. After 24 h, fluorescence expression levels of EmaSR regulons were observed to be 3-fold higher than the Pgfp control after 24 h, and the fluorescence expression for P3218 reached 5-fold higher than Pgfp (Figure 2E). A growth curve analysis confirmed no significant differences in the growth of each strain (Figure 2F). Comparable fluorescence expression levels of PemaR in acetate culture conditions to ethanol culture conditions were observed, with the fluorescence expression of PemaR significantly increased; however, there was a significant decrease in the fluorescence expression of PemaS compared to Pgfp (Figure 2E), suggesting that emaR can be induced in the presence of acetate, but emaS cannot.
Fluorescence expression levels of P2796 and P3568 were observed in both wild-type and mutant A. baumannii strains, and as in ethanol-containing cultures, there was no significantly elevated fluorescence expression observed for P2796 and P3568 in all mutants. During the 24 h culture period, the fluorescence expression levels of P2796 and P3218 in the wild-type strain were both 4-fold higher than that of the mutant strains (Figure 4 black and gray slash, Figures S8C and S9C). The growth curve analysis also confirmed that this difference was not due to growth differences (Figure 4 black and gray slash, Figures S8D and S9D). This indicates that in low-concentration acetate culture conditions, EmaSR indeed regulates the expression of EmaSR regulons.
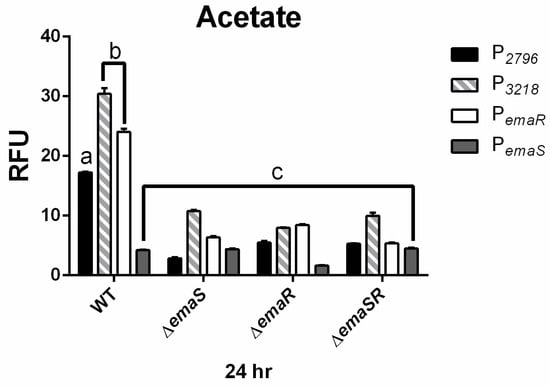
Figure 4.
EmaSR regulon mean fluorescence expression levels in different A. baumannii strains cultured in low-concentration actetae after 24 h. Changes in fluorescence levels at 24 h were observed in wild-type, ∆emaS, ∆emaR, and ∆emaSR strains of A. baumannii, each carrying the pWH-P2796G (black), pWH-P3218G (gray slash), pWH-PemaRG (white) or pWH-PemaSG (dark gray) reporter plasmid. Strains were cultured with 20 mM acetate. The a, b, and c labels indicate the comparisons for which p < 0.0001, multiple t-test. RFU, relative fluorescence units. Data were derived from at least three independent experiments.
3.3. EmaR Enhances the Expression of PemaS and PemaR in Acetate
TCS are known to not only activate the regulation of downstream genes but also to control the expression of their own promoters. Previous results indicated significantly elevated expression of PemaR under low-concentration ethanol culture conditions [18], but here it was found that in a similar environment, PemaR was barely expressed in all three mutant strains (Figure 3 white, Figure S10A). This difference was shown to be unaffected by growth (Figure S10B) and confirmed that the expression of PemaR in low-concentration ethanol environments is also regulated by EmaSR. Similar results were observed under low-concentration acetate culture conditions (Figure 4 white, Figure S10C), and the findings were not influenced by differences in growth (Figure S10D).
By contrast, PemaS showed no significant increase in expressions in both ethanol and acetate, and even had a significantly lower expression in the acetate environment compared to the Pgfp control. However, it was observed that in the ∆emaR and ∆emaSR mutants, fluorescence expression of PemaS was almost half that of wild type and ∆emaS in low concentrations of ethanol (Figure 3 dark gray, Figure S11A). There was no significant variation in tye fluorescence expression levels for all strains in the acetate-containing medium (Figure 4 dark gray, Figure S11C). The growth curve analysis confirmed that this result was not due to differences in growth rates (Figure S11B,D). These results show that although the expression of PemaS was not induced by ethanol or acetate, its expression was still regulated by EmaR, suggesting that in strains with intact emaR, the expression of PemaS can still be enhanced. Additionally, although not significantly different, slightly higher expression levels of PemaS were observed in ∆emaS under both low ethanol and acetate conditions, as compared to the wild type. There may be other regulatory factors that suppress PemaS expression, of which are present in the wild-type strain but not ∆emaS.
3.4. DJ41_2796 Possesses Acetate: Succinyl-CoA Transferase Enzymatic Activity
Both transcriptome analysis and reporter assays confirmed the potentially significant role of DJ41_2796 in EmaSR-regulated ethanol and acetate metabolism, and a functional prediction using the amino acid sequence suggests that DJ41_2796 may have ASCT activity. The homologous genes of this enzyme have been proven to play a crucial role in the metabolic regulation of MxtR/ErdR [13]. The enzymatic activity of DJ41_2796 was subsequently assessed through interaction with potassium acetate and succinyl-CoA, to ascertain if acetyl-CoA and succinate would be produced. DJ41_2796 was expressed in E. coli, using the vector pQE80LK-DJ41_2796, and was purified through nickel affinity chromatography. Different concentrations of DJ41_2796 were tested, and as concentrations increased from 2 µM to 10 µM, the reaction rate also increased from 0.9611 U/g to 4.9823 U/g (Figure 5). This confirmed that DJ41_2796 possesses ASCT enzymatic activity to convert potassium acetate and succinyl-CoA into acetyl-CoA and succinate.
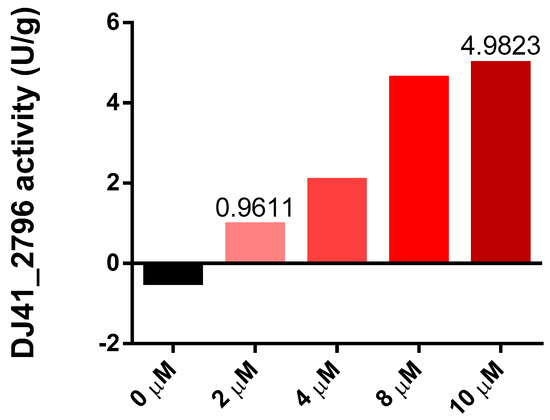
Figure 5.
Enzymatic activity of DJ41_2796 at different protein concentrations. The y–axis represents the enzymatic activity of DJ41_2796 within one minute after subtracting the background value (U/g), and the x–axis represents the protein concentration of DJ41_2796. The reaction mixture contains a final concentration of 10 mM potassium acetate, 0.2 mM succinyl-CoA, 0.1 mM DTNB, and 0 to 10 µM DJ41_2796. The results were obtained from one experiment.
3.5. Kinetic Characterization of DJ41_2796
To better understand the enzymatic performance of DJ41_2796, reactions were tested under different pH and temperature conditions. It was observed that DJ41_2796 had the highest reaction rate (34.9 U/g) in a pH 8.0 phosphate buffer; however, in pH 8.0 Tris-Cl buffer, reaction rates were lower despite being at the same pH. Additionally, a decrease in reaction rates was noted in conditions with the pH exceeding 8.0 (Figure 6A). Subsequently, all enzymatic reactions with DJ41_2796 were carried out in the pH 8.0 phosphate buffer. Interestingly, it was noted that as the temperature increased from 4 °C to 55 °C, reaction rates also increased from 1.4 U/g to 21.7 U/g (Figure 6B), suggesting that DJ41_2796 may exhibit better reaction activity at higher temperatures.
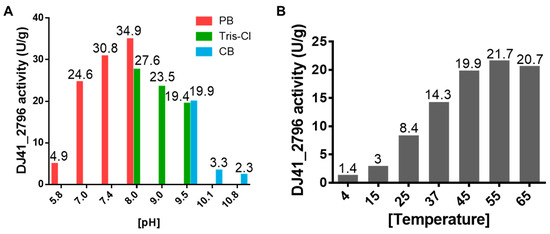
Figure 6.
Assessing the optimal enzymatic activity of DJ41_2796. (A) Enzymatic activity of DJ41_2796 in buffer solutions with different pH values. Red bars represent phosphate buffer (PB), green bars represent Tris-HCl buffer (Tris-Cl), and blue bars represent carbonate–bicarbonate buffer (CB). The y–axis indicates the DJ41_2796 specific activity (U/g), and the numbers on top of each bar represent the activity of DJ41_2796 in that environment. (B) Enzymatic activity of DJ41_2796 under different temperature conditions, with the x–axis representing tested reaction temperatures (°C), and the y–axis indicating DJ41_2796 specific activity (U/g). Each number above the bars represents the enzymatic activity of DJ41_2796 in that environment. The results were obtained from one experiment.
The enzyme kinetics of DJ41_2796 were assessed, using either potassium acetate or sodium acetate as substrates, in order to ascertain whether there was a difference in affinity for these two types of acetate. The KM for potassium acetate was found to be approximately twice as high as that for sodium acetate, indicating that a higher concentration of potassium acetate is needed to reach half of Vmax. However, a further assessment of kcat/KM revealed no significant difference in the reaction efficiency between these two substrates. This suggests that DJ41_2796 does not exhibit a significant difference in affinity for these two substrates (Table 5). The enzyme kinetics of DJ41_2796 with succinyl-CoA were also assessed, and it was observed that DJ41_2796 exhibited greater ASCT activity compared to a homologous protein in Acetobacter aceti (Table 5).
Table 5.
Enzyme kinetics of DJ41_2796 for different substrates in pH 8.0 phosphate buffer.
4. Discussion
4.1. Expression of Emas in Ethanol and Acetate May Be Inhibited by Other Regulatory Proteins
Previous research showed that EmaSR plays a role in A. baumannii ethanol metabolism [18]. In this study, the wild-type strain exhibited an increase in the expression levels of various promoters, including PemaR and the promoter of EmaSR regulons, in ethanol-containing environments. In acetate-containing environments, there was also an upward trend in expression levels, except for PemaS. Furthermore, it was observed that expression levels of PemaS in ∆emaS were higher than in the wild-type strain, regardless of whether the environment contained ethanol or acetate. In the absence of EmaS to transfer phosphate, EmaR may regulate downstream genes by receiving phosphate from other factors. There may also be other factors that act to inhibit EmaS in the wild-type strain, which could result in higher expression of PemaS in ∆emaS compared to the wild type. A similar scenario has been observed in P. aeruginosa, where it was found that the regulatory protein HapZ interacts with the REC domain of the sensor protein SagS when bound to cyclic di-GMP, thereby inhibiting phosphate transfer between SagS and downstream proteins [26]. Through SMART (Simple Modular Architecture Research Tool) analysis of its secondary structure, we found that the sensor protein EmaS also possesses a REC domain within its C-terminal structure, which can receive signals from sensor proteins and bind with DNA. Therefore, based on the functions predicted in the NCBI database, EmaS is also annotated as a hybrid sensor histidine kinase/response regulator, similar to SagS. From this, it can be inferred that EmaS may also have the ability to interact with other regulatory proteins, and in ethanol- or acetate-containing environments, we hypothesize that other factors may be involved in the suppression of signal transduction from EmaS to EmaR, and these may act via binding to the REC structural domain of EmaS.
4.2. DJ41_2796 Plays a Crucial Role in the Ethanol and Acetate Metabolism of A. baumannii ATCC19606
In a study on the toxicity of A. pasteurianus against acetate accumulation, it was confirmed that the expression levels of four proteins increased when exposed to high concentrations of acetate [27]. Overall, three of these proteins were annotated as TCS sensor proteins (two from the NtrB family and one from the SsrA family), and one was annotated as a BaeS and OmpR family regulatory protein [27]. It was also found that the expression of ackA (acetate kinase), acs (acetyl-CoA synthetase), pta (phosphate acetyltransferase), and aarC (ASCT) genes increased in high acetate environments [27]. Although it has not been confirmed that TCSs can directly regulate these genes, the results are indicative of the important role that TCSs and genes involved in acetate metabolism have with regard to A. pasteurianus resistance against acetic acid stress [27,28]. Interestingly, succinyl-CoA synthetase, which can convert succinyl-CoA into succinate and acts in a similar way to ASCT, is retained in many Proteobacteria species, as revealed by genome analysis; however, unlike Proteobacteria, most bacteria in the Actinobacteria and Bacteroidetes phyla predominantly possess only the gene for ASCT [29]. This suggests that ASCT-only bacteria may be using the ASCT enzyme to replace succinyl-CoA synthetase [29,30]. Genomic analysis of A. aceti has shown that the species lacks succinyl-CoA synthetase, and previous research showed that AarC6 in A. aceti may have replaced the function of succinyl-CoA synthetase [31]. DJ41_2796 and AarC in A. aceti exhibit the same enzymatic activity, and although the genome of A. baumannii ATCC 19606 retains a gene annotated as succinyl-CoA synthetase (DJ41_3576), transcriptional analysis of EmaSR confirmed that this gene is not regulated by EmaSR in low concentrations of ethanol [18]. While it is not clear whether DJ41_3576 functions as a succinyl-CoA synthetase, the results of this study affirm that DJ41_2796 may take on an important role in ethanol and acetate metabolism, replacing succinyl-CoA synthetase.
4.3. EmaSR May Influence the Pyruvate Metabolism by Regulating the Metabolism of Ethanol and Acetate
Previous research has demonstrated that in Bacillus subtilis, the enzyme MaeA is highly expressed only in the presence of malate, which is homologous to DJ41_3218. The study confirmed that maeA is regulated by YufL/YufM, which belongs to the CitA/CitB family of TCS and shares homologous proteins with CitA/CitB in E. coli and YdbF/YdbG in K. pneumoniae [32]. These TCSs have been previously shown to regulate the expression of genes involved in the citric acid (TCA) cycle. It was also confirmed that MaeA possesses enzymatic activity as a malate dehydrogenase, thereby substantiating the involvement of YufL/YufM in the regulation of the B. subtilis TCA cycle [32]. Subsequent studies further confirmed that LytS/LytT can increase the expression of the pyruvate transporter protein PftAB. However, when MaeA causes an accumulation of pyruvate within the bacterial cells, this inhibits LytS/LytT, thereby decreasing the expression of pftAB and preventing the loss of pyruvate from secondary carbon sources when bacteria deplete their preferred carbon sources, such as glucose and malate [33]. In this study, although the enzymatic function of DJ41_3218 has not been confirmed, it is annotated to participate in pyruvate metabolism. The functional annotation of DJ41_568-571 also indicates its involvement in pyruvate metabolism. These genes exhibit increased expression in A. baumannii when ethanol is used as a carbon source, and the results resemble the regulation observed in B. subtilis [33]. A. baumannii metabolizes ethanol and acetate as carbon sources to produce pyruvate, and when ethanol and acetate in the environment are depleted, this may upregulate pyruvate metabolism. A previous study showed that B. subtilis regulates pyruvate metabolism through two pairs of TCSs [32], and transcriptional analysis in our previous research [18] also found that more than ten genes annotated with regulatory protein functions are under the control of EmaSR [18]. Therefore, EmaSR may play an important regulatory role not just in ethanol and acetate metabolism but can also influence other metabolic processes.
4.4. EmaSR Regulation of Pyruvate Metabolism and the Relationship with Virulence
In this study, we observed that in ethanol-containing environments, the expression of P2796 is higher than that of P3218. Conversely, in acetate-containing environments, the expression of P3218 is significantly higher than that of P571, P2796 and P3568. DJ41_3218 is annotated as an NAD-dependent malic enzyme, primarily capable of converting malate into pyruvate. Previous research has also confirmed that this enzyme catalyzes the conversion of oxaloacetate to pyruvate in E. coli and Lactobacillus arabinosus [34]. On the other hand, within the EmaSR regulated gene cluster DJ41_566-571, the three genes DJ41_568, DJ41_569, and DJ41_571 have been respectively annotated to encode dihydrolipoyl dehydrogenase, 2-oxo acid dehydrogenase subunit E2, and thiamine pyrophosphate (TPP)-dependent dehydrogenase E1, respectively. These three enzymes collectively work in the metabolic pathway to convert pyruvate into acetyl-CoA. In previous studies, it was found that P. putida KT2440 lost the ability to grow by using pyruvate as a single carbon source when mxtR and erdR were deleted [13]. Furthermore, YufL/YufM also participates in the regulation of pyruvate metabolism in B. subtilis [33]. Previous studies have already demonstrated that MxtR/ErdR and YufL/YufM can regulate pyruvate metabolism. Therefore, we speculate that EmaSR may regulate pyruvate metabolism via DJ41_3218.
Moreover, previous research has shown that the deletion of enzymes in the pyruvate metabolism pathway does not lead to a reduction in adhesins, but decreased bacterial virulence in Streptococcus pneumoniae [35]. In this study, it is suggested that this decrease may be indirectly caused by a lack of energy. Our previous study has also found that the loss of emaS and emaR led to a decrease in the virulence of A. baumannii when infecting Galleria mellonella larvae [18]. Taken together, it is possible that EmaSR may indirectly affect virulence by regulating pyruvate metabolism in A. baumannii.
5. Conclusions
In this study, we found that EmaSR increased the expression levels of DJ41_566-571, DJ41_2796, DJ41_3218, and DJ41_3568, as well as emaR, in ethanol- and acetate-containing environments. Additionally, biochemical functional analysis confirmed the role of DJ41_2796 in the carbon metabolic pathway. Results from the reporter assays showed that EmaSR increased the expression of DJ41_2796, leading to the conversion of more acetate to acetyl-CoA in the ethanol. These results furthered our understanding of EmaSR regulation in A. baumannii. When strains were cultured in a low-concentration ethanol or acetate environment, EmaSR was able to increase the expression of DJ41_2796, aiding in the metabolism of ethanol and acetate. This enables A. baumannii to increase the survival in ethanol and acetate while utilizing them as carbon sources for growth.
Supplementary Materials
The following supporting information can be downloaded at: https://www.mdpi.com/article/10.3390/microorganisms12020331/s1, Figure S1: Map of the TCSG plasmid indicating genes and restriction enzyme sites; Figure S2: Confirmation of E. coli transformation strains carrying promoter-TCSG; Figure S3: Map of the pWH1266G plasmid; Figure S4: Confirmation of E. coli transformation strains carrying pWH1666-derived reporter plasmids; Figure S5: PCR product analysis by 2% agarose gel electrophoresis; Figure S6: Analysis of expressed and purified DJ41_2796 protein by 10% SDS-PAGE; Figure S7: Mean expression levels of EmaSR regulons in E. coli cultured in LB containing 1% ethanol; Figure S8: Mean P2796 fluorescence expression levels in different A. baumannii strains cultured in low-concentration ethanol and acetate; Figure S9: Mean P3218 fluorescence expression levels in different A. baumannii strains cultured in low-concentration ethanol and acetate; Figure S10: Mean PemaR fluorescence expression levels in different A. baumannii strains cultured in low-concentration ethanol and acetate; Figure S11: Mean PemaS fluorescence expression levels in different A. baumannii strains cultured in low-concentration ethanol and acetate.
Author Contributions
Conceptualization, H.-Y.S. and G.-H.L.; methodology, H.-Y.S. and G.-H.L.; software, H.-Y.S.; validation, Y.-W.H., H.-Y.S. and G.-H.L.; formal analysis, H.-Y.S. and G.-H.L.; investigation, Y.-W.H. and G.-H.L.; resources, G.-H.L.; data curation, Y.-W.H.; writing—original draft preparation, Y.-W.H. and G.-H.L.; writing—review and editing, H.-Y.S., Y.-W.H. and G.-H.L.; visualization, Y.-W.H. and G.-H.L.; supervision, G.-H.L.; project administration, G.-H.L.; funding acquisition, G.-H.L. All authors have read and agreed to the published version of the manuscript.
Funding
This study was funded by the Taiwan National Science and Technology Council under Grant No. MOST111-2635B320-001-MY2 to Guang-Huey Lin, and by the Buddhist Tzu Chi Medical Foundation under Grant No. TCMF11139A to Guang-Huey Lin.
Data Availability Statement
The data presented in this study are available upon reasonable request from the corresponding author.
Acknowledgments
The authors are grateful for the support from the Core Facility Center, Tzu Chi University.
Conflicts of Interest
The authors declare no conflicts of interest. The funders had no role in the design of the study; in the collection, analyses, or interpretation of data; in the writing of the manuscript; or in the decision to publish the results.
References
- Lo, E.A.-G.; Law, L.S.-C.; Tan, K.; Ashokka, B. A review of the science and clinical use of alcohol-based hand rubs. Int. J. Infect. Control 2022, 18, 20611. [Google Scholar] [CrossRef]
- Yeung, Y.W.S.; Ma, Y.; Liu, S.Y.; Pun, W.H.; Chua, S.L. Prevalence of alcohol-tolerant and antibiotic-resistant bacterial pathogens on public hand sanitizer dispensers. J. Hosp. Infect. 2022, 127, 26–33. [Google Scholar] [CrossRef]
- Kampf, G. Ethanol. In Antiseptic Stewardship: Biocide Resistance and Clinical Implications; Kampf, G., Ed.; Springer: Cham, Switzerland, 2018; pp. 9–35. [Google Scholar]
- Tashiro, Y.; Inagaki, A.; Ono, K.; Inaba, T.; Yawata, Y.; Uchiyama, H.; Nomura, N. Low concentrations of ethanol stimulate biofilm and pellicle formation in Pseudomonas aeruginosa. Biosci. Biotechnol. Biochem. 2014, 78, 178–181. [Google Scholar] [CrossRef]
- Reid, M.F.; Fewson, C.A. Molecular characterization of microbial alcohol dehydrogenases. Crit. Rev. Microbiol. 1994, 20, 13–56. [Google Scholar] [CrossRef]
- Shortall, K.; Djeghader, A.; Magner, E.; Soulimane, T. Insights into Aldehyde Dehydrogenase Enzymes: A Structural Perspective. Front. Mol. Biosci. 2021, 8, 659550. [Google Scholar] [CrossRef]
- Xiong, R.G.; Zhou, D.D.; Wu, S.X.; Huang, S.Y.; Saimaiti, A.; Yang, Z.J.; Shang, A.; Zhao, C.N.; Gan, R.Y.; Li, H.B. Health Benefits and Side Effects of Short-Chain Fatty Acids. Foods 2022, 11, 2863. [Google Scholar] [CrossRef]
- Machado, M.G.; Patente, T.A.; Rouillé, Y.; Heumel, S.; Melo, E.M.; Deruyter, L.; Pourcet, B.; Sencio, V.; Teixeira, M.M.; Trottein, F. Acetate Improves the Killing of Streptococcus pneumoniae by Alveolar Macrophages via NLRP3 Inflammasome and Glycolysis-HIF-1α Axis. Front. Immunol. 2022, 13, 773261. [Google Scholar] [CrossRef]
- El-Mansi, M. Control of central metabolism’s architecture in Escherichia coli: An overview. Microbiol. Res. 2023, 266, 127224. [Google Scholar] [CrossRef]
- Mutyala, S.; Kim, J.R. Recent advances and challenges in the bioconversion of acetate to value-added chemicals. Bioresour. Technol. 2022, 364, 128064. [Google Scholar] [CrossRef]
- Hempel, N.; Görisch, H.; Mern, D.S. Gene ercA, encoding a putative iron-containing alcohol dehydrogenase, is involved in regulation of ethanol utilization in Pseudomonas aeruginosa. J. Bacteriol. 2013, 195, 3925–3932. [Google Scholar] [CrossRef] [PubMed]
- Badal, D.; Jayarani, A.V.; Kollaran, M.A.; Prakash, D.; Monisha, P.; Singh, V. Foraging Signals Promote Swarming in Starving Pseudomonas aeruginosa. mBio 2021, 12, e0203321. [Google Scholar] [CrossRef] [PubMed]
- Henríquez, T.; Hsu, J.S.; Hernandez, J.S.; Kuppermann, S.; Eder, M.; Jung, H. Contribution of Uncharacterized Target Genes of MxtR/ErdR to Carbon Source Utilization by Pseudomonas putida KT2440. Microbiol. Spectr. 2023, 11, e0292322. [Google Scholar] [CrossRef] [PubMed]
- Casella, L.G.; Torres, N.J.; Tomlinson, B.R.; Shepherd, M.; Shaw, L.N. The novel two-component system AmsSR governs alternative metabolic pathway usage in Acinetobacter baumannii. Front. Microbiol. 2023, 14, 1139253. [Google Scholar] [CrossRef] [PubMed]
- Wang, L.; Huang, X.; Jin, Q.; Tang, J.; Zhang, H.; Zhang, J.R.; Wu, H. Two-Component Response Regulator OmpR Regulates Mucoviscosity through Energy Metabolism in Klebsiella pneumoniae. Microbiol. Spectr. 2023, 11, e0054423. [Google Scholar] [CrossRef] [PubMed]
- Wittekind, M.A. The Small Protein ScrA Is a Novel Regulator of Staphylococcus aureus Virulence Acting as an Intermediary between the ArlRS and SaeRS Two-Component Systems. Ph.D. Dissertation, Ohio University, Athens, OH, USA. Available online: https://www.proquest.com/dissertations-theses/small-protein-scra-is-novel-regulator-em/docview/2856749705/se-2 (accessed on 5 May 2023).
- Lin, G.H.; Hsieh, M.C.; Shu, H.Y. Role of Iron-Containing Alcohol Dehydrogenases in Acinetobacter baumannii ATCC 19606 Stress Resistance and Virulence. Int. J. Mol. Sci. 2021, 22, 9921. [Google Scholar] [CrossRef] [PubMed]
- Shu, H.Y.; Huang, Y.W.; Tsai, P.Y.; Hsieh, K.S.; Lin, G.H. Role of EmaSR in Ethanol Metabolism by Acinetobacter baumannii. Int. J. Mol. Sci. 2022, 23, 12606. [Google Scholar] [CrossRef]
- Hunger, M.; Schmucker, R.; Kishan, V.; Hillen, W. Analysis and nucleotide sequence of an origin of DNA replication in Acinetobacter calcoaceticus and its use for Escherichia coli shuttle plasmids. Gene 1990, 87, 45–51. [Google Scholar] [CrossRef]
- Bouvet, P.J.M.; Grimont, P.A.D. Taxonomy of the genus Acinetobacter with the recognition of Acinetobacter baumannii sp. nov., Acinetobacter haemolyticus sp. nov., Acinetobacter johnsonii sp. nov., and Acinetobacter junii sp. nov. and emended descriptions of Acinetobacter calcoaceticus and Acinetobacter lwoffii. Int. J. Syst. Evol. Microbiol. 1986, 36, 228–240. [Google Scholar]
- Chen, T.L.; Siu, L.K.; Wu, R.C.; Shaio, M.F.; Huang, L.Y.; Fung, C.P.; Lee, C.M.; Cho, W.L. Comparison of one-tube multiplex PCR, automated ribotyping and intergenic spacer (ITS) sequencing for rapid identification of Acinetobacter baumannii. Clin. Microbiol. Infect. 2007, 13, 801–806. [Google Scholar] [CrossRef]
- Crameri, A.; Whitehorn, E.A.; Tate, E.; Stemmer, W.P. Improved green fluorescent protein by molecular evolution using DNA shuffling. Nat. Biotechnol. 1996, 14, 315–319. [Google Scholar] [CrossRef]
- Mullins, E.A.; Kappock, T.J. Crystal structures of Acetobacter aceti succinyl-coenzyme A (CoA): Acetate CoA-transferase reveal specificity determinants and illustrate the mechanism used by class I CoA-transferases. Biochemistry 2012, 51, 8422–8434. [Google Scholar] [CrossRef] [PubMed]
- Mochizuki, K.; Inaoka, D.K.; Mazet, M.; Shiba, T.; Fukuda, K.; Kurasawa, H.; Millerioux, Y.; Boshart, M.; Balogun, E.O.; Harada, S.; et al. The ASCT/SCS cycle fuels mitochondrial ATP and acetate production in Trypanosoma brucei. Biochim. Biophys. Acta Bioenerg. 2020, 1861, 148283. [Google Scholar] [CrossRef] [PubMed]
- Eyer, P.; Worek, F.; Kiderlen, D.; Sinko, G.; Stuglin, A.; Simeon-Rudolf, V.; Reiner, E. Molar absorption coefficients for the reduced Ellman reagent: Reassessment. Anal. Biochem. 2003, 312, 224–227. [Google Scholar] [CrossRef] [PubMed]
- Römling, U.; Cao, L.Y.; Bai, F.W. Evolution of cyclic di-GMP signalling on a short and long term time scale. Microbiology 2023, 169, 001354. [Google Scholar] [CrossRef] [PubMed]
- Xia, K.; Han, C.; Xu, J.; Liang, X. Transcriptome response of Acetobacter pasteurianus Ab3 to high acetic acid stress during vinegar production. Appl. Microbiol. Biotechnol. 2020, 104, 10585–10599. [Google Scholar] [CrossRef]
- Yang, H.; Chen, T.; Wang, M.; Zhou, J.; Liebl, W.; Barja, F.; Chen, F. Molecular biology: Fantastic toolkits to improve knowledge and application of acetic acid bacteria. Biotechnol. Adv. 2022, 58, 107911. [Google Scholar] [CrossRef]
- Kwong, W.K.; Zheng, H.; Moran, N.A. Convergent evolution of a modified, acetate-driven TCA cycle in bacteria. Nat. Microbiol. 2017, 2, 17067. [Google Scholar] [CrossRef]
- Zhang, B.; Lingga, C.; Bowman, C.; Hackmann, T.J. A New Pathway for Forming Acetate and Synthesizing ATP during Fermentation in Bacteria. Appl. Environ. Microbiol. 2021, 87, e0295920. [Google Scholar] [CrossRef]
- Arai, H.; Sakurai, K.; Ishii, M. Metabolic Features of Acetobacter aceti. In Acetic Acid Bacteria: Ecology and Physiology; Matsushita, K., Toyama, H., Tonouchi, N., Okamoto-Kainuma, A., Eds.; Springer: Tokyo, Japan, 2016; pp. 255–271. [Google Scholar]
- Doan, T.; Servant, P.; Tojo, S.; Yamaguchi, H.; Lerondel, G.; Yoshida, K.I.; Fujita, Y.; Aymerich, S. The Bacillus subtilis ywkA gene encodes a malic enzyme and its transcription is activated by the YufL/YufM two-component system in response to malate. Microbiology 2003, 149, 2331–2343. [Google Scholar] [CrossRef][Green Version]
- Charbonnier, T.; Le Coq, D.; McGovern, S.; Calabre, M.; Delumeau, O.; Aymerich, S.; Jules, M. Molecular and Physiological Logics of the Pyruvate-Induced Response of a Novel Transporter in Bacillus subtilis. mBio 2017, 8, e00976-17. [Google Scholar] [CrossRef] [PubMed]
- Yamaguchi, M. Studies on regulatory functions of malic enzymes. IV. Effects of sulfhydryl group modification on the catalytic function of NAD-linked malic enzyme from Escherichia coli. J. Biochem. 1979, 86, 325–333. [Google Scholar] [CrossRef] [PubMed]
- Echlin, H.; Frank, M.; Rock, C.; Rosch, J.W. Role of the pyruvate metabolic network on carbohydrate metabolism and virulence in Streptococcus pneumoniae. Mol. Microbiol. 2020, 114, 536–552. [Google Scholar] [CrossRef] [PubMed]


Disclaimer/Publisher’s Note: The statements, opinions and data contained in all publications are solely those of the individual author(s) and contributor(s) and not of MDPI and/or the editor(s). MDPI and/or the editor(s) disclaim responsibility for any injury to people or property resulting from any ideas, methods, instructions or products referred to in the content. |
© 2024 by the authors. Licensee MDPI, Basel, Switzerland. This article is an open access article distributed under the terms and conditions of the Creative Commons Attribution (CC BY) license (https://creativecommons.org/licenses/by/4.0/).