

Extracts of Talaromyces purpureogenus Strains from Apis mellifera Bee Bread Inhibit the Growth of Paenibacillus spp. In Vitro
 ,
,  , , , , and
Abstract
1. Introduction
2. Materials and Methods
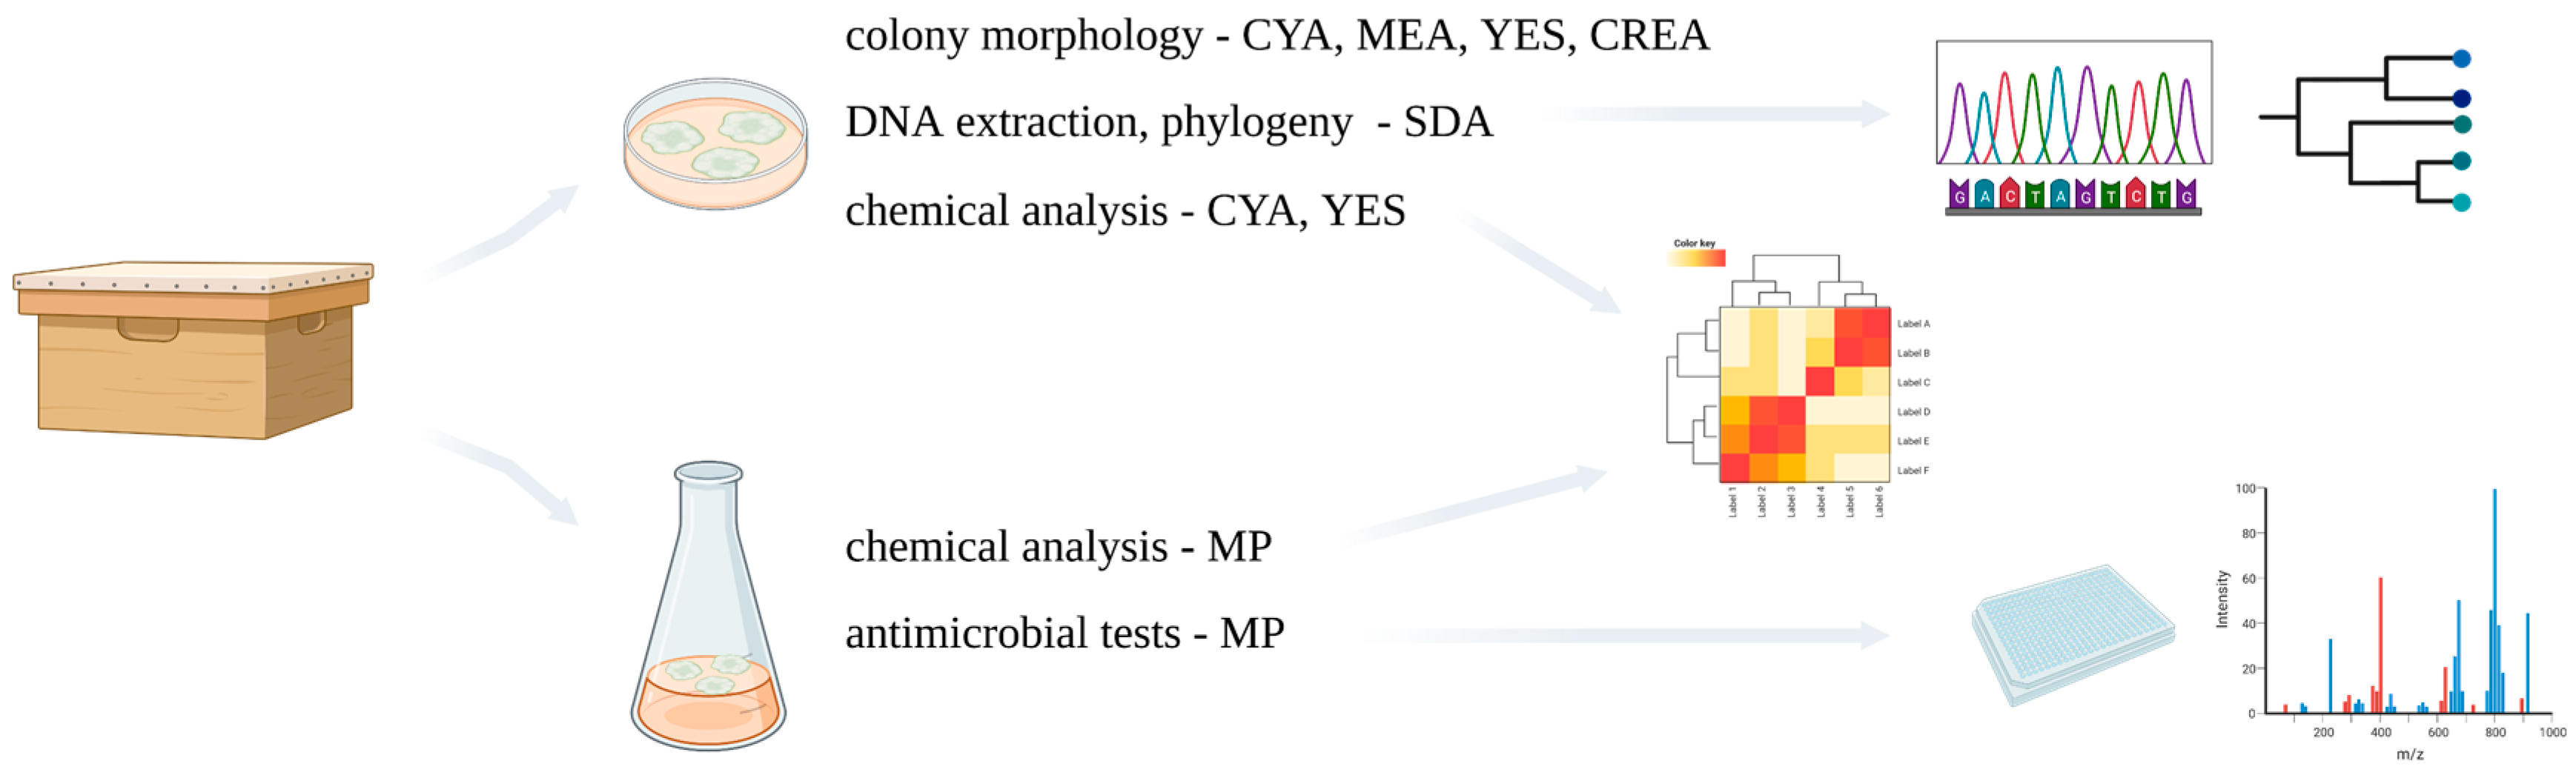
2.1. Bee Bread Collection and Fungal Cultivation
2.2. Extract Preparation for Chemical Analysis and Antimicrobial Tests
2.3. Molecular Barcoding and Phylogenetics
2.4. Detection of Talaromyces spp. at Different Time Points and Locations
2.5. UHPLC-HR-MS Analysis and Metabolic Fingerprinting
2.6. Evaluation of Antimicrobial Activity
2.6.1. Antifungal Activity Test
2.6.2. Antibacterial Activity Test
2.6.3. Bioactivity-Guided Dereplication
3. Results
3.1. Colony Morphology
3.2. Molecular and Phylogenetic Characterization
3.3. Metabolic Fingerprinting
3.4. Antimicrobial Activity and Bioactivity-Guided Dereplication
4. Discussion
5. Conclusions
Supplementary Materials
Author Contributions
Funding
Data Availability Statement
Acknowledgments
Conflicts of Interest
References
- Ollerton, J.; Winfree, R.; Tarrant, S. How Many Flowering Plants Are Pollinated by Animals? Oikos 2011, 120, 321–326. [Google Scholar] [CrossRef]
- Klein, A.M.; Vaissiere, B.E.; Cane, J.H.; Steffan-Dewenter, I.; Cunningham, S.A.; Kremen, C.; Tscharntke, T. Importance of Pollinators in Changing Landscapes for World Crops. Proc. R. Soc. B Biol. Sci. 2007, 274, 303–313. [Google Scholar] [CrossRef] [PubMed]
- Gallai, N.; Salles, J.; Settele, J.; Vaissière, B.E.; Pollinisation, L.; Abeilles, E.; Abeilles, U.M.R.; Cedex, A.; Lameta, U.M.R.; Cedex, M. Economic Valuation of the Vulnerability of World Agriculture Confronted with Pollinator Decline. Ecol. Econ. 2009, 68, 810–821. [Google Scholar] [CrossRef]
- Lautenbach, S.; Seppelt, R.; Liebscher, J.; Dormann, C.F. Spatial and Temporal Trends of Global Pollination Benefit. PLoS ONE 2012, 7, e35954. [Google Scholar] [CrossRef] [PubMed]
- Potts, S.G.; Imperatriz-Fonseca, V.; Ngo, H.T.; Aizen, M.A.; Biesmeijer, J.C.; Breeze, T.D.; Dicks, L.V.; Garibaldi, L.A.; Hill, R.; Settele, J.; et al. Safeguarding Pollinators and Their Values to Human Well-Being. Nature 2016, 540, 220–229. [Google Scholar] [CrossRef]
- Aizen, M.A.; Garibaldi, L.A.; Cunningham, S.A.; Klein, A.M. Long-Term Global Trends in Crop Yield and Production Reveal No Current Pollination Shortage but Increasing Pollinator Dependency. Curr. Biol. 2008, 18, 1572–1575. [Google Scholar] [CrossRef]
- Aizen, M.A.; Harder, L.D. The Global Stock of Domesticated Honey Bees Is Growing Slower than Agricultural Demand for Pollination. Curr. Biol. 2009, 19, 915–918. [Google Scholar] [CrossRef]
- Potts, S.G.; Biesmeijer, J.C.; Kremen, C.; Neumann, P.; Schweiger, O.; Kunin, W.E. Global Pollinator Declines: Trends, Impacts and Drivers. Trends Ecol. Evol. 2010, 25, 345–353. [Google Scholar] [CrossRef]
- Zattara, E.E.; Aizen, M.A. Worldwide Occurrence Records Suggest a Global Decline in Bee Species Richness. One Earth 2021, 4, 114–123. [Google Scholar] [CrossRef]
- Goulson, D.; Nicholls, E.; Botías, C.; Rotheray, E.L. Bee Declines Driven by Combined Stress from Parasites, Pesticides, and Lack of Flowers. Science. 2015, 347, 1255957. [Google Scholar] [CrossRef]
- Smith, K.M.; Loh, E.H.; Rostal, M.K.; Zambrana-Torrelio, C.M.; Mendiola, L.; Daszak, P. Pathogens, Pests, and Economics: Drivers of Honey Bee Colony Declines and Losses. Ecohealth 2013, 10, 434–445. [Google Scholar] [CrossRef]
- Vilcinskas, A. Pathogens Associated with Invasive or Introduced Insects Threaten the Health and Diversity of Native Species. Curr. Opin. Insect Sci. 2019, 33, 43–48. [Google Scholar] [CrossRef]
- vanEngelsdorp, D.; Meixner, M.D. A Historical Review of Managed Honey Bee Populations in Europe and the United States and the Factors That May Affect Them. J. Invertebr. Pathol. 2010, 103, S80–S95. [Google Scholar] [CrossRef] [PubMed]
- Bruckner, S.; Wilson, M.; Aurell, D.; Rennich, K.; vanEngelsdorp, D.; Steinhauer, N.; Williams, G.R. A National Survey of Managed Honey Bee Colony Losses in the USA: Results from the Bee Informed Partnership for 2017–2018, 2018–2019, and 2019–2020. J. Apic. Res. 2022, 62, 429–443. [Google Scholar] [CrossRef]
- Gray, A.; Noureddine, A.; Arab, A.; Ballis, A.; Brusbardis, V.; Bugeja Douglas, A.; Cadahía, L.; Charrière, J.D.; Chlebo, R.; Coffey, M.F.; et al. Honey Bee Colony Loss Rates in 37 Countries Using the COLOSS Survey for Winter 2019–2020: The Combined Effects of Operation Size, Migration and Queen Replacement. J. Apic. Res. 2022, 62, 204–210. [Google Scholar] [CrossRef]
- Dale, C.; Moran, N.A. Molecular Interactions between Bacterial Symbionts and Their Hosts. Cell 2006, 126, 453–465. [Google Scholar] [CrossRef] [PubMed]
- Schwarz, R.S.; Moran, N.A.; Evans, J.D. Early Gut Colonizers Shape Parasite Susceptibility and Microbiota Composition in Honey Bee Workers. PNAS 2016, 113, 9345–9350. [Google Scholar] [CrossRef]
- Kwong, W.K.; Mancenido, A.L.; Moran, N.A. Immune System Stimulation by the Native Gut Microbiota of Honey Bees. R. Soc. Open Sci. 2017, 4, 170003. [Google Scholar] [CrossRef]
- Dharampal, P.S.; Carlson, C.; Currie, C.R.; Steffan, S.A. Pollen-Borne Microbes Shape Bee Fitness. Proc. R. Soc. B 2019, 286, 20182894. [Google Scholar] [CrossRef]
- Raymann, K.; Moran, N.A. The Role of the Gut Microbiome in Health and Disease of Adult Honey Bee Workers. Curr. Opin. Insect Sci. 2018, 26, 97–104. [Google Scholar] [CrossRef]
- Janashia, I.; Alaux, C. Specific Immune Stimulation by Endogenous Bacteria in Honey Bees (Hymenoptera: Apidae). J. Econ. Entomol. 2016, 109, 1474–1477. [Google Scholar] [CrossRef] [PubMed]
- Emery, O.; Schmidt, K.; Engel, P. Immune System Stimulation by the Gut Symbiont Frischella perrara in the Honey Bee (Apis mellifera). Mol. Ecol. 2017, 26, 2576–2590. [Google Scholar] [CrossRef] [PubMed]
- Powell, J.E.; Martinson, V.G.; Urban-Mead, K.; Moran, N.A. Routes of Acquisition of the Gut Microbiota of the Honey Bee Apis mellifera. Appl. Environ. Microbiol. 2014, 80, 7378–7387. [Google Scholar] [CrossRef] [PubMed]
- Moran, N.A.; Hansen, A.K.; Powell, J.E.; Sabree, Z.L. Distinctive Gut Microbiota of Honey Bees Assessed Using Deep Sampling from Individual Worker Bees. PLoS ONE 2012, 7, e36393. [Google Scholar] [CrossRef] [PubMed]
- Martinson, V.G.; Danforth, B.N.; Minckley, R.L.; Rueppell, O.; Tingek, S.; Moran, N.A. A Simple and Distinctive Microbiota Associated with Honey Bees and Bumble Bees. Mol. Ecol. 2011, 20, 619–628. [Google Scholar] [CrossRef] [PubMed]
- Ellegaard, K.M.; Engel, P. Genomic Diversity Landscape of the Honey Bee Gut Microbiota. Nat. Commun. 2019, 10, 446. [Google Scholar] [CrossRef] [PubMed]
- Kwong, W.K.; Moran, N.A. Gut Microbial Communities of Social Bees. Nat. Rev. Microbiol. 2016, 14, 374–384. [Google Scholar] [CrossRef]
- Smutin, D.; Lebedev, E.; Selitskiy, M.; Panyushev, N.; Adonin, L. Micro”bee”ota: Honey Bee Normal Microbiota as a Part of Superorganism. Microorganisms 2022, 10, 2359. [Google Scholar] [CrossRef]
- Dimov, S.G.; Zagorchev, L.; Iliev, M.; Dekova, T.; Ilieva, R.; Kitanova, M.; Georgieva-Miteva, D.; Dimitrov, M.; Peykov, S. A Snapshot Picture of the Fungal Composition of Bee Bread in Four Locations in Bulgaria, Differing in Anthropogenic Influence. J. Fungi 2021, 109, 1474–1477. [Google Scholar] [CrossRef]
- Gilliam, M.; Prest, D.B.; Lorenz, B.J. Microbiology of Pollen and Bee Bread: Taxonomy and Enzymology of Molds. Apidologie 1989, 20, 53–68. [Google Scholar] [CrossRef]
- Berenbaum, M.R.; Johnson, R.M. Xenobiotic Detoxification Pathways in Honey Bees. Curr. Opin. Insect Sci. 2015, 10, 51–58. [Google Scholar] [CrossRef]
- Gilliam, M. Identication and Roles of Non-Pathogenic Microflora Associated with Honey Bees. 1997, 155, 1–10. [CrossRef]
- Gilliam, M.; Taber, S.; Lorenz, B.J.; Prest, D.B. Factors Affecting Development of Chalkbrood Disease in Colonies of Honey Bees, Apis Mellifera, Fed Pollen Contaminated with Ascosphaera Apis. J. Invertebr. Pathol. 1988, 52, 314–325. [Google Scholar] [CrossRef]
- Disayathanoowat, T.; Li, H.; Supapimon, N.; Suwannarach, N.; Lumyong, S.; Chantawannakul, P.; Guo, J. Different Dynamics of Bacterial and Fungal Communities in Hive-Stored Bee Bread and Their Possible Roles: A Case Study from Two Commercial Honey Bees in China. Microorganisms 2020, 8, 264. [Google Scholar] [CrossRef]
- Stamets, P.E.; Naeger, N.L.; Evans, J.D.; Han, J.O.; Hopkins, B.K.; Lopez, D.; Moershel, H.M.; Nally, R.; Sumerlin, D.; Taylor, A.W.; et al. Extracts of Polypore Mushroom Mycelia Reduce Viruses in Honey Bees. Sci. Rep. 2018, 8, 508. [Google Scholar] [CrossRef]
- Vocadlova, K.; Lamp, B.; Benes, K.; Matha, V.; Lee, K.-Z.; Vilcinskas, A. Crude Extracts of Talaromyces Strains (Ascomycota) Affect. Viruses 2023, 15, 343. [Google Scholar] [CrossRef]
- Hsu, C.K.; Wang, D.Y.; Wu, M.C. A Potential Fungal Probiotic Aureobasidium melanogenum Ck-Csc for the Western Honey Bee, Apis Mellifera. J. Fungi 2021, 7, 508. [Google Scholar] [CrossRef]
- Zhai, M.M.; Li, J.; Jiang, C.X.; Shi, Y.P.; Di, D.L.; Crews, P.; Wu, Q.X. The Bioactive Secondary Metabolites from Talaromyces Species. Nat. Products Bioprospect. 2016, 6, 1–24. [Google Scholar] [CrossRef]
- Nicoletti, R.; Salvatore, M.M.; Andolfi, A. Secondary Metabolites of Mangrove-Associated Strains of Talaromyces. Mar. Drugs 2018, 16, 12. [Google Scholar] [CrossRef]
- Mizuno, K.; Yagi, A.; Takada, M.; Matsuura, K.; Yamaguchi, K. Letter: A New Antibiotic, Talaron. J. Antibiot. 1974, 27, 560–563. [Google Scholar] [CrossRef][Green Version]
- Mapari, S.A.S.; Meyer, A.S.; Thrane, U.; Frisvad, J.C. Identification of Potentially Safe Promising Fungal Cell Factories for the Production of Polyketide Natural Food Colorants Using Chemotaxonomic Rationale. Microb. Cell Fact. 2009, 8, 24. [Google Scholar] [CrossRef]
- Nicoletti, R. Talaromyces—Insect Relationships. Microorganisms 2022, 10, 45. [Google Scholar] [CrossRef]
- Sandeepani, H.P.; Ratnaweera, P.B. Antibacterial Activity of Entomopathogenic Fungi Isolated from Vespa affinis and Apis dorsata in Sri Lanka. Proceedings of 1st International Conference on Frontiers in Chemical Technology, Colombo, Sri Lanka, 20–22 July 2020; p. 29. [Google Scholar]
- Lopes, L.Q.S.; Quatrin, P.M.; De Souza, M.E.; Vaucher, R.D.A.; Santos, R.C.V. Fungal Infections In Honey Bees. Fungal Genom. Biol. 2015, 5, 1000118. [Google Scholar] [CrossRef]
- Djordjevic, S.P.; Forbes, W.A.; Smith, L.A.; Hornitzky, M.A. Genetic and Biochemical Diversity among Isolates of Paenibacillus alvei Cultured from Australian Honeybee (Apis mellifera) Colonies. Appl. Environ. Microbiol. 2000, 66, 1098–1106. [Google Scholar] [CrossRef]
- WOAH. European Foulbrood of Honey Bees (Infection of Honey Bees with Melissococcus plutonius). In OIE Terrestrial Manual; WOAH: Paris, France, 2018; pp. 736–743.plutonius). In OIE Terrestrial Manual; WOAH: Paris, France, 2018; pp. 736–743. [Google Scholar]
- Jensen, A.B.; Hughes, W.O.H.; Foley, K. The Distribution of Aspergillus Spp. Opportunistic Parasites in Hives and Their Pathogenicity to Honey Bees. Veter Microbiol. 2014, 169, 203–210. [Google Scholar] [CrossRef]
- Roetschi, A.; Berthoud, H.; Kuhn, R.; Imdorf, A. Infection Rate Based on Quantitative Real-Time PCR of Melissococcus plutonius, the Causal Agent of European Foulbrood, in Honeybee Colonies before and after Apiary Sanitation. Apidologie 2008, 39, 362–371. [Google Scholar] [CrossRef]
- Richards, E.D.; Tell, L.A.; Davis, J.L.; Baynes, R.E.; Lin, Z.; Maunsell, F.P.; Riviere, J.E.; Jaberi-Douraki, M.; Martin, K.L.; Davidson, G. Honey Bee Medicine for Veterinarians and Guidance for Avoiding Violative Chemical Residues in Honey. J. Am. Vet. Med. Assoc. 2021, 259, 860–873. [Google Scholar] [CrossRef]
- Wilkins, S.; Brown, M.A.; Cuthbertson, A.G.S. The Incidence of Honey Bee Pests and Diseases in England and Wales. Pest Manag. Sci. 2007, 63, 1062–1068. [Google Scholar] [CrossRef]
- Seyedmousavi, S.; Guillot, J.; Arné, P.; De Hoog, G.S.; Mouton, J.W.; Melchers, W.J.G.; Verweij, P.E. Aspergillus and Aspergilloses in Wild and Domestic Animals: A Global Health Concern with Parallels to Human Disease. Med. Mycol. 2015, 53, 765–797. [Google Scholar] [CrossRef]
- Samson, R.A.; Houbraken, J.; Thrane, U.; Frisvad, J.C.; Andersen, B. Food and Indoor Fungi, 2nd ed.; CBS-KNAW Fungal Biodiversity Centre: Utrecht, The Netherlands, 2010; ISBN 9789491751189. [Google Scholar]
- GIMP. The GIMP Develompment Team. Available online: https://www.gimp.org (accessed on 15 December 2020).
- Yilmaz, N.; Visagie, C.M.; Houbraken, J.; Frisvad, J.C.; Samson, R.A. Polyphasic Taxonomy of the Genus Talaromyces. Stud. Mycol. 2014, 78, 175–341. [Google Scholar] [CrossRef]
- Glass, N.L.; Donaldson, G.C. Development of Primer Sets Designed for Use with the PCR to Amplify Conserved Genes from Filamentous Ascomycetes. Appl. Environ. Microbiol. 1995, 61, 1323–1330. [Google Scholar] [CrossRef]
- Gardes, M.; Bruns, T.D. ITS Primers with Enhanced Specificity for Basidiomycetes-Application to the Identification of Mycorrhizae and Rusts. Mol. Ecol. 1993, 2, 113–118. [Google Scholar] [CrossRef]
- White, T.J.; Bruns, S.; Lee, S.; Taylor, J. Amplification and Direct Sequencing of Fungal Ribosomal RNA Genes for Phylogenetics. In PCR Protocols: A Guide to Methods and Applications; Academic Press: San Diego, CA, USA, 1990; pp. 315–322. [Google Scholar]
- Peterson, S.W.; Vega, F.E.; Posada, F.; Nagai, C. Penicillium coffeae, a New Endophytic Species Isolated from a Coffee Plant and Its Phylogenetic Relationship to P. Fellutanum, P. Thiersii and P. Brocae Based on Parsimony Analysis of Multilocus DNA Sequences. Mycologia 2005, 97, 659–666. [Google Scholar] [CrossRef]
- Liu, Y.J.; Whelen, S.; Hall, B.D. Phylogenetic Relationships among Ascomycetes: Evidence from an RNA Polymerse II Subunit. Mol. Biol. Evol. 1999, 16, 1799–1808. [Google Scholar] [CrossRef]
- Altschul, S.F.; Gish, W.; Miller, W.; Myers, E.W.; Lipman, D.J. Basic Local Alignment Search Tool. J. Mol. Biol. 1990, 215, 403–410. [Google Scholar] [CrossRef]
- Raja, H.A.; Miller, A.N.; Pearce, C.J.; Oberlies, N.H. Fungal Identification Using Molecular Tools: A Primer for the Natural Products Research Community. J. Nat. Prod. 2017, 80, 756–770. [Google Scholar] [CrossRef]
- Nguyen, L.T.; Schmidt, H.A.; Von Haeseler, A.; Minh, B.Q. IQ-TREE: A Fast and Effective Stochastic Algorithm for Estimating Maximum-Likelihood Phylogenies. Mol. Biol. Evol. 2015, 32, 268–274. [Google Scholar] [CrossRef]
- Minh, B.Q.; Nguyen, M.A.T.; Von Haeseler, A. Ultrafast Approximation for Phylogenetic Bootstrap. Mol. Biol. Evol. 2013, 30, 1188–1195. [Google Scholar] [CrossRef]
- Castresana, J. Selection of Conserved Blocks from Multiple Alignments for Their Use in Phylogenetic Analysis. Mol. Biol. Evol. 2000, 17, 540–552. [Google Scholar] [CrossRef]
- Talavera, G.; Castresana, J. Improvement of Phylogenies after Removing Divergent and Ambiguously Aligned Blocks from Protein Sequence Alignments. Syst. Biol. 2007, 56, 564–577. [Google Scholar] [CrossRef]
- Miller, M.A.; Pfeiffer, W.; Schwartz, T. Creating the CIPRES Science Gateway for Inference of Large Phylogenetic Trees. In Proceedings of the 2010 gateway computing environments workshop (GCE), New Orleans, LA, USA, 14 November 2010; pp. 1–8. [Google Scholar]
- Ronquist, F.; Teslenko, M.; van der Mark, P.; Ayres, D.L.; Darling, A.; Höhna, S.; Larget, B.; Liu, L.; Suchard, M.A.; Huelsenbeck, J.P. MrBayes 3.2: Efficient Bayesian Phylogenetic Inference and Model Choice across a Large Model Space. Syst. Biol. 2012, 61, 539–542. [Google Scholar] [CrossRef]
- Huelsenbeck, J.P.; Ronquist, F. MRBAYES: Bayesian Inference of Phylogenetic Trees. Bioinformatics 2001, 17, 754–755. [Google Scholar] [CrossRef] [PubMed]
- Ronquist, F.; Huelsenbeck, J.P. MrBayes 3: Bayesian Phylogenetic Inference under Mixed Models. Bioinformatics 2003, 19, 1572–1574. [Google Scholar] [CrossRef] [PubMed]
- Letunic, I.; Bork, P. Interactive Tree of Life (ITOL) v5: An Online Tool for Phylogenetic Tree Display and Annotation. Nucleic Acids Res. 2021, 49, W293–W296. [Google Scholar] [CrossRef]
- Marner, M.; Hartwig, C.; Patras, M.A.; Wodi, S.I.M.; Rieuwpassa, F.J.; Ijong, F.G.; Balansa, W. Sustainable Low-Volume Analysis of Environmental Samples by Semi-Automated Prioritization of Extracts for Natural Product Research (SeaPEPR). Mar. Drugs 2020, 18, 649. [Google Scholar] [CrossRef]
- Espinel-Ingroff, A.; Cantón, E.; Pemán, J. Antifungal Susceptibility Testing of Filamentous Fungi. Curr. Fungal Infect. Rep. 2012, 6, 41–50. [Google Scholar] [CrossRef]
- Petrikkou, E.; Rodríguez-Tudela, J.L.; Cuenca-Estrella, M.; Gómez, A.; Molleja, A.; Mellado, E. Inoculum Standardization for Antifungal Susceptibility Testing of Filamentous Fungi Pathogenic for Humans. J. Clin. Microbiol. 2001, 39, 1345–1347. [Google Scholar] [CrossRef]
- Balouiri, M.; Sadiki, M.; Ibnsouda, S.K. Methods for in Vitro Evaluating Antimicrobial Activity: A Review. J. Pharm. Anal. 2016, 6, 71–79. [Google Scholar] [CrossRef]
- Kresna, I.D.M.; Wuisan, Z.G.; Pohl, J.M.; Mettal, U.; Otoya, V.L.; Gand, M.; Marner, M.; Otoya, L.L.; Bohringer, N.; Vilcinskas, A.; et al. Genome-Mining-Guided Discovery and Characterization of the PKS-NRPS-Hybrid Polyoxyperuin Produced by a Marine-Derived Streptomycete. J. Nat. Prod. 2022, 85, 888–898. [Google Scholar] [CrossRef]
- Marner, M.; Patras, M.A.; Kurz, M.; Zubeil, F.; Forster, F.; Schuler, S.; Bauer, A.; Hammann, P.; Vilcinskas, A.; Schaberle, T.F.; et al. Molecular Networking-Guided Discovery and Characterization of Stechlisins, a Group of Cyclic Lipopeptides from a Pseudomonas Sp. J. Nat. Prod. 2020, 83, 2607–2617. [Google Scholar] [CrossRef]
- Wang, L.; Linares-Otoya, V.; Liu, Y.; Mettal, U.; Marner, M.; Armas-Mantilla, L.; Willbold, S.; Kurtan, T.; Linares-Otoya, L.; Schaberle, T.F. Discovery and Biosynthesis of Antimicrobial Phenethylamine Alkaloids from the Marine Flavobacterium Tenacibaculum discolor sv11. J. Nat. Prod. 2022, 85, 1039–1051. [Google Scholar] [CrossRef]
- Fox, J.L. Fraunhofer to Mine Sanofi Microbial Collection. Nat. Biotechnol. 2014, 32, 305. [Google Scholar] [CrossRef] [PubMed]
- Bhagobaty, R.K.; Joshi, S.R. Multi-Loci Molecular Characterisation of Endophytic Fungi Isolated from Five Medicinal Plants of Meghalaya, India. Mycobiology 2011, 39, 71–78. [Google Scholar] [CrossRef]
- Rodríguez-Andrade, E.; Stchigel, A.M.; Terrab, A.; Guarro, J.; Cano-Lira, J.F. Diversity of Xerotolerant and Xerophilic Fungi in Honey. IMA Fungus 2019, 10, 20. [Google Scholar] [CrossRef] [PubMed]
- Barbosa, R.N.; Bezerra, J.D.P.; Souza-Motta, C.M.; Frisvad, J.C.; Samson, R.A.; Oliveira, N.T.; Houbraken, J. New Penicillium and Talaromyces Species from Honey, Pollen and Nests of Stingless Bees. Antonie van Leeuwenhoek 2018, 111, 1883–1912. [Google Scholar] [CrossRef]
- Parish, J.B.; Scott, E.S.; Hogendoorn, K. Collection of Conidia of Podosphaera xanthii by Honey Bee Workers. Australas. Plant Pathol. 2020, 49, 245–247. [Google Scholar] [CrossRef]
- Shaw, D.E. The Incidental Collection of Fungal Spores by Bees and the Collection of Spores in Lieu of Pollen. Bee World 1990, 71, 158–176. [Google Scholar] [CrossRef]
- Friedle, C.; D’Alvise, P.; Schweikert, K.; Wallner, K.; Hasselmann, M. Changes of Microorganism Composition in Fresh and Stored Bee Pollen from Southern Germany. Environ. Sci. Pollut. Res. 2021, 28, 47251–47261. [Google Scholar] [CrossRef]
- Waddington, K.D.; Herbert, T.J.; Visscher, P.K.; Richter, M.R. Comparisons of Forager Distributions from Matched Honey Bee Colonies in Suburban Environments. Behav. Ecol. Sociobiol. 1994, 35, 423–429. [Google Scholar] [CrossRef]
- Beekman, M.; Ratnieks, F.L.W. Long-Range Foraging by the Honey-Bee, Apis mellifera L. Funct. Ecol. 2000, 14, 490–496. [Google Scholar] [CrossRef]
- Yoder, J.A.; Jajack, A.J.; Rosselot, A.E.; Smith, T.J.; Yerke, M.C.; Sammataro, D. Fungicide Contamination Reduces Beneficial Fungi in Bee Bread Based on an Area-Wide Field Study in Honey Bee, Apis mellifera, Colonies. J. Toxicol. Environ. Health Part A Curr. Issues 2013, 76, 587–600. [Google Scholar] [CrossRef]
- Kurth, C.; Kage, H.; Nett, M. Siderophores as Molecular Tools in Medical and Environmental Applications. Org. Biomol. Chem. 2016, 14, 8212–8227. [Google Scholar] [CrossRef]
- Haas, H. Molecular Genetics of Fungal Siderophore Biosynthesis and Uptake: The Role of Siderophores in Iron Uptake and Storage. Appl. Microbiol. Biotechnol. 2003, 62, 316–330. [Google Scholar] [CrossRef] [PubMed]
- Kalansuriya, P.; Quezada, M.; Espósito, B.P.; Capon, R.J. Talarazines A-E: Noncytotoxic Iron(III) Chelators from an Australian Mud Dauber Wasp-Associated Fungus, Talaromyces Sp. (CMB-W045). J. Nat. Prod. 2017, 80, 609–615. [Google Scholar] [CrossRef] [PubMed]
- Haas, H. Fungal Siderophore Metabolism with a Focus on Aspergillus fumigatus. Nat. Prod. Rep. 2014, 31, 1266–1276. [Google Scholar] [CrossRef] [PubMed]
- Paludo, C.R.; Pishchany, G.; Andrade-Dominguez, A.; Silva-Junior, E.A.; Menezes, C.; Nascimento, F.S.; Currie, C.R.; Kolter, R.; Clardy, J.; Pupo, M.T. Microbial Community Modulates Growth of Symbiotic Fungus Required for Stingless Bee Metamorphosis. PLoS ONE 2019, 14, e0219696. [Google Scholar] [CrossRef] [PubMed]
- Becchimanzi, A.; Nicoletti, R. Aspergillus-Bees: A Dynamic Symbiotic Association. Front. Microbiol. 2022, 13, 968963. [Google Scholar] [CrossRef]
- Frisvad, J.C.; Smedsgaard, J.; Larsen, T.O.; Samson, R.A. Mycotoxins, Drugs and Other Extrolites Produced by Species in Penicillium subgenus Penicillium. Stud. Mycol. 2004, 49, 201–241. [Google Scholar]
- Lou, J.; Fu, L.; Peng, Y.; Zhou, L. Metabolites from Alternaria Fungi and Their Bioactivities. Molecules 2013, 18, 5891–5935. [Google Scholar] [CrossRef]


| Target | Name | Orientation | Sequence (5′→3′) | Reference |
|---|---|---|---|---|
| BenA | Bt2a | For | GGTAACCAAATCGGTGCTGCTTTC | [55] |
| Bt2b | Rev | ACCCTCAGTGTAGTGACCCTTGGC | ||
| Bt1a | For | TTCCCCCGTCTCCACTTCTTCATG | ||
| Bt1b | Rev | GACGAGATCGTTCATGTTGAACTC | ||
| ITS | ITS1F | For | CTTGGTCATTTAGAGGAAGTAA | [56] |
| ITS4 | Rev | TCCTCCGCTTATTGATATGC | [57] | |
| CaM | CF1 | For | GCCGACTCTTTGACYGARGAR | [58] |
| CF4 | Rev | TTTYTGCATCATRAGYTGGAC | ||
| RBPII | 5F2 | For | GGGGWGAYCAGAAGAAGGC | [59] |
| 7CR | Rev | CCCATRGCTTGYTTRCCCAT |
| ITS and CaM | Ben1A and Ben2A | RBPII | |
|---|---|---|---|
| Initial denaturation | 95 °C/5 min | 94 °C/5 min | 95 °C/5 min |
| Denaturation | 94 °C/45 s | 94 °C/45 s | 94 °C/45 s |
| Annealing | 55 °C/45 s | 50 °C/45 s | 52 °C/45 s |
| Extension | 72 °C/1 min | 72 °C/1 min | 72 °C/1 min |
| Final extension | 72 °C/7 min | 72 °C/7 min | 72 °C/7 min |
| Strain | Diameter on CYA (mm) | Diameter on MEA (mm) | Soluble Pigment on CYA | Colony Texture on MEA | Acid Production on CREA | Exudates on MEA |
|---|---|---|---|---|---|---|
| Talaromyces sp. B11 | 21–25 | 33–37 | Weak red | Velvety to floccose | Absent | Yellow |
| Talaromyces sp. B13 | 25–26 | 25–30 | Red | Floccose, wrinkled | Absent | Absent |
| Talaromyces sp. B18 | 23–27 | 35–37 | Red | Velvety, floccose | Absent | Orange |
| Talaromyces sp. B30 | 21–24 | 33–40 | Absent | Floccose | Absent | Absent |
| Talaromyces sp. B49 | 25–30 | 33–36 | Absent | Velvety, floccose | Weak | Colorless |
| Talaromyces sp. B69 | 24–28 | 26–36 | Absent | Velvety | Absent | Absent |
| Talaromyces sp. B195 | 26–29 | 27–34 | Red | Floccose, funiculous | Absent | Red |
| T. purpureogenus [54] | 20–25 | 30–45 | Red | Velvety, floccose | Absent | – |
| Apiary | Area | April 2019 | July 2019 | April 2020 | July 2020 |
|---|---|---|---|---|---|
| KM Zirovnice | Rural | 1/6 | 0/6 | 1/6 | 0/6 |
| KM agro | Rural | 0/10 | 0/10 | 0/10 | 0/10 |
| CB Kroclov | Periphery | No data | No data | 1/3 | 0/3 |
| CB campus | Urban | No data | No data | 2/4 | 0/4 |
| CB Litvinovice | Suburban | No data | No data | 0/4 | 0/4 |
| ITS Region Seq. | Database Hits | Score | QC/I [%] | Accession |
|---|---|---|---|---|
| Talaromyces strains, 577 bp | T. purpureogenus CBS 286.36 | 1000 | 97/98.93 | NR_121529.1 |
| T. rufus CBS 141834 | 953 | 100/96.54 | NR_170773.1 | |
| T. thailandensis CBS 133147 | 942 | 100/96.19 | NR_147428.1 | |
| T. zhenhaiensis CGMCC 3.16102 | 937 | 96/96.96 | NR_177565.1 | |
| T. aspriconidius CBS 141835 | 935 | 97/96.64 | NR_170774.1 |
| Strains | B. subtilis | P. alvei * | P. lautus | P. lactis |
|---|---|---|---|---|
| B11 | >2.00 | 6.25 | >2.00 | 2.00 |
| B13 | >2.00 | >2.00 | >2.00 | >2.00 |
| B18 | >2.00 | 0.39 | 0.50 | 0.50 |
| B30 | >2.00 | >2.00 | >2.00 | 2.00 |
| B49 | >2.00 | >2.00 | >2.00 | >2.00 |
| B69 | >2.00 | 3.13 | 2.00 | >2.00 |
| B195 | 2.00 | 0.39 | 2.00 | 2.00 |
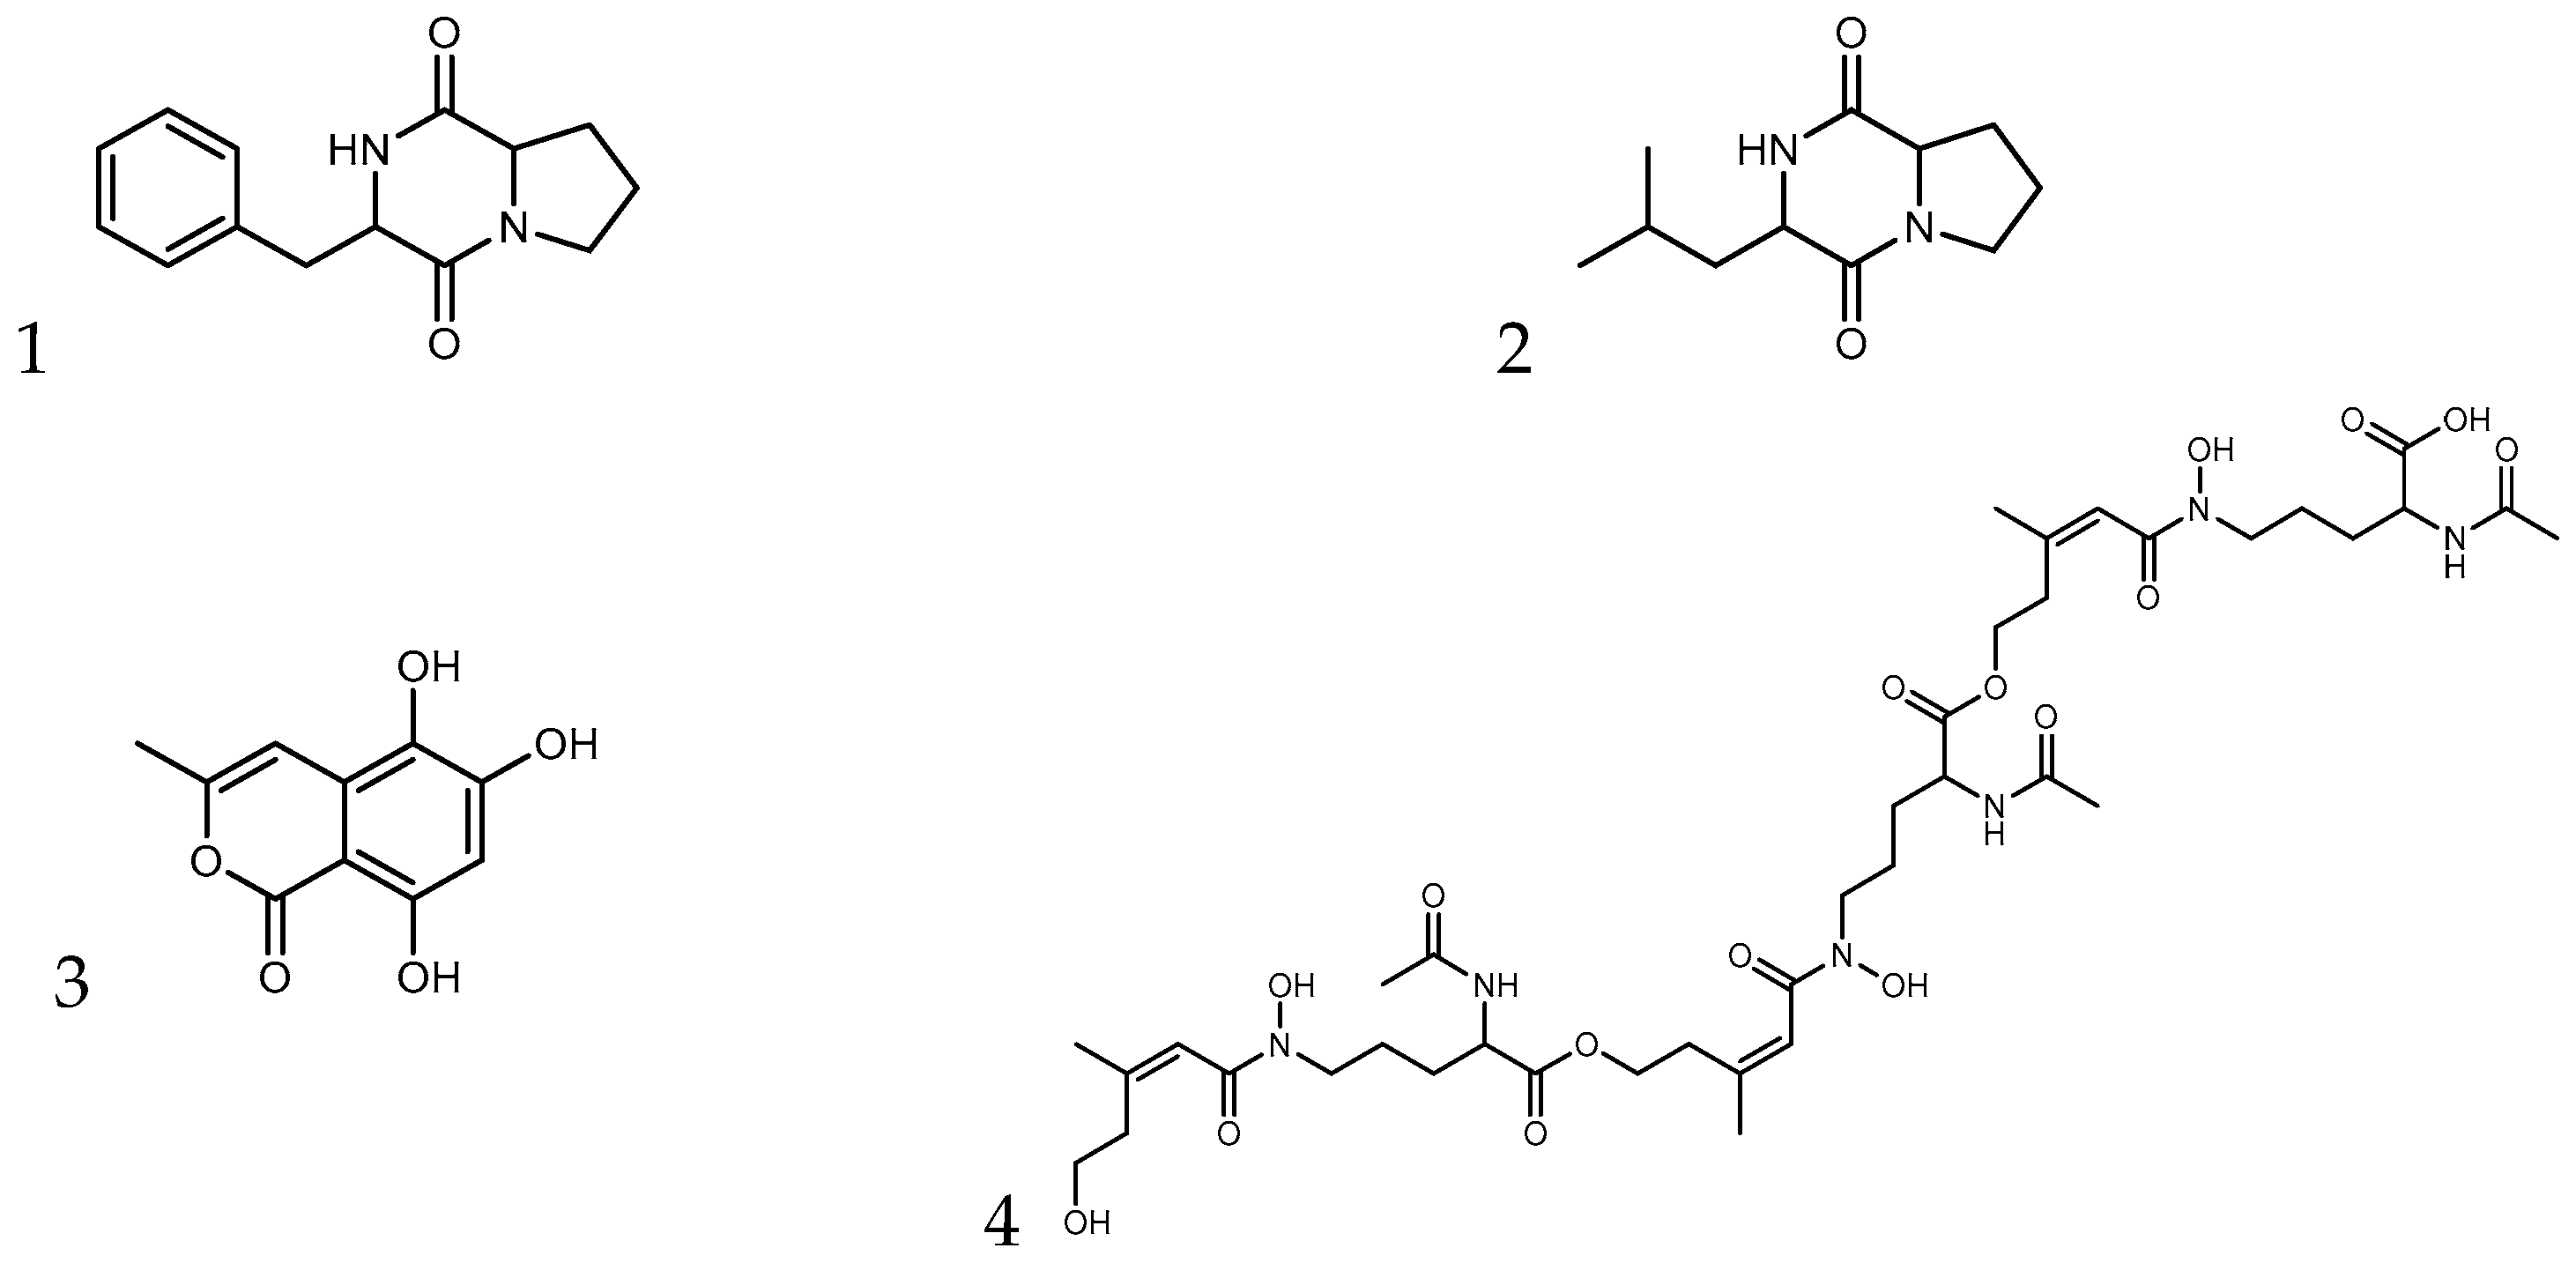
| Fraction | m/z | Adduct | Formula | Name | Structure |
|---|---|---|---|---|---|
| 26–28 | 245.1283 | [M+H]+ | C14H16N2O2 | cyclo-(Phenylalanyl-Prolyl) | 1 |
| 211.1438 | [M+H]+ | C11H18N2O2 | cyclo-(Leucyl-Prolyl) | 2 | |
| 30–31 | 245.1283 | [M+H]+ | C14H16N2O2 | cyclo-(Phenylalanyl-Prolyl) | 1 |
| 543.2176 | [M+H]+ | C24H34N2O12 | unknown | ||
| 33–34 | 543.2176 | [M+H]+ | C24H34N2O12 | unknown | |
| 191.0334 | [M-H2O+H]+ | C10H8O5 | 5,6,8-trihydroxy-3-methyl-2-benzopyran-1-one | 3 | |
| 39 | 516.2204 | [M+H]+ | C22H33N3O11 | unknown | |
| 436.5186 | [M+2H]2+ | C39H62N6O16 | l-ornithine, N2-acetyl-N5-hydroxy-N5-(5-hydroxy-3-methyl-1-oxo-2-pentenyl)-, trimol. ester, (Z,Z,Z)-(9CI) | 4 | |
| 114 | 379.3368 | [M+H]+ | C28H42 | unassigned | |
| 281.2482 | [M+H]+ | C18H32O2 | unassigned |
Disclaimer/Publisher’s Note: The statements, opinions and data contained in all publications are solely those of the individual author(s) and contributor(s) and not of MDPI and/or the editor(s). MDPI and/or the editor(s) disclaim responsibility for any injury to people or property resulting from any ideas, methods, instructions or products referred to in the content. |
© 2023 by the authors. Licensee MDPI, Basel, Switzerland. This article is an open access article distributed under the terms and conditions of the Creative Commons Attribution (CC BY) license (https://creativecommons.org/licenses/by/4.0/).
Share and Cite
Vocadlova, K.; Lüddecke, T.; Patras, M.A.; Marner, M.; Hartwig, C.; Benes, K.; Matha, V.; Mraz, P.; Schäberle, T.F.; Vilcinskas, A. Extracts of Talaromyces purpureogenus Strains from Apis mellifera Bee Bread Inhibit the Growth of Paenibacillus spp. In Vitro. Microorganisms 2023, 11, 2067. https://doi.org/10.3390/microorganisms11082067
Vocadlova K, Lüddecke T, Patras MA, Marner M, Hartwig C, Benes K, Matha V, Mraz P, Schäberle TF, Vilcinskas A. Extracts of Talaromyces purpureogenus Strains from Apis mellifera Bee Bread Inhibit the Growth of Paenibacillus spp. In Vitro. Microorganisms. 2023; 11(8):2067. https://doi.org/10.3390/microorganisms11082067
Chicago/Turabian StyleVocadlova, Katerina, Tim Lüddecke, Maria A. Patras, Michael Marner, Christoph Hartwig, Karel Benes, Vladimir Matha, Petr Mraz, Till F. Schäberle, and Andreas Vilcinskas. 2023. "Extracts of Talaromyces purpureogenus Strains from Apis mellifera Bee Bread Inhibit the Growth of Paenibacillus spp. In Vitro" Microorganisms 11, no. 8: 2067. https://doi.org/10.3390/microorganisms11082067
APA StyleVocadlova, K., Lüddecke, T., Patras, M. A., Marner, M., Hartwig, C., Benes, K., Matha, V., Mraz, P., Schäberle, T. F., & Vilcinskas, A. (2023). Extracts of Talaromyces purpureogenus Strains from Apis mellifera Bee Bread Inhibit the Growth of Paenibacillus spp. In Vitro. Microorganisms, 11(8), 2067. https://doi.org/10.3390/microorganisms11082067