Article

Shiga-Toxin-Producing Strains of Escherichia coli O104:H4 and a Strain of O157:H7, Which Can Cause Human Hemolytic Uremic Syndrome, Differ in Biofilm Formation in the Presence of CO2 and in Their Ability to Grow in a Novel Cell Culture Medium

1
Bacteriology Division, United States Army Medical Research Institute of Infectious Diseases, Fort Detrick, MD 21702, USA
2
Diagnostic Systems Division, United States Army Medical Research Institute of Infectious Diseases, Fort Detrick, MD 21702, USA
3
Department of Medicine, University of Florida, Orlando, FL 32816, USA
*
Authors to whom correspondence should be addressed.
Microorganisms 2023, 11(7), 1744; https://doi.org/10.3390/microorganisms11071744
Submission received: 16 May 2023 / Revised: 13 June 2023 / Accepted: 27 June 2023 / Published: 3 July 2023

Abstract

:
One pathogen that commonly causes gastrointestinal illnesses from the consumption of contaminated food is Escherichia coli O157:H7. In 2011 in Germany, however, there was a prominent outbreak of bloody diarrhea with a high incidence of hemolytic uremic syndrome (HUS) caused by an atypical, more virulent E. coli O104:H4 strain. To facilitate the identification of this lesser-known, atypical E. coli O104:H4 strain, we wanted to identify phenotypic differences between it and a strain of O157:H7 in different media and culture conditions. We found that E. coli O104:H4 strains produced considerably more biofilm than the strain of O157:H7 at 37 °C (p = 0.0470–0.0182) Biofilm production was significantly enhanced by the presence of 5% CO2 (p = 0.0348–0.0320). In our study on the innate immune response to the E. coli strains, we used HEK293 cells that express Toll-like receptors (TLRs) 2 or 4. We found that E. coli O104:H4 strains had the ability to grow in a novel HEK293 cell culture medium, while the E. coli O157:H7 strain could not. Thus, we uncovered previously unknown phenotypic properties of E. coli O104:H4 to further differentiate this pathogen from E. coli O157:H7.

1. Introduction

One pathogen commonly associated with small outbreaks of gastrointestinal illnesses from the consumption of contaminated food is Escherichia coli O157:H7, which is a Shiga-toxin-producing E. coli (STEC) [1,2]. Clinical presentations of E. coli O157:H7 infections can include bloody diarrhea, hemorrhagic colitis, and hemolytic-uremic syndrome (HUS) [3,4]. HUS is a sequela of three conditions: hemolytic anemia, thrombocytopenia, and acute renal failure [4,5]. Because antibiotics can exacerbate the toxicity of infections leading to HUS, currently, there are only supportive treatments for patients with STEC-caused bloody diarrhea [6,7,8]. There are two major types of Shiga toxins (Stxs) with subtypes of each produced by E. coli O157:H7: Stx1 and Stx2 [9,10]. Based on epidemiological studies of outbreaks and animal model studies, Stx2 appears to be the primary subtype responsible for causing bloody diarrhea and HUS [11,12,13].
Less frequent and smaller outbreaks of food-borne bacterial contamination have been attributed to non-O157:H7 serotypes. However, in the spring of 2011 in Germany, an unusually large number of cases (~3800) of bloody diarrhea and HUS were caused by a less well-known E. coli of the serotype O104:H4, with a few cases detected in France and Denmark [14,15,16,17]. The outbreak was attributed to the consumption of contaminated raw sprouts [18]. It was also notable because more adults (~80% of cases, of which two-thirds were women) were affected than children, in contrast to what is usually observed with E. coli O157:H7 infections, and there was a higher incidence of HUS (20%) [15]. The E. coli O104:H4 strain appeared to exhibit characteristics of two E. coli pathotypes: enteroaggregative (EAEC) and enterohemorrhagic (EHEC) [14,15,17,19]. The hallmark of EAEC pathotypes includes the ability to form “stacked brick” aggregates attached to HEp-2 cells which are encoded on a 74 kb virulence plasmid (pAA). The pAA plasmid also expresses a bundle-forming, aggregative adherence fimbriae I (AAF/I), which is in part responsible for this phenotype [20,21,22]. The expression of pAA-encoded genes also enables the pathogen to form biofilms and hemagglutinate human erythrocytes [20,23]. The EHEC pathotypes have the ability to produce attaching and effacing (A/E) lesions in human and animal models [24,25] and can cause hemorrhagic colitis (HC) that can lead to HUS. They also contain a temperate phage that can express heat-stable Stxs [11,13].
After adhering to intestinal epithelial cells E. coli O157:H7 and non-O157:H7, strains can initiate biofilm formation. This has been reported to occur in four stages: (1) initial contact, (2) attachment, (3) maturation, and (4) dispersion [26]. In the initial contact with a surface stage, the motility of the microorganism appears to be critical for successful biofilm formation [27,28]. In addition, it was shown that type I pili (or fimbriae) were also required for initial attachment to a surface by E. coli [27]. After the initial stage of biofilm formation, attachment of the bacteria to the surface and themselves is mediated by multiple factors, which may include type I pili [27,29], aggregative adherence fimbriae (AAF/I) [30,31,32,33], amyloid curli fibers [34,35,36], long polar fimbriae (lpf) [37,38], and F9 fimbriae [39,40]. Other components that may enhance attachment to the early biofilm are bacterial capsules and LPS [26]. In the maturation stage of biofilm formation, the previous macromolecules are still involved in the process, but there is an increase in bacterial multiplication and bacterial cell-to-cell communication (quorum sensing) [41]. Further secretion of autotransporter adhesins and exopolysaccharides, such as colonic acid, and the synthesis of poly-N- acetyl-glucosamine and possibly cellulose appear to form part of the matrix of the maturating biofilm [26,41]. In the last stage of biofilm formation, which has been less studied, the dispersion of individual bacterial cells or clusters of cells from the mature biofilm may occur by complex mechanisms [42]. These mechanisms can be divided into two general categories: active and passive [42]. In the active category, the mechanism of dispersal is initiated by the bacteria. In the passive category, the mechanism may be mediated by environmental sources, such as fluid movement [42].
Currently, limited information is available about the early interaction of EAEC/EHEC pathotypes with a host’s innate immune response. Part of this germ-line-encoded immune response by a host consists of a class of pathogen recognition receptors (PRR) that are dimerized transmembrane Toll-like receptors (TLRs). TLRs respond to different classes of antigens, which have been described as pathogen-associated molecular patterns (PAMPs) [43]. Humans have 10 TLRs, while mice have 12 [43]. TLRs can be grouped according to the type of PAMPs that they are likely to encounter. Some are assembled on the surface of the host cell and encounter the pathogen early after infection. These consist of TLR1, TLR2, TLR4, TLR5, TLR6, and TLR11; the latter is a pseudogene in humans [44]. Other TLRs, such as TLR3, TLR7, TLR8, and TLR9, are assembled within endosomal compartments in the host cell and activated by nuclei acid components of viral particles or bacterial pathogens. Our interest is in the early innate immune response to gram-negative bacterial pathogens; hence, we have focused our studies on the activation of surfaced-assembled TLRs [45]. We wanted to compare the early interaction of the EHEC/EAEC E. coli O104:H and the EHEC E. coli O157:H Gram-negative pathogens with the surface-assembled TLR2 and TLR4. For the activation of TLR2 to occur, however, it must combine with TLR1 to form a heterodimer that can recognize triacylated lipopeptides; TLR2 can also dimerize with TLR6 to recognize diacylated lipopeptides [46,47,48,49]. TLR4, on the other hand, is a homodimer that responds to lipopolysaccharides (LPS). TLR4 also requires accessory proteins, such as the LPS binding protein (LBP), myeloid differentiation factor 2 (MD2), and CD14, for optimal activity [46,50,51]. TLR5 is a homodimer and can be activated by flagella or its flagellin subunit [45,52,53,54].
Since less is known about the atypical E. coli O104:H4 pathotype than the more common E. coli O157:H7, we wanted to identify additional phenotypic differences between these two HUS-causing STECs. We directly compared the two pathogens under different growth or culture conditions to facilitate the identification of the atypical E. coli O104:H4 versus the O157:H7 pathogen. We report here that CO2 significantly enhanced biofilm formation by the E. coli O104:H4 strains at 37 °C but not by the E. coli O157:H7 strain. In our examination of the interaction of the E. coli strains with a host’s innate immune response using HEK293 cells that expressed TLR2 or 4, we found that the E. coli O104:H4 strains but not the O157:H7 strain had the ability to grow in a novel TLR cell culture medium.

2. Materials and Methods

2.1. Bacterial Strains, Reagents, Growth Conditions, and Antibiotic Susceptibility

The E. coli strains used in the present study are listed in Table 1 and were obtained from the Critical Reagent Program (CRP) at the U.S. Army Medical Research Institute of Infectious Diseases (USAMRIID, Fort Detrick, MD, USA). For ease of labeling in the present report, the German (E. coli O104:H4, 2011C 34923) and two Georgian (E. coli O104:H4, 2009EL 2050 and E. coli O104:H4, 2009 EL 2071) strains listed in Table 1 will be referred to as Ec 01, Ec 02, or Ec 03, respectively. Stock cultures of strains were stored at −80 °C in 50% glycerol in Mueller-Hinton (MH) II broth, cation-adjusted (BD Difco, Thermo Fisher Scientific, Waltham, MA, USA).
For growth studies, stock cultures were streaked out onto sheep-blood agar (SBA) (Remel, Thermo Fisher Scientific) or MH II agar (1.5%) (BD Difco, Thermo Fisher Scientific) plates, and the plates were incubated overnight at 37 °C. A single colony was used to inoculate 2–5 mL of cation-adjusted MH II broth, and the culture was incubated at 37 °C overnight with shaking at 180 rpm. The following day, the overnight culture was diluted 1/50–1/100 in MH II broth or other desired media for further studies. Alternatively, fresh overnight colonies on a solid medium were used to make a suspension of cells for an inoculum in 96-well plates or 5 mL tubes. For the quantitation of E. coli bacterial cells, the conversion factor of 1.0 OD600 nm, equivalent to 6.83 × 10⁸ colony-forming units (CFUs) was used (Henry Heine, USAMRIID). To determine CFUs in desired cultures, 10-fold dilutions of the culture were made in 1X PBS, and 100 µL of each dilution was plated onto triplicate SBA plates. The SBA plates were incubated at 37 °C overnight and the number of colonies was counted to determine the original CFU/mL.
In our initial assessment of the E. coli strains used in the present study, we used Biolog GEN III microplates (Biolog, Hayward, CA, USA) to obtain a phenotypic display of common or differing characteristics. After bacterial strains were grown overnight on SBA plates at 37 °C, bacterial cells and GEN III microplates (carbon utilization) were prepared as per the manufacturer’s directions. We also evaluated the antibiotic susceptibilities of the E. coli strains used in the present study. This was determined as previously described by the broth dilution method following the Clinical and Laboratory Standards Institute method [55]. The results from the Biolog GENIII plates and antibiotic susceptibilities studies of the E. coli strains are shown in Tables S1 and S2, respectively, and in part in Table 1. Generally, the E. coli O104:H4 strains exhibited the same phenotypes or antibiotic susceptibilities. The results for the O157:H7 strain were either the same or different from the O104:H4 strains depending on the carbohydrate/chemical or antibiotic being examined. To further characterize the E. coli strains, we examined the phenotype of the E. coli strains on MacConkey agar with sorbitol and a tryptone bile x-glucuronide medium (Remel, ThemoFisher Scientific). To examine the motility of the E. coli strains, we inoculated MH II agar (0.4%) plates with an overnight culture of the strains. The plates were examined for bacterial motility after incubation overnight at 37 °C. Difco Heart Infusion agar (ThermoFisher Scientific, Waltham, MA, USA) for Congo Red (Sigma-Aldrich, St. Louis, MO, USA) (100 µg/mL) plates were used for dye utilization/uptake studies (see Figure S1A) [56]. The presence of Stx2 (List Labs, Campbell, CA, USA) was determined by Western slot-blot analysis of filtered culture supernates with an anti-Stx2 monoclonal antibody [57] that was obtained from Dr. Alison D. O’Brian (Department of Microbiology and Immunology, Uniformed Services University of the Health Sciences, Bethesda, MD, USA). The results of these studies and other characteristics [58,59,60] are presented in Table 1.

2.2. Biofilm Formation

Biofilm formation was examined in 96-well round-bottom plates (Corning Falcon, ThermoFisher) and 5 mL polypropylene tubes (12 × 75 mm, Corning Falcon, Thermo Fisher). Bacterial strains were grown on SBA plates overnight at 37 °C, and cells were suspended in MH II broth and OD600 adjusted to 1.0, as stated previously. For 96-well ELISA plates, 10–20 µL of adjusted cell suspension was used to inoculate 180–190 µL of MH II broth or 200–500 µL MH II broth in 5 mL cultures tubes with snap-cap lids (to safely wash and process the pellets). Bacterial cultures were incubated overnight at 37 °C with or without 5% CO2. When cultures were incubated in 5 mL culture tubes, the lids were loosely closed to allow for air/CO2 exchange. Biofilm formation was quantitated in the 5 mL tubes using a modified method [61] with 0.1% crystal violet (in water and filtered through a 0.45 µm filter) (Sigma-Aldrich). All washing and processing of biofilm pellets by E. coli strains were performed under a biosafety hood under Biosafety Level 2 conditions. All centrifugation steps were conducted at 2000 rpm for 5 min in covered buckets, and buckets were loaded or emptied under the biosafety hood. After overnight incubation, 1.0 mL of PBS (ThermoFisher) was added to each sample, and samples were vortexed and centrifuged. A tube with only MH II medium was included as a blank/reagent control. The samples were decanted and washed twice with 1.0 mL of PBS. After the last centrifugation step, 0.1–0.2 mL of crystal violet was added to each sample, including the blank/reagent control, and samples were left at room temperature for 15–30 min. Then, 1.0 mL of PBS was added to each sample, and the samples were vortexed and centrifuged. After centrifugation, 2.0 mL of PBS was added to each sample, and the samples were vortexed. This wash step was repeated twice. After the last wash, the tubes were left to dry under the biosafety hood for at least 3 h. To the dry pellets, 1.0 mL of 95% ethanol was added, and the samples were vortexed vigorously to dissolve the pellets and then left for 15–30 min. In some cases, the samples were left in the solvent overnight with the caps of the tubes snapped closed to ensure complete dissolution of the pellet. Then, 200 µL of each sample was transferred to a 96-well ELISA plate, which included the blank/reagent control sample, and the plates were read at 600 nm. The absorbance of the blank/reagent control sample (absorbance at 600 nm < 0.10) was not subtracted from the readings from the wells that contained the bacterial cells, but it was plotted with the results of the test samples.

2.3. Human Embryonic Kidney (HEK) 293 Toll-like Receptor (TLR) Cell Cultures

HEK293 cells expressing TLR2 or 4 used for the evaluation of TLR activation by E. coli strains were obtained from Invivogen (San Diego, CA, USA). The TLR-expressing HEK293 cells were also transfected with an embryonic alkaline phosphatase reporter gene. The expression of the reporter gene was dependent on the binding of multiple NF-kB and AP-1 proteins in the enhancer region of the reporter gene. Once expressed, the alkaline phosphatase was secreted (SEAP) into the HEK Blue Detection (HBD) cell culture medium, where its activity could be detected (Invivogen). SEAP cleaved the color indicator 5-bromo4-chloro-3-indolyl phosphate in the HBD cell culture medium. Once the color indicator was cleaved by SEAP, a blue-purple product was generated. The growth and maintenance of the HEK293 TLR2/4 cells and the examination of TLR2/4 activation by live bacterial strains were as previously described [45]. The activation of TLR2/4 by E. coli strains in the HBD cell culture medium (Invivogen) was performed in 96-well flat-bottom Immunlon 2HB plates (ThermoFisher, Waltham, MA, USA). The HBD cell culture medium was prepared as per the manufacturer’s directions. Briefly, the contents of a single pouch of HBD powder were poured into a 125 mL sterile flask (Corning, Fisher Scientific), and 50 mL of endotoxin-free water was added to solubilize the powder. The dissolved HBD medium was incubated at 37 °C for 30–60 min with occasional stirring and passed through a 0.22 µm filter. The sterile medium was stored at 4 °C until use for up to 2 weeks. HEK293 TLR2 and TLR4 cells were adjusted to 2.5 × 10⁵ cells/mL and 2.0 × 10⁵ cells/mL, respectively, in an HBD cell culture medium, as per the manufacturer’s directions before use. In the activation studies, 180 µL of adjusted HEK293 TLR2 or 4 cells were inoculated in triplicate wells with 2.5 × 10⁴ bacterial cells per well. For the control wells, 2 × 10⁶ heat-killed Listeria monocytogenes (HKLM) (Invivogen) was used for the TLR2 positive control and 0.2 ng E. coli lipopolysaccharide (LPS) (Invivogen) was used for the TLR4 positive control. The inoculated HEK293 TLR plates were incubated at 37 °C with 5% CO2 overnight for 18–24 h. The results were read at 630 nm with a BioTek Elx808 spectrophotometer (BioTek, Winooski, VT, USA). Similar E. coli cultures were performed in an HBD cell culture or DMEM cell culture maintenance medium without HEK293 TLR cells in 96-well plates or 15 mL culture tubes. All readings of cultures were used to evaluate the amount of TLR2 or 4 activation by live bacterial cells in 96-well plates and were used to plot the data, including the media-only wells, which contained only media, unless noted. The latter readings (<0.10 absorbance at 630 nm) were not subtracted from the wells containing E. coli cells, but they were plotted with the readings of the other wells.

2.4. E. coli Strains in an HBD Cell Culture Medium

To examine the growth of the E. coli strains in the HBD cell culture medium, single colonies from SBA plates were used to inoculate 2 mL of MH II broth, and the cultures were incubated overnight at 37 °C with shaking at 180 rpm. The following day, 0.25 mL of the overnight culture was used to inoculate 12.5 mL of the HBD cell culture medium (1/50 dilution) in a 125 mL Corning flask (Fisher Scientific), and the cultures were incubated at 37 °C with shaking at 180 rpm. Growth of the cells was followed by an increase in absorbance at 600 nm for up to 48 h. The HBD cell culture medium was used as a blank for the culture readings. For comparison, E. coli strains were also grown in 12 mL of MH II broth at 37 °C with shaking at 180 rpm after inoculation with 0.12 mL of an overnight culture (1/100 dilution), and the growth was followed by an increase in absorbance at 600 nm. MH II broth was used as a blank for the culture readings. In other cases, where noted, single colonies of E. coli strains grown on SBA plates were directly used to inoculate 2 mL of the HBD culture medium, and the cell cultures were incubated overnight at 37 °C with 5% CO2.

2.5. Comparison of Amino Acid Sequence of AAF/I Protein Components

The amino acid sequence of the AggA, AggB, AggC, and AggD proteins for AAF/I was obtained from the National Center for Biotechnology Information (NCBI). For E. coli O104:H4 2011C-3493, the amino acid sequence for plasmid pAA proteins was under NCBI reference sequence NC_018666.1. For strain 2009EL-2050, the amino acid sequence for plasmid pAA proteins was under NCBI reference sequence NC_018654.1. For strain 2009EL-2071, the amino acid sequence for plasmid pAA proteins was under NCBI reference sequence NC_018662.1.

2.6. Statistical Analysis

Values were log transformed prior to analysis, with results summarized as the geometric mean and geometric standard error of the mean. Comparisons between groups were made by Welch’s t-test, applied to the log-transformed values. The comparisons between groups were based on a Welch’s t-test of the appropriate single degree of freedom contrast in the two-way ANOVA, with factors corresponding to treatment groups. Analysis was performed in SAS® version 9.4 (SAS Institute Inc., Cary, NC, USA). The results were considered significant when p < 0.05.

3. Results

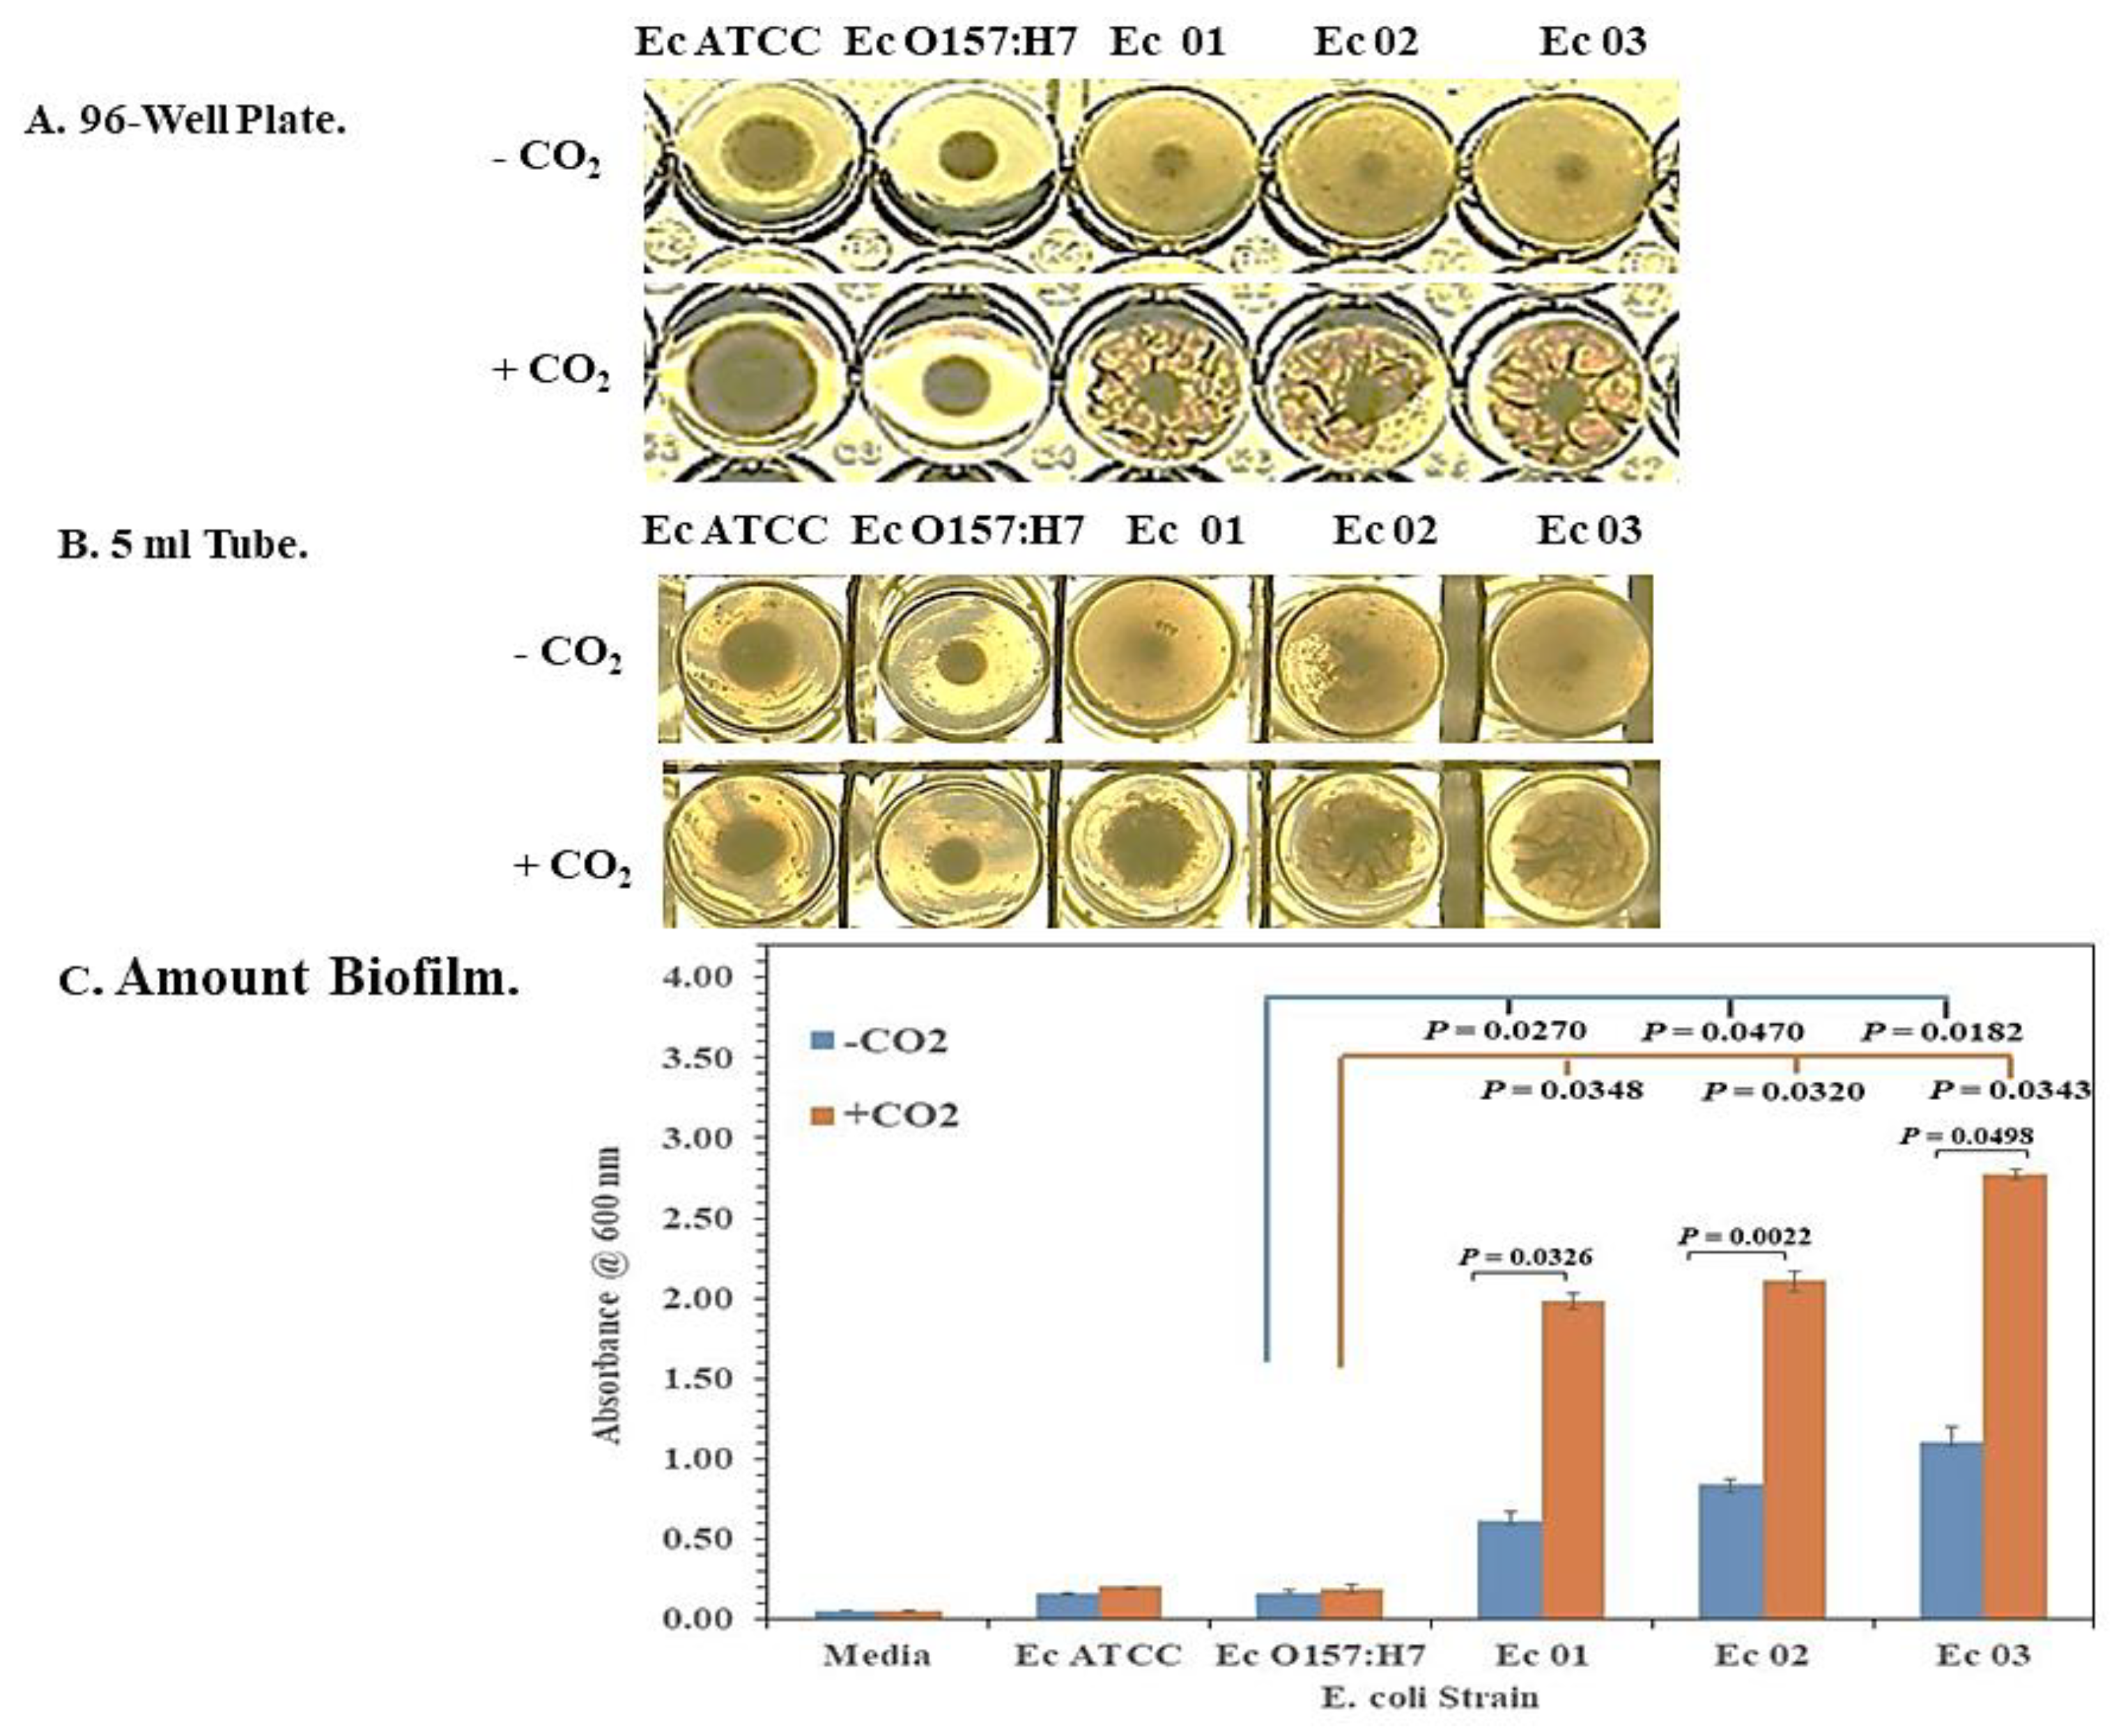
3.1. Enhanced Biofilm Formation by E. coli O104:H4 in 5% CO2

We found clear differences in biofilm formation among E. coli strains grown during our studies and identified differences in growth between E. coli O104:H4 and O157:H7. We grew the E. coli strains in MH II broth in 96-well plates. We noticed a difference in their pellets after overnight incubation at 37 °C (Figure 1A, top panel). E. coli O157:H7 and the control E. coli ATCC 25922 had well-defined circular pellets, while the E. coli O104:H4 strains Ec 01, Ec 02, and Ec 03 had pellets that covered the bottom of the wells. In some instances, closer examination of the pellets of the E. coli O104:H4 strains revealed small pocked-marked clearings on the peripheral of the pellets reminiscent of phage plaques (Figure S1B). We also found that incubation of the 96-well plates at 37 °C with 5% CO2 noticeably altered the appearance of the pellets of the E. coli O104:H4 strains. They appeared as wrinkled or folded membranous structures. However, this was not observed in the pellets of the E. coli ATCC 25922 or O157:H7 strains (Figure 1A, bottom panel).
We used a crystal violet assay to quantitate the change in pellet formation by the E. coli strains with or without CO2. E. coli strains were grown in an MH II medium (0.2–0.5 mL) in 5 mL culture tubes and cultures were incubated overnight at 37 °C with or without CO2. Figure 1B,C present representative results from one of three studies we conducted under these conditions. The pellets of the E. coli strains incubated in the 5 mL tubes looked similar to those observed in the 96-well plates with and without CO2 (Figure 1B). However, we did not observe plaque-like clearings as we did in the 96-well plates. Figure 1C shows that there was more pellet produced by the E. coli O104:H4 strains than the E. coli ATCC 25922 or O157:H7 strains under either condition. There was a significant difference in the amount of pellet formed by the E. coli O104:H4 strains in the presence of CO2 compared to its absence: Ec 01 (p = 0.0326), Ec 02 (p = 0.0022), and Ec 03 (p = 0.0498) (Figure 1C). This difference in the amount of pellet produced in the absence or presence of CO2 by E. coli O104:H strains was also supported when we compared the amount of pellet formed without CO2 between the E. coli O157:H7 and O104:H4 strains. The latter strains produced more than 3- to 7-fold more pellets than E. coli O157:H7 (Ec 01, p = 0.0270; Ec 02, p = 0.0470; Ec 03, p = 0.0182). When we compared the amount of pellet produced by the E. coli O157:H7 and O104:H4 strains grown in the presence of CO2, the difference in the amount of pellet formed increased to 10- to 15-fold (Ec 01, p = 0.0348; Ec 02, p = 0.0320; Ec 02, p = 0.0343). Because of previous reports linking E. coli O104:H4 with biofilm formation [34,62,63], the pellets produced by the E. coli O104:H4 strains will henceforth be referred to as biofilms in this report.

3.2. Interaction of the Live E. coli Strains with Innate Immune TLR2 and 4

We used HEK293 cells that expressed TLR2 or 4 to evaluate whether they interacted with the E. coli strains. Besides examining differences in the growth between the pathogenic E. coli O104:H4 strain and the O157:H7 strain, we also asked if there were possible differences in E. coli O104:H4 and O157:H7 interactions with a host’s innate immune system. is activated by acylated lipoproteins, while TLR4 is activated by lipopolysaccharides [46]. The activation of TLRs stimulates the expression of NF-ebb that is required for the enhanced expression of the reporter protein SEAP from stimulated HEK293 cells. This gives a blue/purple color after cleavage of the indicator 5-bromo-4-chloro-3-indolyl phosphate by secretory alkaline phosphatase. We inoculated HEK293 TLR2 or 4 cells in a cell culture medium in 96-well plates (triplicate wells) with the E. coli strains and incubated the cultures at 37 °C with 5% CO2 overnight. Representative results from one of three TLR2 and 4 activation studies are presented. The results of this study are shown in Figure 2A and are representative results from one of three studies we conducted to examine the activation of TLR2 or 4 by the E. coli strains. We observed a notable significant difference in the amount of TLR4 activated compared to the amount of TLR2 activated (p = 0.0041–0.0001) by all E. coli strains that we evaluated except E. coli O157:H7 (Figure 2B). Nevertheless, the E. coli O157:H7 strain in this case still activated more TLR4 than TLR2, but the difference in the activation between the two TLRs by E. coli O157:H7 was not significant.
When we compared the amount of TLR2 or 4 activated by the E. coli O157:H7 strain with the amount activated by the other E. coli strains, we found that E. coli O157:H7 activated significantly less TLR2 (p = 0.0114–0.0007), but there was no difference in TLR4 activation.

3.3. Growth of the E. coli O104:H4 Strains but Not the O157:H7 Strain in an HBD Cell Culture Medium

When examining the activation of TLR2/4 by the E. coli strains, we found a color reaction difference between the E. coli ATCC 25922 and O157:H7 strains (blue-purple) and the E. coli O104:H4 Ec 01, Ec 02, and Ec 03 strains (yellow-green) (see Figure 2A). To determine if the difference depended on live E. coli strains, we inoculated HEK293 TLR2/4 cells with irradiated-inactivated E. coli strains. After overnight incubation, all the E. coli strains produced a similar blue-purple color reaction, with a higher amount of TLR2 than TLR4 activated. These results suggested that the yellow-green color reaction generated by the E. coli O104:H4 strains with HEK293 TLR2/4 cells was dependent on live bacterial cells. We also examined other cell lines, such as RAW 264.7 and Vero cells in an HBD cell culture medium with the live E. coli strains. We observed the same color reaction that we observed with E. coli strains using HEK293 TLR2/4 cells. To determine if the presence of TLRs on the HEK293 TLR2/4 cells was responsible for the different color reactions, we inoculated HEK293 TLR null cells that did not express TLR2 or 4 in an HBD cell culture medium with live E. coli strains. Figure 2C presents representative results from one of three studies we conducted with HEK293 TLR null cells. We observed no activity with the E. coli ATCC 25922 or O157:H7 strains or the positive controls, but the wells containing the E. coli O104:H4 strains were greenish in color after incubation (Figure 2C). Because the yellow-greenish color reaction by the E. coli O104:H4 strains in the HBD cell culture medium did not appear to depend specifically on HEK293 cells or the presence of TLR2 or 4, we inoculated the HBD cell culture medium (without the HEK293 cells) with the E. coli strains. This study was performed three times and Figure 2D is representative of one of these studies. We observed no color change with the E. coli ATCC 25922 or O157:H7 strains, but we observed a yellowish color reaction with the E. coli O104:H4 strains (Figure 2D). Microscopic examination of the wells containing the E. coli O104:H4 strains revealed the presence of small rod-shaped, bacterial-like cells. These cells were absent in wells that contained the E. coli ATCC 25922 or O157:H7 cells. Thus, we made dilutions of all the wells and plated aliquots onto SBA plates. After incubation overnight at 37 °C, we detected more than 1.0 × 10⁸ CFU/mL from the E. coli O104:H4 cultures, but we detected no CFUs from the E. coli ATCC 25922 or O157:H7 cultures. This color reaction difference between the E. coli strains was not observed with a DMEM cell maintenance medium that is normally used to maintain the HEK293 TLR2/4 cells (Figure 2D). Taken together, these results suggest that the E. coli O104:H4 strains but not the E. coli ATCC 25922 or O157:H7 strains can grow in an HBD cell culture medium independent of HEK293 TLR2/4 cells.
To further examine the potential of E. coli O104:H4 strains to grow in the HBD cell culture medium, we examined cultures of E. coli O104:H4 Ec 01, Ec 02, and Ec 03 strains and the E. coli ATCC 25922 and O157:H7 strains in 125 mL flasks containing an HBD cell culture medium (12.5 mL). We inoculated the HBD cell culture medium (0.25 mL) with an overnight culture of the E. coli strains grown in an MH II medium, and the cultures were incubated at 37 °C with shaking at 180 rpm. We followed growth by tracking the change in absorbance (A) 600 nm, the cell cultures were followed for 48 h. Figure 3A presents representative results from one of three growth studies of the E. coli strains in HBD cell culture media in 125 mL flasks. After 48 h, the E. coli O104:H4 cultures reached an A600 of 1.29–1.38, and we detected 1.6 × 10⁸–4.3 × 10⁸ CFUs/mL present in the E. coli O104:H4 cultures. The E. coli O104:H4 Ec 03 strain appeared to grow slightly slower than the E. coli O104:H4 Ec 01 and Ec 02 strains at the beginning, but it reached close to the same density as the other two E. coli O104:H4 strains after 48 h. We observed no change in culture density nor did we recover any CFUs from the E. coli ATCC 25922 or O157:H7 cultures after the same time period. Figure 3B shows the color of the E. coli cultures in the HBD cell culture medium after 48 h. The E. coli O104:H4 Ec 01, Ec 02, and Ec 03 cultures were green, while the E. coli ATCC 25922 and O157:H7 cultures remained pink (unchanged). In contrast, when we grew the five E. coli strains in MH II broth (12.0 mL) inoculated with 0.12 mL of an overnight culture, we observed that all E. coli strains grew at an almost identical rate. They reached a similar A600 (~1.80) after 7 h of incubation at 37 °C with shaking at 180 rpm (Figure 3B). The cell densities of the cultures were 5.8 × 10⁹–1.2 × 10¹⁰ CFU/mL after 7 h of incubation, which was ~10-fold higher than the growth of the E. coli O104:H4 strains in the HBD cell culture medium. It should be noted that no supplemental CO2 was present during the incubation of these cultures. Thus, the growth of the E. coli O104:H4 strains in the HBD cell culture medium was shown by an increase in cell density and a change in the color of the medium.

3.4. Growth of the E. coli O104:H4 Strains in an HBD Cell Culture Medium Starting with a Single Colony

We further examined our observation that the E. coli O104:H4 strains but not the E. coli ATCC 25922 or O157:H7 strains could grow in an HBD cell culture medium. We took single colonies of the five E. coli strains grown overnight on SBA plates and inoculated each into 2 mL of an HBD cell culture medium in 15 mL culture tubes. The cultures were then incubated at 37 °C with 5% CO2 overnight (without shaking). A single overnight E. coli colony on sheep blood agar (~2.5 mm diameter) consists of ~2 × 10⁸ CFUs (Amemiya, unpublished). Figure 4 presents representative results from one of the three independent studies we conducted. After overnight incubation, the E. coli O104:H4 Ec 01, Ec 02, and Ec 03 cultures were greenish in color with occasional bubbles on top of the liquid culture. The E. coli ATCC 25922 and O157:H7 cultures were light blue-purple in color with no bubbles. The media control stayed pinkish. We checked the pH of the cultures to determine if any metabolic activity occurred. The media control and E. coli ATCC 25922 and O157:H7 samples had a pH between 8.5 and 9.0, while the E. coli O104:H4 cultures had a pH of ~5.0. The color change in the E. coli ATCC 25922 and O157:H7 cultures when compared to the media-only sample may have been due to the presence of alkaline phosphatase, which is found in the periplasmic space of gram-negative bacteria. It may have leaked from the bacterial cells in the original inoculum [63,64]. Thus, we were able to repeat the color reaction change and growth of the E. coli O104:H4 cultures that we observed in the larger HBD cell cultures in a different format to differentiate their growth from the E. coli O157:H7 strain.

4. Discussion

In our observations on the biofilms produced by the EHEC/EAEC pathotype E. coli O104:H4, we found that biofilms produced by the O104:H4 strains could be affected by the presence of CO2. In our initial study, there was a 3- to 7-fold difference in the substantial amount of biofilm produced by the E. coli O104:H4 strains compared to the EHEC pathogen E. coli O157:H7 in the absence of CO2. We observed a significant enhancement (10- to 15-fold) of the amount of biofilm formed by E. coli O104:H4 when grown in the presence of CO2. We observed no response of the O157:H7 strain. The effect of CO2 on biofilm formation and the response to changes in CO2 levels in local environments were found to be critical in some pathogens’ ability to upregulate the expression of virulence factors required to successfully infect a mammalian host [65]. The early stages of biofilm formation begin with the ability of E. coli O104:H4 to adhere to and colonize intestinal epithelial cells. This is mediated in part by the biosynthesis of at least two types of fimbriae, which are long, extracellular, polymerized protein structures: AAF from the 74 kb pAA virulence plasmid and LpF from the pathogen’s chromosomal genes [31,33,38]. The presence of AAF has been shown to be required for adherence and biofilm formation by E. coli O104:H4 [20,32,62]. It has been suggested that adherence of the pathogen to epithelial cells facilitates the translocation of Stx2a to the intestinal epithelium [66,67]. The expression of genes that encode for AAF is under the control of the AggR regulator, which is also encoded on the pAA plasmid. AggR belongs to the family of AraC-like transcriptional activators and regulates the expression of select genes on the pAA plasmid and EAEC chromosome [31,68]. The upregulation of AggR expression appears to be (p)ppGpp-dependent [69]. There are at least five subtypes of AAF (I–V), with their operons organized as aggDCBA, where the D gene encodes a chaperone, the C gene encodes an usher protein, the B gene encodes a minor pilin, and the A gene encodes the major pilin subunit of the AAF fimbriae [33,70]. Thus, the assembly of AAF appears to occur through the chaperone–usher pathway that is ubiquitous in Gram-negative bacteria [71]. In a study to evaluate the effect of AAF types (I, III, IV, and V) in an EAEC 55989 agg3 deletion mutant, it was reported that the AAF/I recombinant formed the largest bacterial aggregates and adhered more to Hep-2 cells than the EAEC 55989 agg3 recombinants expressing III, IV, or V fimbriae. These results suggested that the AAF/I subtype may be partly responsible for the extreme pathotype of the outbreak E. coli O104:H4 strain [33]. However, the AAF/I-expressing recombinant also exhibited the highest auto-aggregation rate and the lowest biofilm formation of the AAF III, IV, or V recombinants [33]. It was not clear why there was no correlation between an increase in adherence of the different recombinants to Hep2 cells and the amount of biofilm formed with the expression of AAF/I. It had been previously shown that the presence of AAF/I coincides with the ability to form biofilms in E. coli O104:H4 [32,62,68]. It may be that biofilm formation is a more temporal, controlled process that requires the biosynthesis of certain molecules in an ordered manner. Biofilm formation may not start with an aggregate of cells formed in a haphazard manner. Additionally, in an EAEC 55989 agg3 bacteria, AAF/I may not mediate biofilm formation, nor in the LB medium used in this study. A recent report on EAEC strains also found a variant AAF (agg3A and agg5A genes) that coincided with the presence of a novel pAA variant [72].
To identify the type of AAF present in the E. coli O104:H4 strains used in the present study, we examined the annotated amino acid proteins of the pAA plasmids from the E. coli O104:H4 strains 2011C-3493 (Ec01), 2009EL-2050 (Ec02), and 2009E-2071 (Ec03) that had been deposited in GenBank [59]. They are annotated under the NCBI reference sequence nos. NC_018666.1, NC_018654.1, and NC_018662.1, respectively. All the protein subunits AggA, AggB, AggC, and AggD were identified as the aggregative adherence fimbriae I (AAF/I) type. To determine how close the AAF/I subunits were to each other from the different E. coli O104:H4 strains, we compared the amino acid sequence of the AggABCD protein subunits from 2011C-3493, 2009E-2050, and 2009E-2071 (see Figure S2). The alignment of the individual subunits showed that there was 100% identity in the amino acid sequences of the AggA, AggC, and AggD proteins. In AggB, there was only one amino acid difference out of 145 amino acids, which was at amino acid 95 (G or W). We also compared the amino acid sequences of the AggR regulator (265 amino acids in length) from the three pAA plasmids. We found them to be identical. In all three pAA plasmids, the aggR gene was 10,359 nucleotides from the aggA gene. Since AggR positively regulates the expression of the AAF/I operon, we proposed that the direction of transcription is likely to be → aggABCD, which we found in the arrangement for the AAF/I subunit proteins in the 2011C-3493 and 2009EL-2071 strains. In these two cases, the AggR was upstream from the aggABCD operon. However, for strain 2009EL-2050, the AAF/I subunits were reported as DCBA; yet, AggR was downstream from the aggABCD operon. In this latter case, the direction of transcription may be DCBAagg ←. Bielaszewska et al. (2011) had previously reported the presence of aggA (AAF/I) in 80 out of 80 E. coli O104:H4 strains examined and noted the presence of agg3A in EAEC 55989 [66]. Similarly, Ferdous et al. (2015) identified aggA (AAF/I) in E. coli O104:H4 strains, including 2009EL-2050 and 2009EL-2071 and agg3A (AAF/III) in EAEC 55989 [73]. Additionally, Berger et al. (2016) reported the presence of aggA, aggB, aggC, and aggD genes for AAF/I on the pAA plasmid from E. coli O104:H4 LB26692 [31]. Thus, the E. coli O104:H4 strains used in our study appear to express AAF/I fimbriae and may be in part responsible for the robust biofilm formation by the E. coli O104:H4 strains observed in our studies.
Other fimbriae involved in biofilm formation included lpf, which was first noted in the outbreak E. coli O104:H4 strains by Bielaszewska et al. (2011) [66] and Rasko et al. (2011) [21]. It was subsequently found that the E. coli O104:H4 strains had two lpf operons (lpf1 and lpf2). They were highly homologous to the lpf1 and lpf2 genes in the EAEC 55989 strain but not in the E. coli O157:H7 EDL933 strain [38]. The lpf1 operon consists of genes AE, where lpf1A is the major fimbriae subunit, lpf1B is a chaperone, lpf1C is an outer membrane usher protein, lpf1D is a minor fimbrial subunit, and lpf1E may be a regulator or another fimbrial subunit [38]. The lpf2 operon consists of genes AD, with the possible presence of a duplicate D gene, and the protein products are analogous to those found in the lpf1 operon [38]. Thus, like AAF/I, the assembly of the LpF fimbriae appears to be carried out through the chaperone–usher pathway [71].
It had been previously noted that biofilm formation by E. coli O104:H4 was greater than that by E. coli O157:H7, both in vitro and in vivo [62]. The in vitro studies, however, were performed without CO2 in DMEM with 0.45% glucose. It was reported that E. coli O104:H4 produced 7.3-fold greater amounts of biofilm compared with the E. coli O157:H7 strain. The authors also examined biofilm formation in a flow cell in DMEM after 16 h and found that biofilm formation only occurred with E. coli O104:H4 and not with E. coli O157:H7 under these conditions [62]. We did not observe biofilm formation by the E. coli O104:H4 strains in an HBD cell culture medium, only in an MH II medium, nor did we observe biofilm formation by the E. coli O104:H4 strains in a DMEM maintenance medium, which we used to maintain the HEK293 TLR2/4 cells. However, the maintenance medium also contained other proprietary inhibitory agents. Additionally, our finding that E. coli O157:H7 was a weak biofilm producer was previously noted for most isolates of this EHEC strain [28,74,75,76]. Weak biofilm and curli fimbriae production also coincided with the weak binding of Congo Red dye [74,77]. Chen et al. (2013) [28] proposed that there are three factors that influence biofilm formation in E. coli strains: (1) prophage insertion into the MerR-like (mlrA or previously labeled yehV) regulator gene; (2) mutation in RpoS, the stress-response sigma factor required for the expression of stress response genes; and (3) impaired bacterial motility. MlrA and RpoS are both required for biofilm formation and curli fimbriae biosynthesis [78,79]. MlrA is a DNA-binding transcriptional activator that is required for the expression of csgD which is responsible for the expression of the curli csgBAC genes in E. coli. RpoS activity, on the other hand, is required for the expression of mlrA [78,79,80]. Excision of the prophage from the mlrA gene was shown to restore curli biosynthesis and biofilm formation [75]. In some non-O157:H7 strains that were limited in biofilm formation and curli expression, they found that prophage insertions in mlrA could not be complemented. These strains shared a common phenotype that had a defect in motility. Thus, it was suggested that motility was another factor that limited biofilm formation [28]. We surmise in our studies with E. coli ATCC 25922 that the limited biofilm formation and Congo Red binding that we observed may similarly result from a defect in mlrA or RpoS, as reported for O157:H7 and other non-O157:H7 strains [28]. E. coli ATCC 25922 has been previously reported to be a strong biofilm producer [81,82]. It has also been found that inactivation of the purL gene in E. coli ATCC 25922 can result in limited biofilm formation [83]. This finding suggests that there may be other uncharacterized components or genetic elements that could affect biofilm formation in E. coli besides defects in mlrA, RpoS, or a lack of motility.
The differential growth between the E. coli O104:H4 and O157:H7 strains in the HBD cell culture medium was unexpected. Normally, this cell culture medium is used for detecting the activation of TLR(s) that are present in specialized HRK293 cells. HEK293-TLR cells have been used previously to evaluate the potential host innate immune response to several other live Gram-negative pathogens. The growth of these microorganisms in an HBD cell culture medium, however, was not observed [45]. In the present study, we examined the activation of TLR2 and 4, which are two TLRs that are exogenously expressed on the surface of mammalian cells [46], by live E. coli strains. We found that the live E. coli strains activated both TLR2 and 4, with TLR4 activation being more prevalent than TLR2 activation. We have previously observed that under certain conditions, TLR2 or 4 activation can vary widely in some Gram-negative pathogens. TLR2 and 4 could both be activated with one being more dominant than the other, TLR2 or 4 alone could be activated, or neither TLR2 nor 4 was activated [45]. The activation of these TLRs depends on the microorganism being examined or the conditions of growth of the microorganism [45]. Because the HBD cell culture medium was a proprietary medium (Invivogen), we can only speculate that there may have been at least two categories of inhibitory compounds (or antibiotics) present in the HBD cell culture medium. At least one of these allowed the E. coli O104:H4 strains to grow but not the O157:H7 strain. In comparison, in a rich, complex medium, such as the MH II medium, the growth of the E. coli strains was essentially identical (see Figure 3C). The first type of inhibitory compound that may have been present in the HBD cell culture medium is an antibiotic(s) to maintain the sterility of the HEK293 TLR cell line, for example, a combination of penicillin/streptomycin and/or another proprietary anti-microbial agent. The second type of inhibitory compound that may have been present is an antibiotic (or proprietary reagent), for example, ampicillin, to help maintain or select the SEAP expression plasmid in the transfected HEK293 TLR cell line [84,85]. The inhibitory reagent may also have been a combination of antibiotics or inhibitory components in the HBD cell culture medium. From our studies, we know that E. coli O157:H7 was relatively sensitive to streptomycin and ampicillin, while the E. coli O104:H4 strains we used in the present study were resistant to both antibiotics (see Table S2) [58,59,60]. Additionally, the E. coli O157:H7 and O104:H4 strains that were used in the present study were resistant to penicillin G (Table S2), which eliminate it as the differential or selective agent in the HBD cell culture medium. A mixture of HBD cell culture medium and Congo Red agar was also evaluated. The differential growth of the E. coli strains on a solid HBD cell culture medium and Congo Red agar was consistent with what we observed with the HBD cell culture medium. The colonies of E. coli O104:H4 on this solid medium, however, were black in color.
Further studies are needed to analyze the culture conditions that allow the E. coli O104:H4 strains to grow in the HBD cell culture medium but not the E. coli O157:H7 strain. Additionally, other strains of E. coli O104:H4 and O157:H7 as well as other non-O157:H7 strains associated with HUS must be examined to evaluate the specificity of the medium. That the E. coli O104:H4 strains were able to grow in flasks with an HBD cell culture medium when shaken without CO2 was noted. However, smaller (0.2–2.0 mL), stationary cultures (96-well plates or small tubes) of O104:H4 strains always grew with CO2. In addition, the effect of CO2 on virulence and the possible augmented expression of AAF/I fimbriae and other pathogen virulence proteins, such as Stx2a, must be investigated. Our report of new findings on the difference between E. coli O104:H4 and O157:H7 will further help differentiate between these two pathogens. In the future, it may assist in establishing the type of appropriate treatment for patients presenting with HUS. The involvement of alternate metabolic pathways that allow for the growth of E. coli O104:H4 and enhance virulence may offer potential targets for possible therapeutic intervention for HUS caused by this pathogen.

Supplementary Materials

The following supporting information can be downloaded at https://www.mdpi.com/article/10.3390/microorganisms11071744/s1. Table S1. Phenotypic differences displayed by Biology GENIII plates of E. coli strains used in the present study; Table S2. Comparison of antibiotic susceptibilities between E. coli O104:H4 strains and E. coli O157:H7; Figure S1. Characteristics of E. coli strains used in the present study; Figure S2. Comparison of the amino acid sequences of the AggA, AggB, AggC, and AggD AAF/I proteins from E. coli O104:H4 2011C-3493, 2009E-2050, and 2009E-2071 strains.

Author Contributions

K.A. designed and performed the experiments and wrote the manuscript. D.A.R. contributed to the study design, performed the experiments, and contributed to writing the manuscript. J.L.D. performed the experiments and contributed to writing the manuscript. W.R.D. performed the experiments and contributed to writing the manuscript. C.M. performed the experiments and contributed to writing the manuscript. D.P.F. performed statistical analyses of the results and contributed to writing the manuscript. P.L.W. contributed to the design, administration, and funding of the studies. B.K.P. contributed to the design, administration, and funding of the studies. All authors have read and agreed to the published version of the manuscript.

Funding

The authors would like to thank the JSTO/Defense Threat Reduction Agency for their support of project no. 1.1A0018_07_RD-B.

Data Availability Statement

The original contributions presented in the study are included in the article/supplementary material. Further inquiries can be directed to the corresponding authors.

Acknowledgments

The authors would like to thank David DeShazer for his encouragement and support during the preparation of this manuscript. We also would like to thank James Writer for editing and providing suggestions for the manuscript. The opinions, interpretations, conclusions, and recommendations are those of the authors and are not necessarily endorsed by the U.S. Army. The funder had no role in the study design, data collection, data analysis, decision to publish the results, or the preparation of this manuscript.

Conflicts of Interest

The authors declare that the research was conducted in the absence of any commercial or financial relationships that could be construed as a potential conflict of interest.

References

  1. Havelaar, A.H.; Kirk, M.D.; Torgerson, P.R.; Gibb, H.J.; Hald, T.; Lake, R.J.; Praet, N.; Bellinger, D.C.; de Silva, N.-R.; Gargouri, N.; et al. World Health Organization global estimates and regional comparisons of the burden of foodborne disease in 2010. PLoS Med. 2015, 12, e1001923. [Google Scholar] [CrossRef] [PubMed] [Green Version]
  2. Pires, S.M.; Majowicz, S.; Gill, A.; Devleesschauwer, B. Global and regional source attribution of Shiga toxin-producing Escherichia coli infections using analysis of outbreak surveillance data. Epidemiol. Infect. 2019, 147, e236. [Google Scholar] [CrossRef] [PubMed] [Green Version]
  3. Tarr, P.I. Escherichia coli O157:H7: Clinical, diagnostic, and epidemiological aspects of human infection. Clin. Infect. Dis. 1995, 20, 1–8. [Google Scholar] [CrossRef] [PubMed]
  4. Tarr, P.I.; Gordon, C.A.; Chandler, W.L. Shiga-toxin-producing Escherichia coli and haemolytic uraemic syndrome. Lancet 2005, 365, 1073–1086. [Google Scholar] [CrossRef]
  5. Kavanagh, D.; Raman, S.; Sheerin, N.S. Management of hemolytic uremic syndrome. F1000Prime Rep. 2014, 6, 119. [Google Scholar] [CrossRef] [PubMed]
  6. Wong, C.S.; Jelacic, S.; Habeeb, R.L.; Watkins, S.L.; Tarr, P.I. The risk of the hemolytic-uremi syndrome after antibiotic treatment of Escherichia coli O157:H7 infections. N. Eng. J. Med. 2000, 342, 1930–1936. [Google Scholar] [CrossRef] [PubMed] [Green Version]
  7. Bitzan, M. Treatment options for HUS secondary to Escherichia coli O157:H7. Kidney Internat. 2009, 75, S62–S66. [Google Scholar] [CrossRef] [Green Version]
  8. Holtz, L.R.; Tarr, P.I. Shiga Toxin-Producing Escherichia coli: Microbiology, Pathogenesis, Epidemiology, and Prevention. Available online: https://www.uptodate.com (accessed on 7 January 2023).
  9. O’Brian, A.D.; Tesh, V.L.; Donohue-Rolfe, A.; Jackson, M.P.; Olsenes, S.; Sandvig, K.; Lindberg, A.A.; Keusch, G.T. Shiga toxin: Biochemistry, genetics, mode of action, and role in pathogenesis. Curr. Top. Microbiol. Immunol. 1992, 180, 65–94. [Google Scholar]
  10. Gyles, C.L. Shiga toxin-producing Escherichia coli: An overview. J. Anim. Sci. 2007, 85 (Suppl. SE), E45–E62. [Google Scholar] [CrossRef]
  11. Strockbine, N.A.; Marques, L.R.M.; Newland, J.W.; Smith, H.W.; Holmes, R.K.; O’Brien, A.D. Two toxin-converting phages from Escherichia coli O157:H strain 933 encode antigenically distinct toxins with similar biologic activities. Infect. Immun. 1986, 53, 135–140. [Google Scholar] [CrossRef] [Green Version]
  12. Ostroff, S.M.; Tarr, P.I.; Neill, M.A.; Lewis, J.; Hargrett-Bean, N.; Kobayashi, J.M. Toxin genotypes and plasmid profiles as determinants of systemic sequelae in Escherichia coli O157:H7 infections. J. Infect. Dis. 1989, 160, 994–998. [Google Scholar] [CrossRef] [PubMed]
  13. Proulx, F.; Seidman, E.G.; Karpman, D. Pathogenesis of Shiga toxin-associated hemolytic uremic syndrome. Pediatr. Res. 2001, 50, 163. [Google Scholar] [CrossRef] [Green Version]
  14. Bielaszewska, M.; Tarr, P.I.; Karch, H.; Zhang, W.; Mathys, W. Phenotypic and molecular analysis of tellurite resistance among enterohemorrhagic Escherichia coli O157:H7 and sorbitol-fermenting O157:NM clinical isolates. J. Clin. Microbiol. 2005, 43, 452–454. [Google Scholar] [CrossRef] [PubMed] [Green Version]
  15. Frank, C.; Werber, D.; Cramer, J.P.; Askar, M.; Faber, M.; an der Heiden, M.; Berhard, H.; Fruth, A.; Prager, R.; Spode, A.; et al. Epidemic profile of shiga-toxin-producing Escherichia coli O104:H4 outbreak in Germany. N. Engl. J. Med. 2011, 365, 1771–1780. [Google Scholar] [CrossRef] [Green Version]
  16. Gault, G.; Weill, F.X.; Mariani-Kurkdjian, P.; Silva, N.J.; King, L.; Aldabe, B.; Charron, M.; Ong, N.; Castor, C.; Mace, E.; et al. Outbreak of haemolytic uraemic syndrome and bloody diarrhoea due to Escherichia coli O104:H;4, South-West France, June 2011. Eurosurveillance 2011, 16, 19950. [Google Scholar] [CrossRef] [PubMed] [Green Version]
  17. Scheutz, F.; Nielsen, E.M.; Frimodt-Moller, J.; Boisen, N.; Morabito, S.; Tozzoli, R.; Nataro, J.P.; Caprioli, A. Characteristics of the enteroaggregative Shiga toxin/verotoxin-producing Escherichia coli O10f4:H4 strain causing the outbreak of haemolytic uraemic syndrome in Germany, May to June 2011. Eurosurveillance 2011, 16, 19889. [Google Scholar] [CrossRef] [PubMed] [Green Version]
  18. Buchholz, U.; Bernard, H.; Werber, D.; Böhmer, M.M.; Remschmidt, C.; Wilking, H.; Defere, Y.; an der Heiden, M.; Adlhoch, C.; Dreesman, J.; et al. German outbreak of Escherichia coli O104:H4 associated with sprouts. N. Engl. J. Med. 2011, 365, 1763–1770. [Google Scholar] [CrossRef]
  19. Brzuszkiewicz, E.; Thürmer, A.; Schuldes, J.; Leimbach, A.; Liesegang, H.; Meyer, F.-D.; Boelter, J.; Petersen, H.; Gottschalk, G.; Daniel, R. Genome sequence analyses of two isolates from the recent Escherichia coli outbreak in Germany reveal the emergence of a new pathotype: Entero-aggregative-haemorrhgic Escherichia coli EAHEC. Arch. Microbiol. 2011, 193, 883–891. [Google Scholar] [CrossRef] [Green Version]
  20. Nataro, J.P.; Deng, Y.; Maneval, D.R.; German, A.L.; Martin, W.C.; Levine, M.M. Aggregative adherence fimbriae I of enteroaggregative Escherichia coli mediate adherence to Hep-2 cells and hemagglutination of human erythrocytes. Infect. Immun. 1992, 60, 2297–2304. [Google Scholar] [CrossRef] [Green Version]
  21. Rasko, D.A.; Webster, D.R.; Sahl, J.W.; Bashir, A.; Boisen, N.; Scheutz, F.; Paxino, E.E.; Sebra, R.; Chin, C.-S.; Iliopoulos, D.; et al. Origins of the E. coli strain causing an outbreak of hemolytic-uremic syndrome in Germany. N. Engl. J. Med. 2011, 365, 709–717. [Google Scholar] [CrossRef] [Green Version]
  22. Rohde, H.; Qin, J.; Cui, Y.; Li, D.; Loman, N.J.; Hentschke, M.; Chen, W.; Pu, F.; Peng, Y.; Li, J.; et al. Open-source genomic analysis of Shiga toxin-producing E. coli O104:H4. N. Engl. J. Med. 2011, 365, 718–724. [Google Scholar]
  23. Nataro, J.P.; Kaper, J.B. Diarrheagenic Escherichia coli. Clin. Microbiol. Rev. 1998, 11, 142–201. [Google Scholar] [CrossRef] [Green Version]
  24. Moon, H.W.; Whipp, S.C.; Argenzio, R.A.; Levine, M.M.; Giannella, R.A. Attaching and effacing activities of rabbit and human enteropathogenic Escherichia coli in pig and rabbit intestines. Infect. Immun. 1983, 41, 1340–1351. [Google Scholar] [CrossRef] [Green Version]
  25. Jerse, A.E.; Yu, J.; Tall, B.D.; Kaper, J.B. A genetic locus of enteropathogenic Escherichia coli necessary for the production of attaching and effacing lesions on tissue culture cells. Proc. Natl. Acad. Sci. USA 1990, 87, 7839–7843. [Google Scholar] [CrossRef]
  26. Vogeleer, P.; Tremblay, Y.D.N.; Mafu, A.A.; Jacques, M.; Harel, J. Life on the outside: Role of biofilms in environmental persistence of Shiga-toxin producing Escherichia coli. Front. Microbiol. 2014, 5, 317. [Google Scholar] [CrossRef] [PubMed] [Green Version]
  27. Pratt, L.A.; Kolter, R. Genetic analysis of Escherichia coli biofilm formation: Roles of flagella, motility, chemotaxis and type I pili. Mol. Microbiol. 1998, 30, 285–293. [Google Scholar] [CrossRef] [PubMed]
  28. Chen, C.-Y.; Hofmann, C.S.; Cottrell, B.J.; Strobaugh, T.P.; Paoli, G.C.; Nguyen, L.-H.; Yan, X.; Uhlich, G.A. Phenotypic and genotypic characterization of biofilm forming capabilities in non-O157 Shiga toxin-producing Escherichia coli strains. PLoS ONE 2013, 8, e84863. [Google Scholar] [CrossRef] [PubMed]
  29. Katani, R.; Kudva, I.T.; Srinivasan, S.; Stasko, J.B.; Schilling, M.; Li, L.; Cote, R.; DebRoy, C.; Arthur, T.M.; Sokurenko, E.V.; et al. Strain and host-cell dependent role of type-1 fimbriae in the adherence phenotype of super-shed Escherichia coli O157:H7. Int. J. Med. Microbiol. 2021, 311, 151511. [Google Scholar] [CrossRef]
  30. Berry, A.A.; Yang, Y.; Pakharukova, N.; Garnett, J.A.; Lee, W.-C.; Cota, E.; Marchant, J.; Roy, S.; Tuittila, M.; Liu, B.; et al. Structural insight into host recognition by aggregative adherence fimbriae of enteroaggregative Escherichia coli. PloS Path. 2014, 10, e1004404. [Google Scholar] [CrossRef] [Green Version]
  31. Berger, P.; Knodler, M.; Forstner, K.U.; Berger, M.; Bertling, C.; Sharma, C.M.; Vogel, J.; Karch, H.; Dobrindt, U.; Mellmann, A. The primary transcriptome of the Escherichia coli O104:H4 pAA plasmid and novel insights into its virulence gene expression and regulation. Sci. Rep. 2016, 6, 35307. [Google Scholar] [CrossRef] [Green Version]
  32. Nagy, A.; Xu, Y.; Bauchan, G.R.; Shelton, D.R.; Nou, X. Aggregative adherence fimbriae I (AAF/I) mediate colonization of fresh produce and abiotic surface by Shiga toxigenic enteroaggregative Escherichia coli O104:H4. Internat. J. Food Microbiol. 2016, 229, 44–51. [Google Scholar] [CrossRef] [Green Version]
  33. Schiller, P.; Knodler, M.; Berger, P.; Greune, L.; Fruth, A.; Mellmann, A.; Dersch, P.; Berger, M.; Dobrindt, U. The superior adherence phenotype of E. coli O104:H4 is directly mediated by the aggregative adherence fimbriae type I. Virulence 2021, 12, 346–359. [Google Scholar] [CrossRef] [PubMed]
  34. Richter, A.M.; Povolotsky, T.L.; Wieler, L.H.; Hengge, R. Cyclic-di-GMP signalling and biofilm-related properties of the Shiga toxin-producing 2011 German outbreak Escherichia coli O104:H4. EMBO Mol. Med. 2014, 6, 1622–1637. [Google Scholar] [CrossRef]
  35. Yan, Z.; Yin, M.; Chen, J.; Li, X. Assembly and substrate recognition of curli biogenesis system. Nat. Commun. 2020, 11, 241. [Google Scholar] [CrossRef] [Green Version]
  36. Elpers, L.; Hensel, M. Expression and functional characterization of various chaperon-usher fimbriae, curli fimbriae, and type 4 pili of enterohemorrhagic Escherichia coli O157:H7 Sakai. Front. Microbiol. 2020, 11, 378. [Google Scholar] [CrossRef] [PubMed]
  37. Farfan, M.J.; Cantero, L.; Vidal, R.; Botkin, D.J.; Torres, A.G. Long polar fimbriae of enterohemorrhagic Escherichia coli O157:H7 bind to extracellular matrix proteins. Infect. Immun. 2011, 79, 3744–3750. [Google Scholar] [CrossRef] [PubMed] [Green Version]
  38. Ross, B.N.; Rojas-Lopez, M.; Cieza, R.J.; McWilliams, B.D.; Torres, A.G. The role of long polar fimbriae in Escherichia coli O104:H4 adhesion and colonization. PLoS ONE 2015, 10, e0141845. [Google Scholar] [CrossRef] [Green Version]
  39. Low, A.S.; Dziva, F.; Torres, A.G.; Martinez, J.L.; Rosser, T.; Naylor, S.; Spears, K.; Holden, N.; Mahajan, A.; Findlay, J.; et al. Cloning, expression, and characterization of fimbrial operon F9 from enterohemorrhagic Escherichia coli O157:H7. Infect. Immun. 2006, 74, 2233–2244. [Google Scholar] [CrossRef] [Green Version]
  40. Holmes, A.; Rossez, Y.; Wright, K.M.; Hedley, P.E.; Morris, J.; Willats, W.G.T.; Holden, N.J. Escherichia coli O157:H7 F9 fimbriae recognize plant xyloglucan and elicit a response in Arabisopsis thaliana. Int. J. Mol. Sci. 2020, 21, 9720. [Google Scholar] [CrossRef]
  41. Beloin, C.; Roux, A.; Ghigo, J.-M. Escherichia coli biofilms. Curr. Top. Microbiol. Immunol. 2008, 322, 249–289. [Google Scholar]
  42. Kaplan, J.B. Biofilm dispersal: Mechanisms, clinical implications, and potential therapeutic uses. J. Dent. Res. 2010, 89, 205–218. [Google Scholar] [CrossRef] [PubMed] [Green Version]
  43. Takeuchi, O.; Akira, S. Pattern recognition receptors and inflammation. Cell 2010, 140, 805–820. [Google Scholar] [CrossRef] [PubMed] [Green Version]
  44. Zhang, D.; Zhang, G.; Hayden, M.S.; Greenblatt, M.B.; Bussey, C.; Flavell, R.A.; Ghosh, S. A toll-like receptor that prevents infection by uropathogenic bacteria. Science 2004, 303, 1522–1526. [Google Scholar] [CrossRef] [PubMed]
  45. Amemiya, K.; Dankmeyer, J.L.; Bernhards, R.C.; Fetterer, D.P.; Waag, D.M.; Worsham, P.L.; DeShazer, D. Activation of Toll-like receptors by live Gram-negative bacterial pathogens reveals mitigation of TLR4 responses and activation of TLR5 by flagella. Front. Cell. Infect. Microbiol. 2021, 11, 745325. [Google Scholar] [CrossRef]
  46. Akira, S.; Uematsu, S.; Takeuchi, O. Pathogen recognition and innate immunity. Cell 2006, 124, 783–801. [Google Scholar] [CrossRef] [Green Version]
  47. Kang, J.Y.; Nanm, X.; Jin, M.S.; Youn, S.-J.; Ryu, Y.H.; Mah, S.; Han, S.H.; Lee, H.; Paik, S.-G.; Lee, J.-O. Recognition of lipopeptide patterns by Toll-like receptor 2-Toll-like receptor 6 heterodimer. Immunity 2009, 31, 873–884. [Google Scholar] [CrossRef] [Green Version]
  48. Kurokawa, K.; Ryu, K.-H.; Ichikawa, R.; Masuda, A.; Kim, M.-S.; Lee, H.; Chae, J.-H.; Shimizu, T.; Saitoh, T.; Kuwano, K.; et al. Novel bacterial lipoprotein structures conserved in low-GC content Gram-positive bacteria are recognized by Toll-like receptor 2. J. Biol. Chem. 2012, 287, 13170–13181. [Google Scholar] [CrossRef] [Green Version]
  49. Nakayama, H.; Kurokawa, K.; Lee, B.L. Lipoproteins in bacteria: Structures and biosynthetic pathways. FEBS J. 2012, 279, 4247–4268. [Google Scholar] [CrossRef]
  50. Poltorak, A.; He, X.; Smirnova, I.; Liu, M.-Y.; van Huffel, C.; Du, X.; Birdwell, D.; Alejos, E.; Silva, M.; Galanos, C.; et al. Defective LPS signaling in C3H/HeJ and C57BL/10ScCr mice: Mutations in Tlr4 gene. Science 1998, 282, 2085–2088. [Google Scholar] [CrossRef] [Green Version]
  51. Shimazu, R.; Akashi, S.; Ogata, H.; Nagai, Y.; Fukudome, K.; Miyake, K.; Kimoto, M. MD-2, a molecule that confers lipopolysaccharide responsiveness on Toll-like receptor 4. J. Exp. Med. 1999, 189, 1777–1782. [Google Scholar] [CrossRef] [Green Version]
  52. Hayashi, F.; Smith, K.D.; Ozinsky, A.; Hawn, T.R.; Yi, E.C.; Goodlett, D.R.; Eng, J.K.; Akira, S.; Underhill, D.M.; Aderem, A. The innate immune response to bacterial flagellin is mediated by Toll-like receptor 5. Nature 2001, 410, 1099–1103. [Google Scholar] [CrossRef]
  53. Donnelly, M.A.; Steiner, T.S. Two nonadjacent regions in enteroaggregative Escherichia coli flagellin are required for activation of Toll-like receptor 5. J. Biol. Chem. 2002, 277, 40456–40461. [Google Scholar] [CrossRef] [Green Version]
  54. Smith, K.D.; Andersen-Nissen, E.; Hayashi, F.; Strobe, K.; Bergman, M.A.; Barrett, S.L.B.; Cookson, B.T.; Aderem, A. Toll-like receptor 5 recognizes a conserved site on flagellin required for protofilament formation and bacterial motility. Nat. Immunol. 2003, 4, 1247–1253. [Google Scholar] [CrossRef] [PubMed]
  55. Heine, H.S.; Hershfield, J.; Marchand, C.; Miller, L.; Halasohoris, S.; Prucell, B.K.; Worsham, P.L. In vitro antibiotic susceptibilities of Yersinia pestis determined by broth microdilution following CLSI methods. Antimicrobial. Agents Chemother. 2015, 59, 1919–1921. [Google Scholar] [CrossRef] [Green Version]
  56. Surgalla, M.J.; Beesley, E.D. Congo Red-agar plating medium for detecting pigmentation in Pasteurella pestis. Appl. Microbiol. 1969, 18, 834–837. [Google Scholar] [CrossRef] [PubMed]
  57. Smith, M.J.; Melton-Celsa, A.R.; Sinclair, J.F.; Carvalho, H.M.; Robinson, C.; O’Brian, A.D. Monoclonal antibody 11E10, which neutralizes Shiga toxin type 2 (Stx2), recognizes three regions on the Stx2 A subunit, blocks the enzymatic action of the toxin in vitro, and alters the overall cellular distribution of the toxin. Infect. Immun. 2009, 77, 2730–2740. [Google Scholar] [CrossRef] [PubMed] [Green Version]
  58. Fass, R.J.; Barnishan, J. Minimal inhibitory concentrations of 34 antimicrobial agents for control strains Escherichia coli ATCC 25922 and Pseudomonas aeruginosa ATCC 27853. Antimicrobial. Agents Chemother. 1979, 16, 622–624. [Google Scholar] [CrossRef] [Green Version]
  59. Ahmed, S.A.; Awosika, J.; Baldwin, C.; Bishop-Lilly, K.A.; Biswas, B.; Broomall, S.; Chain, P.S.G.; Chertkov, O.; Chokoshvili, O.; Coyne, S.; et al. Genomic comparison of Escherichia coli O104:H4 isolates from 2009 and 2011 reveals plasmid, and prophage heterogeneity, including Shiga toxin encoding phage stx2. PLoS ONE 2012, 7, e48228. [Google Scholar] [CrossRef] [Green Version]
  60. Chokoshvili, O.; Lomashvili, K.; Malakmadze, N.; Geleishvil, M.; Brant, J.; Imnadze, P.; Chitadze, N.; Tevzadze, L.; Chanturia, G.; Tevdoradze, T.; et al. Investigation of an outbreak of bloody diarrhea complicated with hemolytic uremic syndrome. J. Epidemiol. Glob. Health 2014, 4, 249–259. [Google Scholar] [CrossRef] [Green Version]
  61. Merritt, J.H.; Kadouri, D.E.; O’Toole, G.A. Growing and analyzing static biofilms. Curr. Protoc. Microbiol. 2005, 1, unit-1B.1. [Google Scholar]
  62. Safadi, R.A.; Abu-Ali, G.S.; Sloup, R.E.; Rudrik, J.T.; Waters, C.M.; Eaton, K.A.; Manning, S.D. Correlation between in vivo biofilm formation and virulence gene expression in Escherichia coli O104:H4. PLoS ONE 2012, 7, e41628. [Google Scholar] [CrossRef]
  63. Heppel, L.A. Selective release of enzymes from bacteria. Science 1967, 156, 1451–1455. [Google Scholar] [CrossRef] [PubMed]
  64. MacAlister, T.J.; Costerton, J.W.; Thompson, L.; Thompson, J.; Ingram, J.M. Distribution of alkaline phosphatase within the periplasmic space of Gram-negative bacteria. J. Bacteriol. 1972, 111, 827–832. [Google Scholar] [CrossRef] [Green Version]
  65. Cummins, E.P.; Selfridge, A.C.; Sporn, P.H.; Sznajer, J.I.; Taylor, C.T. Carbon dioxide-sensing in organisms and its implications for human disease. Cell Mol. Life Sci. 2014, 71, 831–845. [Google Scholar] [CrossRef] [PubMed] [Green Version]
  66. Bielaszewska, M.; Mellmann, A.; Zhang, W.; Köck, R.; Fruth, A.; Bauwens, A.; Peters, G.; Karch, H. Characterization of the Escherichia coli strain associated with an outbreak of heamolytic uraemic syndrome in Germany, 2011: A microbiology study. Lancet Infect. Dis. 2011, 11, 671–678. [Google Scholar] [CrossRef] [Green Version]
  67. Boisen, N.; Hansen, A.-M.; Melton-Celsa, A.R.; Zangari, T.; Mortensen, N.P.; Kaper, J.B.; O’Brien, A.D.; Nataro, J.P. The presence of the pAA plasmid in the German O104:H4 Shiga toxin type 2a (Stx2A)-producing enteroaggregative Escherichia coli strain promotes the translocation of Stx2a across an epithelial cell monolayer. J. Infect. Dis. 2014, 210, 1909–1919. [Google Scholar] [CrossRef] [PubMed] [Green Version]
  68. Boisen, N.; Melton-Celsa, A.R.; Hansen, A.-M.; Zangari, T.; Smith, M.A.; Russo, L.M.; Scheutz, F.; O’Brian, A.D.; Nataro, J.P. The role of the AggR regulon in the virulence of the Shiga toxin-producing enteroaggregative Escherichia coli epidemic O104:H4 strain in mice. Front. Microbiol. 2019, 10, 1824. [Google Scholar] [CrossRef] [PubMed] [Green Version]
  69. Hüttener, M.; Prieto, A.; Espelt, J.; Bernabeu, M.; Juárez, A. Stringent response and AggR-dependent virulence regulation in the enteroaggregative Escherichia coli strain 042. Front. Microbiol. 2018, 9, 717. [Google Scholar] [CrossRef] [PubMed]
  70. Jønsson, R.; Struve, C.; Boisen, N.; Mateiu, R.V.; Santiago, A.E.; Jenssen, H.; Nataro, J.P.; Krogflelt, K.A. Novel aggregative adherence fimbria variant of enteroaggregative Escherichia coli. Infect. Immun. 2015, 83, 1396–1405. [Google Scholar] [CrossRef] [PubMed] [Green Version]
  71. Busch, A.; Waksman, G. Chaperone-usher pathways: Diversity and pilus assembly mechanism. Phil. Trans. R. Soc. B 2012, 367, 1112–1122. [Google Scholar] [CrossRef] [Green Version]
  72. Jønssonc, R.; Struve, C.; Boll, E.J.; Boisen, N.; Joensen, K.G.; Sørensen, C.A.; Jensen, B.H.; Scheutz, F.; Jenssen, H.; Krogfelt, K.A. A novel pAA virulence plasmid encoding toxins and two distinct variants of the fimbriae of enteroaggregative Escherichia coli. Front. Microbiol. 2017, 8, 263. [Google Scholar]
  73. Ferdous, M.; Zhou, K.; de Boer, R.F.; Friedrich, A.W.; Kooistra-Smid, A.M.D.; Rossen, J.W.A. Comprehensive characterizatiom of Escherichia coli O104:H4 isolated from patients in the Netherlands. Front. Microbiol. 2015, 6, 1348. [Google Scholar] [CrossRef] [Green Version]
  74. Uhlich, G.A.; Keen, J.E.; Elder, R.O. Mutations in the csgD promoter associated with variations in curli expression in certain strains of Escherichia coli O157:H7. Appl. Environ. Microbiol. 2001, 67, 2367–2370. [Google Scholar] [CrossRef] [PubMed] [Green Version]
  75. Uhlich, G.A.; Chen, C.-Y.; Cottrell, B.J.; Hofmann, C.S.; Yan, X.; Nguyen, L. Stx1 prophage excision in Escherichia coli strain PA20 confers strong curli and biofilm formation by restoring native mlrA. FEMS Microbiol. Lett. 2016, 363, fnw123. [Google Scholar] [CrossRef] [PubMed] [Green Version]
  76. Sheng, H.; Xue, Y.; Zhao, W.; Hovde, C.J.; Minnich, S.A. Escherichia coli O157:H7 curli fimbriae promotes biofilm formation, epithelial cell invasion, and persistence in cattle. Microorganisms 2020, 8, 580. [Google Scholar] [CrossRef] [Green Version]
  77. Azam, M.W.; Zuberi, A.; Khan, A.U. bolA gene involved in curli amyloids and fimbriae production in E. coli: Exploring pathways to inhibit biofilm and amyloid formation. J. Biol. Res.-Thessaloniki. 2020, 27, 10. [Google Scholar] [CrossRef]
  78. Brown, P.K.; Dozois, C.M.; Nickerson, C.A.; Zuppardo, A.; Terlonge, J.; Curtiss III, R. MlrA, a novel regulator of curli (AgF) and extracellular matrix synthesis by Escherichia coli and Salmonella enterica serovar Typhimurium. Mol. Microbiol. 2001, 41, 349–363. [Google Scholar] [CrossRef]
  79. Uhlich, G.A.; Chen, C.-Y.; Cottrell, B.J.; Hofmann, C.S.; Dudley, E.G.; Strobaugh, T.P., Jr.; Nguyen, L.-H. Phage insertion in mlrA and variations in rpoS limit curli expression and biofilm formation in Escherichia coli serotype O157:H7. Microbiology 2013, 159, 1586–1596. [Google Scholar] [CrossRef] [Green Version]
  80. Ogasawara, H.; Yamamoto, K.; Ishihama, A. Regulatory role of MlrA in transcription activation of csgD, the master regulator of biofilm formation in Escherichia coli. FEMS Micribiol. Lett. 2010, 312, 160–168. [Google Scholar] [CrossRef]
  81. Naves, P.; del Prado, G.; Huelves, L.; Gracia, M.; Ruiz, V.; Blanco, J.; Dahbi, G.; Blanco, M.; del Carmen Ponte, M.; Soriano, F. Correlation between virulence of factors and in vitro biofilm formation by Escherichia coli strains. Microb. Pathog. 2008, 45, 86–91. [Google Scholar] [CrossRef]
  82. Cremét, L.; Corvec, S.; Batard, E.; Auger, M.; Lopez, I.; Pagniez, F.; Dauvergne, S.; Caroff, N. Comparison of three methods to study biofilm formation by clinical strains of Escherichia coli. Diag. Microbiol. Infect. Dis. 2013, 75, 252–255. [Google Scholar] [CrossRef] [PubMed]
  83. Cepas, V.; Ballén, V.; Gabasa, Y.; Ramirez, M.; López, Y.; Soto, S.M. Transposon insertion in the purL gene induces biofilm depletion in Escherichia coli ATCC 25922. Pathogens 2020, 9, 774. [Google Scholar] [CrossRef] [PubMed]
  84. Butnick, N.Z.; Miyamoto, C.; Chizzonite, R.; Cullen, B.R.; Ju, G.; Skalka, A.M. Regulation of the human c-myc gene: 5′ noncoding sequences do not affect translation. Mol. Cell. Biol. 1985, 5, 3009–3016. [Google Scholar] [PubMed] [Green Version]
  85. Berger, J.; Howard, A.D.; Gerber, L.; Cullen, B.R.; Udenfriend, S. Expression of active, membrane-bound human placental alkaline phosphatase by transfected simian cells. Proc. Natl. Acad. Sci. USA 1987, 84, 4885–4889. [Google Scholar] [CrossRef] [PubMed]
Figure 1. CO2 enhances biofilm formation by the E. coli O104:H4 strains but not the E. coli O157:H7 strains. The E. coli strains that were examined were E. coli O104:H4 (strains Ec01, Ec02, and Ec03), ATCC 25922, and O157:H7. The cultures were incubated in MH II broth overnight at 37 °C. All strains were examined in triplicate, and figures represent 1 of 3 separate studies. Only a single well of the triplicate is shown (A,B). A. Biofilm formation by the E. coli strains in a 96-well plate with and without CO2. B. Biofilm formation by the E. coli strains in 5 mL culture tubes with and without CO2. (C) Quantitative crystal violet analysis of the amount of biofilm formed by the E. coli strains in 5 mL culture tubes with and without CO2. In (C), results are presented as geometric mean with standard error of the mean. p-values are shown for the comparison of the amount of biofilm formation by E. coli O157:H7 with (orange line) and without (blue line) CO2 and the amount of biofilm formation by the O104:H4 strains under the same conditions. p-values, when significant, are also shown for comparison of biofilm formation between individual strains with and without CO2.
Microorganisms 11 01744 g001
Figure 2. E. coli O104:H4 strains appear to grow in a novel cell culture medium but the E. coli O157:H7 strain does not. Live E. coli strains were examined for their ability to activate TLR2 or 4. The figure presents representative results from one of three studies we conducted with live bacterial strains after overnight incubation at 37 °C. (A) Bacterial strains and TLR control antigens were added in triplicate wells of HEK294 cells expressing TLR2 or 4 in an HBD cell culture medium overnight at 37 °C with 5% CO2 in 96-well plates. Note the color reaction difference between the E. coli O104:H4 strains and the ATCC 25922 and O157:H7 strains. (B) The figure shows the amount of TLR2 or 4 activation by live E. coli strains. The results are presented as geometric means with standard errors of the mean. p-values are also shown comparing the amount of TLR2 activated by E. coli O157:H7 to the amount of TLR2 activated by the other E. coli strains (in blue). The differences between the results of TLR4 activation by E. coli O157:H7 and the other strains were not significant. Statistical comparisons are also shown between the amount of TLR2 and 4 activation of the individual E. coli strains. (C) Reaction using live E. coli strains with HEK293 cells not expressing TLR2 or 4 (null cells). (D) Incubation of live E. coli strains in HBD cell culture medium or DMEM cell culture maintenance medium without HEK293 cells.
Microorganisms 11 01744 g002
Figure 3. Differential growth of E. coli O104:H4 and O157:H7 strains in HBD cell culture medium. Single colonies of the E. coli O104:H4 or O157:H7 (and ATCC 25922) strains from SBA plates were used to inoculate 2 mL of MH II broth and cultures were incubated overnight at 37 °C. Overnight E. coli cultures were used to inoculate 12.5 mL of HBD cell culture medium (0.25 mL inoculum) or 12 mL MH II broth (0.12 mL inoculum) in 125 mL flasks and cultures were incubated at 37 °C with shaking at 180 rpm. Growth was followed by an increase in absorbance at 600 nm. The figure presents representative results from one of three independent studies. (A) Growth of the E. coli strains in HBD cell culture medium followed for 48 h. (B) Appearance of the E. coli cultures in HBD cell culture medium after 48 h. (C) Growth of the E. coli strains in MH II broth after 7 h of incubation.
Microorganisms 11 01744 g003
Figure 4. Growth of E. coli O104:H4 strains in HBD cell culture medium starting with single colonies. A single colony from an overnight growth on SBA plates was used to inoculate 2 mL of HBD medium and cultures were incubated overnight at 37 °C with 5% CO2. The figure presents representative results from one of three independent studies. There were color differences between the E. coli O104:H4 strains and the ATCC 25922 and O157:H7 strains. This, along with the pH differences (pH ~5.0 vs. 8.5–9.0), reflected the growth of the E. coli O104:H4 strains. The purple color of the E. coli ATCC and O157:H7 cultures may have been derived from endogenous alkaline phosphatase that came from the original inoculum.
Microorganisms 11 01744 g004
Table 1. E. coli strains used in the present study.
Strains aSource/Clinical HistoryPhenotype/Genotype bReference
E. coli ATCC 25922Clinical isolate, Seattle, WA, 1946sorbitol (+), β-glucuronidase (+), tellurite (−), penicillin (r), ampicillin (s), streptomycin (s), motile (+), Congo Red (±), Stx2a (−)[58], this study
E. coli O157:H7Clinical isolate, 2000sorbitol (−), β-glucuronisase (−), tellurite (+), penicillin (r), ampicillin (s), streptomycin (s), motile (+), Congo Red (±), Stx2a (+)this study
E. coli O104:H4, 2011C 3493 (Ec 01)HUS in US 2011, traveled from Germany, May 2011sorbitol (+), β-glucuronisase (+), tellurite (+), penicillin (r), ampicillin (r), streptomycin (r), motile (+), Congo Red (+), Stx2a (+); stx1 (−), stx2 (+), eae (−), aatA (+), agg A (+), aggR (+)[59,60], this study
E. coli O104:H4, 2009EL 2050 (Ec 02)Bloody diarrhea, Republic of Georgia, 2009sorbitol (+), β-glucuronisase (+), tellurite (+), penicillin (r), ampicillin (r), streptomycin (r), motile (+), Congo Red (+), Stx2a (+); stx1 (−), stx 2 (+), eae (−), aatA (+), aggA (+), aggR (+)[59,60], this study
E. coli O104:H4, 2009EL 2071 (Ec 03)Bloody diarrhea, Republic of Georgia, 2009sorbitol (+), β-glucuronisase (+), tellurite (+), penicillin (r), ampicillin (r), streptomycin (r), motile (+), Congo Red (+), Stx2a (+); stx1 (−), stx2 (+), eae (−), aatA (+), aggA (+), aggR (+)[59,60], this study
a All strains were obtained from the Critical Reagent Program at USAMRIID. b Symbols: +, positive; ±, weak; −, negative; r, resistant; s, sensitive; Stx2a, Shiga toxin 2a; stx1, Shiga toxin 1; eae, intimin; aatA, virulence plasmid; aggA, pilin subunit of aggregative adherence fimbriae I (AAF/I); aggR, transcription regulator.
Disclaimer/Publisher’s Note: The statements, opinions and data contained in all publications are solely those of the individual author(s) and contributor(s) and not of MDPI and/or the editor(s). MDPI and/or the editor(s) disclaim responsibility for any injury to people or property resulting from any ideas, methods, instructions or products referred to in the content.

