Article

Improving Grapevine Heat Stress Resilience with Marine Plant Growth-Promoting Rhizobacteria Consortia

by
João Carreiras
1,2,*,
Ana Cruz-Silva
1,2,3,
Bruno Fonseca
1,2,
Ricardo C. Carvalho
1,
Jorge P. Cunha
4,
João Proença Pereira
2,3,
Catarina Paiva-Silva
2,3,
Soraia A. Santos
2,3,
Rodrigo Janeiro Sequeira
2,3,
Enrique Mateos-Naranjo
5,
Ignacio D. Rodríguez-Llorente
6,
Eloísa Pajuelo
6,
Susana Redondo-Gómez
5,
Ana Rita Matos
2,7,
Jennifer Mesa-Marín
5,
Andreia Figueiredo
2,3,7 and
Bernardo Duarte
1,7,*
1
MARE—Marine and Environmental Sciences Centre & ARNET–Aquatic Research Network Associated Laboratory, Faculdade de Ciências da Universidade de Lisboa, Campo Grande, 1749-016 Lisbon, Portugal
2
Plant Functional Genomics Group, Departamento de Biologia Vegetal, BioISI—Biosystems and Integrative Sciences Institute, Faculdade de Ciências da Universidade de Lisboa, Campo Grande, 1749-016 Lisboa, Portugal
3
Grapevine Pathogen Systems Lab, BioISI, Faculdade de Ciências da Universidade de Lisboa, Campo Grande, 1749-016 Lisbon, Portugal
4
Estação Vitivinícola Nacional, 2565-191 Dois Portos, Portugal
5
Department of Plant Biology and Ecology, Faculty of Biology, University of Seville, 41012 Seville, Spain
6
Department of Microbiology and Parasitology, Faculty of Pharmacy, University of Seville, 41012 Seville, Spain
7
Departamento de Biologia Vegetal, Faculdade de Ciências da Universidade de Lisboa, Campo Grande, 1749-016 Lisbon, Portugal
*
Authors to whom correspondence should be addressed.
Microorganisms 2023, 11(4), 856; https://doi.org/10.3390/microorganisms11040856
Submission received: 31 January 2023 / Revised: 15 March 2023 / Accepted: 25 March 2023 / Published: 27 March 2023
(This article belongs to the Special Issue Advances in Plant-Microbe Interactions)

Abstract

:
Amid climate change, heatwave events are expected to increase in frequency and severity. As a result, yield losses in viticulture due to heatwave stress have increased over the years. As one of the most important crops in the world, an eco-friendly stress mitigation strategy is greatly needed. The present work aims to evaluate the physiological fitness improvement by two marine plant growth-promoting rhizobacteria consortia in Vitis vinifera cv. Antão Vaz under heatwave conditions. To assess the potential biophysical and biochemical thermal stress feedback amelioration, photochemical traits, pigment and fatty acid profiles, and osmotic and oxidative stress biomarkers were analysed. Bioaugmented grapevines exposed to heatwave stress presented a significantly enhanced photoprotection capability and higher thermo-stability, exhibiting a significantly lower dissipation energy flux than the non-inoculated plants. Additionally, one of the rhizobacterial consortia tested improved light-harvesting capabilities by increasing reaction centre availability and preserving photosynthetic efficiency. Rhizobacteria inoculation expressed an osmoprotectant promotion, revealed by the lower osmolyte concentration while maintaining leaf turgidity. Improved antioxidant mechanisms and membrane stability resulted in lowered lipid peroxidation product formation when compared to non-inoculated plants. Although the consortia were found to differ significantly in their effectiveness, these findings demonstrate that bioaugmentation induced significant heatwave stress tolerance and mitigation. This study revealed the promising usage of marine PGPR consortia to promote plant fitness and minimize heatwave impacts in grapevines.

1. Introduction

Grapevines are one of the most economically important fruit crops in the world, with over 74.8 million tonnes of grapes produced worldwide in 2021 [1]. Climate change poses a significant threat to the viticulture industry, with rising temperatures leading to increased heat stress and consequently drought stress [2]. Temperature severely influences the grapevine’s main physiological processes, development, quality and productivity [3]. A 10 °C base temperature is required for the onset of the grapevine’s vegetative cycle; it is also known that if the high-temperature threshold peaks at critical points of development, negative impacts occur [4], namely on photosynthesis [5], berry size, sugar accumulation and ripening [6].
Due to climate change, the impact of high temperatures and heatwaves (HW) will likely be a major concern for winegrowers in the upcoming decades. A heatwave is defined by the World Meteorological Organization as a prolonged episode (5 days or longer) in which the daily maximum temperature is higher than the average maximum temperature by 5 °C [7]. High temperatures during heatwaves are usually accompanied by a decrease in soil moisture, leading to a decrease in plant water content [8]. It has been pointed out that these extreme weather events will be more frequent and with an increased duration in the next decades [9]. In 2019, three consecutive heatwave events occurred in Europe with temperatures reaching 44 °C in some regions during June [10]. Moreover, previous studies indicate that HW impacts vary among plant families [11,12]; they can be species-specific [13], depend on the plant’s life history [14] and vary from photochemical to biochemical [12,13] to alterations in plant gene expression [11]. Nowadays, viticulture is adjusting to this new reality through more effective management methodologies, such as irrigation, fruit size manipulation and variety selection, but these practices are not ideal and restrict the exploration of wine-growing varieties [15]. Thus, considering the economic and cultural importance of grapevines, it is of utmost importance to address the effects of these extreme events and to develop strategies to minimize their impacts.
Although agricultural systems often subject soil microbes to negative selection pressure, in the last few years new regenerative agriculture practices are being applied and awareness about the importance of microbial diversity is rising [16]. The potential of plant growth-promoting rhizobacteria (PGPR) is gaining attention for bolstering sustainable agriculture while ensuring agricultural productivity and for combating soil deterioration caused by the use of synthetic agrochemicals. PGPR–based solutions are environmental-friendly, as they are natural sources of renewable nutrients required for maintaining soil health and biology [17,18]. In fact, several strains have already been commercially used as efficient biofertilizers, while also appearing to be cost-effective [19]. Plant growth-promoting bacteria are microorganisms that have a positive impact on plant growth and development. These bacteria can enhance plant growth and stress tolerance through the production of phytohormones, such as indole acetic acid (IAA), cytokinin, abscisic acid and the reduction of ethylene [17,20,21]. Additionally, PGPR can also provide plants with abiotic stress resistance or tolerance and, although relatively unexplored, recent findings highlight heat stress amelioration and their promising practical applications [21,22]. Microbial fertilizers may combine different strains to promote multiple functions aiding plant growth-promoting activity; however, these solutions are not universal as different habitats and cultivation strategies largely influence specific PGPR communities [23]. Nevertheless, there is a need to identify new PGPR resources to cope with different challenges. Salt marshes are unique ecosystems that are exposed to high salinity and fluctuations in water levels, making them a potential source of PGPR with stress tolerance properties [24]. The bioaugmentation of plants with these marine PGPR has been shown to aid the plants in resisting and overcoming several abiotic challenges from nutrient deprivation [25] and osmotic stress [26,27], including thermal and extreme stress [28,29]. Moreover, a single strain microorganism usage does not allow the activation of all possible growth-promoting mechanisms; thus, in order to elicit all potential traits, the application of PGPR consortia is increasingly more common in agricultural practices and is of current interest in research [28,30].
In this study, compatible marine rhizobacteria isolated from salt marshes were selected to build two potentially effective PGPR consortia to allow for multiple simultaneous PGP property expressions. The first is composed of Pseudomonas composti, Bacillus zhangzhouensis and Pseudarthrobacter oxydans; the second is composed of Aeromonas aquariorum, Bacillus methylotrophicus and Bacillus aryabhattai. Bacterial strains were chosen for their great potential as bioinoculants and grouped for their different complementary activities and traits (as seen in Table 1 and references therein) with no conflicting effect between them. In the present study, we aim to evaluate the PGPR bioaugmentation impact on the physiological fitness of a Vitis vinifera heat susceptible cultivar, namely Antão Vaz [31], when exposed to HW simulation. This will be evaluated by addressing leaf thermography, photochemical performance, osmotic regulation mechanisms, pigment composition, antioxidant defences and fatty acid profiles, thus providing deeper insight into the mechanisms underlying PGPR stimulation of grapevine tolerance to HW stress.

2. Materials and Methods

2.1. Plant and Growing Conditions

Vitis vinifera cv. “Antão Vaz” in the rootstock 1103P wood cuttings were bought from the VitisOeste Nursery (Portugal). Plants were supplied without roots. All the sanitary conditions were assured. Grapevine wood cuttings were planted in pots containing soil from the INIAV Dois Portos vineyard (Colecção Ampelográfica Nacional, CAN). CAN is property of INIAV-Estação Vitivinícola Nacional (Dois Portos), located at Quinta da Almoinha, 60 km north of Lisbon (9°11′19″ W; 39°02′31″ N; 75 m above sea level). The soil from the ampelographic field vineyard was characterized by a high percentage of clay (40.6%), a of pH 8.3, low organic matter (1.25%) and suitable nutrient content. It was chosen to mimic to the extent possible the grapevine environment in realistic cultivation schemes [32]. Wood cuttings (40 cm with an average of three nodes) were then grown under greenhouse conditions, i.e., a natural day/night rhythm with temperatures of 25 °C day/21 °C night, according to previously optimized conditions [33]. Plants were kept under these conditions for three months to acclimate to the new environment and allow for root and leaf biomass development.

2.2. Rhizobacteria Used for Inoculation in This Study

Plant growth-promoting bacterial consortia (Table 1) used in this experiment were made with rhizobacteria that were isolated, identified and described in previous studies. Bacteria isolates were obtained from different halophytes inhabiting southwestern Spain coastal salt marshes: P. composti SDT3 and A. aquariorum SDT13 were collected from Spartina densiflora rhizosphere at Tinto estuary (37°13′ N 6°54′ W); B. methylotrophicus SMT38 and B. aryabhattai SMT48 from Spartina maritima rhizosphere at Odiel estuary (37°13′ N 6°57′ W); B. zhangzhouensis HPJ40 and P. oxydans SRT15 were isolated from Halimione portulacoides and Salicornia ramosissima rhizospheres, respectively, at Piedras estuary (37°16′ N 7°09′ W).
Table 1. Consortia design and plant growth-promoting rhizobacterial (PGPR) trait summary.
Consortium NumberBacterial StrainsBiofilm Production P-Solubilization (mm halo)Siderophore Production (mm halo)ACC Deaminase (µmoles α-cetog/h/mg Protein)IAA Production (mg/mL)N-FixationReference
C1Pseudomonas composti SDT3+32[34]
Bacillus zhangzhouensis HPJ40+1115+[35]
Pseudarthrobacter oxydans SRT15920.99+
C2Aeromonas aquariorum SDT13+153.40[34]
Bacillus methylotrophicus SMT38+10+[36]
Bacillus aryabhattai SMT482.573.25+
+ positive; − negative.

2.3. Preparation of Bacterial Inoculants

To prepare the six suspensions for root inoculation, rhizobacteria were grown separately in 250 mL Erlenmeyer flasks containing 50 mL of tryptic soy broth (TSB) medium in a rotary shaker (150 rpm, 30 °C) for 24 h. The cultures were then centrifugated in 50 mL sterile Falcon tubes at 5000× g for 10 min at room temperature, and the supernatant was discarded. Pellets were washed twice with sterile physiological saline solution (NaCl 0.9% w/v) (by resuspension and centrifugation) and adjusted to a final concentration of 108 CFU mL−1 (OD600 = 1) for each bacteria [35]. Bacterial suspensions were then adequately mixed in equal amounts to produce the two final inoculant suspensions. To assess the potential incompatibility effects of the bacteria species, isolates were plated together in a solid agar TSB medium, and their growth halo diameter was compared with the growth halo of each species when plated individually. No significant differences were observed between the co-cultures and the monocultures, indicating no incompatibility between the bacteria.

2.4. Experimental Setup and Root Inoculation

Following the acclimation period, plants were divided into three groups for root inoculation. Each pot of the inoculated groups was watered with 50 mL of the respective and above-mentioned consortia solution and diluted with distilled water to achieve a concentration of 107 CFU mL−1. Each pot in the non-inoculated group was watered with 50 mL of distilled water. This procedure was completed three times: 45, 15 and 7 days before the experiment started. After inoculation, V. vinifera individuals from each group were divided and exposed to two thermal treatments: control (25/21 °C day/night) and heatwave treatment (42/38 °C day/night) for 5 days, as seen in the experimental design (Figure 1). All treatments consisted of 5 replicate plants. Heatwave simulation was performed following a widely used and established definition found in the literature [37,38] and, as employed in previous studies [11,14], in controlled-environment chambers (Aralab/Fitoclima 18.000 EH, Lisbon, Portugal) with a light intensity of 300 μmol m−2 s−1, 70 ± 5% relative humidity and watered every two days with distilled water.
Following the end of the trials, infrared thermography and chlorophyll fluorescence measurements were performed; consecutively, the plants were harvested. Leaf samples for biochemical measurements were immediately flash-frozen in liquid-N2 and stored at −80 °C until analysis.

2.5. Leaf Infrared Thermography

At the end of the exposure trials, thermal images were obtained with a FLIR E50bx infrared camera (FLIR Systems, Inc., Wilsonville, OR, USA), producing images of 320 × 240 resolution with an accuracy of ±0.045 °C. Ten leaves were randomly selected from plants of both treatments; a water container at room temperature was kept near the leaves as a reference. The average temperature of each leaf was calculated on each image. All image processing and analysis were performed in FLIR Tools software (version 6.4.18039.1003, FLIR Systems Inc., Wilsonville, OR, USA).

2.6. Imaging Pulse Amplitude Modulated Fluorometry (iPAM)

After infrared thermography, imaging pulse amplitude modulated (iPAM) chlorophyll fluorescence measurements were performed using a customized open FluorCam imaging system (FC 800-D/3535-FAST; Photo System Instruments, Brno, Czech Republic) on 30 min dark-adapted plants. In addition, the OJIP transient (or Kautsky curves) measurements were performed to evaluate the plant’s photochemical apparatus functioning through the chlorophyll fluorescence induction kinetics of the PS II. This was achieved by irradiating a dark-adapted plant with a saturating light intensity of 3500 µmol m−2 s−1, leading to the production of a polyphasic rise in fluorescence (OJIP). Level O represents all the open reaction centres at the onset of illumination with no reduction of Quinone A (QA) (fluorescence intensity lasts for 10 ms). The O to J transient indicates the net photochemical reduction of QA (the stable primary electron acceptor of PS II) to QA (lasts for 2 ms). The J to I transition is due to all reduced states of closed RCs such as QA QB, QA QB2− and QA QB H2 (lasts for 2–30 ms). The P-step coincides with a maximum concentration of QA QB2 with the plastoquinol pool maximally reduced; it also reflects a balance between the light incident at the PS II side and the rate of utilization of the chemical (potential) energy, as well as the rate of heat dissipation. Supplementary Table S1 summarizes all the parameters calculated from the fluorometric analysis [39].

2.7. Pigment Profiling

Samples from the differently treated test groups were weighted before (FW) and after (DW) freeze-drying; these data were used to calculate the leaf water content as follows:
W C ( % ) = ( F W D W ) F W
Freeze-dried leaves (approximately 200 mg) were extracted with 6 mL pure acetone, subjected to a 2 min ultra-sound bath to ensure complete cell disruption and extracted in the dark at −20 °C for 24 h. After extraction, samples were centrifuged at 4.000× g for 15 min at 4 °C. The supernatants were scanned from 350 nm to 750 nm in 1 nm steps using a Shimadzu UV/VIS UV1601 dual-beam spectrophotometer (Shimadzu Corporation, Kyoto Japan). The sample absorbance spectra were analysed employing the Gauss peak spectra (GPS) method fitting library, using SigmaPlot Systat 13.2 Software (Systat Software Inc., San Jose, CA, USA) [40]. This method allowed pigment recognition and quantification from the sample absorbance spectrum, ascertaining the leaf pigment profile, chlorophyll a, chlorophyll b, auroxanthin, antheraxanthin, β-carotene, lutein, violaxanthin and zeaxanthin. For a better evaluation of the light-harvesting and photoprotection mechanisms, the de-epoxidation state (DES) was calculated as follows:
D E S = ( A n t h e r a x a n t h i n + Z e a x a n t h i n ) ( V i o l a x a n t h i n + A n t h e r a x a n t h i n + Z e a x a n t h i n )

2.8. Proline Content

Leaf proline content was assessed according to [41]. Plant material was homogenized in sulfosalicylic acid 3% (w/v). After extraction, samples were centrifuged at 10,000 rpm for 15 min at 4 °C. The supernatant (2 mL) was added with 2 mL glacial acetic acid and 2 mL acid ninhydrin and incubated for 1 h at 100 °C in a dry bath; after this, the reaction was stopped in an ice bath. After cooling, 4 mL of toluene was added to the reaction mixture and vortexed to ensure the complete mixing of the organic and aqueous phases. The absorbance of the organic phase was analysed at 520 nm and compared with a standard curve of proline and expressed in µmol g−1 FW.

2.9. Oxidative Stress Biomarkers

Enzyme extracts were produced by grinding a 250 mg leaf sample with 4 mL of a 50 mM sodium phosphate buffer (pH 7.6) supplemented with 0.1 mM Na-EDTA at 4 °C [42]. The produced homogenate was centrifuged at 8890× g for 20 min at 4 °C, and the supernatant was maintained on ice for enzymatic and protein analysis.
The enzyme activity measurements of catalase (CAT, EC.1.11.1.6.), ascorbate peroxidase (APx, E.C. 1.11.1.11), guaiacol peroxidase (GPX, E.C. 1.11.1.7) and superoxide dismutase (SOD, E.C. 1.15.1.1) were performed in a dual-beam spectrophotometer (Shimadzu UV/VIS UV1601 Spectrophotometer) using quartz cuvettes. According to [43], catalase activity was assayed through the evaluation of H2O2 consumption by an absorbance decline at 240 nm (ε = 39.4 mM−1 cm−1). Ascorbate peroxidase activity was analysed according to [42] by monitoring the ascorbate oxidation, using the absorbance decline at 290 nm (ε = 2.8 mM−1 cm−1). Guaiacol peroxidase measurement was performed according to [44] by monitoring the absorbance rise at 470 nm corresponding to the generation of guaiacol oxidation products (ε = 26.6 mM−1 cm−1). Superoxide dismutase activity was measured according to [45] by calculating the oxidation rate of pyrogallol using the absorbance at 325 nm. Protein quantification was performed according to [46]. Lastly, an oxidative ratio was calculated considering the intricate reactions occurring between SOD and the peroxidase enzymes. The oxidative ratio can reflect the balance between this hydrogen peroxide production and consumption and was calculated according to the following equation:
O x i d a t i v e   r a t i o = S O D C A T + A P x + G P x
Membrane lipid peroxidation in plant samples was evaluated through the quantification of thiobarbituric acid reactive substances (TBARS) according to [47]. Samples (100 mg) were homogenized in a 2 mL solution of fresh 0.5% (w/v) thiobarbituric acid (TBA) and 20% (w/v) trichloroacetic acid (TCA) solution and extracted for 30 min at 95 °C in a dry bath. After this period, the reaction was stopped on ice, and samples were centrifuged at 4.000× g for 5 min at 4 °C. The absorbance of the supernatant was read at 532 nm and 600 nm in a Shimadzu UV/VIS UV1601 spectrophotometer. Sample TBARS concentration was calculated according to the following equation, using the malondialdehyde (MDA) molar extinction coefficient (ε = 155 mM−1 cm−1):
A 532 n m A 600 n m = M D A   m M × ε M D A

2.10. Fatty Acid Profiles

Plant sample fatty acid analysis was performed according to [48] by direct trans-esterification of the leaf samples in freshly prepared methanol sulfuric acid (97.5:2.5, v/v) for 1 h at 70 °C. As an internal standard, heptadecanoic acid (C17:0) was added to the extraction medium. Fatty acid methyl esters (FAMEs) were recovered using petroleum ether, dried under an N2 stream and re-suspended in hexane. Reconstituted FAMEs were analysed through gas chromatography (Varian 430-GC gas chromatograph, Varian Inc., Palo Alto, CA, USA), equipped with a hydrogen flame ionization detector set at 300 °C, by injecting 1 µL of the FAME solution (injector temperature = 270 °C; split ratio = 50). FAMEs were separated using a fused-silica capillary column (50 m × 0.25 mm; WCOT Fused Silica, CP-Sil 88 for FAME; Varian), maintained at a constant nitrogen flow of 2 mL min−1 and the column oven set to 190 °C. Fatty acid identification was performed by comparison of retention times with standards (Sigma-Aldrich) and chromatograms analysed by the peak surface method using the Galaxy software. To determine membrane saturation levels, the double bond index (DBI) was calculated according to the following equation:
D B I = 2 × % m o n o e n e s + 2 × % d i e n e s + 3 × % t r i e n e s + 4 × % t e t r a e n e s + 5 × % p e n t a e n e s 100

2.11. Statistical Analysis

Boxplots with probability density of the data at different values smoothed by a kernel density estimator were computed and plotted using the ggplot2 package in R-Studio Version 1.4.1717 (RStudio Inc., Boston, MA, USA). Non-parametric Kruskal–Wallis with Bonferroni post hoc tests for variable comparison between inoculation and thermal treatments were performed in R-Studio Version 1.4.1717 using the agricolae package [49]. Canonical analysis of principal coordinates (CAP) was used to evaluate the ability to classify individuals successfully according to the thermal and inoculation treatments applied using each of the considered biochemical and biophysical traits, utilizing Primer 6 software (Primer-E Ltd., Devon, UK) [50].

3. Results

3.1. Thermography

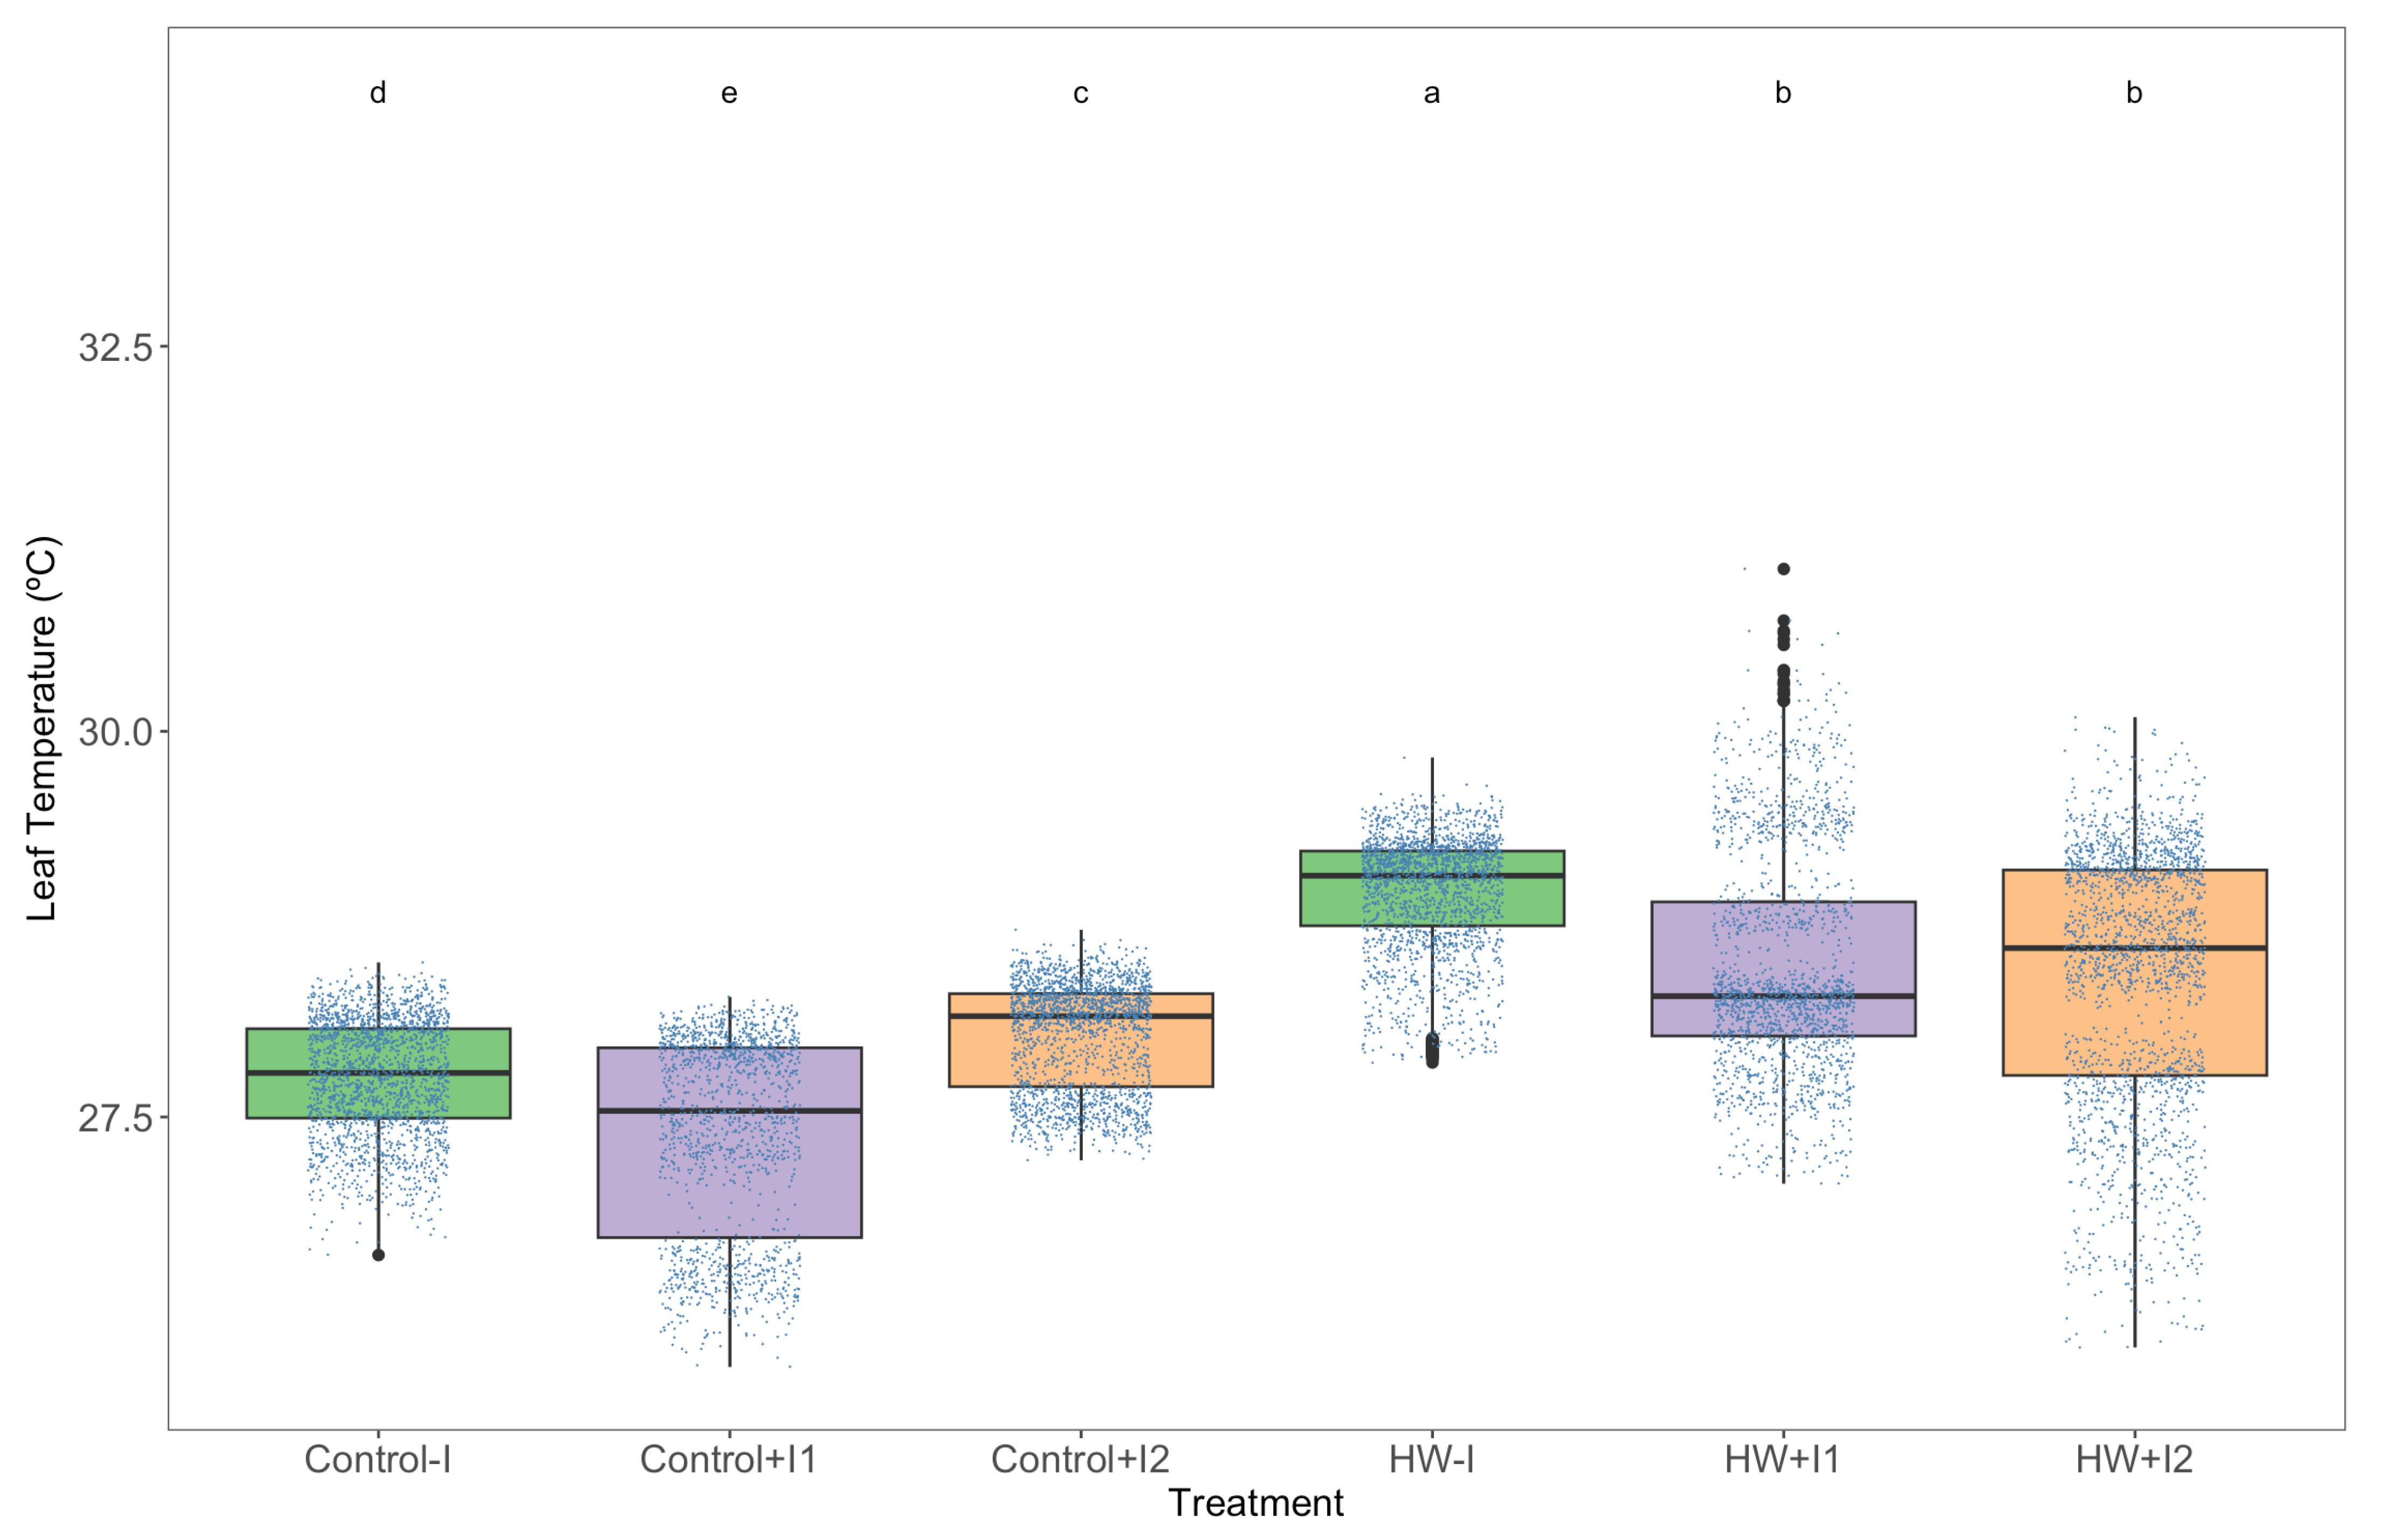
Grapevine exposure to the heatwave significantly increased their leaves’ surface temperature (Figure 2). Nonetheless, infrared thermography measurements showed significant variation within thermal conditions as well. Compared to the control non-inoculated plants, C1- and C2-inoculated plants exhibited significantly lower and higher leaf temperatures, respectively. At the same time, the HW-exposed plants’ leaf temperature increase was less pronounced in the leaves of the PGPR-inoculated plants.

3.2. Photochemical Processes

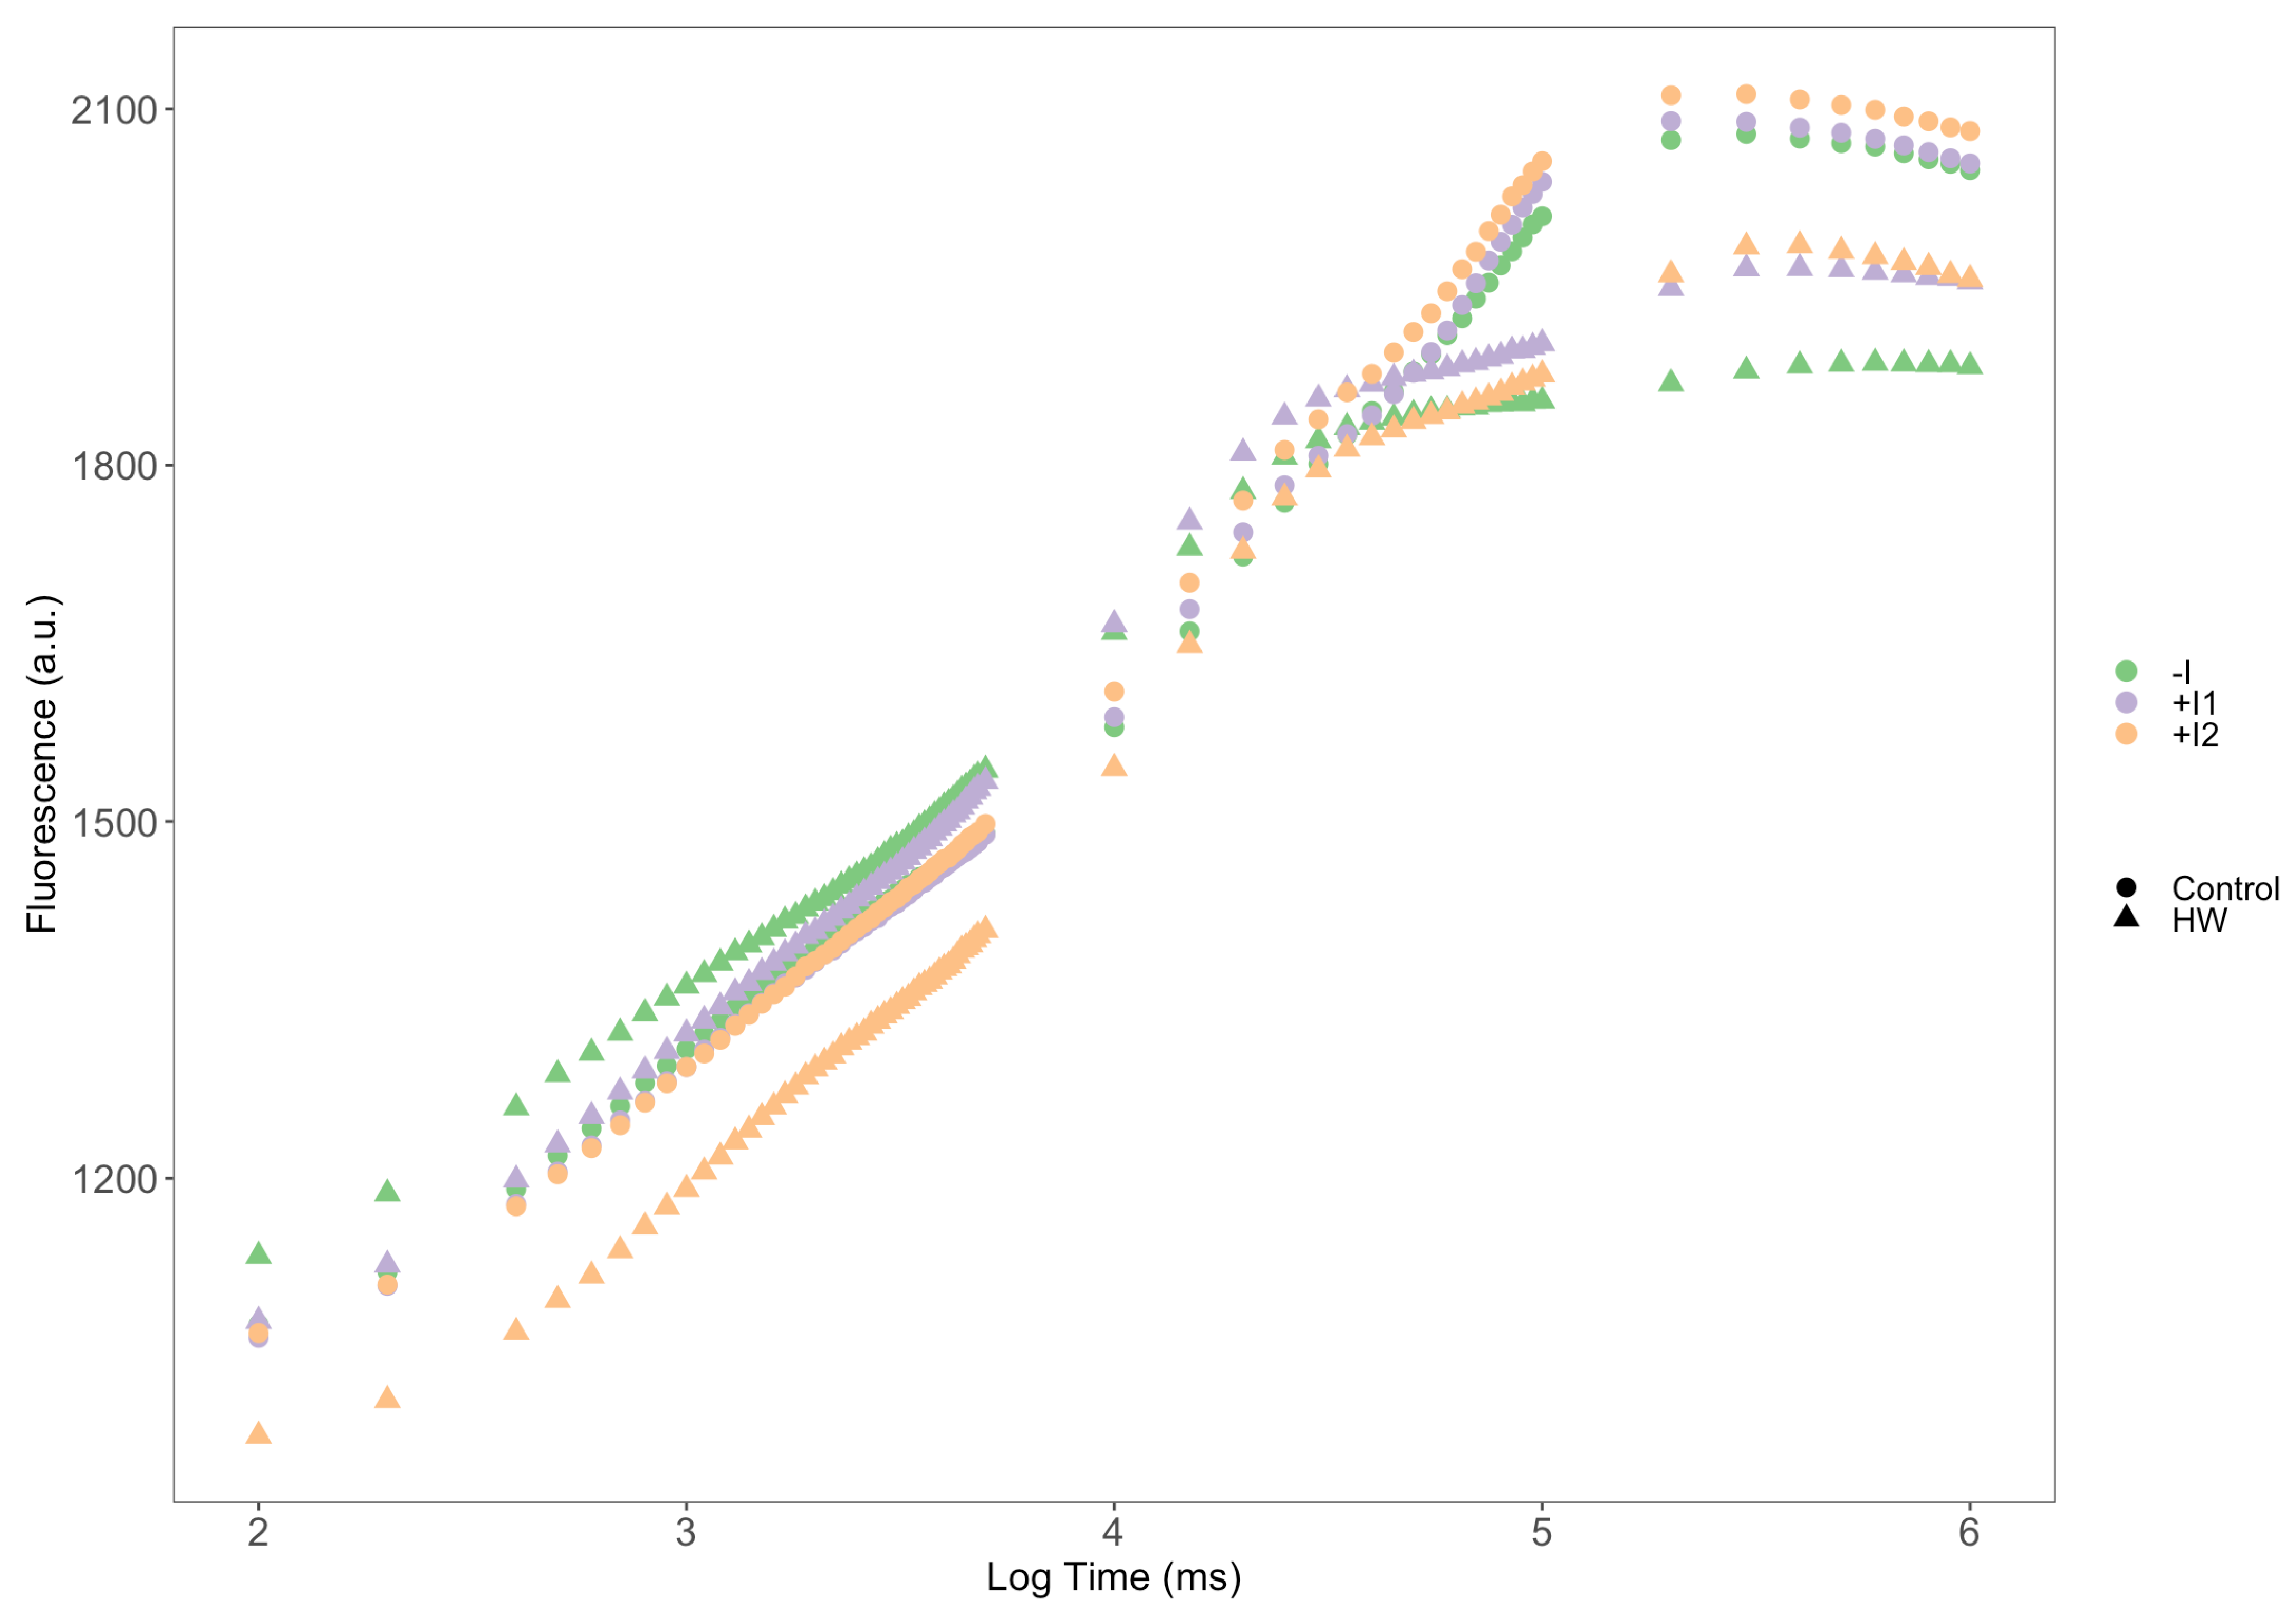
The Kautsky plots (Figure 3) from the in vivo iPAM fluorometric analysis showed a contrast between the thermal treatments’ observable fluorescence induction curves. Plants exposed to control temperature from all three groups presented very similar and high fluorescence levels with typical inflection points of standard OJIP curves. In comparison, lower fluorescence values were evidenced in the HW-exposed plants. Within the HW-treated groups, a higher relative fluorescence variation was seen, evident in the K-step (300 ms) dissociation, observably higher in the non-inoculated plants and lower in the C2-inoculated plants. Non-inoculated plants presented lower maximum fluorescence.
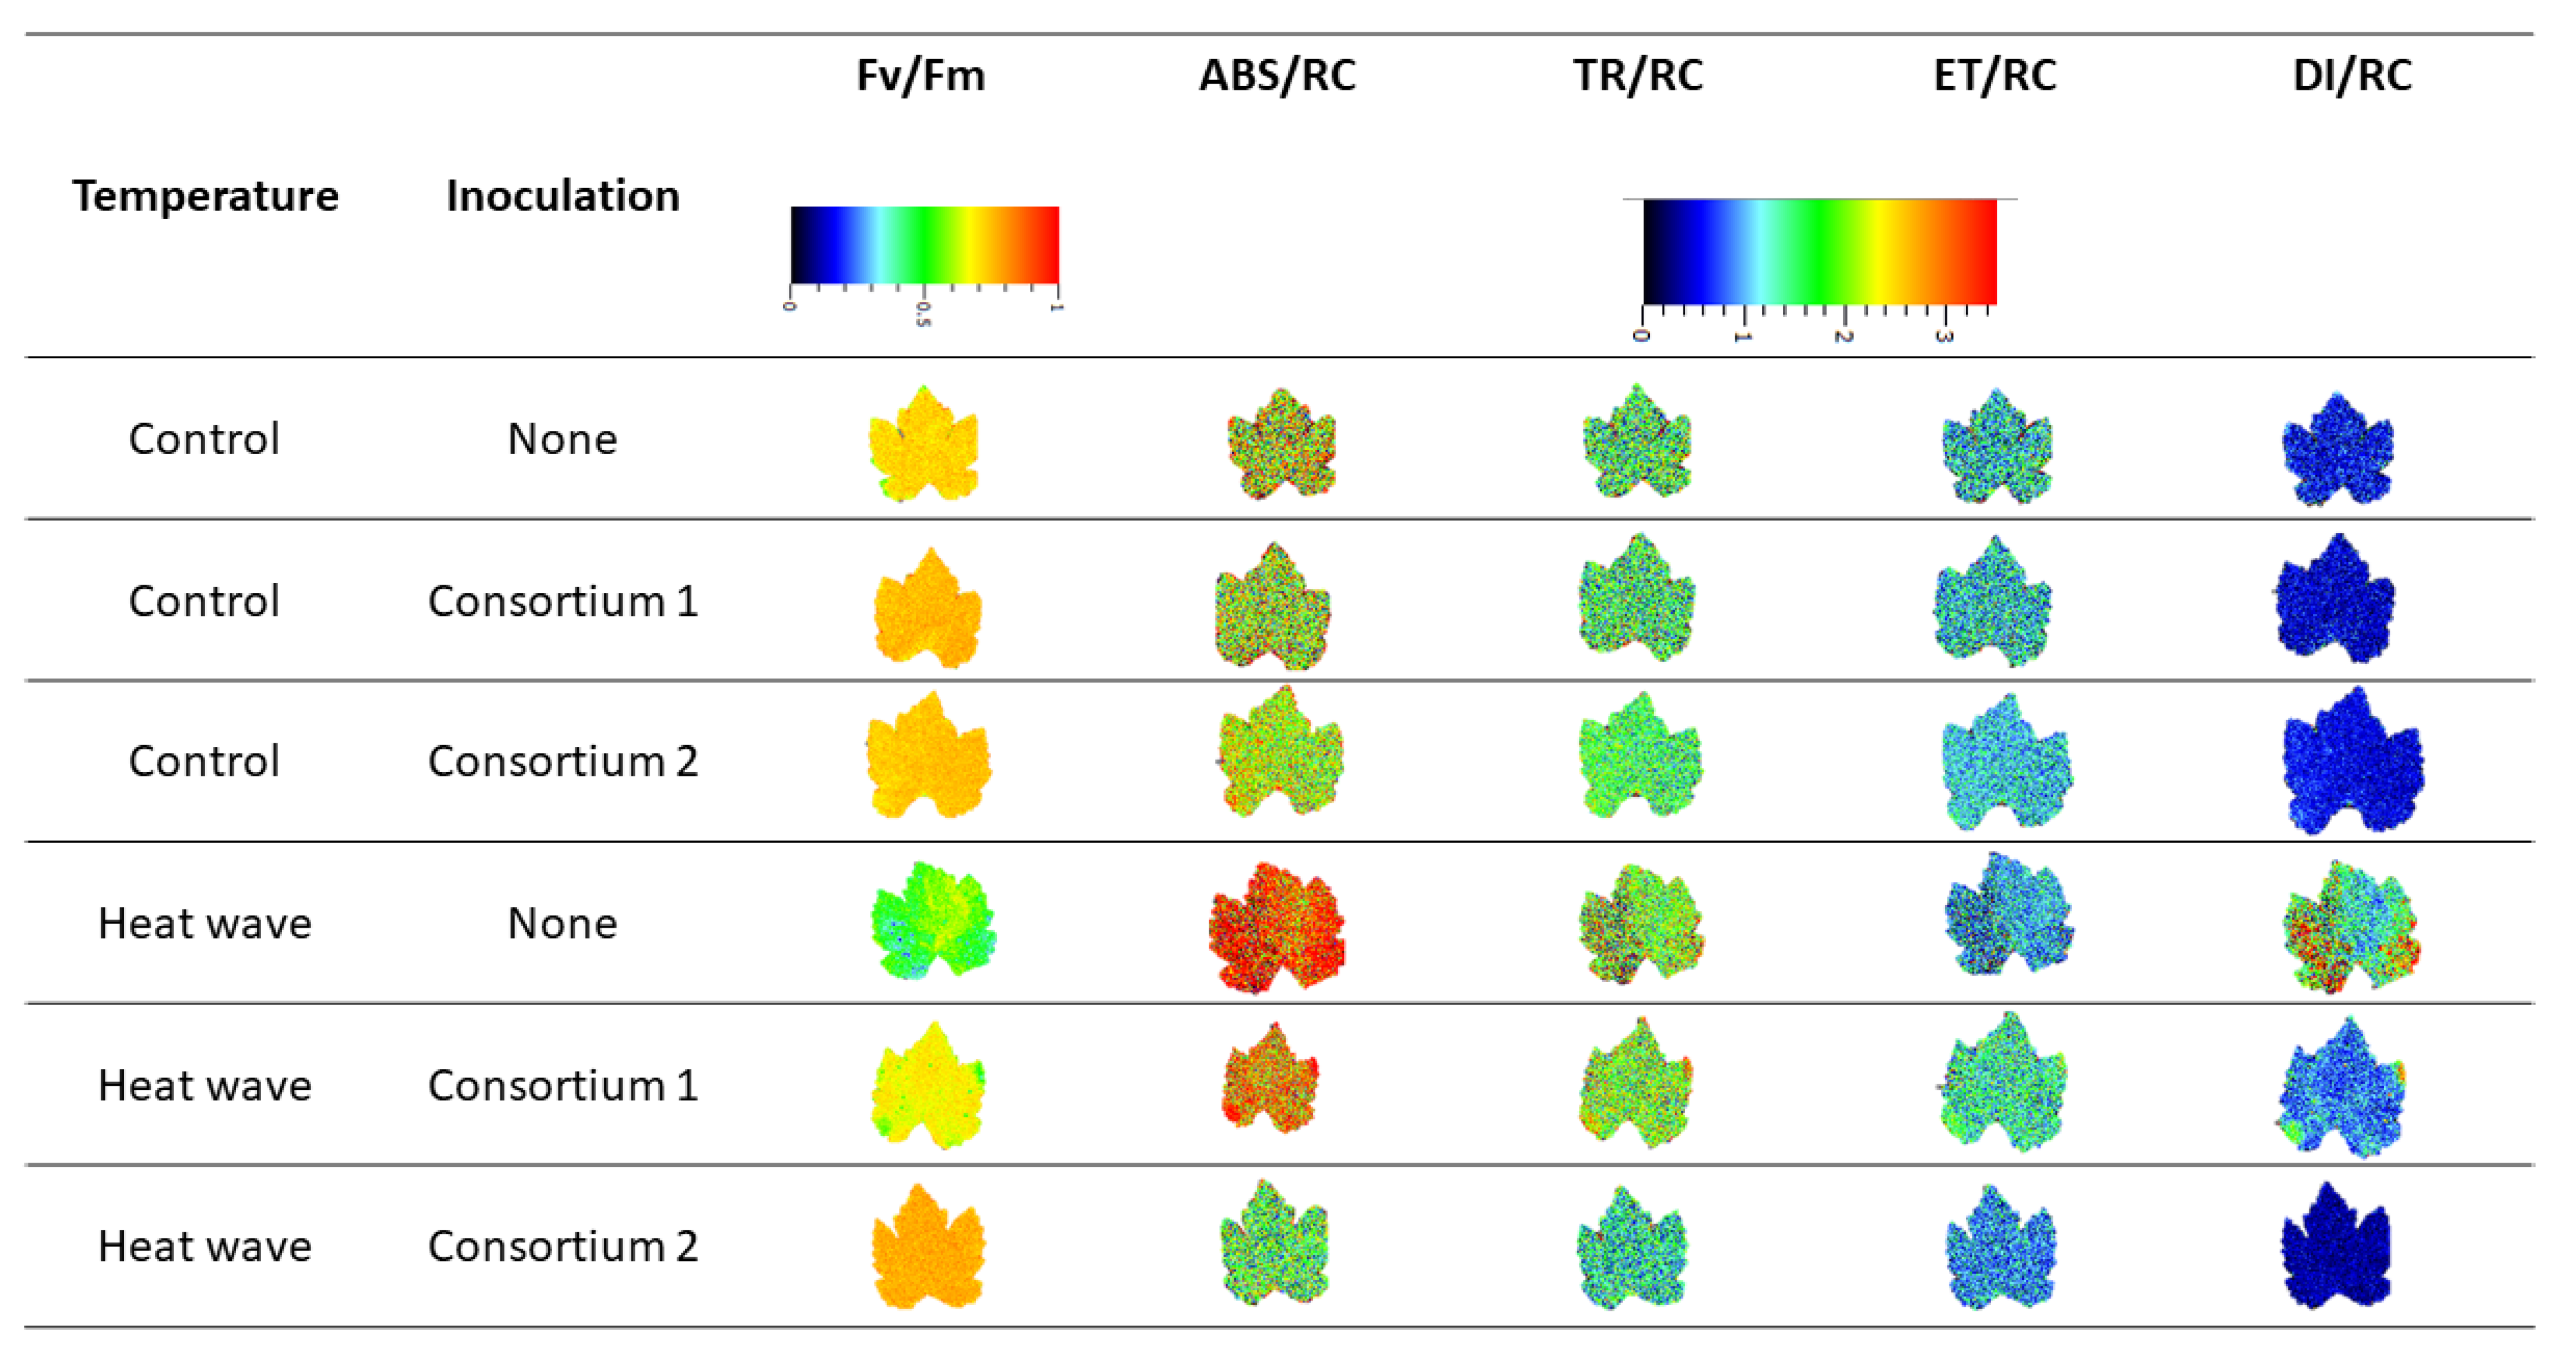
The fluorescence images obtained from the dark-adapted leaves of tested plants can reveal the PGPR implication in the experimental heatwave event (Figure 4). Under normal temperature conditions, the observed parameters were shown to be relatively similar between the different plant groups. However, under heatwave treatment, differences were exacerbated between plant inoculation treatments. When compared to control condition grapevines, HW-exposure was found to be lower in PS II quantum yield (Fv/Fm) and higher in the dissipated (DI0/RC) and absorbed (ABS/RC) energy fluxes in both non-inoculated and, less so, in C1-inoculated individuals. In overall imaging PAM-derived parameters, C2-inoculated plants under heatwave treatment appeared identical to their control counterpart.
Analysing the extracted OJIP parameters, several significant variations were detected in the PS II and PS I photochemical traits among thermal treatments and between PGPR-treated plants. The non-inoculated plants’ photosystem II quantum yield (Fv/Fm; Figure 5A) and PS I efficiency in reducing electron acceptors (δR0; Figure 5G) were significantly lower in HW conditions than at normal temperature conditions. In comparison, no significant differences between both PGPR-inoculated groups could be found. Nonetheless, C2-inoculated plants exhibited significantly higher values of both these parameters within heatwave conditions. Similarly, the reverse pattern was observed in the K-band amplitude, the net rate of PS II reaction centre closure (M0), the energy needed to close all reaction centres (SM) and the total number of electrons transferred into the electron transport chain (N) (Figure 5B,C,E,F). Non-inoculated plants exposed to heatwave simulation presented significantly higher values in these parameters (M0, SM and N) than their control counterpart, whereas C2-inoculated exhibited a significantly lower K-band amplitude. In contrast, C1-inoculated plants did not show any significant difference between thermal conditions. The size of the oxidized quinone pool (QOP, Figure 5D) was significantly lower in C2-bioaugmented plants under heat stress than at control conditions. The photosystem I efficiency in reducing electron acceptors (δR0, Figure 5H) showed a significant reduction in all HW-exposed groups, when compared to the corresponding control; this was more significant in the non-inoculated and lower in C2-inoculated individuals. Furthermore, in HW conditions, the equilibrium constant of the redox reactions between PS II and PS (Figure 5I) was observed to be significantly lower in the non-inoculated and C1-inoculated plants than in their control counterparts. However, C2-inoculated grapevines maintained this parameter at control levels.
The statistical analysis of the reaction centre-based energy fluxes revealed a significant impact from rhizobacteria inoculation and marked trends in the heatwave conditions, as previously observed (Figure 3). Compared to the control, energy flux differences in heatwave conditions were noted in all tested groups. Heatwave-exposed non-inoculated plants presented significantly higher absorbed (ABS/RC; Figure 6A), trapped (TR/RC; Figure 6B) and dissipated (DI/RC; Figure 6D) energy fluxes. C1-inoculated plants also followed the same trend, yet variation was non-significant. In addition, inoculated plants exhibited a reduction in their electron transport energy flux (ET/RC; Figure 6C) following HW exposure. Reaction centre II density within the antenna chlorophyll bed of PS II (RC/ABS; Figure 6E) was found to be significantly higher in the C2-inoculated plants under heatwave treatment when compared to the remaining heatwave exposed groups. Heatwave exposure resulted in significantly lower performance index (PI, Figure 6F) and structural and functional index (SFI, Figure 6G) values in non-inoculated plants, whereas bioaugmented plants showed similar values to the corresponding control. As expected, a mirror image of SFI was found in the dissipation structural and functional index (SFINPQ, Figure 6H). It is noteworthy that HW-exposed non-inoculated and C2-inoculated plants revealed significant differences between them in all these parameters.

3.3. Leaf Pigment Profile

Observing grapevine leaf pigment concentrations and ratios (Table 2) at control temperature, no significant differences between groups were detected. Heatwave-exposed groups showed a higher Chl a, chlorophyll b (Chl b), total chlorophyll (TChl), total carotenoid (Tcarot) and zeaxanthin (Zea) than their corresponding control; this was significant in C1-inoculated plants. The pheophytin a (Pheo a), β-carotenoids (βcarot), antheraxanthin (Anthe) and lutein concentrations, were not seen to differ with temperature or inoculation treatments. The de-epoxidation state (DES) did not reveal any impact from temperature or inoculation treatments. The chlorophyll a/b ratio (Chl a/b), in HW-exposed C1-inoculated plants was shown to be lower than its corresponding control group. Similarly, the total carotenoid to total chlorophyll (TCar/TChl) ratio was found to be significantly lower in heatwave-treated C2-inoculated plants. Additionally, no significant differences were observed in the chlorophyll degradation index (CDI).

3.4. Water and Proline Quantification

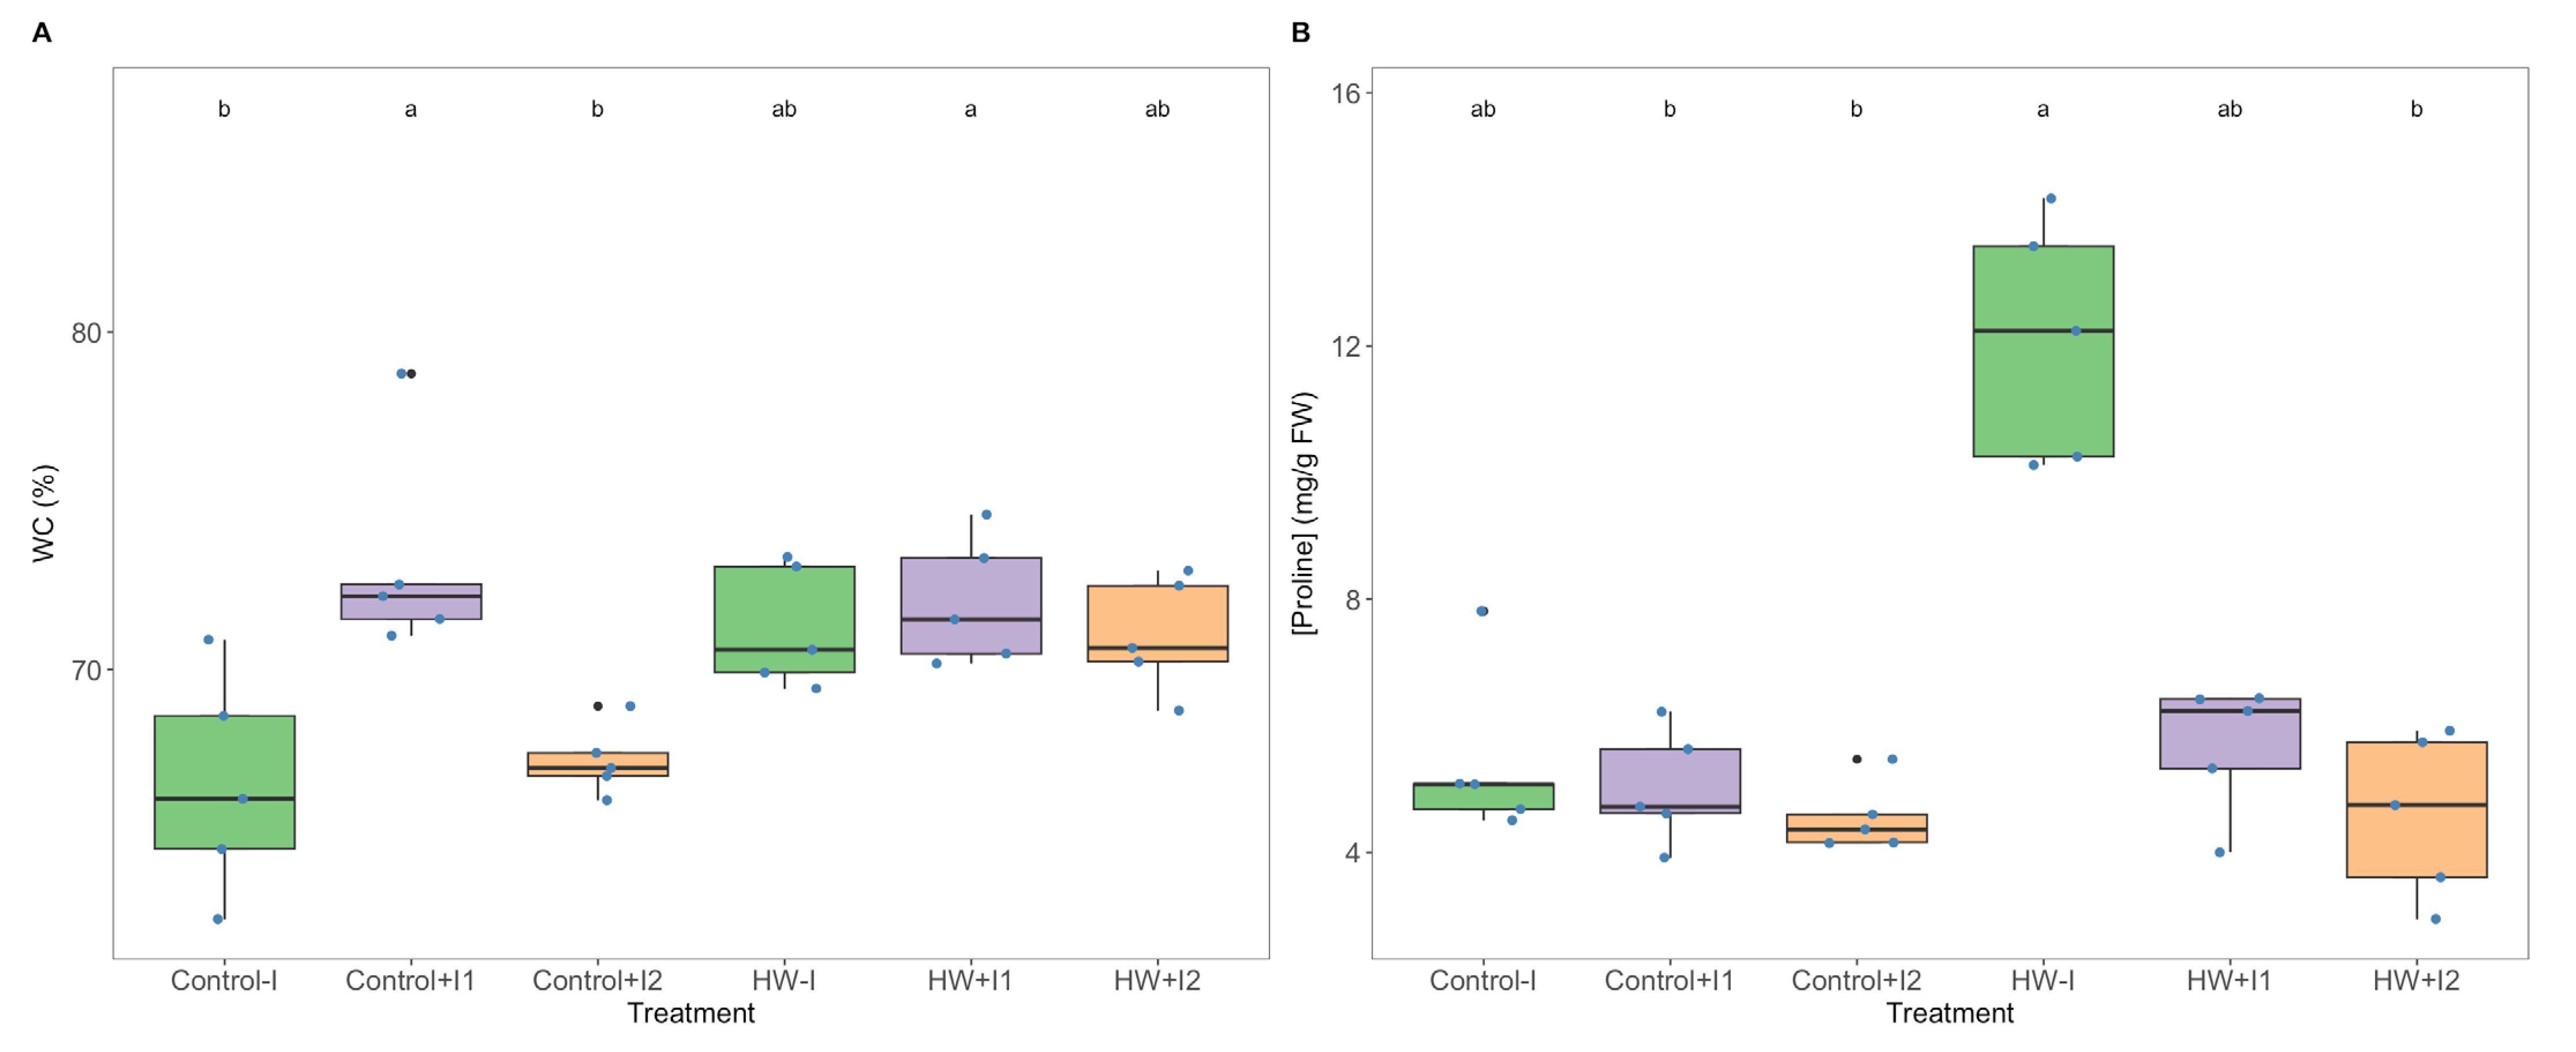
Grapevine leaf water content (WC; Figure 7A) showed no significant differences between the thermal treatments. However, at control conditions, WC was found to be significantly higher in the C1-inoculated plants. Proline content (Figure 7B) in both PGPR- bioaugmented groups under heat stress showed values similar to those observed in the corresponding control. Additionally, at heatwave conditions, non-inoculated grapevines exhibited a higher proline concentration; this difference is significant when compared to C2-inoculated plants.

3.5. Antioxidant Enzymatic Activities

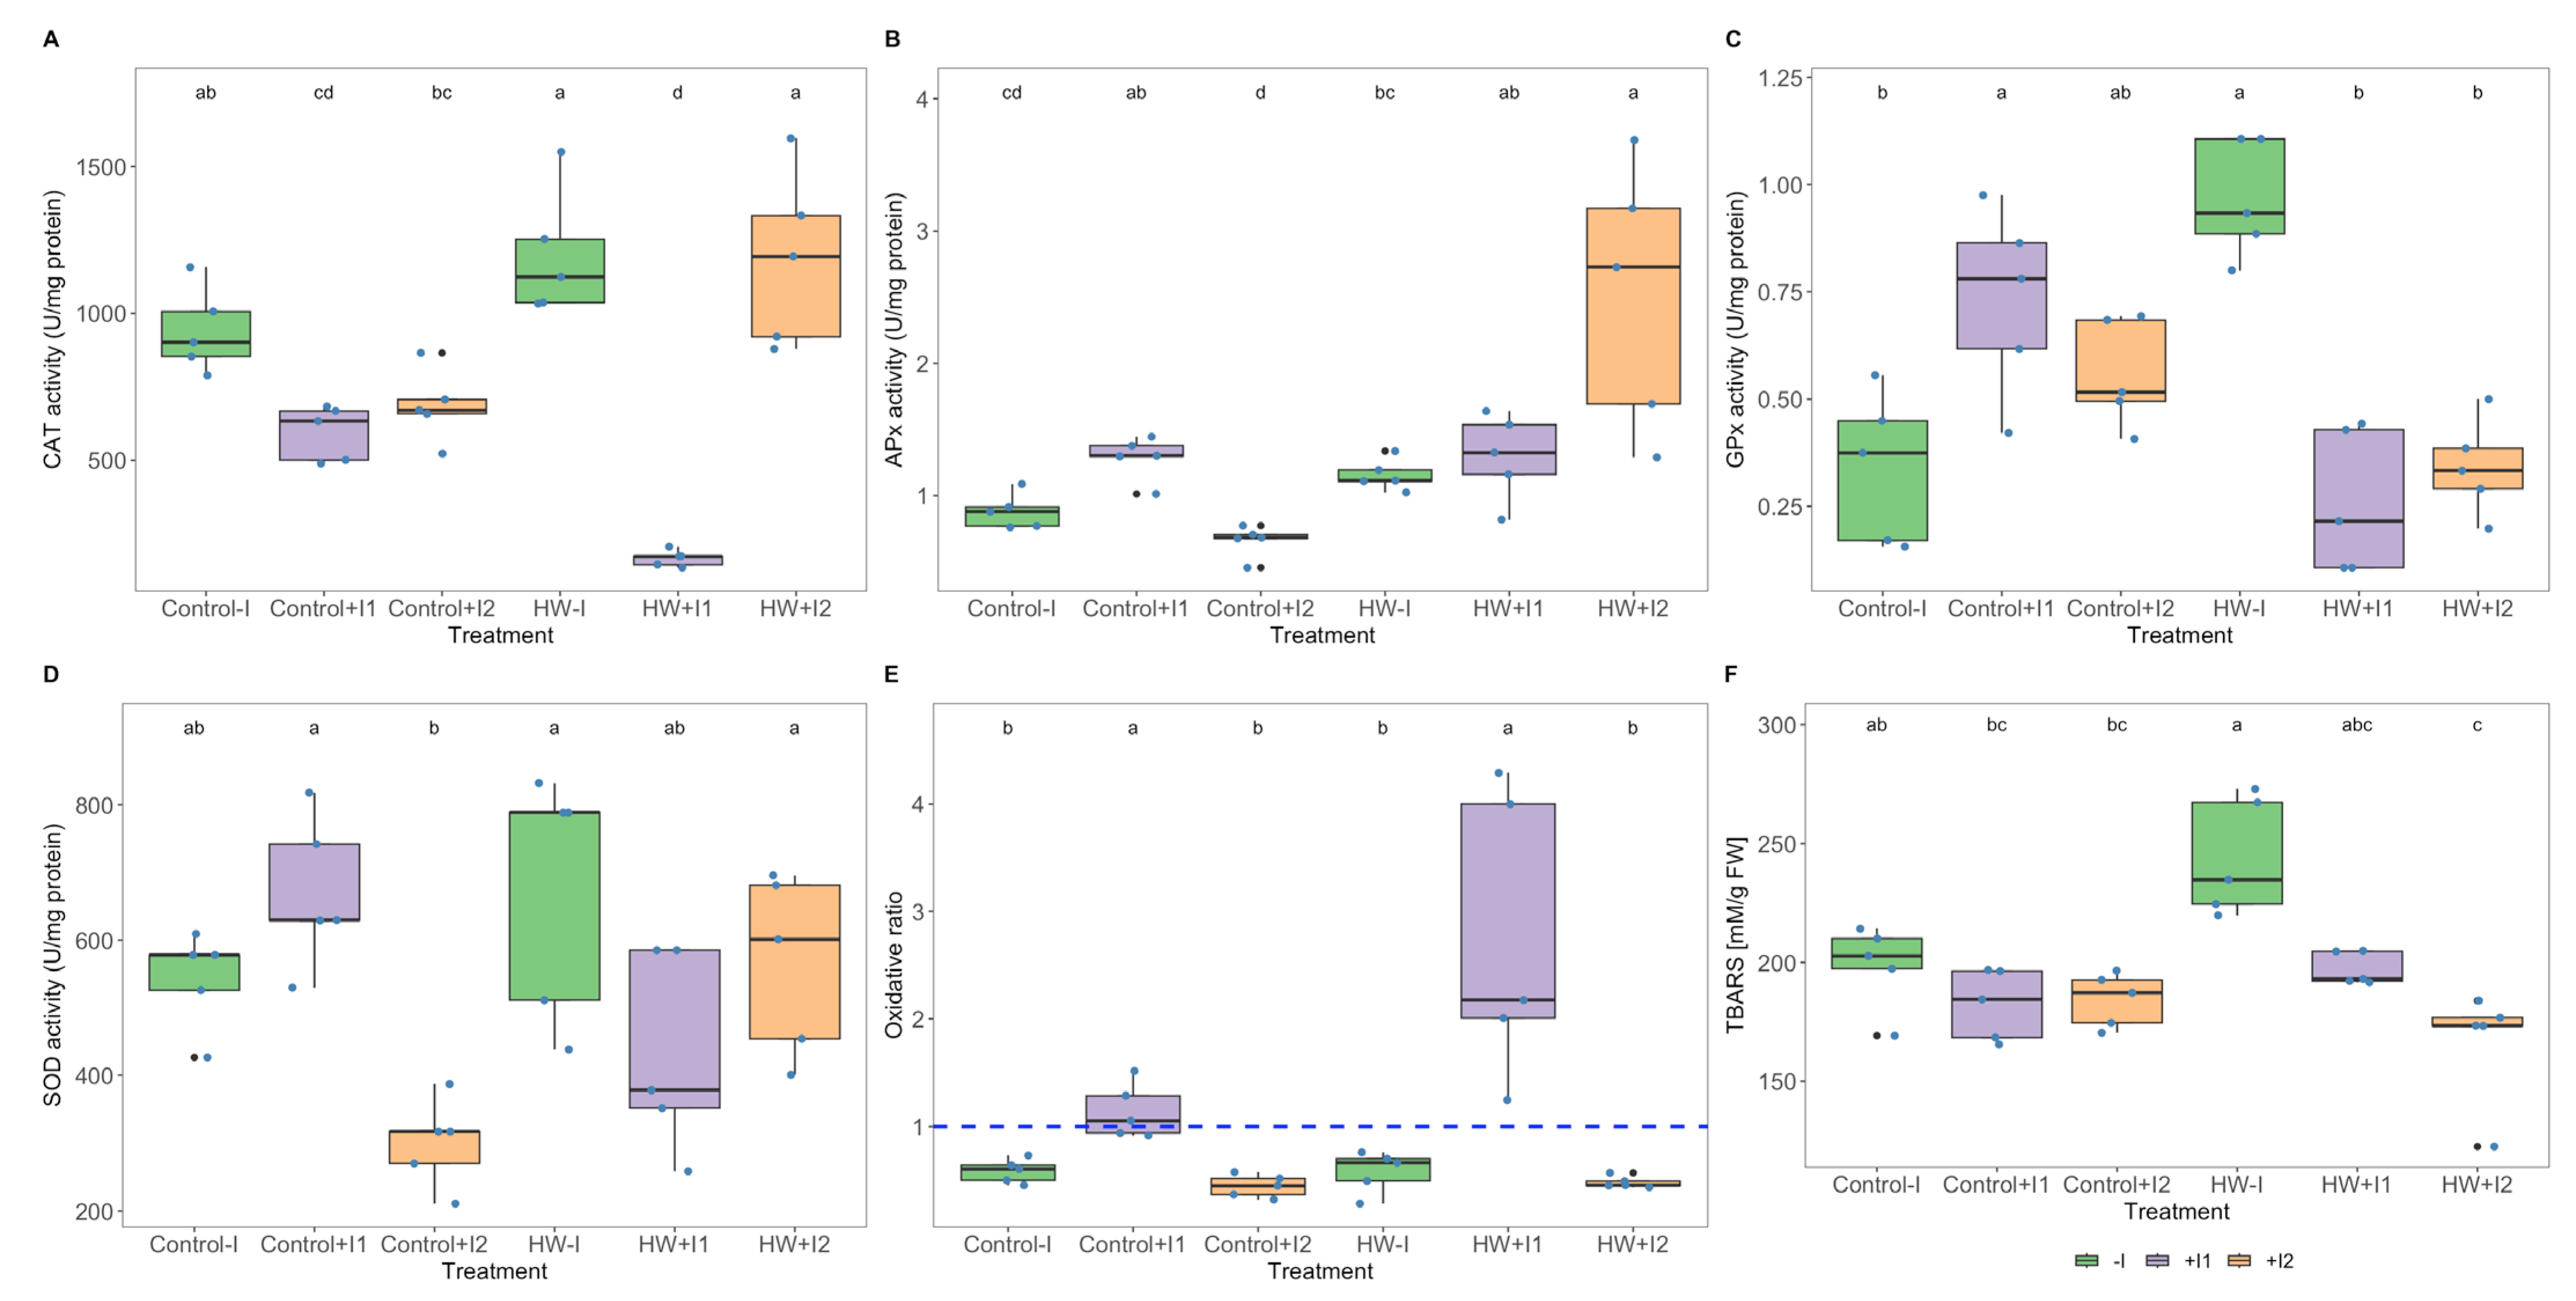
Grapevine inoculation with marine PGPR consortia showed a significant impact on the leaf antioxidant enzyme activity under both thermal conditions. Catalase activity (Figure 8A), within heatwave thermal conditions was found to be significantly lower in the C1-inoculated plants. Ascorbate peroxidase (Figure 8B) activity exhibited thermal variation only in the C2-inoculated plants; it was significantly higher when HW-exposed. When compared to control groups, guaiacol peroxidase activity (Figure 8C) was found to be significantly higher and lower in HW-exposed non-inoculated and C1-inoculated plants, respectively. Moreover, under heatwave conditions, a significantly higher GPx was observed in the non-inoculated plants when compared to their inoculated counterparts. Superoxide dismutase activity (Figure 8D) thermal differences were found to be significant only in C2-inoculated plants, higher under heatwave treatment than in control conditions, and when compared to the other inoculates under control temperatures, exhibited a lower SOD activity. Observing the oxidative ratio (Figure 8E), which reflects enzymatic hydrogen peroxide production and consumption, C1-inoculated plants showed a significantly higher ratio in both control and heatwave treatments; even though significant differences were found among the non-inoculated and C2-inoculated antioxidant enzymatic, their oxidative ratio maintains the same balance between thermal conditions. Analysing the concentration of thiobarbituric acid reactive substances (Figure 8F), HW-exposed “non” and C1- and C2-inoculated plants presented, in that order, decremental TBARS concentrations which were significantly different between non-inoculated and C2-inoculated.

3.6. Fatty Acid Profiles

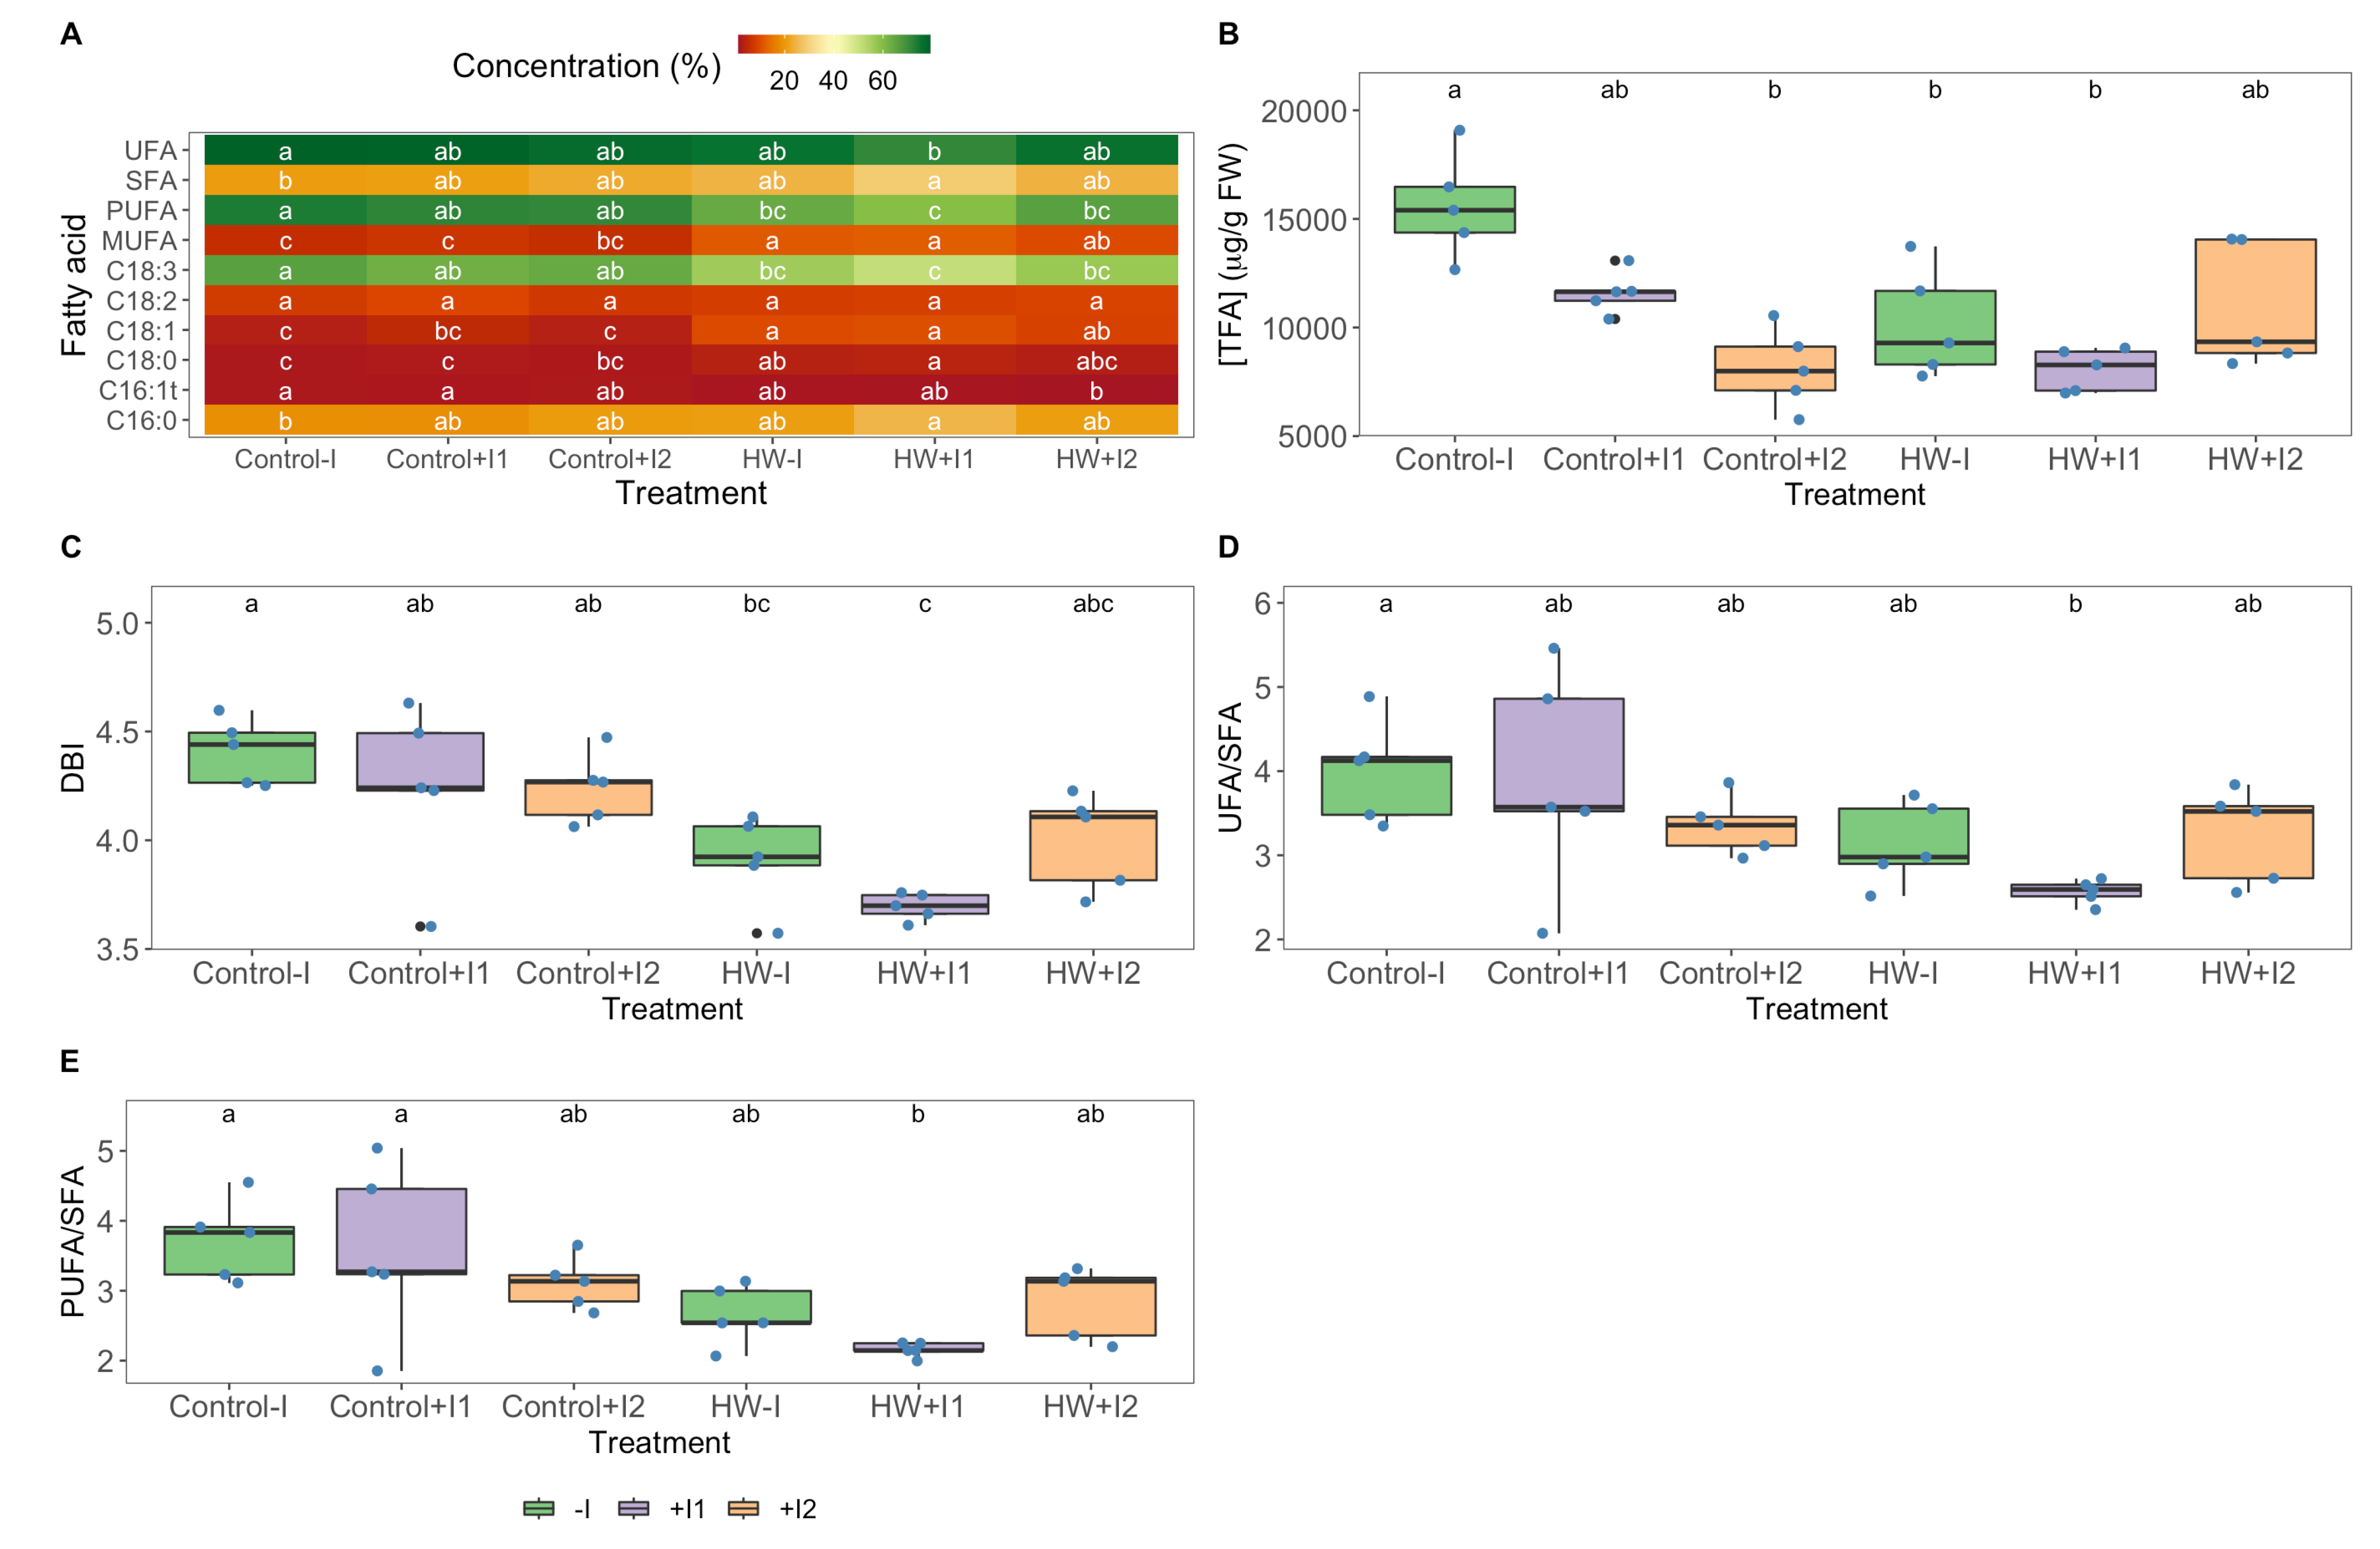
Analysis of total fatty acid composition in grapevine leaves revealed significant distinctions between groups and thermal conditions. Regarding fatty acid content (Figure 9A), no significant differences could be found in palmitic (C16:0), palmitoleic (C16:1t) and linoleic (C18:2) acids. When comparing experimental conditions, non-inoculated and C1-inoculated plants presented significantly higher stearic acid (C18:0) and significantly lower linolenic acid (C18:3) concentrations in heatwave conditions; in contrast, C2-inoculated plants showed no significative changes in these FAs. Moreover, the heatwave-treated groups were shown to have significantly lower oleic acid (C18:1) content. With respect to the unsaturated fatty acid (UFA) and saturated fatty acid (SFA) saturation classes, no meaningful differences between groups were found. Nonetheless, compared to control conditions, HW-treated non-inoculated and C1-inoculated plants exhibited significantly higher monounsaturated (MUFA) and significantly lower polyunsaturated (PUFA) fatty acids. However, no significant variation in saturation classes was seen in the C2-inoculated plants among thermal conditions. Regarding total fatty acid (TFA, Figure 9B) content, significance was only found in the non-inoculated plants, lower when exposed to heatwave treatment than at control conditions. Compared to their control groups, the non-inoculated and C1-inoculated V. vinifera double bound index (DBI; Figure 9C) was significantly lower when HW-exposed. The UFA/SFA and PUFA/SFA ratios (Figure 9D,E) presented no significant variation within thermal treatments and PGPR groups.

3.7. Multivariate Physiological Profiles

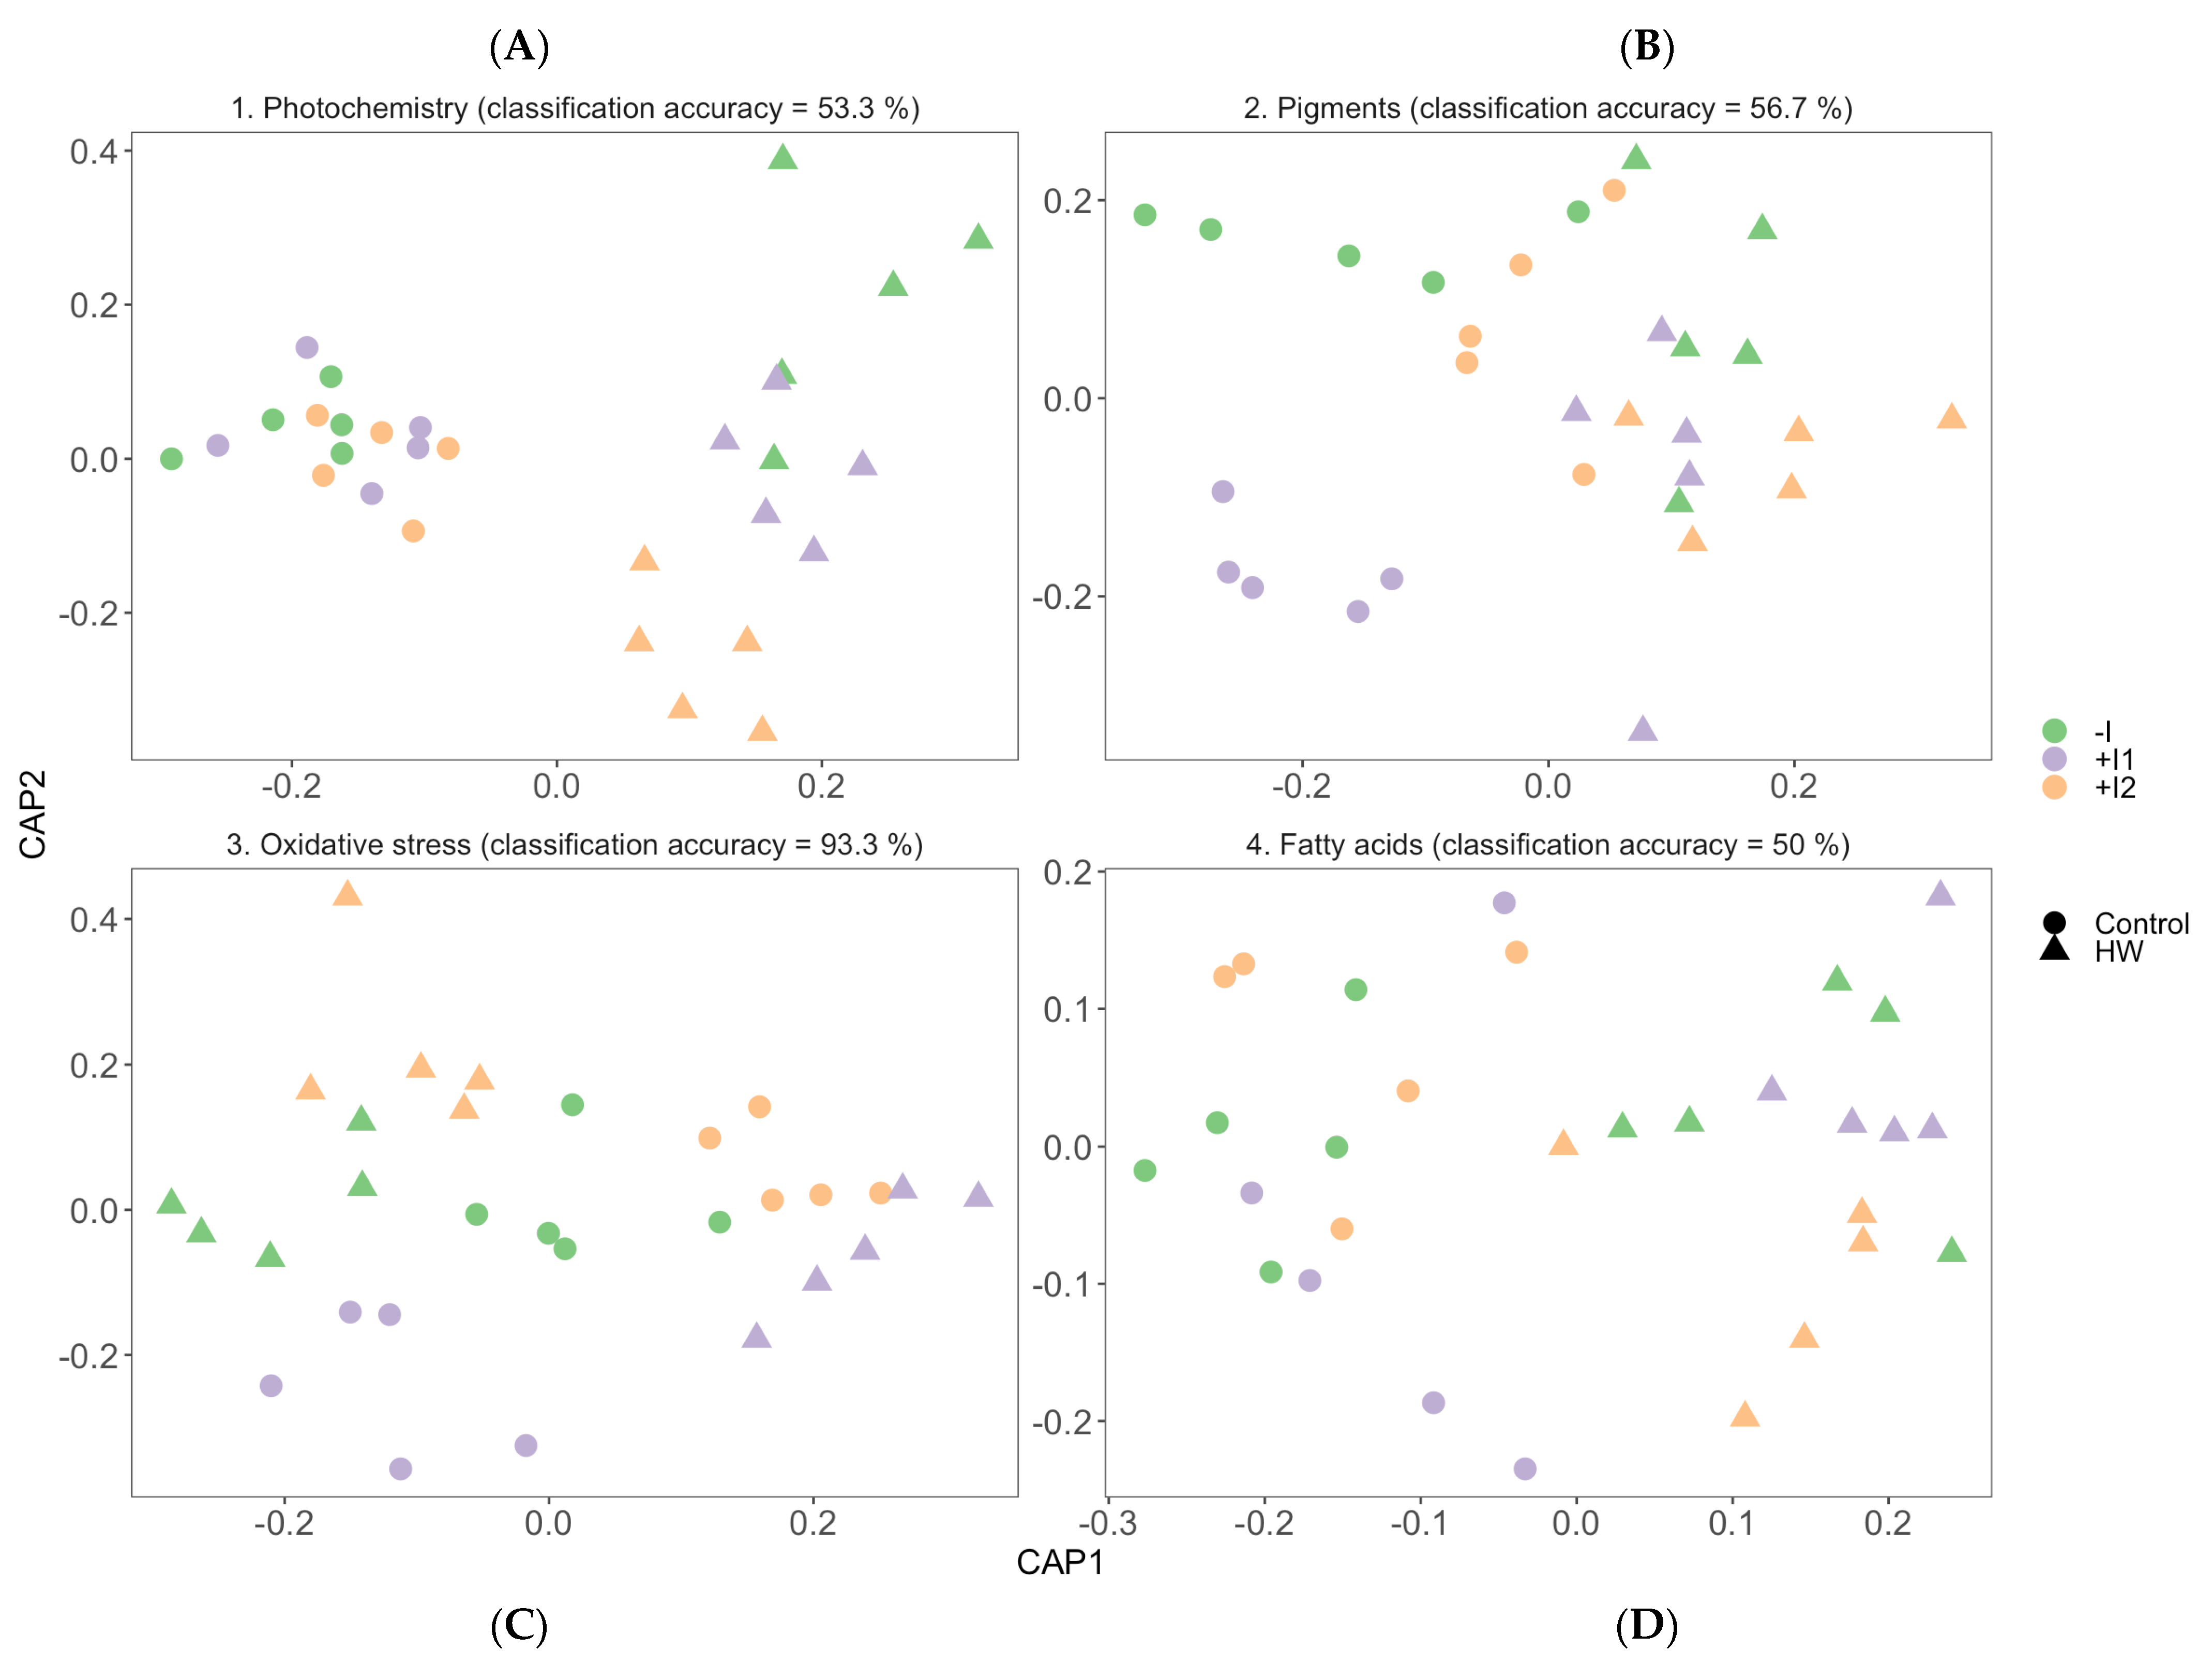
Canonical analysis of principal components (CAP) was performed to highlight and evaluate the impact of PGPR inoculation on grapevine physiological response to heatwave conditions (Figure 10). The multivariate approach to the Kautsky curve dataset (Figure 10A) identified the different thermal treatments and determined the separation of the PGPR-bioaugmented groups when exposed to heatwave conditions, especially noted in the C2-inoculated group isolation. Additionally, the observed photochemical similarities between the various plant groups under normal temperature conditions resulted in the low 53.3% correct classification efficiency. Regarding photosynthetic pigment CAP analyses (Figure 10B), a high overlap was observed between the various HW-treated plants evidenced by the low classification accuracy (56.7%). However, C1-inoculated plants under control conditions were found to be differentially grouped from the remaining samples. Similarly, in the leaf fatty acid profile CAP projection (Figure 10D), despite the 50% classification efficiency, thermal sorting was evident, and HW-exposed C2-inoculated plants were distinctively identifiable. The plots based on the oxidative stress dataset allowed for the description of all tested groups, revealing a highly efficient canonical classification of 93.3% for group allocation (Figure 10C).

4. Discussion

Heatwave exposure led to a depression (both in fluorescence intensity and shape) in the Kautsky curves. This was more significant in non-inoculated plants and is a characteristic of heat stress effects [14,51]. The decrease in fluorescence can indicate lower electron transport chain (ETC) efficiency at the PS II donor or PS I acceptor side [52]. Additionally, the appearance of the K-band, verified through the significant increase in the K-step amplitude in the non-inoculated individuals, implies PS II oxygen-evolving complex (OEC) damage, representative of low thermo-stability under heatwave conditions [53]. Even though a loss in efficiency in the transport from PQH2 to the reduction in PS I final electron acceptors was also noted, an energy flux shift changing PS II / PS I equilibrium towards PS I was observed in the non-inoculated and C1-inoculated plants [54,55] to alleviate excessive energy accumulation at the PS II and attempt redox stability between photosystems. In these same sample groups, heatwave exposure resulted in a significant loss of PS II efficiency in trapping photons, which can be indicative of a potential photoinhibition process most likely due to excess energy absorbed per reaction centre (RC) [56]. Even though the quinone pool size available for oxidation suffered no heat-induced alterations, in non-inoculated grapevines the energy needed to close all reactive centres suffered a significant increase and, as a known counteractive measure, a significant increase occurred in the RC turnover rate and the net rate of PS II reaction centre closure [11,57]. This resulted in excessive absorption of photonic energy unused for chemical energy generation in the ETC; hence, HW-exposed non-inoculated individuals presented a significant increase in their energy dissipation mechanisms, observed as significantly higher leaf temperature (lack of thermal regulation capacity) and photochemical quenching, as seen in the significant increase in the dissipation energy flux (DI/RC) [58,59]. Reaction centre-based energetic parameters corroborate these facts. The photosynthetic apparatus in the non-inoculated plants showed HW-induced energy input instability, as revealed by the significant increase in the absorbed (ABS/RC) and trapped (TR/RC) energy flux; in contrast, transported energy flux (ET/CS) remained unchanged. These results, coupled with the decrease in the fully active RC combined with the increase in heat sink dissipation centres, clearly indicate PS II down-regulation and the potential induction of a photoinhibition state [60]. An overview of the PGPR effects can be seen by analysing the performance index, known for being a sensitive indicator of heat stress that relates energy absorption, antenna steps, reaction centre and electron transport chain functioning [61,62]. As estimated previously, a significantly HW-reduced performance index in the non-inoculated plants was observed when compared to C2-inoculated individuals, which exhibited a performance index increase under heatwave conditions. This higher photochemical performance can be explained by the significantly higher reaction centre II density within the antenna chlorophyll bed and the probability that PS II chlorophyll functions as an RC [63]. The increased reaction centre availability, acquired through C2 consortia inoculation, improved light-harvesting capabilities and allowed the maintenance of the leaf’s photosynthetic efficiency while reducing the photosynthetic antenna size and preventing energetic overload in the RC [26,64]. Photosynthetic stress mitigation can be connected to consortia 1 and 2 rhizobacteria which improved N-fixation capabilities. Extreme temperatures may prime nitrogen dependency in plants, limiting root N assimilation and altering N partitioning among the plant’s components [65,66]. Moreover, nitrogen is a primary component of amino acids, chlorophyll and proteins; substantial amounts are invested in photosynthetic enzymes such as ribulose-1,5-bisphosphate carboxylase (RuBisCo), which are known to be extremely heat sensitive and constitute the early effects of thermal stress [67,68]. The constraints observed in the non-inoculated plants’ ETC may be partially a result of RuBisCo heat-induced inhibition, as described in the studies of [69,70]. Additionally, N-deficiency lowers the PS II protein repair rate and can be related to the degradation of the photodamaged D1 protein, impairing the photochemical apparatus [71,72]. PGPR inoculation had a mitigating heat stress effect, allowing for the accumulation, synthesis and remobilization of nitrogenous-related compounds in grapevine leaves, such as proline, which was found to present control values in inoculated plants exposed to HW treatment. From this, it can be affirmed that PGPR bioaugmentation resulted in a photoprotection enhancement and ETC amelioration of grapevine photosynthetic processes in heat stress conditions, although superior through C2 inoculation. These observations were evidenced in the structure functional indexes. In contrast to the non-inoculated grapevines, although some HW damages were revealed, C1 inoculation allowed for the maintenance of the structural functional index for photosynthesis (SFI) and the functional index for non-photochemical reactions (SFINPQ). However, in comparison to the other plant groups, C2 inoculation showed significantly higher SFI as well as a significantly lower SFINPQ. As both these indexes are intrinsically connected with the overall energy fluxes summarizing the outcome resulting from its balances, it can be deduced that C2-inoculated plants under heatwave exposure were able to maintain a high light energy use efficiency (similar to that observed for its control temperature counterparts), probably promoted by the alleviation of oxidative stress by improved CAT and APx; this feature that was not observed in C1-inoculated plants under heatwave exposure.
The leaf pigment content of Vitis vinifera, the de-epoxidation reaction and the carotenoid to chlorophyll ratio showed no HW-induced rise, indicating that biochemical energy dissipation through the xanthophyll cycle was not induced and the photoprotection mechanism was not activated [73]. However, under heatwave conditions, the grapevine was described as using carotenoid-based reactive oxygen species (ROS) scavenging mechanisms [74]. Violaxanthin concentration increased in the bioaugmented groups, in contrast to the decrease in the non-inoculated plants. Nonetheless, the differences in concentration of this efficient energy quencher pigment were not significant [75]. Additionally, all treated groups presented an increase in the β-carotene, zeaxanthin and lutein pigment concentrations, boosting the thylakoid membrane antioxidant potential [76]. Even though some PGPR-induced variation differences were not significant, it is noteworthy that C2-inoculated individuals displayed a comparatively higher concentration of this antioxidant pigment, a possible indication of a comparatively better ROS-savaging capability. This could be provided by the C2 PGPR nitrogen fixation enhancement, phosphate solubilization attribute and iron uptake augmentation by siderophores [77]. Higher accessibility and nutrient uptake from the rhizosphere boost the production of photoreceptor pigments, as indicated by previous studies [23,78]. Moreover, under the control temperature, C1-inoculated plants showed a reduction in the pigment concentrations, yet photosynthetic capability remained the same.
Under extreme heat stress, leaf osmotic regulation is critically affected [79]. Grapevines appear to maintain leaf water content (WC) even under heatwave conditions, a probable evolutionary adaptation to their Mediterranean native environment. However, inoculation induced WC variation under the control temperature. Under these conditions, C1-inoculated individuals displayed a significantly higher WC, yet no significant differences between groups were observed when HW-exposed. To counteract HW-inducing osmotic pressure, synthesis and accumulation of L-proline in grapevine leaf tissues are generally observed [80]. Accordingly, a significantly higher proline leaf tissue concentration was observed in the non-inoculated plants. In contrast, bioaugmented plants exposed to the heatwave presented the same levels of this osmo-compatible solute as in control conditions. These results indicate a rhizobacteria’s osmoprotectant promotion, alleviating the need for higher osmolyte concentration to maintain leaf turgidity [81]. In addition to its osmoregulation function, proline is vital in maintaining and protecting membrane integrity and ROS detoxification, preventing oxidative bursts in leaves [82,83]. Heat stress increases membrane fluidity, which can cause reaction series disconnection and subsequent changes in metabolism. In plant cells, the uncoupling of reactions combined with the abovementioned photochemical impairment and heightened energy dissipation causes the accumulation of intermediate ROS [84,85]. To alleviate oxidative stress, plants rely on enzyme-based antioxidant mechanisms to preserve redox homeostasis [86]. Considering the oxidative stress biomarkers, rhizobacterial inoculation resulted in group-specific oxidative stress response variation, evidenced in the canonical analyses’ (CAP) high classification efficiency. First, C1 inoculation under normal temperature stimulated a comparative increase in superoxide dismutase (SOD), guaiacol peroxidase (GPx) and ascorbate peroxidase (APx) activities in a way that led to a significantly higher oxidative ratio of one as compared to their counterparts. This suggests a hydrogen peroxide generation/decomposition equilibrium [87]. This can imply a C1-induced carotenoid–ROS-quenching strategy in reducing hydrogen peroxide from other sources following the abovementioned total carotenoid loss [88]. Furthermore, when comparing HW-treated grapevines, C1-inoculated plants displayed a significantly higher oxidative ratio, possibly due to deficiencies in catalase (CAT) and GPx activities. Nonetheless, when observing the lipid peroxidation products (TBARS) present in the HW-exposed leaves, only non-inoculated individuals showed a significant increase. At the same time, PGPR consortia-treated plants were able to maintain non-stressed levels. The increase in lipid peroxidation suggests that non-inoculated grapevines’ antioxidant mechanisms were insufficient to endure the heatwave-related oxidative stress, resulting in physiological damage within plant cells [13,89] and keeping within the noted photosynthetic efficiency loss. Fatty acids displayed membrane protection mechanisms to reduce cellular membrane degradation by ROS toxicity and excessive fluidity due to high temperatures. The significant increase in the monounsaturated fatty acid (MUFA) concentration, coupled with the significant reduction detected in the polyunsaturated fatty acids (PUFA) and in the double bound index (DBI) of both non-inoculated and C1-inoculated plants, are indicative of membrane remodelling, reflecting a decrease in membrane fluidity [55]. In these same groups, a significant reduction in linolenic acid (C18:3) content can also suggest their utilization as a direct ROS scavenger, concomitant with the TBARS accumulation in non-inoculated plants and the low antioxidative enzyme present in the C1-inoculated individuals [59]. It can be noted that the C2-inoculated group showed no significant changes in the FA saturation classes’ relative abundance changes when exposed to thermal treatments. Grapevine exhibited a significative reduction in oxidative and membrane damage under heatwave conditions by consortium 2 inoculation in concordance with previous PGPR studies [35,90,91]. All this connected with an improved thermotolerance can be at the basis of the inoculated plants’ resilience to the tested HW treatment.
Multivariate analysis delivered an integrated approach and overview of PGPR consortia’s influence on the biophysical and biochemical traits of V. vinifera. These allow an understanding of the metabolic pathways that exhibited significant PGPR contribution. When observing the canonical analyses, oxidative stress biomarkers were the most effective in distributing all grapevine groups; this indicates significant PGPR-induced trait modification in both thermal treatments, probably due to stress alleviation through plant internal ethylene concentration reduction. Nonetheless, the other highlighted datasets exhibited meaningful insights. As mentioned previously, C1-inoculated plants displayed a specific and distinguished pigment profile under normal conditions. Moreover, C2-inoculated plants, when HW-exposed, displayed a clearly defined grouping in the canonical space of the photochemical processes and comparatively better separation in the pigment and fatty acid profiles. This overview emphasizes the evident photochemical and physiological bioaugmentation impact, as well as the contrast of the action of the different consortia. In summary, Vitis vinifera, when inoculated with the PGPR consortia, had a significant amelioration effect on heatwave-induced stress. These consortia were designed with tested and proven plant growth-promoting rhizobacteria that presented great bioinoculant potential during in vitro assays [27,28] and were built with no differentiating factor among them; however, superior oxidative protection and overall fitness were seen in consortium 2. Consortia effectiveness variation can have many explanations, including biotic and abiotic stress sensitivity [92], soil biochemistry [93] and leaf surface biochemistry [94]. Bacteria selection and consortia design is a key determinant of the effectiveness of the bacterial inoculant and the finished product itself. Thus, a knowledge-based solution for this formulation or an experience repository is being debated to maximize research efficacy [95]. Furthermore, long-term ecological implications for the use of allochthonous bacteria as agro-inoculants have not been reported. Most of the authors that developed field trials with bioinoculants observed that they have temporary effects on soil and plant growth. For example, PGPR used in sunflower, tomato, pigeon pea and maize showed an inoculation effect at the early stages of plant growth, but it decreased at later stages. They also showed initial re-shaping of soil bacterial communities after inoculation that was limited to rhizospheric microbiota at later stages [96,97]. These results suggest that the survival and proliferation of allochthonous microorganisms in soil are limited. This was confirmed by [98], who detected the inoculated strain approximately two months after sowing. Hence, determining the concentration of inoculum formulations and their presence in soil over time, as well as optimizing biofertilizer application through irrigation or other methods, is necessary before delivery to the agricultural market. Additional research relating to transcriptomic and metabolomic analyses is planned and required to gain further insights into the role of PGPR in stress protection.

5. Conclusions

Marine rhizobacteria-bioaugmented grapevine plants exhibited significantly superior photoprotection and membrane stability and displayed a notable amelioration in the oxidative stress experienced when exposed to a heatwave stress. Therefore, compared to the heat-stressed non-inoculated grapevines, an overall PGPR-induced improvement of plant fitness was witnessed. This approach also found that even though selected bacterial strain combinations revealed similar potential as bioinoculant in in vitro assays, the application in this study presented significant differences in the heatwave amelioration effectiveness between the tested consortia. It can be inferred that grapevine, when inoculated with consortium 1, presented heatwave stress tolerance (stress avoidance); however, when inoculated with consortium 2, it presented heatwave amelioration (increased resistance). On this basis, the PGPR consortium constituted by A. aquariorum, B. methylotrophicus and B. aryabhattai can be a remarkable and viable tool for mitigating and avoiding heat-related harm in Vitis vinifera. These findings illustrate the potential of PGPR bioaugmentation and the possible biotechnological capabilities for mitigating climate change’s harmful effects on agricultural productivity; nevertheless, the mechanism of how PGPR imparts abiotic stress tolerance is still not completely understood. Research is needed to depict intrinsic effectiveness linked to bacteria–plant and bacteria–stress relations for role-specific consortia formulation. Developing PGPR consortia designs particular to individual species and expected stress impositions is possible, thus highlighting the applicability of PGP rhizosphere engineering and the importance of further investigation.

Supplementary Materials

The following supporting information can be downloaded at: https://www.mdpi.com/article/10.3390/microorganisms11040856/s1, Table S1: Summary of fluorometric analysis parameters and their description.

Author Contributions

Conceptualization: A.F. and B.D.; methodology: J.C., A.C.-S., R.C.C., J.M.-M., A.F. and B.D.; software: J.C. and B.D. validation: J.C.; formal analysis, J.C. and B.D.; investigation: J.C., A.C.-S., R.C.C., B.F., J.P.P., C.P.-S., S.A.S. and R.J.S.; resources J.C., J.M.-M., E.M.-N., I.D.R.-L., E.P. and S.R.-G.; writing—J.C., B.D. and A.F.; writing—review and editing: J.C., A.C.-S., B.F., R.C.C., J.P.C., J.P.P., C.P.-S., S.A.S., R.J.S., E.M.-N., I.D.R.-L., E.P., S.R.-G., A.R.M., J.M.-M., A.F. and B.D. Funding acquisition: A.F. and B.D. All authors have read and agreed to the published version of the manuscript.

Funding

The authors would like to thank Fundação para a Ciência e a Tecnologia (FCT) for funding MARE (Marine and Environmental Sciences Centre, UIDB/04292/2020 and UIDP/04292/2020), ARNET (Aquatic Research Network Associated Laboratory, LA/P/0069/2020), BioISI (UID/MULTI/04046/2019) and the Partnership for research and innovation in the Mediterranean area (PRIMA) by Project “REVINE-Regenerative agricultural approaches to improve ecosystem services in Mediterranean vine-yards” Grant/Award Numbers: 20114-2, PRIMA/0011/2020. B. Duarte was supported by researcher contracts (CEECIND/00511/2017 and 2022.01746.CEECIND). J. Carreiras was supported by FCT Ph.D. Grant (2022.11260.BD). A. Cruz-Silva was funded by a fellowship from BioSys PhD program PD65-2012 (UI/BD/153050/2022).

Institutional Review Board Statement

Not applicable.

Informed Consent Statement

Not applicable.

Data Availability Statement

Data available upon request.

Conflicts of Interest

The authors declare no conflict of interest.

References

  1. FAO/OIV. Annual Assessment of the World Vine and Wine Sector in 2021 International Organisation of Vine and Wine Intergovernmental Organisation. Available online: https://www.oiv.int/sites/default/files/documents/OIV_Annual_Assessment_of_the_World_Vine_and_Wine_Sector_in_2021.pdf (accessed on 30 January 2023).
  2. Jones, G.V.; Edwards, E.J.; Bonada, M.; Sadras, V.O.; Krstic, M.P.; Herderich, M.J. Climate Change and Its Consequences for Viticulture. Manag. Wine Qual. Vol. One Vitic. Wine Qual. 2022, 1, 727–778. [Google Scholar] [CrossRef]
  3. Coombe, B.G. Influence of temperature on composition and quality of grapes. Acta Hortic. 1987, 206, 23–36. [Google Scholar] [CrossRef] [Green Version]
  4. Fraga, H.; Molitor, D.; Leolini, L.; Santos, J.A. What Is the Impact of Heatwaves on European Viticulture? A Modelling Assessment. Appl. Sci. 2020, 10, 3030. [Google Scholar] [CrossRef]
  5. Moutinho-Pereira, J.M.; Correia, C.M.; Gonçalves, B.M.; Bacelar, E.A.; Torres-Pereira, J.M. Leaf Gas Exchange and Water Relations of Grapevines Grown in Three Different Conditions. Photosynthetica 2004, 42, 81–86. [Google Scholar] [CrossRef]
  6. Greer, D.H.; Weston, C.; Greer, D.H.; Weston, C. Heat Stress Affects Flowering, Berry Growth, Sugar Accumulation and Photosynthesis of Vitis Vinifera Cv. Semillon Grapevines Grown in a Controlled Environment. Funct. Plant Biol. 2010, 37, 206–214. [Google Scholar] [CrossRef]
  7. World Meteorological Organization. WMO Statement on the Status of the Global Climate in 2003; WMO: Geneva, Switzerland, 2004. [Google Scholar]
  8. Marchin, R.M.; Backes, D.; Ossola, A.; Leishman, M.R.; Tjoelker, M.G.; Ellsworth, D.S. Extreme Heat Increases Stomatal Conductance and Drought-Induced Mortality Risk in Vulnerable Plant Species. Glob. Chang. Biol. 2022, 28, 1133–1146. [Google Scholar] [CrossRef]
  9. Masson-Delmotte, V.; Zhai, P.; Chen, Y.; Goldfarb, L.; Gomis, M.I.; Matthews, J.B.R.; Berger, S.; Huang, M.; Yelekçi, O.; Yu, R.; et al. Working Group I Contribution to the Sixth Assessment Report of the Intergovernmental Panel on Climate Change; IPCC: Geneva, Switzerland, 2021. [Google Scholar]
  10. Reluy, N.P.; Baghdadi, N.; Simonneau, T.; Bazzi, H.; El Hajj, M.M.; Pret, V.; Amin, G.; Daret, E. Can We Detect the Damage of a Heatwave on Vineyards Using Sentinel-2 Optical Remote Sensing Data? OENO ONE 2022, 56, 145–159. [Google Scholar] [CrossRef]
  11. Duarte, B.; Goessling, J.W.; Marques, J.C.; Caçador, I. Ecophysiological Constraints of Aster Tripolium under Extreme Thermal Events Impacts: Merging Biophysical, Biochemical and Genetic Insights. Plant Physiol. Biochem. 2015, 97, 217–228. [Google Scholar] [CrossRef]
  12. Duarte, B.; Santos, D.; Marques, J.C.; Caçador, I. Impact of Heat and Cold Events on the Energetic Metabolism of the C3 Halophyte Halimione Portulacoides. Estuar. Coast. Shelf Sci. 2015, 167, 166–177. [Google Scholar] [CrossRef]
  13. Duarte, B.; Marques, J.C.; Caçador, I. Ecophysiological Response of Native and Invasive Spartina Species to Extreme Temperature Events in Mediterranean Marshes. Biol. Invasions 2016, 18, 2189–2205. [Google Scholar] [CrossRef]
  14. Carreiras, J.; Alberto Pérez-Romero, J.; Mateos-Naranjo, E.; Redondo-Gómez, S.; Rita Matos, A.; Caçador, I.; Duarte, B. The Effect of Heavy Metal Contamination Pre-Conditioning in the Heat Stress Tolerance of Native and Invasive Mediterranean Halophytes. Ecol. Indic. 2020, 111, 106045. [Google Scholar] [CrossRef]
  15. Naulleau, A.; Gary, C.; Prévot, L.; Hossard, L. Evaluating Strategies for Adaptation to Climate Change in Grapevine Production–A Systematic Review. Front. Plant Sci. 2021, 11, 607859. [Google Scholar] [CrossRef] [PubMed]
  16. Sandrini, M.; Nerva, L.; Sillo, F.; Balestrini, R.; Chitarra, W.; Zampieri, E. Abiotic Stress and Belowground Microbiome: The Potential of Omics Approaches. Int. J. Mol. Sci. 2022, 23, 1091. [Google Scholar] [CrossRef] [PubMed]
  17. Basu, A.; Prasad, P.; Das, S.N.; Kalam, S.; Sayyed, R.Z.; Reddy, M.S.; El Enshasy, H. Plant Growth Promoting Rhizobacteria (PGPR) as Green Bioinoculants: Recent Developments, Constraints, and Prospects. Sustainability 2021, 13, 1140. [Google Scholar] [CrossRef]
  18. Mierek-Adamska, A.; Nowak, A.; Antoszewski, M.; Zyna, G. The Importance of Microorganisms for Sustainable Agriculture—A Review. Metabolites 2022, 12, 1100. [Google Scholar] [CrossRef]
  19. Schütz, L.; Gattinger, A.; Meier, M.; Müller, A.; Boller, T.; Mäder, P.; Mathimaran, N. Improving Crop Yield and Nutrient Use Efficiency via Biofertilization—A Global Meta-Analysis. Front. Plant Sci. 2018, 8, 2204. [Google Scholar] [CrossRef] [Green Version]
  20. Martínez-Viveros, O.; Jorquera, M.A.; Crowley, D.E.; Gajardo, G.; Mora, M.L. Mechanisms and practical considerations involved in plant growth promotion by rhizobacteria. J. Soil Sci. Plant Nutr. 2010, 10, 293–319. [Google Scholar] [CrossRef] [Green Version]
  21. Gupta, A.; Mishra, R.; Rai, S.; Bano, A.; Pathak, N.; Fujita, M.; Kumar, M.; Hasanuzzaman, M. Mechanistic Insights of Plant Growth Promoting Bacteria Mediated Drought and Salt Stress Tolerance in Plants for Sustainable Agriculture. Int. J. Mol. Sci. 2022, 23, 3741. [Google Scholar] [CrossRef]
  22. Notununu, I.; Moleleki, L.; Roopnarain, A.; Adeleke, R. Effects of Plant Growth-Promoting Rhizobacteria on the Molecular Responses of Maize under Drought and Heat Stresses: A Review. Pedosphere 2022, 32, 90–106. [Google Scholar] [CrossRef]
  23. Ferreira, M.J.; Cunha, A.; Figueiredo, S.; Faustino, P.; Patinha, C.; Silva, H.; Sierra-Garcia, I.N. The Root Microbiome of Salicornia Ramosissima as a Seedbank for Plant-Growth Promoting Halotolerant Bacteria. Appl. Sci. 2021, 11, 2233. [Google Scholar] [CrossRef]
  24. Pajuelo, E.; Arjona, S.; Rodríguez-Llorente, I.D.; Mateos-Naranjo, E.; Redondo-Gómez, S.; Merchán, F.; Navarro-Torre, S. Coastal Ecosystems as Sources of Biofertilizers in Agriculture: From Genomics to Application in an Urban Orchard. Front. Mar. Sci. 2021, 8, 1162. [Google Scholar] [CrossRef]
  25. Valle-Romero, P.; García-López, J.V.; Redondo-Gómez, S.; Flores-Duarte, N.J.; Rodríguez-Llorente, I.D.; Idaszkin, Y.L.; Pajuelo, E.; Mateos-Naranjo, E. Biofertilization with PGP Bacteria Improve Strawberry Plant Performance under Sub-Optimum Phosphorus Fertilization. Agronomy 2023, 13, 335. [Google Scholar] [CrossRef]
  26. Carreiras, J.; Caçador, I.; Duarte, B. Bioaugmentation Improves Phytoprotection in Halimione Portulacoides Exposed to Mild Salt Stress: Perspectives for Salinity Tolerance Improvement. Plants 2022, 11, 1055. [Google Scholar] [CrossRef] [PubMed]
  27. Redondo-Gómez, S.; Romano-Rodríguez, E.; Mesa-Marín, J.; Sola-Elías, C.; Mateos-Naranjo, E. Consortia of Plant-Growth-Promoting Rhizobacteria Isolated from Halophytes Improve the Response of Swiss Chard to Soil Salinization. Agronomy 2022, 12, 468. [Google Scholar] [CrossRef]
  28. Redondo-Gómez, S.; García-López, J.V.; Mesa-Marín, J.; Pajuelo, E.; Rodriguez-Llorente, I.D.; Mateos-Naranjo, E. Synergistic Effect of Plant-Growth-Promoting Rhizobacteria Improves Strawberry Growth and Flowering with Soil Salinization and Increased Atmospheric CO2 Levels and Temperature Conditions. Agronomy 2022, 12, 2082. [Google Scholar] [CrossRef]
  29. Pérez-Romero, J.A.; Barcia-Piedras, J.M.; Redondo-Gómez, S.; Mateos-Naranjo, E. Impact of Short-Term Extreme Temperature Events on Physiological Performance of Salicornia Ramosissima J. Woods under Optimal and Sub-Optimal Saline Conditions. Sci. Rep. 2019, 9, 659. [Google Scholar] [CrossRef] [Green Version]
  30. Mesa-Marín, J.; Mateos-Naranjo, E.; Rodríguez-Llorente, I.D.; Pajuelo, E.; Redondo-Gómez, S. Synergic Effects of Rhizobacteria: Increasing Use of Halophytes in a Changing World. Halophytes Clim. Chang. Adapt. Mech. Potential Uses 2019, 1, 240–254. [Google Scholar] [CrossRef]
  31. Santos, M.; Fonseca, A.; Fraga, H.; Jones, G.V.; Santos, J.A. Bioclimatic Conditions of the Portuguese Wine Denominations of Origin under Changing Climates. Int. J. Climatol. 2020, 40, 927–941. [Google Scholar] [CrossRef]
  32. Catarino, S.; Madeira, M.; Manuel, F.; Monteiro, G.; Caldeira, I.; Monteiro, F.; Rosa, T.; Martins, P.; Bruno De Sousa, R.; Curvelo-Garcia, A. Multi-Elemental Analysis throughout Soil-Wine System as a Generator of Information on Geographic Origin Portuguese-Swedish Research Project on the Ecology of Blue Gum (Eucalyptus Globulus) View Project Analytical Innovations in Wine Production-Foods Special Issue View Project Multi-Elemental Analysis throughout Soil-Wine System as a Generator of Information on Geographic Origin. In Proceedings of the 37th World Congress of Vine and Wine, Mendoza, Argentina, 9–14 November 2014. [Google Scholar] [CrossRef]
  33. Figueiredo, A.; Monteiro, F.; Fortes, A.M.; Bonow-Rex, M.; Zyprian, E.; Sousa, L.; Pais, M.S. Cultivar-Specific Kinetics of Gene Induction during Downy Mildew Early Infection in Grapevine. Funct. Integr. Genom. 2012, 12, 379–386. [Google Scholar] [CrossRef]
  34. Andrades-Moreno, L.; del Castillo, I.; Parra, R.; Doukkali, B.; Redondo-Gómez, S.; Pérez-Palacios, P.; Caviedes, M.A.; Pajuelo, E.; Rodríguez-Llorente, I.D. Prospecting Metal-Resistant Plant-Growth Promoting Rhizobacteria for Rhizoremediation of Metal Contaminated Estuaries Using Spartina Densiflora. Environ. Sci. Pollut. Res. Int. 2014, 21, 3713–3721. [Google Scholar] [CrossRef]
  35. Mesa-Marín, J.; Pérez-Romero, J.A.; Mateos-Naranjo, E.; Bernabeu-Meana, M.; Pajuelo, E.; Rodríguez-Llorente, I.D.; Redondo-Gómez, S. Effect of Plant Growth-Promoting Rhizobacteria on Salicornia Ramosissima Seed Germination under Salinity, CO2 and Temperature Stress. Agronomy 2019, 9, 655. [Google Scholar] [CrossRef] [Green Version]
  36. Mesa, J.; Mateos-Naranjo, E.; Caviedes, M.A.; Redondo-Gómez, S.; Pajuelo, E.; Rodríguez-Llorente, I.D. Scouting Contaminated Estuaries: Heavy Metal Resistant and Plant Growth Promoting Rhizobacteria in the Native Metal Rhizoaccumulator Spartina Maritima. Mar. Pollut. Bull. 2015, 90, 150–159. [Google Scholar] [CrossRef]
  37. Parente, J.; Pereira, M.G.; Amraoui, M.; Fischer, E.M. Heat Waves in Portugal: Current Regime, Changes in Future Climate and Impacts on Extreme Wildfires. Sci. Total Environ. 2018, 631–632, 534–549. [Google Scholar] [CrossRef]
  38. Beniston, M.; Diaz, H.F. The 2003 Heat Wave as an Example of Summers in a Greenhouse Climate? Observations and Climate Model Simulations for Basel, Switzerland. Glob. Planet. Chang. 2004, 44, 73–81. [Google Scholar] [CrossRef] [Green Version]
  39. Zhu, X.G.; Baker, N.R.; DeSturler, E.; Ort, D.R.; Long, S.P. Chlorophyll a Fluorescence Induction Kinetics in Leaves Predicted from a Model Describing Each Discrete Step of Excitation Energy and Electron Transfer Associated with Photosystem II. Planta 2005, 223, 114–133. [Google Scholar] [CrossRef]
  40. Küpper, H.; Seibert, S.; Parameswaran, A. Fast, Sensitive, and Inexpensive Alternative to Analytical Pigment HPLC: Quantification of Chlorophylls and Carotenoids in Crude Extracts by Fitting with Gauss Peak Spectra. Anal. Chem. 2007, 79, 7611–7627. [Google Scholar] [CrossRef]
  41. Bates, L.S.; Waldren, R.P.; Teare, I.D. Rapid Determination of Free Proline for Water-Stress Studies. Plant Soil 1973, 39, 205–207. [Google Scholar] [CrossRef]
  42. Tiryakioglu, M.; Eker, S.; Ozkutlu, F.; Husted, S.; Cakmak, I. Antioxidant Defense System and Cadmium Uptake in Barley Genotypes Differing in Cadmium Tolerance. J. Trace Elem. Med. Biol. 2006, 20, 181–189. [Google Scholar] [CrossRef] [PubMed]
  43. Teranishi, Y.; Tanaka, A.; Osumi, M.; Fukui, S. Catalase Activities of Hydrocarbon-Utilizing Candida Yeasts. Agric. Biol. Chem. 1974, 38, 1213–1220. [Google Scholar] [CrossRef]
  44. Bergmeyer, H.U.; Gawehn, K.; Grassl, M. Lactatedehydrogenase, UV-Assay with Pyruvate and NADH. Methods Enzym. Anal. 1974, 2, 574–579. [Google Scholar]
  45. Marklund, S.; Marklund, G. Involvement of the Superoxide Anion Radical in the Autoxidation of Pyrogallol and a Convenient Assay for Superoxide Dismutase. Eur. J. Biochem. 1974, 47, 469–474. [Google Scholar] [CrossRef]
  46. Bradford, M.M. A Rapid and Sensitive Method for the Quantitation of Microgram Quantities of Protein Utilizing the Principle of Protein-Dye Binding. Anal. Biochem. 1976, 72, 248–254. [Google Scholar] [CrossRef] [PubMed]
  47. Heath, R.L.; Packer, L. Photoperoxidation in Isolated Chloroplasts. I. Kinetics and Stoichiometry of Fatty Acid Peroxidation. Arch. Biochem. Biophys. 1968, 125, 189–198. [Google Scholar] [CrossRef]
  48. Duarte, B.; Caçador, I.; Matos, A.R. Lipid Landscape Remodelling in Sarcocornia Fruticosa Green and Red Physiotypes. Plant Physiol. Biochem. 2020, 157, 128–137. [Google Scholar] [CrossRef] [PubMed]
  49. Mendiburu, F.; Simon, R.; De Mendiburu, F. Agricolae-Ten Years of an Open Source Statistical Tool for Experiments in Breeding, Agriculture and Biology. PeerJ PrePrints 2015. [Google Scholar] [CrossRef]
  50. Clarke, K.; Gorley, R.N. Primer v6: User Manual/Tutorial; PRIMER-E Ltd.: Plymouth, UK, 2006. [Google Scholar]
  51. Duarte, B.; Santos, D.; Marques, J.C.; Caçador, I. Biophysical Probing of Spartina Maritima Photo-System II Changes during Prolonged Tidal Submersion Periods. Plant Physiol. Biochem. 2014, 77, 122–132. [Google Scholar] [CrossRef] [Green Version]
  52. Bussotti, F.; Gerosa, G.; Digrado, A.; Pollastrini, M. Selection of Chlorophyll Fluorescence Parameters as Indicators of Photosynthetic Efficiency in Large Scale Plant Ecological Studies. Ecol. Indic. 2020, 108, 105686. [Google Scholar] [CrossRef]
  53. Wen, X.; Qiu, N.; Lu, Q.; Lu, C. Enhanced Thermotolerance of Photosystem II in Salt-Adapted Plants of the Halophyte Artemisia Anethifolia. Planta 2005, 220, 486–497. [Google Scholar] [CrossRef]
  54. Krüger, G.H.J.; De Villiers, M.F.; Strauss, A.J.; de Beer, M.; van Heerden, P.D.R.; Maldonado, R.; Strasser, R.J. Inhibition of Photosystem II Activities in Soybean (Glycine Max) Genotypes Differing in Chilling Sensitivity. S. Afr. J. Bot. 2014, 95, 85–96. [Google Scholar] [CrossRef] [Green Version]
  55. Duarte, B.; Matos, A.R.; Caçador, I. Photobiological and Lipidic Responses Reveal the Drought Tolerance of Aster Tripolium Cultivated under Severe and Moderate Drought: Perspectives for Arid Agriculture in the Mediterranean. Plant Physiol. Biochem. 2020, 154, 304–315. [Google Scholar] [CrossRef]
  56. Montgomery, B.L. The Regulation of Light Sensing and Light-Harvesting Impacts the Use of Cyanobacteria as Biotechnology Platforms. Front. Bioeng. Biotechnol. 2014, 2, 22. [Google Scholar] [CrossRef] [Green Version]
  57. Duarte, B.; Cabrita, M.T.; Gameiro, C.; Matos, A.R.; Godinho, R.; Marques, J.C.; Caçador, I. Disentangling the Photochemical Salinity Tolerance in Aster Tripolium, L.: Connecting Biophysical Traits with Changes in Fatty Acid Composition. Plant Biol. 2017, 19, 239–248. [Google Scholar] [CrossRef]
  58. Cruz de Carvalho, R.; Feijão, E.; Duarte, I.; Pinto, V.; Silva, M.; Matos, A.R.; da Silva, A.B.; Caçador, I.; Reis-Santos, P.; Fonseca, V.F.; et al. Ecoengineering Solutions for the Impairment of Spreading and Growth of Invasive Spartina Patens in Mediterranean Salt Marshes. Front. Mar. Sci. 2021, 8, 1220. [Google Scholar] [CrossRef]
  59. Duarte, B.; Feijão, E.; de Carvalho, R.C.; Duarte, I.A.; Silva, M.; Matos, A.R.; Cabrita, M.T.; Novais, S.C.; Lemos, M.F.L.; Marques, J.C.; et al. Effects of Propranolol on Growth, Lipids and Energy Metabolism and Oxidative Stress Response of Phaeodactylum Tricornutum. Biology 2020, 9, 478. [Google Scholar] [CrossRef] [PubMed]
  60. Murata, N.; Takahashi, S.; Nishiyama, Y.; Allakhverdiev, S.I. Photoinhibition of Photosystem II under Environmental Stress. Biochim. Biophys. Acta-Bioenerg. 2007, 1767, 414–421. [Google Scholar] [CrossRef] [PubMed] [Green Version]
  61. Kulundžić, A.M.; Vuletić, M.V.; Kočar, M.M.; Mijić, A.; Varga, I.; Sudarić, A.; Cesar, V.; Lepeduš, H. The Combination of Increased Temperatures and High Irradiation Causes Changes in Photosynthetic Efficiency. Plants 2021, 10, 2076. [Google Scholar] [CrossRef]
  62. Vuletić, M.V.; Mihaljević, I.; Tomaš, V.; Horvat, D.; Zdunić, Z.; Vuković, D. Physiological Response to Short-Term Heat Stress in the Leaves of Traditional and Modern Plum (Prunus domestica L.) Cultivars. Horticulturae 2022, 8, 72. [Google Scholar] [CrossRef]
  63. Strasser, B.J. Donor Side Capacity of Photosystem II Probed by Chlorophyll a Fluorescence Transients. Photosynth. Res. 1997, 52, 147–155. [Google Scholar] [CrossRef]
  64. Diner, B.A.; Wollman, F.-A. Biosynthesis of Photosystem II Reaction Centers, Antenna and Plastoquinone Pool in Greening Cells of Cyanidium Caldarium Mutant III-C. Plant Physiol. 1979, 63, 26. [Google Scholar] [CrossRef] [Green Version]
  65. Clarke, S.J.; Lamont, K.J.; Pan, H.Y.; Barry, L.A.; Hall, A.; Rogiers, S.Y. Spring Root-Zone Temperature Regulates Root Growth, Nutrient Uptake and Shoot Growth Dynamics in Grapevines. Aust. J. Grape Wine Res. 2015, 21, 479–489. [Google Scholar] [CrossRef]
  66. Verdenal, T.; Dienes-Nagy, Á.; Spangenberg, J.E.; Zufferey, V.; Spring, J.L.; Viret, O.; Marin-Carbonne, J.; van Leeuwen, C. Understanding and Managing Nitrogen Nutrition in Grapevine: A Review. OENO ONE 2021, 55, 1–43. [Google Scholar] [CrossRef]
  67. Chapman, A.R.O.; Craigie, J.S. Seasonal Growth in Laminaria Longicruris: Relations with Dissolved Inorganic Nutrients and Internal Reserves of Nitrogen. Mar. Biol. 1977, 40, 197–205. [Google Scholar] [CrossRef]
  68. Imai, K.; Suzuki, Y.; Mae, T.; Makino, A. Changes in the Synthesis of Rubisco in Rice Leaves in Relation to Senescence and N Influx. Ann. Bot. 2008, 101, 135. [Google Scholar] [CrossRef]
  69. Allakhverdiev, S.I.; Kreslavski, V.D.; Klimov, V.V.; Los, D.A.; Carpentier, R.; Mohanty, P. Heat Stress: An Overview of Molecular Responses in Photosynthesis. Photosynth. Res. 2008, 98, 541–550. [Google Scholar] [CrossRef]
  70. Sharkey, T.D. Effects of Moderate Heat Stress on Photosynthesis: Importance of Thylakoid Reactions, Rubisco Deactivation, Reactive Oxygen Species, and Thermotolerance Provided by Isoprene. Plant Cell Environ. 2005, 28, 269–277. [Google Scholar] [CrossRef]
  71. Sakuraba, Y. Molecular Basis of Nitrogen Starvation-Induced Leaf Senescence. Front. Plant Sci. 2022, 13, 3729. [Google Scholar] [CrossRef]
  72. Keren, N.; Berg, A.; Van Kan, P.J.M.; Levanon, H.; Ohad, I. Mechanism of Photosystem II Photoinactivation and D1 Protein Degradation at Low Light: The Role of Back Electron Flow. Proc. Natl. Acad. Sci. USA 1997, 94, 1579–1584. [Google Scholar] [CrossRef] [Green Version]
  73. Jahns, P.; Holzwarth, A.R. The Role of the Xanthophyll Cycle and of Lutein in Photoprotection of Photosystem II. Biochim. Biophys. Acta 2012, 1817, 182–193. [Google Scholar] [CrossRef] [Green Version]
  74. Demmig-Adams, B. Carotenoids and Photoprotection in Plants: A Role for the Xanthophyll Zeaxanthin. Biochim. Biophys. Acta-Bioenerg. 1990, 1020, 1–24. [Google Scholar] [CrossRef]
  75. Demmig-Adams, B.; Adams, W.W. Photoprotection and Other Responses of Plants to High Light Stress. Annu. Rev. Plant Physiol. Plant Mol. Biol. 1992, 43, 599–626. [Google Scholar] [CrossRef]
  76. Duarte, B.; Santos, D.; Marques, J.C.; Caçador, I. Ecophysiological Adaptations of Two Halophytes to Salt Stress: Photosynthesis, PS II Photochemistry and Anti-Oxidant Feedback—Implications for Resilience in Climate Change. Plant Physiol. Biochem. 2013, 67, 178–188. [Google Scholar] [CrossRef]
  77. Tiwari, M.; Kumar, R.; Min, D.; Jagadish, S.V.K. Genetic and Molecular Mechanisms Underlying Root Architecture and Function under Heat Stress—A Hidden Story. Plant Cell Environ. 2022, 45, 771–788. [Google Scholar] [CrossRef] [PubMed]
  78. Rojas-Tapias, D.; Moreno-Galván, A.; Pardo-Díaz, S.; Obando, M.; Rivera, D.; Bonilla, R. Effect of Inoculation with Plant Growth-Promoting Bacteria (PGPB) on Amelioration of Saline Stress in Maize (Zea Mays). Appl. Soil Ecol. 2012, 61, 264–272. [Google Scholar] [CrossRef]
  79. Venios, X.; Korkas, E.; Nisiotou, A.; Banilas, G. Grapevine Responses to Heat Stress and Global Warming. Plants 2020, 9, 1754. [Google Scholar] [CrossRef] [PubMed]
  80. Rienth, M.; Torregrosa, L.; Luchaire, N.; Chatbanyong, R.; Lecourieux, D.; Kelly, M.T.; Romieu, C. Day and Night Heat Stress Trigger Different Transcriptomic Responses in Green and Ripening Grapevine (Vitis Vinifera) Fruit. BMC Plant Biol. 2014, 14, 108. [Google Scholar] [CrossRef] [Green Version]
  81. Ojuederie, O.B.; Olanrewaju, O.S.; Babalola, O.O. Plant Growth Promoting Rhizobacterial Mitigation of Drought Stress in Crop Plants: Implications for Sustainable Agriculture. Agronomy 2019, 9, 712. [Google Scholar] [CrossRef] [Green Version]
  82. Hayat, S.; Hayat, Q.; Alyemeni, M.N.; Wani, A.S.; Pichtel, J.; Ahmad, A. Role of Proline under Changing Environments: A Review. Plant Signal. Behav. 2012, 7, 1456. [Google Scholar] [CrossRef] [Green Version]
  83. Verbruggen, N.; Hermans, C. Proline Accumulation in Plants: A Review. Amino Acids 2008, 35, 753–759. [Google Scholar] [CrossRef]
  84. Lugtenberg, B.J.J.; Malfanova, N.; Kamilova, F.; Berg, G. Plant Growth Promotion by Microbes. Mol. Microb. Ecol. Rhizosphere 2013, 2, 559–573. [Google Scholar] [CrossRef]
  85. Shaffique, S.; Khan, M.A.; Wani, S.H.; Pande, A.; Imran, M.; Kang, S.M.; Rahim, W.; Khan, S.A.; Bhatta, D.; Kwon, E.H.; et al. A Review on the Role of Endophytes and Plant Growth Promoting Rhizobacteria in Mitigating Heat Stress in Plants. Microorganisms 2022, 10, 1286. [Google Scholar] [CrossRef]
  86. Rajput, V.D.; Harish; Singh, R.K.; Verma, K.K.; Sharma, L.; Quiroz-Figueroa, F.R.; Meena, M.; Gour, V.S.; Minkina, T.; Sushkova, S.; et al. Recent Developments in Enzymatic Antioxidant Defence Mechanism in Plants with Special Reference to Abiotic Stress. Biology 2021, 10, 267. [Google Scholar] [CrossRef] [PubMed]
  87. Alves Da Costa, P.H.; De Azevedo Neto, A.D.; Bezerra, M.A.; Prisco, J.T.; Gomes-Filho, E. Antioxidant-Enzymatic System of Two Sorghum Genotypes Differing in Salt Tolerance. Brazilian J. Plant Physiol. 2005, 17, 353–362. [Google Scholar] [CrossRef]
  88. Duarte, B.; Feijão, E.; Cruz de Carvalho, R.; Matos, A.R.; Cabrita, M.T.; Novais, S.C.; Moutinho, A.; Lemos, M.F.L.; Marques, J.C.; Caçador, I.; et al. Effect Biomarkers of the Widespread Antimicrobial Triclosan in a Marine Model Diatom. Antioxidants 2022, 11, 1442. [Google Scholar] [CrossRef] [PubMed]
  89. Feijão, E.; Cruz de Carvalho, R.; Duarte, I.A.; Matos, A.R.; Cabrita, M.T.; Novais, S.C.; Lemos, M.F.L.; Caçador, I.; Marques, J.C.; Reis-Santos, P.; et al. Fluoxetine Arrests Growth of the Model Diatom Phaeodactylum Tricornutum by Increasing Oxidative Stress and Altering Energetic and Lipid Metabolism. Front. Microbiol. 2020, 11, 1803. [Google Scholar] [CrossRef] [PubMed]
  90. Mitra, D.; Díaz Rodríguez, A.M.; Parra Cota, F.I.; Khoshru, B.; Panneerselvam, P.; Moradi, S.; Sagarika, M.S.; Anđelković, S.; de los Santos-Villalobos, S.; Das Mohapatra, P.K. Amelioration of Thermal Stress in Crops by Plant Growth-Promoting Rhizobacteria. Physiol. Mol. Plant Pathol. 2021, 115, 101679. [Google Scholar] [CrossRef]
  91. Ilangumaran, G.; Smith, D.L. Plant Growth Promoting Rhizobacteria in Amelioration of Salinity Stress: A Systems Biology Perspective. Front. Plant Sci. 2017, 8, 1768. [Google Scholar] [CrossRef] [Green Version]
  92. Goellner, K.; Conrath, U. Priming: It’s All the World to Induced Disease Resistance. Eur. J. Plant Pathol. 2008, 121, 233–242. [Google Scholar] [CrossRef]
  93. Akhtar, M.S.; Siddiqui, Z.A. Role of Plant Growth Promoting Rhizobacteria in Biocontrol of Plant Diseases and Sustainable Agriculture. Plant Growth Health Promot. Bact. 2010, 18, 157–195. [Google Scholar] [CrossRef]
  94. Bejarano, A.; Sauer, U.; Preininger, C. Design and Development of a Workflow for Microbial Spray Formulations Including Decision Criteria. Appl. Microbiol. Biotechnol. 2017, 101, 7335–7346. [Google Scholar] [CrossRef]
  95. Vuolo, F.; Novello, G.; Bona, E.; Gorrasi, S.; Gamalero, E. Impact of Plant-Beneficial Bacterial Inocula on the Resident Bacteriome: Current Knowledge and Future Perspectives. Microorganisms 2022, 10, 2462. [Google Scholar] [CrossRef]
  96. Afanador-Barajas, L.N.; Navarro-Noya, Y.E.; Luna-Guido, M.L.; Dendooven, L. Impact of a Bacterial Consortium on the Soil Bacterial Community Structure and Maize (Zea mays L.) Cultivation. Sci. Rep. 2021, 11, 13092. [Google Scholar] [CrossRef]
  97. Nuzzo, A.; Satpute, A.; Albrecht, U.; Strauss, S.L. Impact of Soil Microbial Amendments on Tomato Rhizosphere Microbiome and Plant Growth in Field Soil. Microb. Ecol. 2020, 80, 398–409. [Google Scholar] [CrossRef]
  98. Sharma, R.; Paliwal, J.S.; Chopra, P.; Dogra, D.; Pooniya, V.; Bisaria, V.S.; Swarnalakshmi, K.; Sharma, S. Survival, Efficacy and Rhizospheric Effects of Bacterial Inoculants on Cajanus Cajan. Agric. Ecosyst. Environ. 2017, 240, 244–252. [Google Scholar] [CrossRef]
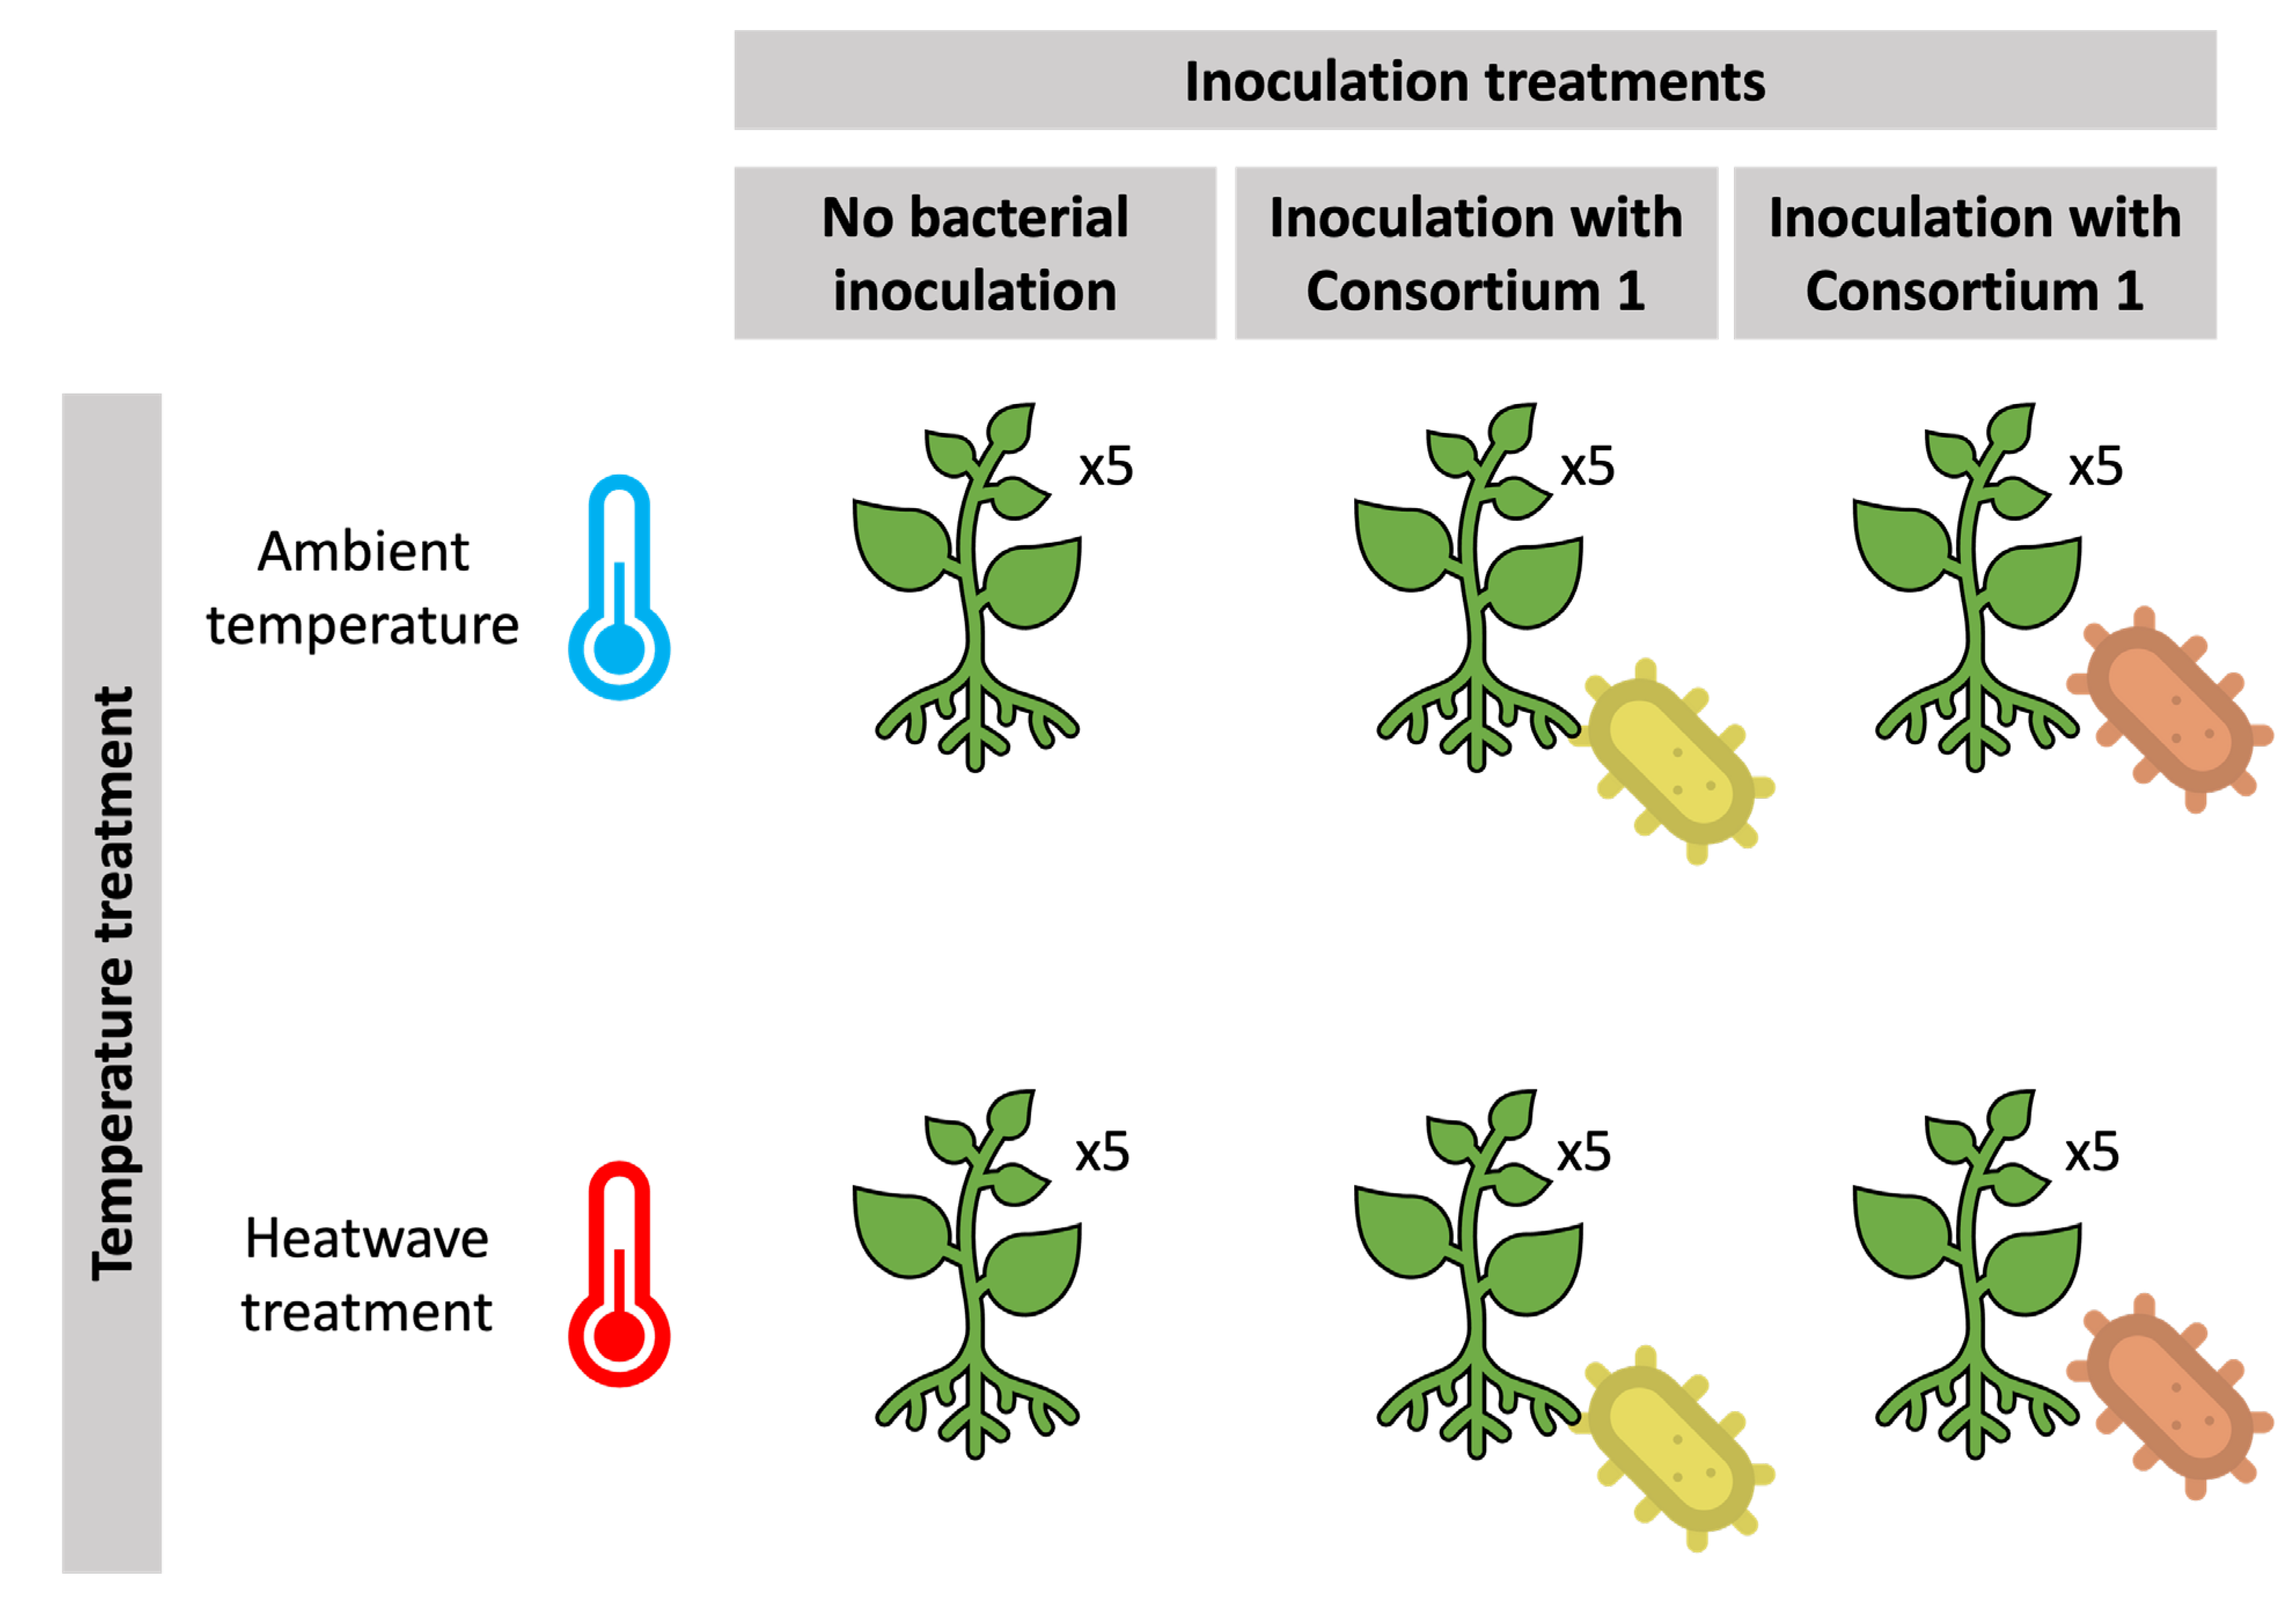
Figure 1. Experimental design of the thermal and inoculation treatments applied.
Microorganisms 11 00856 g001
Figure 2. Leaf surface temperature measured through infrared thermography of non-inoculated (−I) and marine PGPR consortia 1- and 2-inoculated (+I) Vitis vinifera plants, under normal (control) thermal regimes and exposed to the heatwave (HW) (average ± standard deviation, N = 5, letter denotes significant differences at p < 0.05).
Microorganisms 11 00856 g002
Figure 3. Kautsky fluorescence induction curves of non-inoculated (−I) and marine PGPR consortia 1- and 2-inoculated (+I) Vitis vinifera dark-adapted leaves, under normal (control) thermal regimes and exposed to heatwave (HW) (N = 5, average).
Microorganisms 11 00856 g003
Figure 4. Imaging pulse amplitude modulated (iPAM) fluorescence derived parameter images: PS II quantum yield (Fv/Fm), absorbed (ABS/RC), trapped (TR0/RC), transported (ET0/RC) and dissipated (DI0/RC) energy fluxes on a reaction centre basis relative to dark-adapted non-inoculated and marine PGPR consortia 1- and 2-inoculated Vitis vinifera leaves, under normal (control) thermal regimes and exposed to the heatwave.
Microorganisms 11 00856 g004
Figure 5. OJIP derived parameters: (A) PSII quantum yield (Fv/Fm), (B) K-band amplitude, (C) net rate of PS II reaction centre closure (M0), (D) size of the oxidized quinone pool (QOP), (E) the energy needed to close all reaction centres (SM), (F) total number of electrons transferred into the electron transport chain (N), (G) the probability that a PSII chlorophyll molecule functions as an RC (γRC), (H) PS I efficiency in reducing its electron acceptors (δR0), (I) PS II/PS I Equilibrium in non-inoculated (−I) and marine PGPR consortia 1- and 2-inoculated (+I) Vitis vinifera dark-adapted leaves, under normal (control) thermal regimes and exposed to the heatwave (HW) (average ± standard deviation, N = 5, letter denotes significant differences at p < 0.05).
Microorganisms 11 00856 g005
Figure 6. Reaction centre-based energetic parameters: (A) absorbed (ABS/RC), (B) trapped (TR/RC), (C) electron transport (ET/RC), (D) dissipation (DI/RC) energy fluxes by reaction centre and (E) reaction centre density within the PS II antennae (RC/ABS), (F) performance index (PI), (G) structural and functional index for photosynthesis (SFI), (H) non-photosynthetic or dissipation structural and functional index (SFINPQ) in non-inoculated (−I) and marine PGPR consortia 1- and 2-inoculated (+I) Vitis vinifera dark-adapted leaves, under normal (control) thermal regimes and exposed to the heatwave (HW) (average ± standard deviation, N = 5, letter denotes significant differences at p < 0.05).
Microorganisms 11 00856 g006
Figure 7. Leaves (A) water content (WC) and (B) proline concentrations of non-inoculated (−I) and marine PGPR consortia 1- and 2-inoculated (+I) Vitis vinifera, under normal (control) thermal regimes and exposed to the heatwave (HW) (average ± standard deviation, N = 5, letter denotes significant differences at p < 0.05).
Microorganisms 11 00856 g007
Figure 8. Oxidative stress biomarkers, (A) catalase (CAT), (B) ascorbate peroxidase (APx), (C) guaiacol peroxidase (GPx), (D) superoxide dismutase (SOD) activities (U mg−1 protein), (E) oxidative ratio and (F) thiobarbituric acid reactive substances (TBARS; µM MDA g−1 FW) in non-inoculated (−I) and marine PGPR consortia 1- and 2-inoculated (+I) Vitis vinifera leaves, under normal (control) thermal regimes and exposed to the heatwave (HW) (average ± standard deviation, N = 5, letter denote significant differences at p < 0.05).
Microorganisms 11 00856 g008
Figure 9. (A) Individual fatty acid and saturation class relative concentrations (monounsaturated fatty acids (MUFA)); polyunsaturated fatty acids (PUFA); saturated fatty acids (SFA); unsaturated fatty acids (UFA)); (B) total fatty acid content (TFA); (C) double bound index (DBI); (D) UFA/SFA ratio; (E) PUFA/SFA ratio in leaves of non-inoculated (−I) and marine PGPR consortia 1- and 2- inoculated (+I) Vitis vinifera, under normal (control) thermal regimes and exposed to heatwave (HW) (average ± standard deviation, N = 5, letter denotes significant differences at p < 0.05).
Microorganisms 11 00856 g009
Figure 10. Canonical analysis of principal components (CAP) having as a basis, (A) the plant’s photochemistry, (B) pigment concentrations, (C) oxidative stress biomarker and (D) fatty acid concentration of non-inoculated (−I) and marine PGPR consortia 1- and 2-inoculated (+I) Vitis vinifera leaves, under normal (control) thermal regimes and exposed to heatwave (HW) (average ± standard deviation, N = 5, letter denotes significant differences at p < 0.05).
Microorganisms 11 00856 g010
Table 2. Relative concentrations of pigments (µg g−1 FW): chlorophyll a (Chl a), chlorophyll b (Chl b), total chlorophyll (TChl), pheophytin a (Pheo a), total carotenoid (Tcarot), β-carotenoids (βcarot), antheraxanthin (Anthe), lutein, violaxanthin (Viola) and zeaxanthin (Zea); de-epoxidation state (DES), chlorophyll a/b ratio (Chl a/b), total carotenoid to total chlorophyll ratio (TCar/TChl) and chlorophyll degradation index (CDI), in non-inoculated (−I) and marine PGPR consortia 1- and 2- inoculated (+I) Vitis vinifera, under normal (control) thermal regimes and exposed to the heatwave (HW) (average ± standard deviation, N = 5, letter denotes significant differences at p < 0.05).
Chl aChl bTChlPheo aTcarotβcarotAntheLuteinViolaZeaDESChl a/bTcar/TChlCDI
C −I851.8 ± 159.4 bc367.1 ± 130.1 ab1219.0 ± 286.1 bc147.1 ± 105.1 a359.6 ± 62.9 ab51.1 ± 9.4 ab42.3 ± 7.53 a62.6 ± 9.1 ab61.0 ± 14.8 a114.0 ± 38.3 ab0.482 ± 0.065 a2.420 ± 0.364 ab0.298 ± 0.018 a0.163 ± 0.082 a
+I1702.4 ± 131.0 c261.0 ± 47.0 b963.4 ± 172.1 c104.9 ± 56.7 a255.7 ± 35.4 b38.5 ± 9.4 b28.7 ± 9.93 a52.4 ± 10.8 b32.8 ± 12.3 a56.6 ± 9.9 b0.519 ± 0.071 a2.700 ± 0.267 a0.268 ± 0.024 a0.129 ± 0.058 a
+I2923.2 ± 140.5 abc340.1 ± 80.2 ab1263.3 ± 220.5 abc70.6 ± 37.5 a363.9 ± 75.3 ab46.7 ± 7.0 ab44.3 ± 6.43 a66.7 ± 13.2 ab58.0 ± 32.8 a119.2 ± 28.5 ab0.452 ± 0.068 a2.756 ± 0.228 a0.287 ± 0.012 ab0.070 ± 0.028 a
HW−I1083.3 ± 287.6 ab492.0 ± 127.7 a1575.3 ± 413.3 ab151.8 ± 72.6 a445.4 ± 112.0 a55.5 ± 11.6 ab45.9 ± 9.33 a77.9 ± 26.3 ab56.6 ± 30.5 a165.1 ± 25.4 a0.374 ± 0.062 a2.203 ± 0.136 b0.284 ± 0.024 ab0.119 ± 0.048 a
+I11024.9 ± 65.2 ab505.7 ± 46.3 a1530.5 ± 89.5 ab152.1 ± 32.2 a396.1 ± 33.3 a44.4 ± 9.2 ab40.9 ± 6.03 a77.3 ± 11.7 ab71.2 ± 25.4 a137.7 ± 26.6 a0.447 ± 0.080 a2.039 ± 0.215 b0.259 ± 0.012 ab0.129 ± 0.026 a
+I21325.7 ± 273.5 a554.5 ± 144.2 a1880.2 ± 417.2 a132.8 ± 25.1 a461.4 ± 95.5 a56.7 ± 11.3 a48.3 ± 9.33 a90.4 ± 22.73 a76.7 ± 27.0 a165.9 ± 42.2 a0.427 ± 0.046 a2.417 ± 0.131 ab0.246 ± 0.010 c0.093 ± 0.017 a
Disclaimer/Publisher’s Note: The statements, opinions and data contained in all publications are solely those of the individual author(s) and contributor(s) and not of MDPI and/or the editor(s). MDPI and/or the editor(s) disclaim responsibility for any injury to people or property resulting from any ideas, methods, instructions or products referred to in the content.