Article

Improved Quantitative Real-Time PCR Protocol for Detection and Quantification of Methanogenic Archaea in Stool Samples

1
Department of Pathology, The Children’s Memorial Health Institute, Av. Dzieci Polskich 20, 04-730 Warsaw, Poland
2
Department of Preclinical Sciences, Institute of Veterinary Medicine, Warsaw University of Life Sciences, St. Ciszewskiego 8, 02-786 Warsaw, Poland
*
Author to whom correspondence should be addressed.
Microorganisms 2023, 11(3), 660; https://doi.org/10.3390/microorganisms11030660
Submission received: 30 January 2023 / Revised: 24 February 2023 / Accepted: 2 March 2023 / Published: 5 March 2023
(This article belongs to the Special Issue Beneficial Microbes and Gastrointestinal Microbiota)

Abstract

:
Methanogenic archaea are an important component of the human and animal intestinal microbiota, and yet their presence is rarely reported in publications describing the subject. One of the methods of quantifying the prevalence of methanogens is quantitative real-time PCR (qPCR) of the methanogen-specific mcrA gene, and one of the possible reasons for detection failure is usually a methodology bias. Here, we refined the existing protocol by changing one of the primers and improving the conditions of the qPCR reaction. As a result, at the expense of a slightly lower yet acceptable PCR efficiency, the new assay was characterized by increased specificity and sensitivity and a wider linear detection range of 7 orders of magnitude. The lowest copy number of mcrA quantified at a frequency of 100% was 21 copies per reaction. The other validation parameters tested, such as reproducibility and linearity, also gave satisfactory results. Overall, we were able to minimize the negative impacts of primer dimerization and other cross-reactions on qPCR and increase the number of not only detectable but also quantifiable stool samples—or in this case, chicken droppings.

1. Introduction

Methanogenic archaea are one of the many natural residents of animal and human intestines [1,2]. They partake in hydrogen sink, a process of the utilization of hydrogen, a byproduct of intestinal microbial fermentation. It is known that, without hydrogen sink, the fermentation itself would slow down, thus depriving the host of various useful nutritious compounds [3]. Moreover, methanogens interact closely with other intestinal microbionts, and their absence may be an indicator of intestinal dysbiosis [1]. Methanogens may also influence their hosts in other ways. On the one hand, some archaea were reported to have a probiotic potential, such as Methanomassiliicoccus luminyensis B10 in treating trimethylaminuria (TMAU), i.e., the fish-odor syndrome [4], and Methanobrevibacter smithii in treating severe acute malnutrition [5]; on the other hand, species such as Methanosphaera stadtmanae may promote inflammation [6].
Of all methanogenic archaea, species of the genus Methanobrevibacter are known to be predominant methanogen taxa in the gastrointestinal tracts of animals and humans. In non-rumen animals, they are followed by Methanosphaera, Methanosarcina, Methanomassiliicoccus, and Methanimicrococcus. In chickens, Methanobrevibacter woesei is the only dominating genus. The rumen microbiota is significantly more diverse in terms of archaeal prevalence, with four main orders, i.e., Methanomicrobiales, Methanosarcinales, Methanobacteriales, and Methanomassiliicoccales [7].
It is estimated that methanogenic archaea account for 0.05–0.8% of the intestinal microbiota in humans, 4% of the rumen microbiota, and 1–2% of the chicken cecal microbiota [7,8,9]. However, since the detection of archaea is challenging, those data may not be precise. For instance, to date, many studies do not report the presence of archaea in the chicken ceca at all [10,11], whilst others say otherwise [12,13]. For this reason, chicken dropping samples were chosen as a model in this study.
It is not known whether the lack of reported archaea in the chicken intestinal microbiome is caused by their actual absence or the methodology limitations of those studies. Such limitations may include insufficient cell lysis during DNA isolation from archaea or an inadequate PCR protocol. The first issue was addressed in our previous study [14]; therefore, here, we decided to take a closer look at the subject of the ‘detection’ of methanogens via real-time PCR.
The detection of methanogenic archaea using real-time PCR is usually performed with the use of primers targeting either the 16S rDNA or the genes involved in methanogenesis, uniquely specific to methanogenic archaea, usually the mcrA gene encoding the alpha subunit of methyl-coenzyme M reductase [15]. The first target has a few major drawbacks. The 16S rDNA may not be selective enough to allow for the identification of only the methanogenic archaea and, therefore, for the undertaking of PCR on templates isolated directly from feces. The other drawback is related to the high scattering of the 16S rDNA copy number between the different taxa of archaea [16], which, as a result, does not allow for the quantification of these microbes in samples. Putting these facts together, the 16S rDNA seems the least preferred target for the quantification of methanogens in dropping or stool samples.
The mcrA gene, however, is a single-copy gene, which makes it ideal for quantification purposes [15]. The main difficulty in application comes from the fact that methanogenic archaea are very genetically diverse, and, therefore, finding a good location for primers along the mcrA gene and making sure that they comply with the rules of proper primer design can be challenging. Here, we addressed this issue and undertook exhaustive efforts in refining the existing protocol of the quantification of methanogenic archaea.

2. Materials and Methods

2.1. Primer Design

A total of 47 mcrA sequences of methanogenic archaea were selected from the NCBI GenBank database. The sequences were aligned by using the webPRANK tool [17] in order to identify the conserved regions (Table S1). Several potential forward primers were created, and they were checked together with the reverse primer mcrA-rev [18] (Table 1) in the Oligo Analyzer [19] and Primer-BLAST [20] tools with regard to their specificity and tendency to form secondary structures.

2.2. DNA Templates

The total genomic DNA of 3 genetically and taxonomically diverse reference strains of methanogens, i.e., Methanobrevibacter woesei DSM 11979, Methanococcus maripaludis DSM 2067, and Methanomicrobium mobile DSM 1539, was chosen as positive controls and standards. Moreover, since the BLAST analysis of the mcrA sequence demonstrated that Methanobrevibacter sp. D5 was the closest to the consensus of 26 methanogens (Methanobrevibacter spp. and environmental species; Table S2) in the binding site of the F3 primer, its 472 bp long mcrA gene fragment was picked out as a group representative and the fourth positive control. It was used in the form of a plasmid construct (mcrA_MB) carrying the 472 bp long mlas/mcrA-rev primer amplicon. For quantification purposes, the mcrA-positive (mcrA+) plasmid was linearized with the use of a single cutting VspI restriction enzyme (Thermo Fisher Scientific, Waltham, MA, USA). Then, in order to select only the linearized form, it was subjected to agarose gel electrophoresis. A band representing the linearized form was cut out, purified with a Basic DNA Purification Kit (EURx, Gdańsk, Poland), and diluted in a Tris buffer (10 mM Tris HCl, pH 8.5), as were all the other DNAs used in this study. In order to create 4 standard curves, all 3 archaeal DNAs and one mcrA+ plasmid were serially diluted 10-fold, from approx. 106 to 10−1 genome copies/µL.
The genomic DNA of 21 bacterial strains, i.e., Enterococcus avium ATCC 14025, Enterococcus casseliflavus ATCC 700327, Enterococcus raffinosus ATCC 49464 (courtesy of Dr. habil. Beata Dolka, Institute of Veterinary Medicine, Warsaw University of Life Sciences—SGGW), Lactobacillus sakei ATCC 15521 (courtesy of Dr. Ilona Stefańska, Institute of Veterinary Medicine, Warsaw University of Life Sciences—SGGW), Escherichia coli ATCC 8739, Salmonella enterica subsp. enterica serovar Typhimurium ATCC 14028, Clostridium septicum ATCC 12464, Blautia obeum DSM 25238, Ruminococcus gauvreauii DSM 19829, Helicobacter cinaedi DSM 5359, Desulfovibrio piger DSM 749, Proteus sp., Streptococcus sp., Streptococcus sp. (beta-hemolytic), Corynebacterium sp., Pseudomonas aeruginosa, Pasteurella sp., Klebsiella sp., Staphylococcus sp. (coagulase-negative), Porphyromonas sp., and Bacteroidetes bacterium, was the non-target control of PCR. The strains were purchased or received either in the form of DNA or a bacterial pellet, from which the DNA was isolated with the use of a Genomic Bacteria+ kit (A&A Biotechnology, Warsaw, Poland) according to the producer’s instructions. The concentrations of the controls were measured with a Quantus fluorometer and the QuantiFluor dsDNA System (Promega Corporation, Madison, WI, USA), and they were converted into the number of genome copies per µL by using the Science Primer web tool [22].
Lastly, 20 dropping samples collected from free-range chickens were subjected to DNA isolation with the use of a Genomic Mini AX Bacteria+ kit (A&A Biotechnology, Gdynia, Poland) and to mechanical lysis via sonication in accordance with the protocol described previously [14].

2.3. Initial Comparison of the Mlas and mcrA_F3 forward Primers
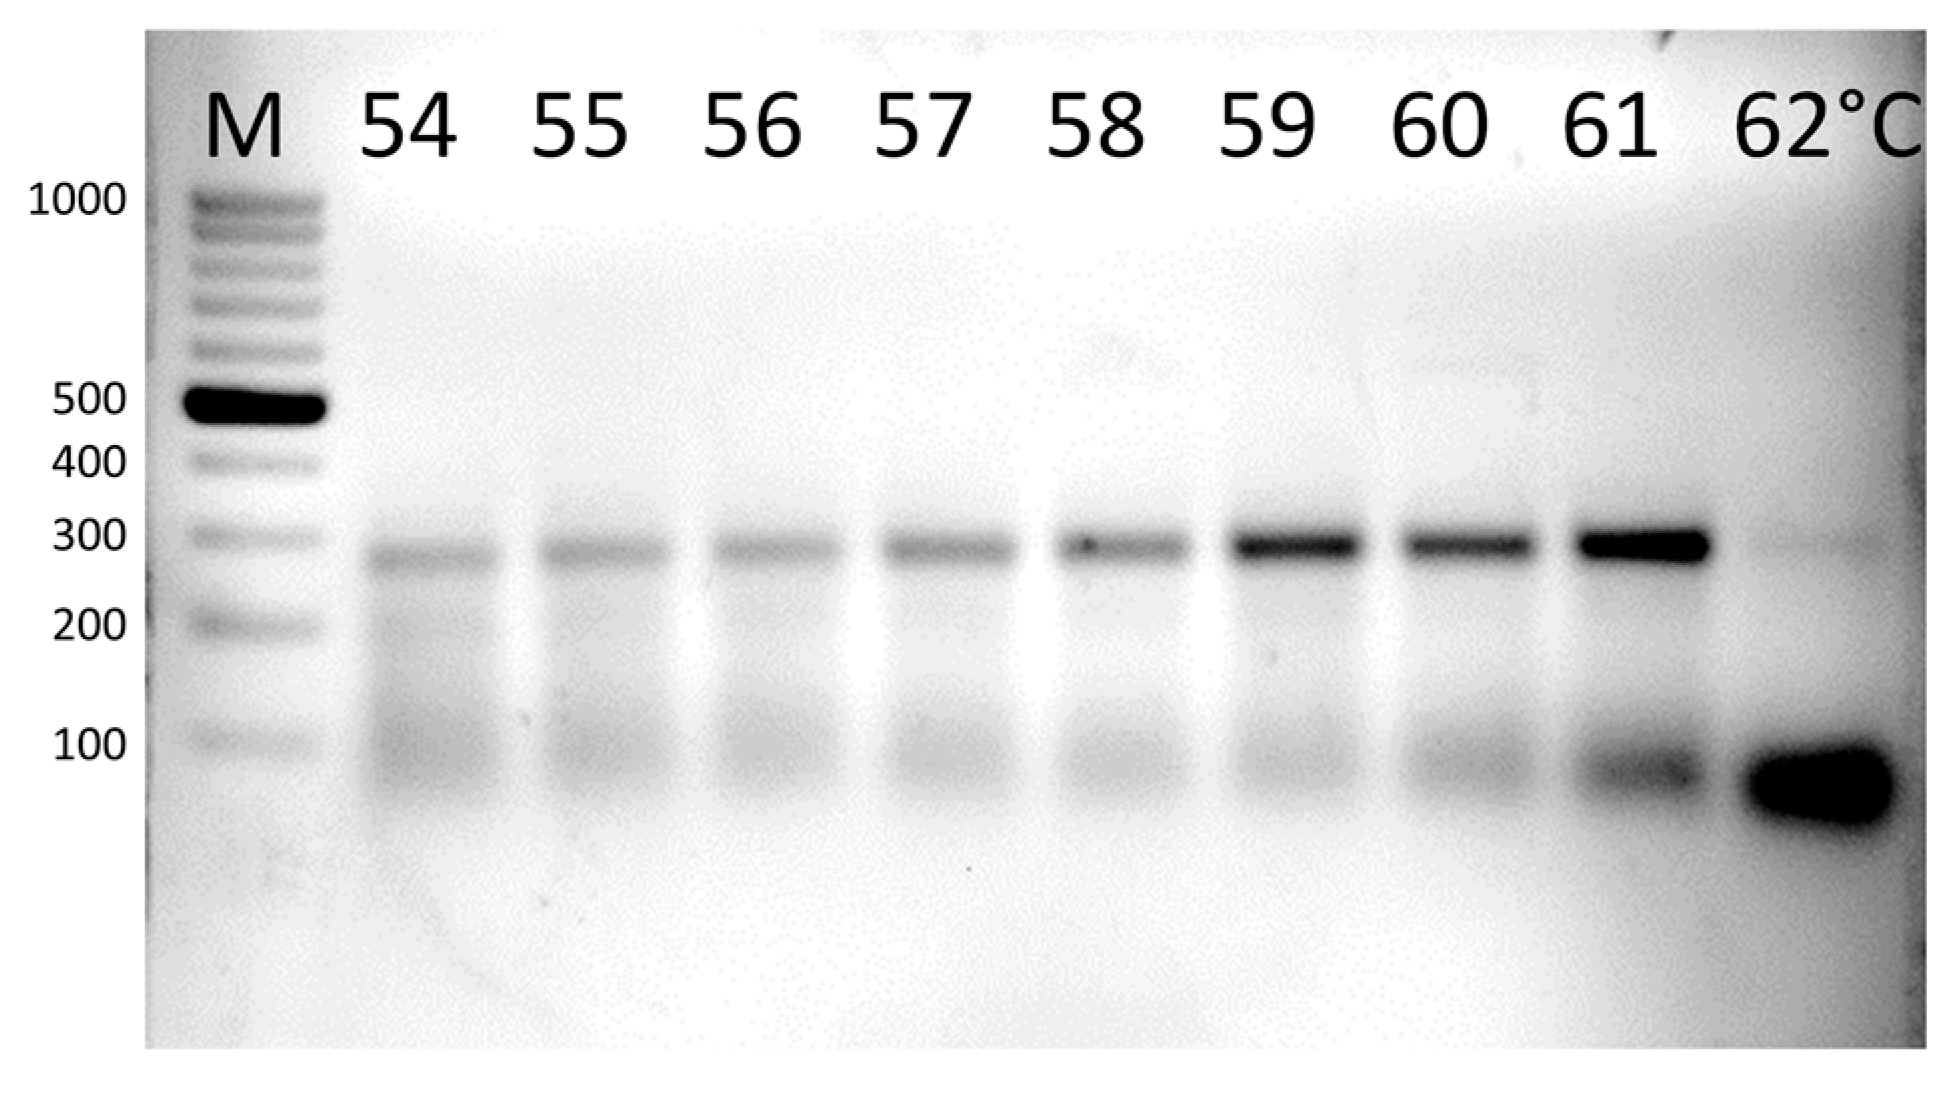
For unification purposes, the mcrA_F3/mcrA-rev and mlas/mcrA-rev primer pairs were compared with the use of the same reagents routinely used in our lab. The reaction mixture included 10 µL of RT HS-PCR Mix SYBR A (A&A Biotechnology, Gdynia, Poland), 0.5 µM of each primer (Table 1), 1 µL of mcrA+ plasmid in 10-fold dilutions, and water with BSA (3.5 µg per reaction) to reach a final volume of 20 µL. The reaction conditions closely resembled the conditions from the original study [18], and they were as follows: initial denaturation at 95 °C for 3 min; 45 cycles comprising denaturation at 95 °C for 30 s; annealing at 55 °C for 45 s; extension at 72 °C for 30 s; and fluorescence acquisition either at 81 °C or 83 °C after 20 s for mcrA_F3/mcrA-rev and mlas/mcrA-rev primer pairs, respectively. In contrast to the original publication, no additional preincubation at 37 °C or postincubation at 72 °C was implemented.

2.4. Gradient PCR

The reaction mixture included 15 µL of RT HS-PCR Mix SYBR A (A&A Biotechnology, Gdynia, Poland), 0.5 µM mcrA_F3 and mcrA-rev primers (Table 1), 6.24 × 10⁴ of mcrA+ plasmid, and water with BSA (3.5 µg per reaction) to reach a final volume of 30 µL. A gradient PCR with an annealing temperature between 54 and 62 °C was performed. The results were visualized using agarose gel electrophoresis.

2.5. Selected Validation Parameters of the Assays

The sensitivity and specificity of the assays were evaluated for standards from approx. 10−1 to 106 copies per reaction and for at least 7 runs. The intra- and inter-assay variability was tested in triplicate. Melting analyses were performed after every run to check the specificity of the assays.
In the SYBR Green detection approach, the reaction mixture included 10 µL of RT HS-PCR Mix SYBR A (A&A Biotechnology, Gdynia, Poland), 0.5 µM primers (Table 1), 1 µL of DNA, and water with BSA (3.5 µg per reaction) to reach a final volume of 20 µL. A real-time PCR was performed in which the slopes after denaturation and after annealing were set up to the universal value of 2.2 °C/s. The reaction conditions for the mlas/mcrA-rev primer pair were as follows: initial denaturation at 95 °C for 3 min, 45 cycles comprising denaturation at 95 °C for 30 s, annealing at 55 °C for 45 s, extension at 72 °C for 30 s, and fluorescence acquisition at 83 °C after 20 s. The reaction conditions for the mcrA_F3/mcrA-rev primer pair were as follows: initial denaturation at 95 °C for 3 min, 45 cycles comprising denaturation at 94 °C for 20 s, annealing at 60 °C for 20 s, extension at 72 °C for 20 s, and fluorescence acquisition at 81 °C after 20 s.

2.6. Detection of Methanogens in Chicken Dropping Samples

The DNA samples isolated from the chicken droppings were tested with the use of the mcrA_F3/mcrA-rev and mlas/mcrA-rev primer pairs as described above, with 100 to 200 ng of DNA used for the tests. The products were separated by using agarose gel electrophoresis in order to double check the specificity of the assays.

3. Results

3.1. Primer Design

A new forward primer (mcrA_F3) was designed approx. 176 bases downstream of the original forward primer (mlas), making future amplicons shorter and, therefore, presumably better for quantification purposes (Table 2).

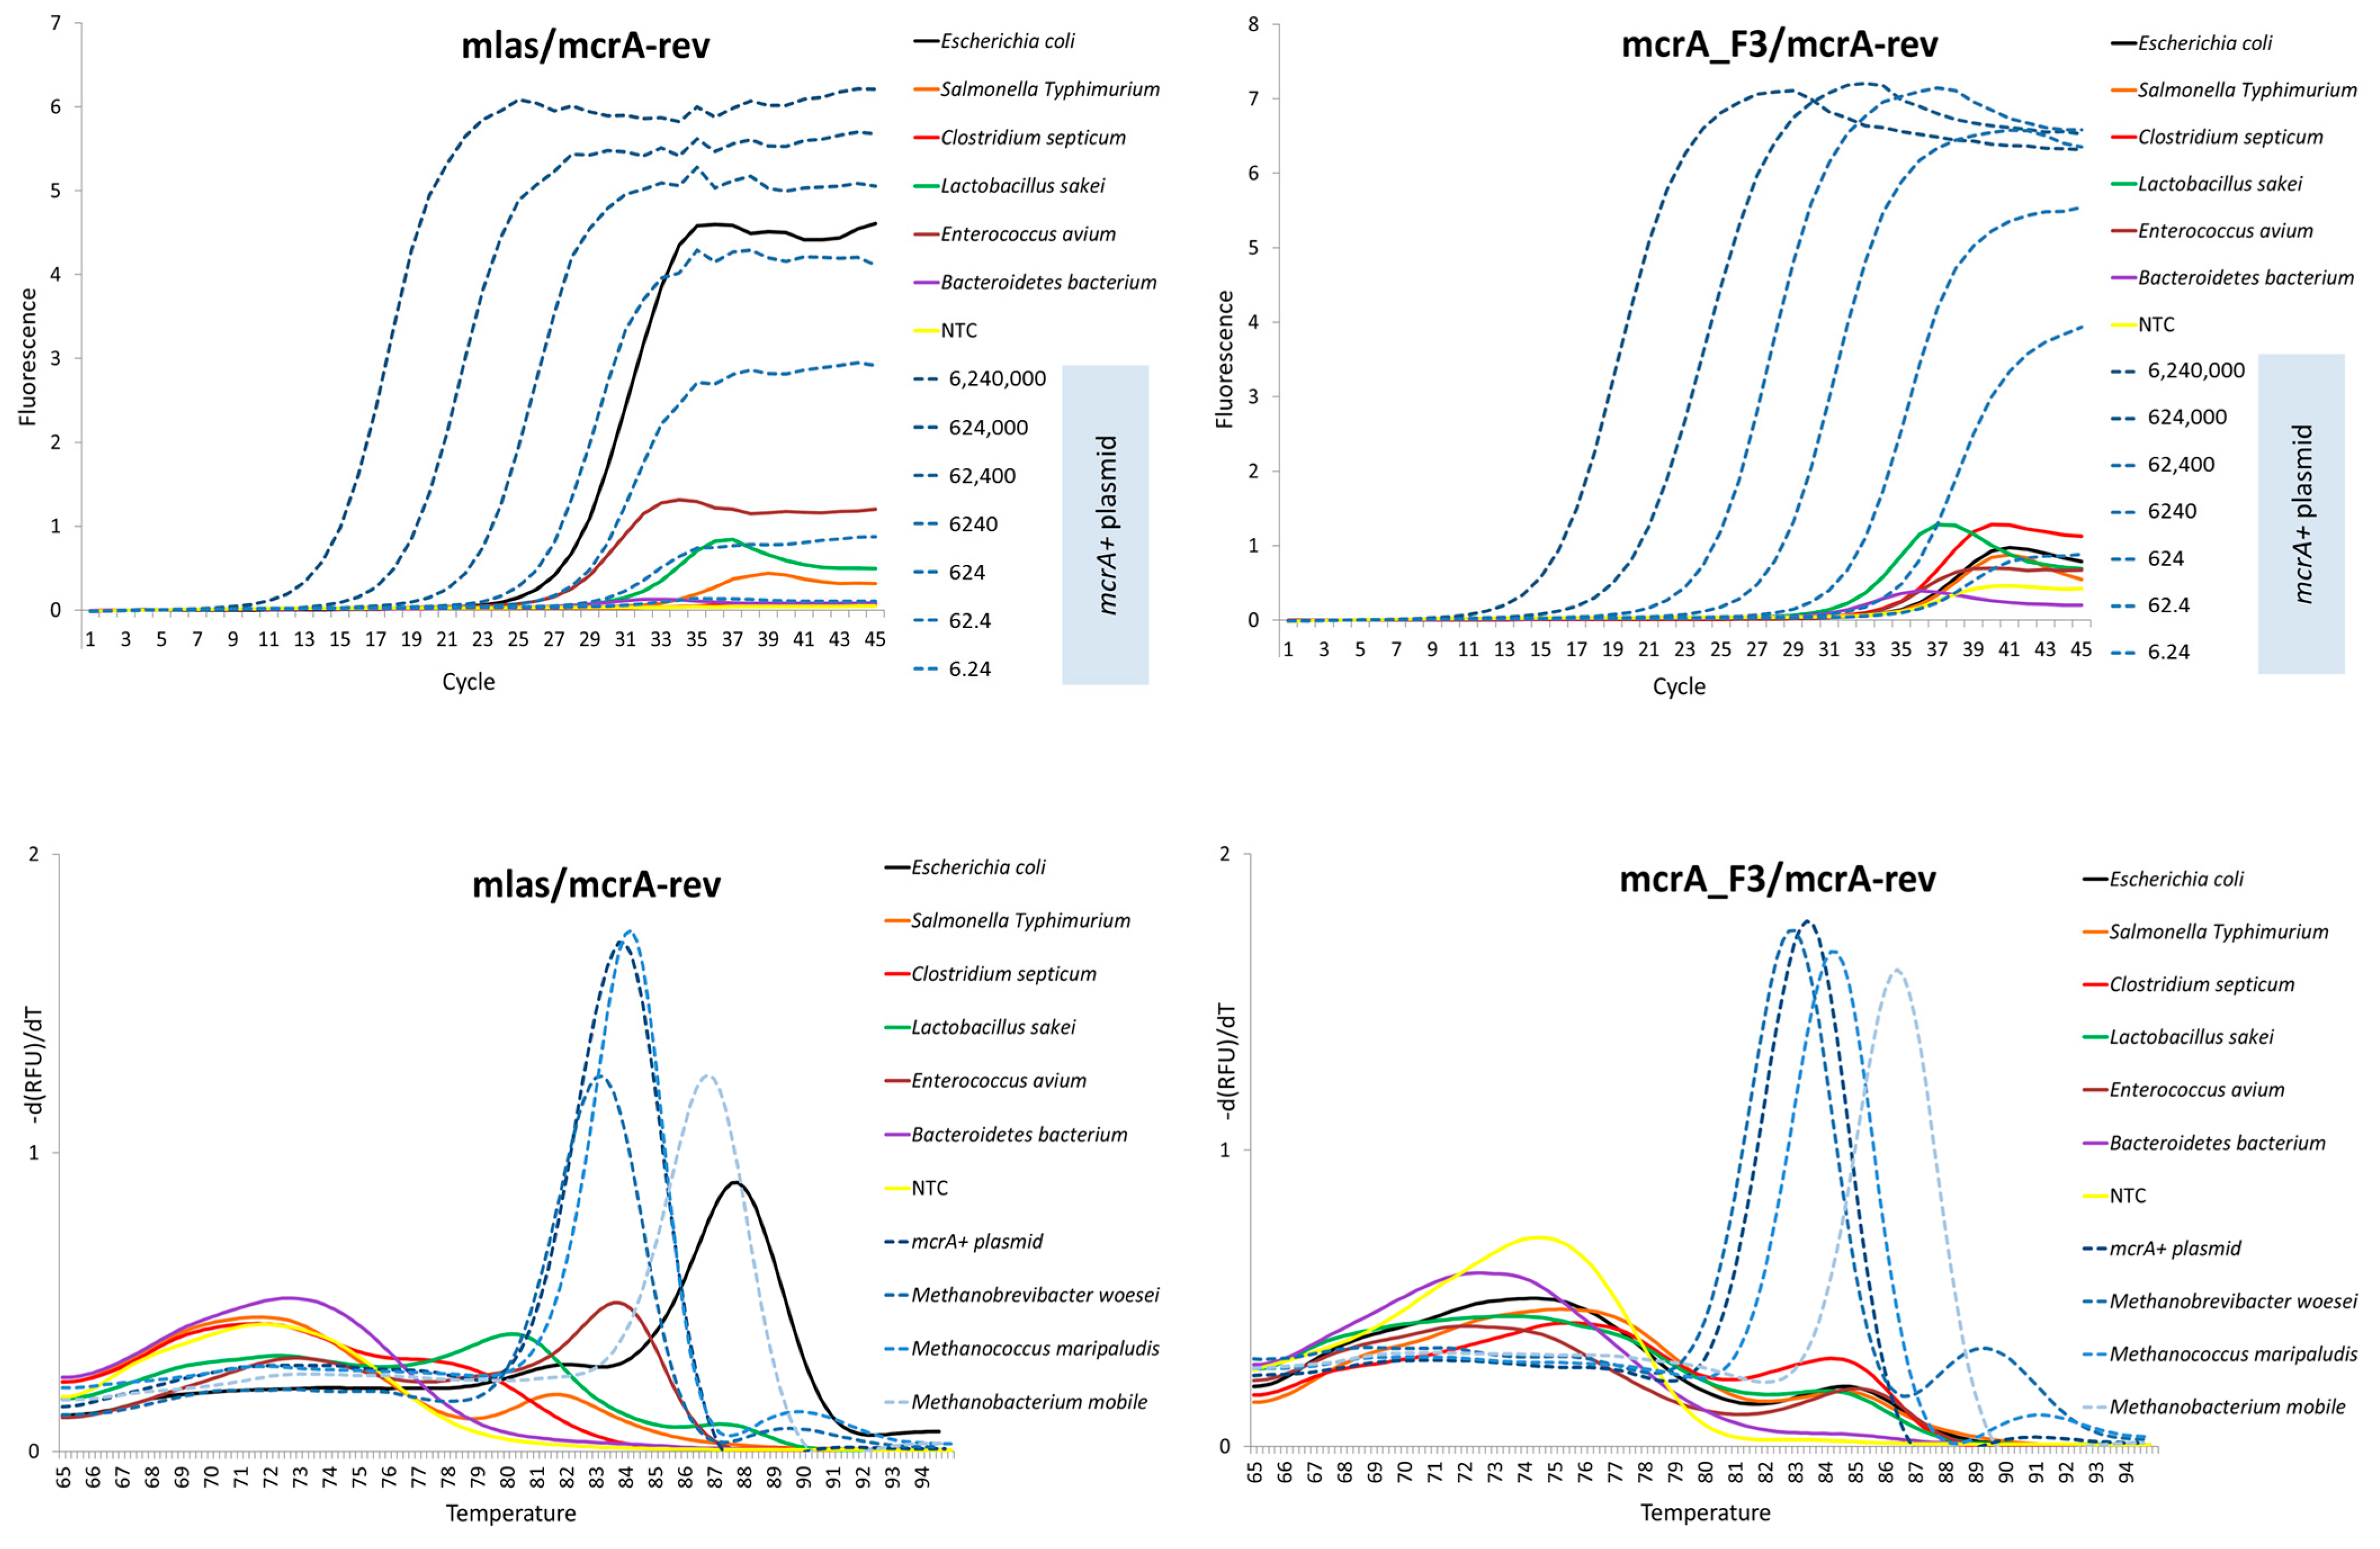
3.2. Initial Comparison of the Mlas and mcrA_F3 Forward Primers

Both primer pairs were compared under very similar temperature conditions and timings as presented in the original study in order to exclude any additional effects on the assay performance. Since the amplicons generated with the use of the mcrA_F3/mcrA-rev primer pair were shorter and had a slightly lower melting temperature (Tm), the temperature of fluorescence acquisition had to be adjusted—it was set to 81 °C instead of 83 °C.
At an annealing temperature of 55 °C, both primers performed similarly well in terms of Cq values for the five most concentrated dilutions of the mcrA+ plasmid (Figure 1). However, there was a profound difference in the shape and height of the amplification curves as the dilution ratio increased. In contrast to the original primer pair, the mcrA_F3/mcrA-rev pair generated curves that were well-pronounced until the last standard dilution, i.e., 6.24 copies of the mcrA+ plasmid per reaction. Since there was a minimal signal from the non-template control (NTC), an optimization of the real-time PCR conditions for the new primer pair was required to keep primer dimerization as minimal as possible.

3.3. Gradient PCR

The primer pair mcrA_F3/mcrA-rev performed best at an annealing temperature (Ta) in the range of 59–60 °C. Amplification at 61 °C and above resulted in increasing primer dimerization (Figure 2).

3.4. Selected Validation Parameters of the Assays

At approx. 101 copies per reaction, 100% of the replicates of all four standard DNAs tested positive using the mcrA_F3/mcrA-rev primer pair, whilst only three standard DNAs tested positive using the mlas/mcrA-rev primer pair (Table 3). The only exception—Methanomicrobium mobile—had two limits of detection determined for each primer pair separately, i.e., 5.71 × 10² (or 2.76 log10) and 5.71 × 101 (or 1.76 log10) copies per reaction using the original and the mcrA_F3/mcrA-rev primer pair, respectively.
Moreover, the mcrA_F3/mcrA-rev primer pair demonstrated a higher amplification specificity than the mlas/mcrA-rev primer pair, as it favored the generation of specific products over primer dimers, even at low concentrations of the target DNAs. This was especially noticeable in the case of Methanomicrobium mobile and the mcrA+ plasmid (Table 3; Figure 3).
Table 4 presents the reproducibility and efficiency of the assays. Only the Cq values for the specific reactions are reported. Efficiency within the acceptable range of 90 to 110% was observed in all cases. Amplification with the mcrA_F3/mcrA-rev primer pair occurred with lower efficiency, and it was more variable at lower template concentrations.
The dynamic range, referred to as the range of template input generating a linear curve (R2 ≥ 0.980) with acceptable efficiency, was larger in the case of the new primer pair. Here, the dynamic range of the real-time PCR assay measured for three standard DNAs (mcrA+ plasmid, Methanococcus maripaludis, and Methanomicrobium mobile) spanned 6 to 7 orders of magnitude, and for Methanobrevibacter woesei, it spanned 5 orders of magnitude. In contrast, amplification with the use of the mlas/mcrA-rev primer pair generated only two standard curves covering a linear range of 6 orders of magnitude (of the mcrA+ plasmid and Methanococcus maripaludis). The dynamic range for the remaining two standard DNAs (Methanobrevibacter woesei DSM 11979 and Methanomicrobium mobile) covered only 5 orders of magnitude.
The R2 value was between 0.9934 and 0.9966 for the mlas/mcrA-rev primer pair and between 0.9913 and 0.9992 for the mcrA_F3/mcrA-rev primer pair.
The reproducibility of the assays as defined by the values of standard deviation (SD) and the coefficient of variation (CV%) in the within-run and between-run tests are reported independently for all four tested mcrA+ genomes in Table 4.
The Cq values of the generated non-target controls were higher in the case of the new mcrA_F3/mcrA-rev primer pair, usually well above the value of 30 (Table 5). Moreover, by comparing the Cq values of the bacterial DNA and the Cqs of the last mcrA+ dilution points, the comparison favors the new primer pair, as the calculated difference between the Cqs is simply bigger. In contrast, as many as 18 non-target controls had a Cq lower than 30.8, which was the lowest reported value for the last standard dilution point for the mlas/mcrA-rev primer pair (Table 4). Moreover, the amplification curve generated, e.g., from Escherichia coli by using the original primer pair indicated a strong false-positive result (viewed as a high rate of increase), which was not observed in the case of the mcrA_F3/mcrA-rev primer pair (Figure 4).
The melting profile of the mlas/mcrA-rev amplicons generated from the bacterial DNAs indicated a substantial amplification of the non-specific products from E. coli and Enterococcus avium. Those amplicons had a Tm within or above the range of specific products, making them measurable in terms of the Cq. In contrast, the tendency to amplify products with a Tm around the specific peak was marginal when the mcrA_F3/mcrA-rev primer pair was used (Figure 4).

3.5. Methanogen Load in Chicken Dropping Samples

Given that the temperature in the range between approx. 83 and 87 °C was determined experimentally as being mcrA-specific, only seven dropping samples could be considered mcrA+ using the original mlas/mcrA-rev primer pair (Table 6). In contrast, as many as 13 samples fell under the same criteria when the mcrA_F3/mcrA-rev was used, and another 7 samples were just under the lower limit.
The primer pair mlas/mcrA-rev did not amplify any specific product in the remaining 13 dropping samples despite generating low Cq values in all cases but one (sample 8).

4. Discussion

Publications bringing up the subject of primer and qPCR validation are sparse, with a strong emphasis being placed on pathogens [23,24,25]. This paper is—to the best of our knowledge—the first one that focuses on methanogenic archaea in dropping samples of chickens.
The primers first designed by Steinberg and Regan [21] were used with success by several authors, providing a great deal of knowledge on the subject of diversity and the prevalence of methanogenic archaea in various environments, i.e., in landfills, wastewater, the gastrointestinal tracts of insects, and human stool samples [26,27,28,29].
However, our very preliminary research showed that, by using these primers together with the different temperature settings reported previously for qPCR by Steinberg and Regan [18] and Lecours et al. [6], methanogens remained undetected in the majority of the tested dropping samples. In our opinion, the reason behind this was the length of the generated mcrA amplicons of approx. 470–490 bp. Therefore, we tried to explore the possibility of designing a new assay.
Once the new forward primer was designed, the next step was to compare its performance to that of the original one. In order to exclude the potential influence of any other conditions (such as the annealing temperature) on the primer performance, this test was performed as closely as possible to the conditions described in the original study by Steinberg and Regan [18]. By changing only one primer, we were able to obtain a significant improvement. Since there was some evidence of primer dimerization resulting in the generation of a signal in the NTC, the real-time PCR protocol had to be optimized. As a consequence, the mcrA_F3 forward primer—together with the original reverse primer and improved PCR conditions—was able to generate amplicons of approx. 270 bp under more stringent conditions, which, as was later proven, was enough to detect methanogens in almost all tested samples that previously underwent mechanical lysis according to the protocol we designed previously [14]. In the aforementioned study, we used a hydrolysis probe in order to reduce any unspecific signals that could have arisen from the primer dimers [14]; however, the use of this probe might have resulted in the loss of some reads from the methanogenic archaea due to potential mismatches between the probe and its target. Here, we tried a different approach—a four-step real-time PCR with fluorescence acquisition at temperatures just under the point of melting of the specific products. Such changes induced the generation of lower Cq values of the assay.
A higher annealing temperature favored the generation of specific products over primer dimers, even at low concentrations of the target DNAs. Moreover, our assay improved specificity with respect to the cross-reactions with the non-target controls. In the original assay, even the temperature of fluorescence acquisition set to 83 °C was not high enough to prevent one from measuring the Cq of those non-specific products, since their Tm was, in some cases, as high as or even higher than the Tm of the specific ones. Of course, the non-specific reactions using the mlas/mcrA-rev primer pair may have occurred due to the fact that the annealing temperature was relatively low, but by analyzing the results from the initial experiment, no further optimization would have given results similar to the primer pair proposed in our study.
Although the Cq values of the standards generated using the mcrA_F3/mcrA-rev primer pair were generally higher than those generated using the previously published primer pair, the ability to differentiate between the positive and the non-target controls by comparing the Cq values was much higher using the mcrA_F3/mcrA-rev primer pair. In general, the mcrA_F3/mcrA-rev assay led to the amplification of three out of four positive controls and all dropping samples with a higher sensitivity. Both the intra- and inter-assay CVs for the standard DNAs were satisfactory low. This assay was also more specific than the mlas/mcrA-rev assay, and it had a reproducible limit of detection of approx. 21 to 57 copies of target DNA per reaction depending on the DNA template used.
Steinberg and Regan [18] reported that they were able to achieve a limit of detection of approx. 415 copies per reaction with the use of the mlas/mcrA-rev primer pair. Our results show that the limit of detection generated by the same primers is in the range of 21 to 571 copies per reaction, which is in line with the original study.

5. Conclusions

The current results present a novel qPCR approach in the detection of methanogenic archaea using the mcrA_F3/mcrA-rev primer pair. Although the proposed protocol was not able to entirely eliminate non-specific reactions (cross-amplification), most validation parameters improved significantly. Moreover, the shortening of the amplicon allowed for a more accurate quantification of methanogenic archaea in dropping and stool samples, especially those that underwent mechanical lysis during DNA isolation. In the long run, the proposed protocol may improve the detection rates of methanogens in human and animal gastrointestinal tracts and contribute to a better understanding of the role of archaea in the health and disease of their hosts.

Supplementary Materials

The following supporting information can be downloaded at https://www.mdpi.com/article/10.3390/microorganisms11030660/s1, Table S1: Multiple alignments of the mcrA sequence fragment of 47 methanogenic archaea. Table S2: Multiple alignments of the mcrA sequence fragment of 26 Methanobrevibacter and environmental species; nucleotides in bold represent the target of the mcrA_F3 primer.

Author Contributions

Conceptualization, A.A.C.; methodology, A.A.C.; software, A.A.C.; validation, A.A.C.; formal analysis, A.A.C.; investigation, A.A.C.; resources, I.B.; data curation, A.A.C.; writing—original draft preparation, A.A.C.; writing—review and editing, I.B. and B.C.; visualization, A.A.C.; supervision, B.C.; project administration, A.A.C.; funding acquisition, A.A.C. All authors have read and agreed to the published version of the manuscript.

Funding

This research was funded by the National Science Centre, Poland, under grant no. 2017/25/N/NZ7/02905.

Data Availability Statement

Data are contained within this article and supplementary materials.

Acknowledgments

The authors thank all colleagues who generously provided the strains included in the study, especially Beata Dolka and Ilona Stefańska from the Institute of Veterinary Medicine of Warsaw University of Life Sciences—SGGW. The authors would also like to thank Joanna Trubicka from the Department of Pathology of The Children’s Memorial Health Institute for proofreading the manuscript.

Conflicts of Interest

The authors declare no conflict of interest.

References

  1. Djemai, K.; Drancourt, M.; Tidjani Alou, M. Bacteria and Methanogens in the Human Microbiome: A Review of Syntrophic Interactions. Microb. Ecol. 2022, 83, 536–554. [Google Scholar] [CrossRef] [PubMed]
  2. Li, Z.; Wang, X.; Zhang, T.; Si, H.; Xu, C.; Wright, A.D.G.; Li, G. Heterogeneous Development of Methanogens and the Correlation with Bacteria in the Rumen and Cecum of Sika Deer (Cervus Nippon) during Early Life Suggest Different Ecology Relevance. BMC Microbiol. 2019, 19, 129. [Google Scholar] [CrossRef]
  3. Sergeant, M.J.; Constantinidou, C.; Cogan, T.A.; Bedford, M.R.; Penn, C.W.; Pallen, M.J. Extensive Microbial and Functional Diversity within the Chicken Cecal Microbiome. PLoS ONE 2014, 9, e91941. [Google Scholar] [CrossRef] [PubMed] [Green Version]
  4. Brugère, J.F.; Borrel, G.; Gaci, N.; Tottey, W.; O’Toole, P.W.; Malpuech-Brugère, C. Archaebiotics: Proposed Therapeutic Use of Archaea to Prevent Trimethylaminuria and Cardiovascular Disease. Gut Microbes 2014, 5, 5–10. [Google Scholar] [CrossRef] [Green Version]
  5. Camara, A.; Konate, S.; Tidjani Alou, M.; Kodio, A.; Togo, A.H.; Cortaredona, S.; Henrissat, B.; Thera, M.A.; Doumbo, O.K.; Raoult, D.; et al. Clinical Evidence of the Role of Methanobrevibacter Smithii in Severe Acute Malnutrition. Sci. Rep. 2021, 11, 5426. [Google Scholar] [CrossRef]
  6. Lecours, P.B.; Marsolais, D.; Cormier, Y.; Berberi, M.; Haché, C.; Bourdages, R.; Duchaine, C. Increased Prevalence of Methanosphaera Stadtmanae in Inflammatory Bowel Diseases. PLoS ONE 2014, 9, e87734. [Google Scholar] [CrossRef] [PubMed]
  7. Moissl-Eichinger, C.; Pausan, M.; Taffner, J.; Berg, G.; Bang, C.; Schmitz, R.A. Archaea Are Interactive Components of Complex Microbiomes. Trends Microbiol. 2018, 26, 70–85. [Google Scholar] [CrossRef]
  8. Yeoman, C.J.; Chia, N.; Jeraldo, P.; Sipos, M.; Goldenfeld, N.D.; White, B.A. The Microbiome of the Chicken Gastrointestinal Tract. Anim. Health Res. Rev. 2012, 13, 89–99. [Google Scholar] [CrossRef] [Green Version]
  9. Liu, A.; Gao, W.; Zhu, Y.; Hou, X.; Chu, H. Gut Non-Bacterial Microbiota: Emerging Link to Irritable Bowel Syndrome. Toxins 2022, 14, 596. [Google Scholar] [CrossRef]
  10. Medvecky, M.; Cejkova, D.; Polansky, O.; Karasova, D.; Kubasova, T.; Cizek, A.; Rychlik, I. Whole Genome Sequencing and Function Prediction of 133 Gut Anaerobes Isolated from Chicken Caecum in Pure Cultures. BMC Genom. 2018, 19, 1–15. [Google Scholar] [CrossRef] [Green Version]
  11. Segura-Wang, M.; Grabner, N.; Koestelbauer, A.; Klose, V.; Ghanbari, M. Genome-Resolved Metagenomics of the Chicken Gut Microbiome. Front. Microbiol. 2021, 12, 2390. [Google Scholar] [CrossRef] [PubMed]
  12. Saengkerdsub, S.; Anderson, R.C.; Wilkinson, H.H.; Kim, W.K.; Nisbet, D.J.; Ricke, S.C. Identification and Quantification of Methanogenic Archaea in Adult Chicken Ceca. Appl. Environ. Microbiol. 2007, 73, 353–356. [Google Scholar] [CrossRef] [Green Version]
  13. Saengkerdsub, S.; Herrera, P.; Woodward, C.L.; Anderson, R.C.; Nisbet, D.J.; Ricke, S.C. Detection of Methane and Quantification of Methanogenic Archaea in Faeces from Young Broiler Chickens Using Real-Time PCR. Lett. Appl. Microbiol. 2007, 45, 629–634. [Google Scholar] [CrossRef] [PubMed]
  14. Cisek, A.A.; Bąk, I.; Stefańska, I.; Binek, M. Selection and Optimization of High-Yielding DNA Isolation Protocol for Quantitative Analyses of Methanogenic Archaea. Microorganisms 2022, 10, 523. [Google Scholar] [CrossRef] [PubMed]
  15. Narihiro, T.; Sekiguchi, Y. Oligonucleotide Primers, Probes and Molecular Methods for the Environmental Monitoring of Methanogenic Archaea. Microb. Biotechnol. 2011, 4, 585–602. [Google Scholar] [CrossRef] [Green Version]
  16. The Ribosomal RNA Database. Available online: https://rrndb.umms.med.umich.edu/ (accessed on 24 November 2021).
  17. WebPRANK. Available online: https://www.ebi.ac.uk/goldman-srv/webprank/ (accessed on 14 January 2022).
  18. Steinberg, L.M.; Regan, J.M. McrA-Targeted Real-Time Quantitative PCR Method to Examine Methanogen Communities. Appl. Environ. Microbiol. 2009, 75, 4435–4442. [Google Scholar] [CrossRef] [PubMed] [Green Version]
  19. Oligo Analyzer. Available online: https://www.idtdna.com/calc/analyzer (accessed on 12 January 2021).
  20. Primer-BLAST. Available online: https://www.ncbi.nlm.nih.gov/tools/primer-blast/ (accessed on 14 January 2021).
  21. Steinberg, L.M.; Regan, J.M. Phylogenetic Comparison of the Methanogenic Communities from an Acidic, Oligotrophic Fen and an Anaerobic Digester Treating Municipal Wastewater Sludge. Appl. Environ. Microbiol. 2008, 74, 6663–6671. [Google Scholar] [CrossRef] [Green Version]
  22. Copy Number Calculator for Realtime PCR|Science Primer. Available online: http://scienceprimer.com/copy-number-calculator-for-realtime-pcr (accessed on 24 May 2019).
  23. Wang, Q.; Wang, X.; Zhang, J.; Song, G. LNA Real-Time PCR Probe Quantification of Hepatitis B Virus DNA. Exp. Ther. Med. 2012, 3, 503–508. [Google Scholar] [CrossRef] [Green Version]
  24. Chen, J.; Zhang, R.; Ou, X.; Yao, D.; Huang, Z.; Li, L.; Sun, B. Primers and Probe Design and Precision Assessment of the Real Time RT-PCR Assay in Coxsackievirus A10 and Enterovirus Detection. Data Br. 2017, 12, 418–422. [Google Scholar] [CrossRef]
  25. Lin, C.N.; Lin, W.H.; Hung, L.N.; Wang, S.Y.; Chiou, M.T. Comparison of Viremia of Type II Porcine Reproductive and Respiratory Syndrome Virus in Naturally Infected Pigs by Zip Nucleic Acid Probe-Based Real-Time PCR. BMC Vet. Res. 2013, 9, 814–822. [Google Scholar] [CrossRef] [Green Version]
  26. Chen, Y.; Zhen, Y.; Wan, J.; Yin, X.; Li, S.; Liu, J.; Zhang, G.; Mi, T. Differences in the Methanogen Community between the Nearshore and Offshore Sediments of the South Yellow Sea. J. Microbiol. 2022, 60, 814–822. [Google Scholar] [CrossRef]
  27. Buessecker, S.; Zamora, Z.; Sarno, A.F.; Finn, D.R.; Hoyt, A.M.; van Haren, J.; Urquiza Muñoz, J.D.; Cadillo-Quiroz, H. Microbial Communities and Interactions of Nitrogen Oxides With Methanogenesis in Diverse Peatlands of the Amazon Basin. Front. Microbiol. 2021, 12, 659079. [Google Scholar] [CrossRef] [PubMed]
  28. Schroeder, B.G.; Logroño, W.; da Rocha, U.N.; Harms, H.; Nikolausz, M. Enrichment of Anaerobic Microbial Communities from Midgut and Hindgut of Sun Beetle Larvae (Pachnoda Marginata) on Wheat Straw: Effect of Inoculum Preparation. Microorganisms 2022, 10, 761. [Google Scholar] [CrossRef] [PubMed]
  29. Teigen, L.; Mathai, P.P.; Matson, M.; Lopez, S.; Kozysa, D.; Kabage, A.J.; Hamilton, M.J.; Vaughn, B.P.; Sadowsky, M.J.; Khoruts, A. Methanogen Abundance Thresholds Capable of Differentiating In Vitro Methane Production in Human Stool Samples. Dig. Dis. Sci. 2021, 66, 3822–3830. [Google Scholar] [CrossRef] [PubMed]
Figure 1. Comparison of amplification curves generated with annealing temperature of 55 °C.
Microorganisms 11 00660 g001
Figure 2. The results of gradient PCR. The optimal Ta was between 59 and 60 °C. The product length was 270 bp. M—DNA ladder.
Microorganisms 11 00660 g002
Figure 3. The melting profiles of 4 standards generated by using mlas/mcrA-rev and mcrA_F3/mcrA-rev primer pairs.
Microorganisms 11 00660 g003
Figure 4. The melting profiles and the amplification plots of non-target controls set together with all 4 positive controls (upper charts) and with dilution series of the mcrA+ plasmid (lower charts) for comparison.
Microorganisms 11 00660 g004
Table 1. The list of oligos used for the mcrA gene detection.
Oligo NameSequence 5′–3′Oligo Binding Site 5′–3′ *Tm [°C]Product Size with Primer mcrA-Rev [bp]References
mcrA-revCGTTCATBGCGTAGTTVGGRTAGT446–46762–68n/a[21]
mlasGGTGGTGTMGGDTTCACMCARTA1–2362–70469[21]
mcrA_F3CTTGAARMTCACTTCGGTGGWTC199–22162–66271This study and [14]
* Primer binding site refers to the nucleotide position in the mcrA gene of Methanobrevibacter woesei (acc. EU919432.1).
Table 2. Excerpt of the mcrA gene sequence alignment of methanogens in the binding sites of the newly designed mcrA_F3 primer.
Acc. No.SpeciesmcrA_F3 Sequence
CTTGAARMTCACTTCGGTGGWTC
Product Size with Primer mcrA-Rev (bp) *
KC618341.1Methanopyrus sp.ATGGAGACCCACTTCGGTGGATC271
HQ896500.1Methanomassiliicoccus luminyensisATGGAAACCCACTTCGGTGGTTC271
AF414042.1Methanopyrus kandleriATGGAGACGCACTTCGGAGGTTC271
MH004454.1Methanosarcina mazeiCTTGAAGACCACTTCGGTGGGTC271
AB288266.1Methanosarcina horonobensisCTTGAAGACCACTTCGGTGGATC271
AB288268.1Methanosarcina subterraneaCTTGAAGACCACTTCGGTGGGTC271
U22242.1Methanolobus oregonensisCTTGAGGACCACTTCGGTGGATCn/a
EU715818.1Methanolobus zinderiCTCGAAGACCACTTCGGTGGATC271
U22243.1Methanolobus tayloriiCTCGAAGACCACTTTGGTGGATCn/a
AB703629.1Methanolobus profundiCTCGAAGACCACTTCGGTGGATCn/a
U22245.1Methanolobus vulcaniCTCGAAGACCACTTCGGTGGATCn/a
JN081865.1Methanocella conradiiCTCGAGGACCACTTCGGCGGCTCn/a
KJ441441.1Methanocella sp.CTCGAGGACCACTTCGGTGGCTCn/a
AB300467.1Methanocella paludicolaCTCGAGGACCACTTCGGTGGCTCn/a
AF414044.1Methanomicrobium mobileATGGAAGACCACTTCGGCGGTTCn/a
MH004450.1Methanoculleus marisnigriATGGAGGACCACTTCGGCGGTTC271
AB300784.1Methanoculleus palmoleiATGGAGGACCACTTCGGCGGGTCn/a
AB300787.1Methanoculleus bourgensisATGGAAGACCACTTCGGCGGGTC271
AB300779.1Methanoculleus chikugoensisATGGAGGACCACTTCGGCGGTTC271
DQ229160.1Methanogenium organophilumATGGAAGACCACTTCGGTGGTTC271
DQ229161.1Methanogenium booneiATGGAAGACCACTTTGGCGGGTCn/a
JQ917190.1Methanobacterium sp.CTGGAAGACCACTTTGGCGGTTCn/a
GU385700.1Methanobrevibacter smithiiCTTGAAACTCACTTCGGTGGATC271
LK054628.1Methanobrevibacter oralisCTCGAAACTCACTTCGGTGGATCn/a
CP001719.1Methanobrevibacter ruminantiumCTTGAAACTCACTTCGGTGGTTC271
KF214818.1Methanobrevibacter sp. D5/mcrA+ plasmidCTTGAAACTCACTTCGGTGGATC271
EU919431.1Methanobrevibacter gottschalkiiCTTGAAACTCACTTCGGTGGATC271
KC865050.1Methanobrevibacter boviskoreaniCTTGAAACCCAATTCGGTGGATC271
EU919432.1Methanobrevibacter woeseiCTTGAAACTCAATTCGGTGGATC271
KC865051.1Methanobrevibacter woliniiCTTGAAACTCAATTCGGTGGATC271
AF414035.1Methanobrevibacter arboriphilusCTTGAAACCCAATTCGGTGGTTCn/a
HM802934.1Methanobacterium movensTTAGAAACCCTCTTCGGTGGATCn/a
AY289750.1Methanobacterium thermaggregansCTCGAGGACCAGTTTGGTGGATCn/a
AB300780.1Methanothermobacter wolfeiiCTGGAGGACCAGTTCGGAGGATC271
AB523786.1Methanothermobacter tenebrarumCTCGAGACACAATTTGGAGGATC271
HQ283274.1Methanothermobacter crinaleCTTGAGACACAGTTCGGCGGATCn/a
KP006500.1Methanobacterium aggregansCTCGAGACCCAGTTCGGTGGATCn/a
AY386125.1Methanobacterium aarhusenseTTAGAAACACAGTTCGGTGGATCn/a
AF313806.1Methanobacterium bryantiiCTTGAAGATCAGTTCGGTGGATCn/a
X07793.1Methanococcus voltaeTTAGAAGACCACTTCGGTGGCTC271
AF414048.1Methanothermococcus thermolithotrophicusTTAGAAGACCACTTCGGAGGTTC271
AB703637.1Methanococcus maripaludisTTAGAAGACCACTTCGGTGGATC271
M16893.1Methanococcus vannieliiTTAGAAGACCACTTTGGTGGATC271
AY354034.1Methanococcus aeolicusTTGGAAGACCACTTTGGAGGTTC271
FJ982887.1Methanosphaera sp.TTAGAAGACCACTTCGGTGGATC271
AF414047.1Methanosphaera stadtmanaeTTAGAAGACCACTTTGGTGGATC271
* n/a—not available due to incomplete mcrA sequence.
Table 3. Detection of the mcrA gene in both assays.
Estimated Plasmid/Genome Copy No.mlas/mcrA-RevmcrA_F3/mcrA-Rev
No. Positive/No. TestedMelting Analysis *No. Positive/No. TestedMelting Analysis *
mcrA+ Plasmid
6.24 × 1068/8S9/9S
6.24 × 1058/89/9
6.24 × 1048/89/9
6.24 × 1038/89/9
6.24 × 1028/810/10
6.24 × 10¹⁸/86/810/10
2/8S + PD
6.24 × 1002/8S + PD3/10S + PD
6.24 × 10⁻¹⁰/8PD0/10PD
Methanobrevibacter woesei DSM 11979
6 × 10⁶n/an/a2/2S
6 × 1058/8S7/7
6 × 1048/87/7
6 × 1038/87/7
6 × 1028/88/8
6 × 10¹⁸/82/88/84/8
6/8S + PD4/8S + PD
6 × 1002/8S + PD2/8S + PD
6 × 10⁻¹⁰/8PD0/8PD
Methanococcus maripaludis DSM 2067
2.11 × 1068/8S9/9S
2.11 × 1058/89/9
2.11 × 1048/89/9
2.11 × 1038/89/9
2.11 × 1028/89/9
2.11 × 10¹⁸/82/89/93/9
6/8S + PD6/9S + PD
2.11 × 1002/8S + PD3/9S + PD
2.11 × 10⁻¹⁰/8PD0/9PD
Methanomicrobium mobile DSM 1539
5.71 × 1068/8S7/7S
5.71 × 1058/87/7
5.71 × 1049/97/7
5.71 × 1038/87/7
5.71 × 1029/91/97/74/7
8/9S + PD3/7S + PD
5.71 × 10¹¹/8S + PD7/7S + PD
5.71 × 1000/8PD0/7PD
5.71 × 10⁻¹⁰/8PD0/7PD
* S = specific amplicons (mlas/mcrA-rev: 83.82 for mcrA+ plasmid, 83.27 for Methanobrevibacter woesei, 84.58 for Methanococcus maripaludis, and 87.08 °C for Methanomicrobium mobile amplicons; mcrA_F3/mcrA-rev: 83.55 for mcrA+ plasmid, 83.08 for Methanobrevibacter woesei, 84.65 for Methanococcus maripaludis, and 86.91 °C for Methanomicrobium mobile amplicons); PD = primer dimers.
Table 4. Reproducibility and efficiency of the assays.
Estimated Plasmid/Genome Copy No.Mlas/mcrA-RevmcrA_F3/mcrA-Rev
Intra-Assay VariabilityInter-Assay VariabilityEfficiency (%)Intra-Assay VariabilityInter-Assay VariabilityEfficiency (%)
Mean Cq ± SDCV%Mean Cq ± SDCV%Mean Cq ± SDCV%Mean Cq ± SDCV%
mcrA+ Plasmid
6.24 × 10613.32 ± 0.020.1113.20 ± 0.141.0391.6914.94 ± 0.171.1015.11 ± 0.030.2090.92
6.24 × 10517.09 ± 0.080.4817.05 ± 0.352.0519.16 ± 0.130.6819.24 ± 0.190.97
6.24 × 10421.08 ± 0.170.8121.01 ± 0.472.2423.48 ± 0.281.1823.01 ± 0.41.76
6.24 × 10324.72 ± 0.120.4824.71 ± 0.240.9627.32 ± 0.381.4027.10 ± 0.291.05
6.24 × 10228.26 ± 0.240.8427.75 ± 0.551.9730.91 ± 0.120.3830.32 ± 0.82.64
6.24 × 10130.58 ± 0.040.1330.81 ± 0.571.8533.77 ± 0.070.2132.57 ± 0.772.36
6.24 × 10031.56 * (1/3)n/a31.34 * (2/3) ± 0.310.99n/a34.55 * (1/3)n/a33.72 ± 1.053.11n/a
6.24 × 10⁻¹negativenegative
Methanobrevibacter woesei DSM 11979
6 × 10518.09 ± 0.211.1418.45 ± 0.42.14109.3318.69 ± 0.341.8119.62 ± 0.783.9598.96
6 × 10421.80 ± 0.120.5621.63 ± 0.411.8922.95 ±0.20.8823.33 ± 0.512.18
6 × 10325.38 ± 0.31.1725.29 ± 0.41.5726.89 ± 0.180.6826.72 ± 0.080.29
6 × 10228.69 ± 0.130.4528.43 ± 0.331.1530.87 ± 0.110.3630.53 ± 0.240.79
6 × 10130.48 ± 0.150.5030.63 ± 0.050.1732.88 ± 0.30.9232.76 ± 0.250.77
6 × 10030.82 * (2/3) ± 0.210.6930.97 * (1/3)n/an/anegative33.90 * (2/3) ± 0.72.07n/a
6 × 10⁻¹negativenegative
Methanococcus maripaludis DSM 2067
2.11 × 10614.41 ± 0.251.7214.79 ± 0.050.35103.1816.09 ± 0.523.2216.80 ± 0.281.6490.84
2.11 × 10518.07 ± 0.080.4418.54 ± 0.040.2420.30 ± 0.331.6120.61 ± 0.150.71
2.11 × 10422.53 ± 0.040.1922.15 ± 0.31.3724.26 ± 0.240.9724.17 ± 0.311.29
2.11 × 10325.98 ± 0.090.3425.43 ± 0.522.0628.14 ± 0.210.7327.81 ± 0.632.27
2.11 × 10229.21 ± 0.130.4628.50 ± 0.612.1431.81 ± 0.190.6031.44 ± 0.441.40
2.11 × 10130.84 ± 0.070.2330.90 ± 0.170.5534.87 ± 0.260.7434.51 ± 0.812.36
2.11 × 100negative31.11 * (2/3) ± 0.060.18n/anegative34.87 ± 0.591.68n/a
2.11 × 10⁻¹negativenegative
Methanomicrobium mobile DSM 1539
5.71 × 10618.47 ± 0.050.2918.31 ± 0.211.1210420.19 ± 0.562.7919.49 ± 0.784.0197.67
5.71 × 10522.22 ± 0.030.1122.00 ± 0.221.0024.22 ± 0.31.2423.31 ± 0.793.38
5.71 × 10425.85 ± 0.090.3325.44 ± 0.421.6328.32 ± 0.140.4827.38 ± 0.742.69
5.71 × 10329.34 ± 0.20.6928.68 ± 0.411.4232.46 ± 0.260.7930.54 ± 0.822.67
5.71 × 10230.65 ± 0.30.9731.12 ± 0.160.5235.21 ± 0.591.6933.86 ± 1.073.17
5.71 × 101negative31.73 * (1/3)n/an/a36.17 ± 0.792.1836.19 ± 0.772.12
5.71 × 100negativenegative
5.71 × 10⁻¹negativenegative
* instances where not all replicates tested positive; n/a—not applicable.
Table 5. The amplification results of the non-target controls.
DNA TemplateEstimated Genome Copy No. Per Reaction or Amount *Cq
Mlas/mcrA-RevmcrA_F3/mcrA-Rev
Escherichia coli ATCC 87394.38 × 105 copies26.7634.17
Salmonella Typhimurium ATCC 140283.44 × 105 copies31.5834.06
Clostridium septicum ATCC 124644.48 × 105 copies31.1932.98
Lactobacillus sakei ATCC 155216.6 × 106 copies29.5930.41
Enterococcus avium ATCC 140255.86 × 106 copies26.1432.41
Enterococcus casseliflavus ATCC 7003272.48 × 106 copies26.4733.18
Enterococcus raffinosus ATCC 494647.7 × 104 copies27.6533.20
Blautia obeum DSM 252382.08 × 107 copies28.1134.28
Ruminococcus gauvreauii DSM 198298.83 × 105 copies27.8235.21
Helicobacter cinaedi DSM 53591.71 × 107 copies24.6336.36
Desulfovibrio piger DSM 7491.32 × 108 copies29.0634.49
Proteus sp.6.1 ng23.1532.92
Streptococcus sp.17 ng26.4534.66
Streptococcus sp. (beta-hemolytic)0.118 ng28.2134.46
Corynebacterium sp.1.15 ng30.4336.49
Pseudomonas aeruginosa70 ng26.3532.14
Pasteurella sp.0.377 ng31.4337.80
Klebsiella sp.28 ng26.2332.45
Staphylococcus sp. (coagulase-negative)3.28 ng26.9836.10
Porphyromonas sp.2.43 ng25.5329.05
Bacteroidetes bacterium1.13 ng27.1836.13
* fluorimetric measurements.
Table 6. Methanogens detected in chicken dropping samples with the use of mlas/mcrA-rev and mcrA_F3/mcrA-rev primer pairs.
SampleMlas/mcrA-RevmcrA_F3/mcrA-Rev
CqTm (°C)CqTm (°C)
124.8277.84; 82.2528.1782.51
224.5471.8429.6279.47; 83.69
324.5077.94; 83.2323.1783.36
425.5983.18; 88.9127.9882.55
525.1683.4327.6383.59
628.1974.8531.1480.32; 83.28
728.0977.6230.6383.05
8negative75.82; 80.9628.2777.08; 83.67
927.2083.0725.3483.13
1025.5779.63; 83.1728.1583.11
1125.7380.6528.5877.11; 83.31
1227.9377.4130.5383.11
1327.6775.94; 82.0228.8082.88
1428.3682.9729.4077.51; 82.87
1530.4579.7131.2276.09; 82.87
1625.6075.51; 81.3729.8582.98
1726.4776.13; 81.1028.9076.59; 81.80
1828.1475.7229.8677.92; 83.12
1929.2975.91; 83.0129.9383.12
2026.9674.3828.4882.88
Disclaimer/Publisher’s Note: The statements, opinions and data contained in all publications are solely those of the individual author(s) and contributor(s) and not of MDPI and/or the editor(s). MDPI and/or the editor(s) disclaim responsibility for any injury to people or property resulting from any ideas, methods, instructions or products referred to in the content.

