Abstract
Plant growth-promoting bacteria (PGPB) can enhance plant health by facilitating nutrient uptake, nitrogen fixation, protection from pathogens, stress tolerance and/or boosting plant productivity. The genetic determinants that drive the plant–bacteria association remain understudied. To identify genetic loci highly correlated with traits responsive to PGPB, we performed a genome-wide association study (GWAS) using an Arabidopsis thaliana population treated with Azoarcus olearius DQS-4T. Phenotypically, the 305 Arabidopsis accessions tested responded differently to bacterial treatment by improving, inhibiting, or not affecting root system or shoot traits. GWA mapping analysis identified several predicted loci associated with primary root length or root fresh weight. Two statistical analyses were performed to narrow down potential gene candidates followed by haplotype block analysis, resulting in the identification of 11 loci associated with the responsiveness of Arabidopsis root fresh weight to bacterial inoculation. Our results showed considerable variation in the ability of plants to respond to inoculation by A. olearius DQS-4T while revealing considerable complexity regarding statistically associated loci with the growth traits measured. This investigation is a promising starting point for sustainable breeding strategies for future cropping practices that may employ beneficial microbes and/or modifications of the root microbiome.
1. Introduction
Plant growth-promoting bacteria (PGPB) benefit plant growth notably by enhancing nutrient uptake, nitrogen fixation, protection from pathogens, stress tolerance and/or boosting plant productivity. Changes in root system architecture and shoot biomass are common plant responses to PGPB, as evidenced on a variety of crops, including maize, rice, wheat, and various bioenergy grasses [1,2,3,4]. Despite an extensive literature documenting the beneficial effect of PGPB on plant growth, we still know relatively little about the molecular details of their mode of action. Genetic variation in the plant host has been reported to modulate the composition of the root-associated microbial population and has been suggested to have important adaptative consequences for plant health [5,6]. The process of domestication has profound consequences on crops, where the domesticate has moderately reduced genetic diversity relative to the wild ancestor across the genome, and severely reduced diversity for genes targeted by domestication [7], which can also impact plant-microbe interaction [8]. Hence, the identification and characterization of genes associated with the capacity of plants to maximize profitable responses to their associated beneficial bacteria could form the basis for breeding approaches to enhance yield, as well as increasing the sustainability of cropping systems. Taking advantage of genetic variation within a natural population, genome-wide association analysis (GWAS) offers the opportunity to analyze associations between single-nucleotide polymorphisms (SNPs) and phenotypic variance, a powerful tool for the identification of genetic loci associated with agronomic traits. For example, GWA mapping analyses have revealed novel and unknown genes impacting a variety of agronomic traits (e.g., flowering time, defense, drought, root cell development, plant architecture, and disease resistance) in numerous plant species, including Arabidopsis [8,9,10], rice [11,12], maize [13,14], and soybean [15,16,17].
Previous studies identified a number of bacterial genes involved in PGPB–plant association, including genes involved in nitrogen fixation [18], siderophore production and iron uptake, phosphate solubilization, production of volatile organic compounds, as well as phytohormones [19,20,21]. There is also a growing realization that plant symbionts can suppress the plant immune system in order to promote their colonization and infection of their plant host [22].
Azoarcus olearius DQS-4T is a nitrogen-fixing PGPB with the ability to colonize plant roots and enhance plant growth in monocots, such as rice and Setaria viridis [23,24]. In a recent study, we utilized transposon mutagenesis to identify essential bacterial genes that modulated colonization of Setaria viridis roots by A. olearius DQS-4T and another PGPB, Herbaspirillum seropedicae SmR1 [25]. Surprisingly, this study identified very few genes that were critical for both bacteria to colonize S. viridis roots. Instead, the data suggest that each bacterium requires a unique set of genes required for root colonization. This genetic diversity in the bacterial partner suggests that a similar level of complexity may exist with regard to how various plant hosts respond to specific PGPB strains. Although only two strains were used in our earlier study, the results appear to be quite distinct from other well-studied, plant–microbial associations. For example, in the rhizobial–legume symbiosis, a core set of both microbial and plant genes appears to be critical for establishment of the symbiosis [26,27,28]. For example, at this point, there appears to be no evidence for the involvement of a common symbiosis pathway (CSP), as defined for the rhizobial and mycorrhizal–plant symbioses, in the intimate association of diverse plant hosts with PGPB [27]. It should be noted that a significant contributor to the identification of the CSP in legumes was the adoption by the research community of model plant species (i.e., Medicago truncatula and Lotus japonicus) that greatly aided the identification of plant genes essential for establishment of the symbiosis. In a recent review, we argued that the research community interested in PGPB–plant associations would also greatly benefit by adopting model organisms to speed the molecular investigation of these interactions [29].
In the current study, we investigated the phenotypic responses of a natural population of 305 accessions [30] of the model plant Arabidospsis thaliana to inoculation by A. olearius DQS-4T, a PGPB, and performed GWA mapping of four growth traits to identify genetic regions that contribute to bacterial plant growth promotion. The basis of GWAS is the ability to statistically associate specific genetic loci to measured phenotypic diversity within the population and depends on the [31] large linkage disequilibrium (LD) in plants [11,32]. To explore further the output of our analysis, we used two independent, statistical methods to analyze our dataset on the four root growth traits measured. Overlapping SNPs were identified associated with changes in root fresh weight and confirmed by haplotype block analysis. Here, we present the predicted candidate genetic loci from the statistical analysis and discuss their possible relevance to the ability of A. olearius DQS-4T to promote plant growth.
GWA mapping resulted in the identification of genetic loci associated with PGPB-induced changes in primary root length or root fresh weight.
2. Material and Methods
2.1. Bacteria Cultivation
Azoarcus olearius DQS-4T [33] was grown overnight at 30 °C on liquid NFbHP-malate modified medium (DL malic acid 20 g L−1) supplemented with potassium phosphate (K2HPO4 17.8 g L−1, KH2PO4 159.5 g L−1) and ammonium chloride (NH4Cl 20 mM) [34,35]. Antibiotics were added to the culture at the following concentrations: 100 µg mL−1 streptomycin and 10 µg mL−1 nalidixic acid. Subsequently, the DQS-4T culture (OD600 = 0.9) was centrifuged at 3000× g for 1 min, and the pellet was washed three times by resuspension in 0.9% (w/v) NaCl. After that, the optical density was adjusted by dilution to 0.005 cells·mL−1 (2.3 × 10⁵ CFU·mL−1) in 50 mL of NaCl solution.
2.2. Plant Growth Conditions and Bacterial Treatment
A collection of 305 natural accessions of Arabidopsis thaliana [30] (Supplementary Material Figure S1) was used to investigate the response to inoculation by Azoarcus olearius DQS-4T. Arabidopsis seeds were sterilized by vortexing once with 70% ethanol for 1 min, twice with 70% ethanol plus 0.01% Triton X-100 for 2 min followed by once with 100% ethanol for 2 min. After ethanol removal, seeds were allowed to dry in a sterile hood and then 1 mL sterile water was added prior to vernalization at 4 °C for 3 days. Sterilized seeds were sown on square Petri dishes containing agar-solidified ½ Murashige and Skoog (MS) medium supplemented with 0.5% sucrose and incubated in a vertical position in a plant growth chamber at 21 °C with 16 h light/8 h dark cycle. After 5 days of germination, seedlings of similar size were transferred to circular Petri dishes containing ½ MS agar medium. Plants were inoculated by applying 150 µL of DQS-4T culture containing 2 × 10⁵ cell ml−1 onto the agar medium, approximately 5 cm below the root tip, which allowed the roots to grow into the inoculant. The same procedure was done for control treatments using 150 µL of saline solution (0.9% NaCl) without bacteria. The plates were briefly dried in a sterile hood, sealed with parafilm and placed vertically in a growth chamber until phenotypic analysis.
2.3. Phenotypic Response of Arabidopsis Accessions to Azoarcus Olearius DQS-4T
For each accession, 5 seedlings were grown on a ½ MS agar plate. The reference accessions Col-0 and WS were used in each experiment since they represent non-responding and responding ecotypes, respectively. A total of 3 replicate plates (15 seedlings) of control and DQS-4T-treated seedlings were analyzed for each of the 305 accessions tested. Growth parameters were analyzed 7 days upon treatment by counting lateral root number and measuring primary root length (cm), then average primary root length and lateral root number per seedling were determined. Root and shoot fresh weight were analyzed 8 days after treatment. Data were acquired simultaneously for inoculated and control samples from the three replicates. To determine statistical significance between control and inoculated plants, one-way analysis (ANOVA) was used with Tukey’s test (p-value < 0.05). Accessions with significant differences between control and inoculated were categorized as: (A) positive—genotypes that showed trait enhancement due inoculation; (B) negative—genotypes where inoculation inhibited growth; (C) non-responsive—genotypes that showed no growth response to bacterial inoculation.
2.4. Data Analysis
In this study, a natural population of 305 accessions of Arabidopsis thaliana [30] was used to investigate the genetic basis of the growth response to bacterial inoculation. Mapping analysis was performed on the following root parameters: primary root length (ΔPRL), lateral root number (ΔLRN), root fresh weight (ΔRFW), and shoot fresh weight (ΔSFW). For all traits, means per seedling (n = 5) per biological replicate (n = 3) were used to calculate the mean per treatment per accession. The mean value of the control treatment was subtracted from the value of the inoculated plants to generate the datasets used for GWAS analysis. Genome-wide association analysis employed a mixed linear model (MLM) using Tassel 5.0 software (http://www.maizegenetics.net/tassel, accessed on 15 November 2022) [36] incorporated with population structure by principal component analysis (PCA) and kinship matrix acquired from 1001 Genomes (https://1001genomes.org/, accessed on 15 November 2022) with minor allele frequency (MAF) = as 0.05, and the data were inferred as a normal distribution by the Kolmogorov–Smirnov test. All accessions were genotyped against the Col-0 reference genome with ~214 k single-nucleotide polymorphism (SNPs) markers [37]. Significant SNPs were identified with a strict threshold of significance by Bonferroni correction with p-value = 2.34 × 10⁻⁷. Annotations of candidate genes were retrieved from TAIR10 (http://www.arabidopsis.org, accessed on 15 November 2022). In order to narrow the list of candidate SNPs to a more focused set of SNPs, the data were also analyzed using the two-stages method implemented in the R package GWAS.BAYES [38]. The two steps are called screening and model selection. The screening step of the GWAS.BAYES method performs a usual GWAS analysis with a linear mixed-effects models with a SNP fixed effect and kinship random effects. The screening step provides the usual list of significant SNPs. The model selection step of the GWAS.BAYES method performs a genetic algorithm search through model space, where candidate models are linear mixed-effects models with kinship random effects and may contain multiple SNPs. The genetic algorithm in the model selection step forces the SNPs to compete to appear in the highest ranked models. As shown in [39], combining a screening step and a model selection step provides a much shorter list of significant SNPs and leads to a much higher true discovery rate.
Manhattan plots and linkage disequilibrium (LD) plots were generated using the R statistical software 4.0 [40].
2.5. Validation Using Quantitative Reverse Transcription PCR (qRT-PCR)
Gene expression was evaluated by qRT-PCR. RNA was isolated from roots 7 days after mock or bacterial treatment using Direct-zol RNA kit treated with DNase (Zymo Research, Irvine, CA, USA) following the manufacturer’s instructions. cDNA synthesis was performed with M-MLV reverse transcriptase (Promega, Madison, WI, USA). qRT-PCR was carried out as follows: 10 ng cDNA, 3 pM of each primer and PowerUpTM SYBRTM Green master mix (Applied Biosystems, Waltham, MA, USA) were mixed and amplified in Applied Biosystems ABI PRISMTM 7500 detection system (Applied Biosystems). Three biological replicates and three technical replicates for each transcript were analyzed using LinReg PCR 11.1 [41]. Quantitative amplifications were performed for different genes and ubiquitin 10 (At4G05320) was used as an internal reference. Primers used are listed in Supplementary Material Figure S2.
3. Results
3.1. Arabidopsis Thaliana Response to Azoarcus olearius DQS-4T Inoculation
Previous, published research, including from our own laboratory [23], documented that A. olearius DQS-4T can produce strong, positive effects on root growth in both rice and Setaria viridis [24]. As a prelude to our larger GWAS study, we initially tested only a few Arabidopsis ecotypes regarding their response to DQS-4T inoculation. These initial experiments revealed that A. thaliana ecotype Columbia (Col-0) had no measurable response to bacterial inoculation, while ecotype Wassilewskija (Ws) showed a robust and significant increase in all the traits measured (lateral root number, root and shoot fresh weight) (Supplementary Material Figure S3). Although limited, these initial experiments were important in showing phenotypic diversity in the plant response to inoculation, as well as providing both a negative (Col-O) and positive (Ws) control for future experiments.
3.2. Natural Variation in the Response of Arabidopsis Accessions to A. olearius Inoculation
In order to investigate the natural variation in the responsiveness of Arabidopsis to A. olearius DQS-4T, a total of 305 Arabidopsis accessions were analyzed for changes in root and shoot traits upon bacterial treatment. Analysis of correlation to measure the direction and strength between control and DQS-4T-treated samples showed a low correlation coefficient between control and treated samples for shoot fresh weight, primary root length and root fresh weight (R2 = 0.452, R2 = 0.349 and R2 = 0.106, respectively). However, for lateral root number, the correlation was only slightly stronger (R2 = 0.501) between control and treated samples (Figure 1A–H), suggesting that the magnitude of these DQS-4T-induced growth responses were weakly related to the intrinsic growth capacity for these parameters under the tested conditions. Hence, faster-growing accessions or accessions that form more lateral roots in the experimental setup are not necessarily stronger responders to bacterial treatment.
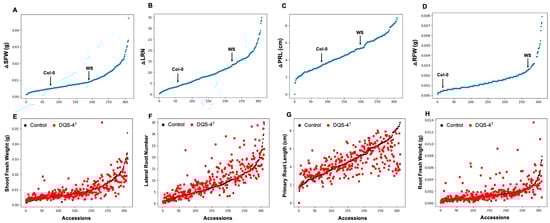
Figure 1.
Natural variation in 305 A. thaliana accessions in response to the plant growth-promoting Azoarcus olearius DQS-4T. (A) Accessions sorted for increase in shoot fresh weight (∆SFW) in response to DQS-4T (Col-0 and Ws are indicated with black or red arrow dot). (B) Accessions sorted for increase in lateral root number (∆LRN) in response to DQS-4T. (C) Accessions sorted for increase in primary root length (∆PRL) in response to DQS-4T. (D) Accessions sorted for increase in root fresh weight (∆RFW) in response to DQS-4T. (E) Average shoot fresh weight (∆SFW) of control (black dots) and DQS-4T (red dots) plants. (F) Number of lateral roots (∆LRN) formed in control (black dots) and DQS-4T-treated (red dots) plants. (G) Primary root length (∆PRL) of control (black dots) and DQS-4T (red dots) plants. (H) Average root fresh weight (∆RFW) of control (black dots) and DQS-4T (red dots) plants. Each dot represents the average of three biological replicates.
3.3. Response Categories of Arabidopsis thaliana Growth Traits to Treatments
The measured, phenotypic variability, relative to lateral root number (LRN), primary root length (PRL), root and shoot fresh weight (RFW, SFW), among the 305 Arabidopsis accessions classified into 3 categories are: 1. positive responsive: accessions that demonstrate a significant, positive change upon inoculation compared to mock samples; 2. non-responsive: accessions where bacterial treatment did not affect growth; 3. negative responsive: accessions where treatment inhibited growth (Figure 2). Within the positive responsive category, eleven genotypes showed growth enhancement in all four parameters analyzed, where most of the changes were statistically significant in lateral root number followed by shoot fresh weight and root fresh weight (Figure 2A,C). The growth of 13 ecotypes clearly benefited from DQS-4T inoculation (Figure 2B,C). For instance, the genotype Ws showed an increase in biomass and root growth when inoculated (Figure 2C).

Figure 2.
Growth responses of control and inoculated Arabidopsis accessions. Venn diagram showing the total number of common accessions across traits in each response category. (A) Responsive accessions to DQS-4T inoculation for root and shoot traits. (B) Responsive accessions in root growth parameters. (C) Significant response of Wassilewskija (WS) genotype upon inoculation with DQS-4T in all four traits. (D) Venn diagram of non-responsive accessions to DQS-4T inoculation for each root and shoot traits. (E) Significant non-responsive accessions in root growth parameters. (F) No significant response of Col-0 upon inoculation with DQS-4T in all four traits. (G) Accessions that responded negatively to DQS-4T inoculation in each trait analyzed. (H) Negative response accessions in root growth parameters. (I) Significant response of PHW-35 control upon inoculation with DQS-4T in all four traits analyzed. Bars are an average of three biological replicates (n = 15). Statistical analysis was carried out using one-way ANOVA with Tukey’s test p-value = 0.05 (* p ≤ 0.05; ** p ≤ 0.01; *** p ≤ 0.001).
However, the largest number of ecotypes (129) fell within the non-responsive group, which showed no statistically significant positive or negative response to bacterial inoculation for the parameters analyzed (Figure 2D–F). As mentioned above, Col-0 is a good example of an ecotype within this non-responsive category (Figure 2F). Interestingly, 82 genotypes showed a negative growth response to bacterial inoculation (Figure 2G). An example is ecotype PHW-35 (Figure 2H–I), which showed a negative response in each of the four parameters measured. However, when present, the positive effects on root architecture can be dramatic (Figure 3); for example, as shown in Figure 3A for ecotype Kr-0 (Figure 3A).
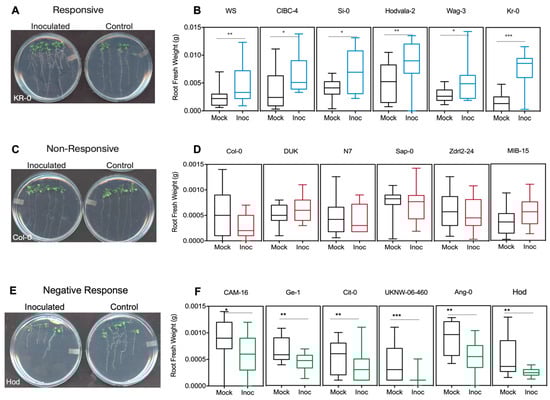
Figure 3.
Phenotyping of Arabidopsis accessions for responsiveness to DQS-4T mediated effect in root fresh weight (RFW). Agar plates with five seedlings showing the different response of Arabidopsis accessions to Azoarcus olearius. (A,B) Accessions that increased RFW upon DQS-4T treatment. (C,D) Non-responsive accessions to bacteria treatment. (E,F) Accessions where RFW was inhibited by DQS-4T treatment. Bars are an average of three biological replicates (n = 15). Statistical analysis was carried out using one-way ANOVA with Tukey’s test p-value < 0.05 (* p ≤ 0.05; ** p ≤ 0.01; *** p ≤ 0.001). RFW = root fresh weight. Photographs were taken by scanning the plates using a photo scanner with resolution 640 × 480.
Other ecotypes, such as Ws, CIBC-4, Si-0, Hodvala-2 and wag-3, demonstrated similar increases in root fresh weight upon bacterial treatment (Figure 3B) and could be easily identified from non-responsive ecotypes, such as Col-0, DUK, N7, Sap-0, Zdrl2-24 and MIB-15 (Figure 3C,D). However, it is important to note that it was common to find ecotypes that were not consistently responsive for all parameters measured (Figure 3E,F). For instance, ecotype Aa-0 showed a significant increase in LRN upon inoculation but was non-responsive for the other root and shoot parameters. Another example of trait-related variation is exemplified by ecotype Hod which showed no significant changes to LRN and PRL; however, RFW was significantly reduced by inoculation while increasing shoot biomass. This variability within overall response, responses in individual parameters, and opposing responses (i.e., negative, and positive) suggests significant underlying complexity in the genetics of the plant response, as well as the molecular mechanisms involved. However, unlike Aa-0 and Hod, some ecotypes gave robust responses for all four traits analyzed, including ecotypes Ws, Bla-1, KI-5, Kr-0 or showed a consistent, negative response, such as ecotypes UKNW-06-460, UKSE 06-349, PHW-35 and PHW-37 (Table 1 and Supplementary Material Figure S1 for a complete dataset).

Table 1.
Genotypes with statistical significance for the four plant growth parameters measured with regard to DQS-4T treatment.
3.4. Genome-Wide Association Loci Mapping in the Arabidopsis Population
The dataset collected for DQS-4T-induced changes in lateral root number (∆LRN), primary root length (∆PRL), root fresh weight (∆RFW) and shoot fresh weight (∆SFW) were averaged and analyzed against the Col-0 reference genome using a mixed linear model (MLM) algorithm in Tassel 5.0 Software. To determine the distribution and quality of the data within the population a quantile-quantile plot (Q-Q plot) was generated for each growth trait (Supplementary Material Figure S4). The GWA mapping results showed highly significant SNPs for two traits ∆PRL and ∆RFW (Figure 4). No significant SNPs were significantly associated to ∆LRN and ∆SFW (Supplementary Material Figure S4). With a threshold of −log10(P) > 7 adjusted by Bonferroni correction, a total of 63 loci were detected for root fresh weight and 55 loci correlated to primary root length (Supplementary Material Figure S5). We observed only one SNP associated with both traits ∆RFW and ∆PRL, mapping close to the gene encoding AtFKGP, bifunctional fucokinase/fucose pyrophosphorylase (At1G01220, p-value = 2.19 × 10⁻⁸ and 3.32 × 10⁻⁷, adjusted by Bonferroni correction, respectively). Given this close association, we measured the expression of AtFKGP by qRT-PCR using mRNA extracted from roots of 7-day-old seedlings of ecotypes representing non-responsive (Col-0, N7), responsive (Ws, Kr-0 and CIBC-4), and negative responding lines (PHW-37 and Lis-1) either mock non-inoculated or inoculated with DQS-4T. However, this experiment failed to find either down or upregulated gene expression of AtFKGP in response to bacterial inoculation in any of the Arabidopsis accessions tested (Supplementary Material).

Figure 4.
Manhattan plot of GWA mapping of A. olearius DQS-4T effects on root fresh weight (∆RFW) and primary root length (∆PRL) in −log10(P). SNP marker trait associations are shown as black and grey dots for each chromosome. The red and blue lines indicate the arbitrary thresholds of −log10(P) = 5 and −log10(P) = 7.
3.5. Primary Root Length Highly Correlated SNPs and Candidate Genes
We identified 55 SNPs highly correlated to measured changes in PRL (Supplementary Material Figure S5). An example are SNPs mapping close to gene At1G33410, encoding the suppressor of auxin resistance 1 (sar1) gene. SAR1 and SAR3 are proteins similar to vertebrate nucleoporins that are part of the nuclear pore complex (NPC). Plants deficient in either protein exhibit pleiotropic growth defects partially affecting the translocation of proteins involved in hormonal signaling and plant development [42,43]. A large LD resulted in inclusion of many polymorphisms in this candidate region; for example, loci within a gene predicted to encode a tetratricopeptide repeat 9 (TPR9) protein involved in gibberellic acid regulation [44], fascinated stem 4 (Atfas4) protein and a Ring/Ubox super family (At1g01660) protein. Moreover, a SNP highly correlated to primary root length corresponded to the gene encoding a late elongate hypocotyl LHY1, a MYB-related putative transcription factor implicated in circadian regulation of flowering time [45].
3.6. Root Fresh Weight Highly Correlated SNPs and Candidate Genes
We identified 65 SNPs highly correlated to changes in RFW Supplementary Material Figure S5). In order to narrow the list of candidate SNPs to a more focused set of SNPs, the data were also analyzed using the two-stages procedure implemented in the R package GWAS.BAYES [38,39]. This analysis reduced the number of SNPs highly associated with ∆RFW to 11 (Table 2); however, no SNPs were highly associated with ∆PRL in this analysis. In most GWA studies, the highly trait-correlated SNPs can present alleles in linkage disequilibrium (LD) at two or more loci in a population. However, because the peak of selection signals is relatively large in the GWA peak region, it is difficult to conclude whether the target of selection is the causative SNP or other alleles are significantly associated with this genome region. To examine the relationship between SNPs and regions, a haplotype block was generated for 10 kb upstream or downstream of the most significantly associated SNP at position 13,459,922 on chromosome 4 observed for ∆RFW (Figure 5A,B). The selected SNP 13,459,922 (p = 7.55 × 10⁻⁹; At4G26690) mapped close to a glycerophosphodiester phosphodiesterase-like 3 GDPDL3 gene, also known as Shaven 3 (SHV3) that is involved in cell wall organization and root hair growth [46]. This SNP was identified as significant in both statistical methods used. SNP 13,459,922 is located at an intronic 5′ untranslated region (5′UTR) with a modifier predicted effect [47]. Next, we determined which gene in proximity to this highly associated genomic region underlies the variation. As shown in Figure 5, six haplotype blocks were significantly associated with SNP 13459922, At4G26690. Based on haplotype analysis, seven SNP regions were identified associated, respectively, with genes encoding a member of the vacuolar-type ATPase family (At4G26710) and a protein phosphatase x-1(PP4) (At4G26720), extensin-like protein (Lip5, At4G26750), microtubule-associated protein 65-2 (MAP65-2, At4G26760), phosphatidate cytidylyltransferase (CDS3, At4G26770), mitochondrial GRPE 2 (At4G26780) and Lipase acyl hydrolase superfamily (GDSL-like, At4G26790) (Figure 5C). Because the polymorphisms are difficult to identify, we also carried out a matrix analysis, that showed SNPs at position 13,477,249 (gene Lip5) and 13,483,356 (CDS3 gene) highly correlated to SNP 13459922, GDPDL3 corroborating the haplotype block (Supplementary Material). Next, we determined the expression level of the genes correlated to the GWA peak by quantitative RT-PCR (qRT-PCR) using mRNA isolated from root tissue. We assumed that the expression of a candidate gene might be altered in accessions of different responsive categories. Hence, we extracted mRNA from the roots of selected accessions responsive (Ws and Kr-0), non-responsive (Col-0 and N7) and negative response (PHW-37 and Lis-1) regarding the RFW trait. The data show that none of the accessions tested showed a significant change in expression level upon inoculation for the various genes tested (i.e., those encoding GDPDL3, Lip5 and CDS3) (Supplementary Material). Of course, the lack of a transcriptional response to bacterial inoculation does not rule out the possibility that a specific gene could be playing an important role in the response to A. olearius DQS-4T treatment.
Table 2.
List of candidate genes from GWAs analysis of the A. olearius DQS-4T -mediated plant effects on root fresh weight (∆RFW) of 305 Arabidopsis thaliana population.
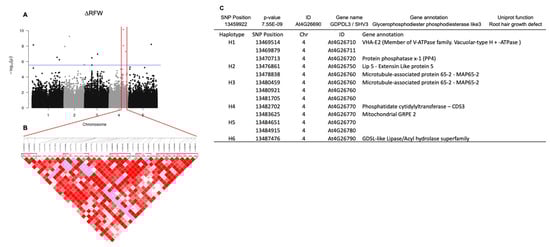
Figure 5.
(A). Manhattan plot (−log10(P)) of a genome-wide association study (GWAS) of 305 Arabidopsis accessions treated with Azoarcus olearius DQS-4T. The GWAS significance level was set at 2.34 × 10⁻⁷ and plotted as a red line. (B). Haplotype physical location around the highly correlated SNP At4G26690. (C). Haplotype analysis of alleles in linkage disequilibrium (LD) with a highly correlated SNP of root fresh weight (∆RFW).
4. Discussion
The benefits of PGPB in promoting plant growth, improving nutrient uptake and plant resilience to biotic and abiotic stress, and boosting crop production are documented by an expansive literature [3,48,49,50]. While the molecular mechanisms and specific pathways that underlie the growth-promoting responses in plants by PGPB have been investigated to some extent regarding the bacterial functions, left largely unexplored are the plant functions involved. Better defining these functions is important since they may help address the problems of consistency and efficiency that are found commonly when PGPB are used under field conditions to enhance crop yield and sustainability [51,52,53]. GWAS is now a popular method to harness natural genetic variation in a population to identify genetic loci critical for specific agronomic traits and in support of breeding improvement programs [13,54,55,56]. Although used with great success in many studies, classical GWAS relying on SNPs has its limitations due to ‘missing heritability’ [57]. Failure to capture rare variants, allelic heterogeneity, epistasis, and/or epigenetic variation often decreases the detecting capacity of GWAS [58,59,60,61,62,63]. To test the feasibility of this approach to investigate PGPG–plant interactions, we applied GWAS to map loci within the model plant Arabidopsis crucial for the beneficial response to the PGPB Azoarcus olearius DQS-4T. Such an approach has been used previously; for example, to examine the response of an Arabidopsis natural population to inoculation with the PGPB Pseudomonas fluorescens. This study identified 10 potential genes candidates involved in changes root architecture and shoot biomass but found none strongly correlated to growth responses to bacterial inoculation with no common gene that could be correlated to a PGPB mediated effect [21].
A few general conclusions can be made from our study. Consistent with published reports, including some from our own studies [2,23,64] plant genotype largely determines whether a given PGPB strain will or will not enhance or inhibit plant growth. This could be a major factor in field-to-field variation in published PGPB studies [51,52,53]. However, perhaps most impactful, is that the data point to considerable complexity in the mechanisms that underlie a beneficial plant response to PGPB inoculation. For example, within the Arabidopsis population, 27% of ecotypes showed no response to inoculation, while others showed either a negative (12% PRL, 4% LRN, 6% RFW and 6%SFW) or positive (8% PRL, 13% LRN, 10% RFW and 11% SFW) response to a specific trait. Considering the four growth parameters tested, 11 ecotypes showed consistently positive response whereas 6 accessions responded negatively. Indeed, some ecotypes showed different responses regarding a specific phenotypic parameter. For instance, ecotype Hod showed increased shoot fresh weight while root biomass was negatively affected. This complexity correlates well with our recent, mutational analysis of two PGPB strains that suggested that the gene functions necessary for plant root colonization are unique to a given strain, with only a few genes appearing essential for both strains tested. This large variation, coupled with normal issues found when applying biological inoculation to cropping systems, could, in large part, explain why it is not uncommon to find very variable, inconsistent results when PGPB are used under field conditions [51,52,53].
The power of the GWAS method is the ability to statistically correlate specific genetic loci with the phenotypic variation measured across the entire population [65]. Hence, we used two, orthogonal methods for data analysis with increased statistical stringency. For example, our initial analysis using a mixed-effects model identified several candidate SNPs associated with changes in primary root length and root fresh weight. However, in root length none of those SNPs were significant when submitted to a stricter statistical analysis. We encountered two major challenges to identify statistically significant SNP associations with the phenotypes measured. First, although several statistically robust models have been developed, false positives can still arise from population structure. Second is the large extended, linkage disequilibrium (LD) which results in the inclusion of many candidate genes within a single LD block, making it if very hard to ultimately identify the underlying, causative gene. For example, this might explain why none of the candidate genes associated with ∆PRL were found to respond transcriptionally to PGPB inoculation.
Among the candidate genes identified were a phosphate transporter essential for arbuscular mycorrhizal symbiosis [66] and glutamine synthetase (GS) known for its role in assimilation of nitrogen and biosynthesis of glutamine in plants. Transcriptional levels of the GS2 gene showed no changes in sugarcane leaves inoculated with several PGPB bacteria strains. However, these authors did detect biochemical differences relative to concentrations of glutamine and glutamate [67]. The ankyrin repeat family protein, was previously found in a study that characterized genes that contribute to bacterial adaptation isolated from Arabidopsis, maize, and poplar trees [68]. In rice, ankyrin-repeat protein was shown to be upregulated in response to rice leaf bright pathogen Xanthomonas oryzae (xoo) suggesting its role as a positive regulator in basal defense pathways [69].
Unfortunately, ecotype Col-0 did not respond to inoculation for any of the growth parameters measured. Hence, all the genetic resources available for this ecotype were of little use for follow-up genetic studies. For example, the gene encoding Lyst-interacting protein 5, (LIP5) was within the haplotype associated with ∆RFW. Arabidopsis LIP5 is part of the endosomal sorting complexes required for transporters (ESCORTs) for sustained protein trafficking. Lyst-interacting protein 5 (LIP5) interacts with MAP kinase 3 (MPK3) and MPK6 in response to pathogen infection, playing a critical role in plant basal resistance [70,71]. Mutational disruption of LIP5 expression had little effect on pathogen associated molecular pattern (i.e., flagellin) or salicylic acid-induced defense responses but compromised basal resistance in response to the bacterial pathogen Pseudomonas syringae [70]. We obtained the available T-DNA insertion line of AtLIP5 within the Col-O background and found, not surprisingly, that this mutation had no effect on the response of seedlings to A. olearius DQS-4T inoculation (data not shown). Hence, confirmation of those candidate genes implicated by our GWAS analysis in the PGPB response awaits the ability to use gene-editing to create mutations in those specific ecotype backgrounds that do respond to inoculation.
In summary, our study of the natural genetic variation within an Arabidopsis population showed considerable variation in the ability of plants to respond to inoculation by A. olearius DQS-4T while revealing considerable complexity regarding statistically associated loci with the growth traits measured and in the patterns (positive, neutral, negative) of those responses. Considering all candidate genes with SNP–trait associations in the GWA analysis, several have known or predicted functions that hold promise for being functional in mediating PGPB growth effects.
Supplementary Materials
The following supporting information can be downloaded at: https://www.mdpi.com/article/10.3390/microorganisms11020331/s1, Figure S1: Differential growth responses of Arabidopsis accessions to the beneficial bacterium A. olearius DQS-4T. A. Bacterial cells recovered from roots of Col-0 and WS five days after treatment with DQS-4T. No bacterial cells were recovered from the mock treatment. Results are shown in log of colony forming units (CFU) per gram of fresh root tissue. Bars are the average of root samples per treatment (n = 15). B. Growth parameters analyzed 10 days after DQS-4T treatment in Col-0 and WS accessions. Bars are average of samples (n = 32). Statistical significance is represented by ** p > 0.01, *** p > 0.001 calculated by one-way Anova; Figure S2: Manhattan plot representing SNPs upon GWA mapping. A. Lateral root number (LRN) and B. Shoot fresh weight (SFW), no significant SNPs were found at a threshold –log10(P) = 10−7 for both traits. C. Q-Q plot representation of data distribution within 305 Arabidopsis accessions. Each color represents a different set of data in –log10 (p-value), red = PRL, yellow = RFW, blue = LRN and green = SFW. According to Q-Q plot PRL and RFW showed high variability in distribution within the data, unlike LRN and SFW; Figure S3: Relative gene expression of At1G01220, L-fucose gene. RT-qPCR analysis of mRNA expression from root tissue of non-responsive genotypes (Col-0 and N7) and responsive genotypes (Ws, Kr-0 and CIBC4) 7 days after inoculation. The values are expressed as the relative quantity with respect to the control. The data represent the average of three independent experiments; Figure S4: Pearson’s correlation matrix 10 kb region surrounds a highly significant SNP 13459922 at chromosome 4. SNPs in LD with 13459922 are shown in the table with SNPs physical location; Figure S5: Relative gene expression of At4G26690, At4G26750 and At4G26770. RT-qPCR analysis of mRNA expression from root tissue of non-responsive genotypes (Col-0 and N7), responsive (Ws, Kr-0 and CIBC4) and negative response (PHW-37 and Lis-1) 7 days after inoculation. Lis-1 showed no expression detected in At4G26690 and AtG426770 genes. The values are expressed as the relative quantity with respect to the control. The data represent the average of three independent experiments.
Author Contributions
F.P.d.A. designed and performed the experiments, analyzed results and wrote the manuscript. J.W. (Juexin Wang) conducted GWA mapping and reviewed the manuscript. J.W. (Jacob Williams) developed the GWAS.Bayes R package, conducted GWA mapping and reviewed the manuscript. T.R.T. helped setup samples and phenotypic analysis. T.J. took part in GWA mapping, discussion and manuscript review. M.A.R.F. developed the GWAS.Bayes R package, conducted GWA mapping and reviewed the manuscript. G.S. designed and discussion of experiment results, wrote and reviewed the manuscript. All authors have read and agreed to the published version of the manuscript.
Funding
The work of Ferreira and Williams was supported in part by National Science Foundation Grants DMS 1853549 and DMS 2054173. This work was supported by award NSF DMS 1853556.
Data Availability Statement
Not applicable.
Acknowledgments
We would like to thank Sung-Hwan Cho for helping with results analysis and plant phenotyping discussions.
Conflicts of Interest
The authors declare that the research was conducted in the absence of any commercial or financial relationships that could be construed as a potential conflict of interest.
References
- De Brito Ferreira, E.P.; Knupp, A.M.; Garcia Martin-Didonet, C.C. Growth of rice cultivars (Oryza sativa L.) as affected by inoculation with plant growth-promoting bacteria. Biosci. J. 2014, 30, 655–665. [Google Scholar]
- Amaral, F.P.D.; Pankievicz, V.C.S.; Arisi, A.C.M.; de Souza, E.M.; Pedrosa, F.; Stacey, G. Differential growth responses of Brachypodium distachyon genotypes to inoculation with plant growth promoting rhizobacteria. Plant Mol. Biol. 2016, 90, 689–697. [Google Scholar] [CrossRef] [PubMed]
- Pedrosa, F.O.; Oliveira, A.L.M.; Guimarães, V.F.; Etto, R.M.; Souza, E.M.; Furmam, F.G.; Gonçalves, D.R.P.; Santos, O.J.A.P.; Gonçalves, L.S.A.; Battistus, A.G.; et al. The ammonium excreting Azospirillum brasilense strain HM053: A new alternative inoculant for maize. Plant Soil 2020, 451, 45–56. [Google Scholar] [CrossRef]
- Zeffa, D.M.; Perini, L.J.; Silva, M.B.; de Sousa, N.V.; Scapim, C.A.; de Oliveira, A.L.M.; Júnior, A.T.D.A.; Gonçalves, L.S.A. Azospirillum brasilense promotes increases in growth and nitrogen use efficiency of maize genotypes. PLoS ONE 2019, 14, e0215332. [Google Scholar] [CrossRef]
- Micallef, S.A.; Shiaris, M.P.; Colon-Carmona, A. Influence of Arabidopsis thaliana accessions on rhizobacterial communities and natural variation in root exudates. J. Exp. Bot. 2009, 60, 1729–1742. [Google Scholar] [CrossRef]
- Haney, C.H.; Samuel, B.S.; Bush, J.; Ausubel, F.M. Associations with rhizosphere bacteria can confer an adaptive advantage to plants. Nat. Plants 2015, 1, 15051. [Google Scholar] [CrossRef]
- Flint-Garcia, S.A. Genetics and Consequences of Crop Domestication. J. Agric. Food Chem. 2013, 61, 8267–8276. [Google Scholar] [CrossRef]
- Perez-Jaramillo, J.; Mendes, R.; Raaijmakers, J. Impact of plant domestication on rhizosphere microbiome assembly and functions. Plant Mol. Biol. 2016, 90, 635–644. [Google Scholar] [CrossRef]
- Francisco, M.; Joseph, B.; Caligagan, H.; Li, B.; Corwin, J.A.; Lin, C.; Kerwin, R.E.; Burow, M.; Kliebenstein, D.J. Genome Wide Association Mapping in Arabidopsis thaliana Identifies Novel Genes Involved in Linking Allyl Glucosinolate to Altered Biomass and Defense. Front Plant. Sci. 2016, 7, 1010. [Google Scholar] [CrossRef]
- Angelovici, R.; Batushansky, A.; Deason, N.; Gonzalez-Jorge, S.; Gore, M.A.; Fait, A.; DellaPenna, D. Network-Guided GWAS Improves Identification of Genes Affecting Free Amino Acids. Plant Physiol. 2017, 173, 872–886. [Google Scholar] [CrossRef]
- Yano, K.; Yamamoto, E.; Aya, K.; Takeuchi, H.; Lo, P.-C.; Hu, L.; Yamasaki, M.; Yoshida, S.; Kitano, H.; Hirano, K.; et al. Genome-wide association study using whole-genome sequencing rapidly identifies new genes influencing agronomic traits in rice. Nat. Genet. 2016, 48, 927–934. [Google Scholar] [CrossRef]
- Guo, Z.; Yang, W.; Chang, Y.; Ma, X.; Tu, H.; Xiong, F.; Jiang, N.; Feng, H.; Huang, C.; Yang, P.; et al. Genome-Wide Association Studies of Image Traits Reveal Genetic Architecture of Drought Resistance in Rice. Mol. Plant 2018, 11, 789–805. [Google Scholar] [CrossRef]
- Gyawali, A.; Shrestha, V.; Guill, K.E.; Flint-Garcia, S.; Beissinger, T.M. Single-plant GWAS coupled with bulk segregant analysis allows rapid identification and corroboration of plant-height candidate SNPs. BMC Plant Biol. 2019, 19, 412. [Google Scholar] [CrossRef]
- Jiang, S.; Zhang, H.; Ni, P.; Yu, S.; Dong, H.; Zhang, A.; Cao, H.; Zhang, L.; Ruan, Y.; Cui, Z. Genome-Wide Association Study Dissects the Genetic Architecture of Maize Husk Tightness. Front. Plant Sci. 2020, 11, 861. [Google Scholar] [CrossRef]
- Fang, C.; Ma, Y.; Wu, S.; Liu, Z.; Wang, Z.; Yang, R.; Hu, G.; Zhou, Z.; Yu, H.; Zhang, M.; et al. Genome-wide association studies dissect the genetic networks underlying agronomical traits in soybean. Genome Biol. 2017, 18, 161. [Google Scholar] [CrossRef]
- Qin, J.; Shi, A.; Song, Q.; Li, S.; Wang, F.; Cao, Y.; Ravelombola, W.; Song, Q.; Yang, C.; Zhang, M. Genome Wide Association Study and Genomic Selection of Amino Acid Concentrations in Soybean Seeds. Front. Plant Sci. 2019, 10, 1445. [Google Scholar] [CrossRef]
- Assefa, T.; Zhang, J.; Chowda-Reddy, R.V.; Lauter, A.N.M.; Singh, A.; O’Rourke, J.A.; Graham, M.A. Deconstructing the genetic architecture of iron deficiency chlorosis in soybean using genome-wide approaches. BMC Plant Biol. 2020, 20, 42. [Google Scholar] [CrossRef]
- Bashan, Y.; De-Bashan, L.E. How the Plant Growth—Promoting Bacterium Azospirillum Promotes Plant Growth—A Critical Assessment. Adv. Agron. 2010, 108, 77–136. [Google Scholar]
- Spaepen, S.; Vanderleyden, J. Auxin and Plant-Microbe Interactions. Cold Spring Harb. Perspect. Biol. 2011, 3, a001438. [Google Scholar] [CrossRef]
- Spaepen, S.; Vanderleyden, J.; Remans, R. Indole-3-acetic acid in microbial and microorganism-plant signaling. FEMS Microbiol. Rev. 2007, 31, 425–448. [Google Scholar] [CrossRef]
- Wintermans, P.C.; Bakker, P.A.; Pieterse, C.M. Natural genetic variation in Arabidopsis for responsiveness to plant growth-promoting rhizobacteria. Plant Mol. Biol. 2016, 90, 623–634. [Google Scholar] [CrossRef] [PubMed]
- Cao, Y.; Halane, M.K.; Gassmann, W.; Stacey, G. The Role of Plant Innate Immunity in the Legume-Rhizobium Symbiosis. Annu. Rev. Plant Biol. 2017, 68, 535–561. [Google Scholar] [CrossRef] [PubMed]
- Pankievicz, V.C.S.; do Amaral, F.P.; Santos, K.F.D.N.; Agtuca, B.; Xu, Y.; Schueller, M.J.; Arisi, A.C.M.; Steffens, M.B.R.; de Souza, E.M.; Pedrosa, F.O.; et al. Robust biological nitrogen fixation in a model grass-bacterial association. Plant J. 2015, 81, 907–919. [Google Scholar] [CrossRef] [PubMed]
- Faoro, H.; Menegazzo, R.R.; Battistoni, F.; Gyaneshwar, P.; Amaral, F.P.; Taulé, C.; Rausch, S.; Galvão, P.G.; de los Santos, C.; Mitra, S.; et al. The oil-contaminated soil diazotroph Azoarcus olearius DQS-4(T) is genetically and phenotypically similar to the model grass endophyte Azoarcus sp. BH72. Environ. Microbiol. Rep. 2017, 9, 223–238. [Google Scholar] [CrossRef]
- Do Amaral, F.P.; Tuleski, T.R.; Pankievicz, V.C.S.; Melnyk, R.A.; Arkin, A.P.; Griffitts, J.; Tadra-Sfeir, M.Z.; de Souza, E.M.; Deutschbauer, A.; Monteiro, R.A.; et al. Diverse bacterial genes modulate plant root association by beneficial bacteria. mBio 2020, 11, e03078-20. [Google Scholar] [CrossRef]
- Gourion, B.; Berrabah, F.; Ratet, P.; Stacey, G. Rhizobium-legume symbioses: The crucial role of plant immunity. Trends Plant Sci. 2015, 20, 186–194. [Google Scholar] [CrossRef]
- Roy, S.; Liu, W.; Nandety, R.S.; Crook, A.; Mysore, K.S.; Pislariu, C.I.; Frugoli, J.; Dickstein, R.; Udvardi, M.K. Celebrating 20 Years of Genetic Discoveries in Legume Nodulation and Symbiotic Nitrogen Fixation (OPEN). Plant Cell 2020, 32, 15–41. [Google Scholar] [CrossRef]
- Nakagawa, T.; Imaizumi-Anraku, H. Rice arbuscular mycorrhiza as a tool to study the molecular mechanisms of fungal symbiosis and a potential target to increase productivity. Rice 2015, 8, 32. [Google Scholar] [CrossRef]
- Pankievicz, V.C.S.; Amaral, F.P.D.; Ané, J.-M.; Stacey, G. Diazotrophic Bacteria and their Mechanisms to Interact and Benefit Cereals. Mol. Plant-Microbe Interact. 2021, 34, 491–498. [Google Scholar] [CrossRef]
- Nordborg, M.; Hu, T.T.; Ishino, Y.; Jhaveri, J.; Toomajian, C.; Zheng, H.; Bakker, E.; Calabrese, P.; Gladstone, J.; Goyal, R.; et al. The pattern of polymorphism in Arabidopsis thaliana. PLoS Biol. 2005, 3, e196. [Google Scholar] [CrossRef]
- Curtin, S.J.; Tiffin, P.; Guhlin, J.; Trujillo, D.I.; Burghardt, L.T.; Atkins, P.; Baltes, N.J.; Denny, R.; Voytas, D.F.; Stupar, R.M.; et al. Validating Genome-Wide Association Candidates Controlling Quantitative Variation in Nodulation. Plant Physiol. 2017, 173, 921–931. [Google Scholar] [CrossRef]
- Flint-Garcia, S.A.; Thornsberry, J.M.; Buckler, E.S. Structure of linkage disequilibrium in plants. Annu. Rev. Plant Biol. 2003, 54, 357–374. [Google Scholar] [CrossRef]
- Chen, M.-H.; Sheu, S.-Y.; James, E.K.; Young, C.-C.; Chen, W.-M. Azoarcus olearius sp. nov., a nitrogen-fixing bacterium isolated from oil-contaminated soil. Int. J. Syst. Evol. Microbiol. 2013, 63, 3755–3761. [Google Scholar] [CrossRef]
- Okon, Y.; Labandera-Gonzalez, C.A. Agronomic applications of azospirillum: An evaluation of 20 years worldwide field inoculation. Soil Biol. Biochem. 1994, 26, 1591–1601. [Google Scholar] [CrossRef]
- Klassen, G.; Pedrosa, F.O.; Souza, E.M.; Funayama, S.; Rigo, L.U. Effect of nitrogen compounds on nitrogenase activity in Herbaspirillum seropedicae SMR1. Can. J. Microbiol. 1997, 43, 887–891. [Google Scholar] [CrossRef]
- Bradbury, P.J.; Zhang, Z.; Kroon, D.E.; Casstevens, T.M.; Ramdoss, Y.; Buckler, E.S. TASSEL: Software for association mapping of complex traits in diverse samples. Bioinformatics 2007, 23, 2633–2635. [Google Scholar] [CrossRef]
- Kim, S.; Plagnol, V.; Hu, T.T.; Toomajian, C.; Clark, R.M.; Ossowski, S.; Ecker, J.R.; Weigel, D.; Nordborg, M. Recombination and linkage disequilibrium in Arabidopsis thaliana. Nat. Genet. 2007, 39, 1151–1155. [Google Scholar] [CrossRef]
- Williams, J.; Ferreira, M.A.R.; Ji, T. GWAS.BAYES: An R Package for Bayesian Analysis of GWAS Data. R Package Version 1.0.0. 2020, Bioconductor. Available online: https://www.bioconductor.org/packages/release/bioc/html/GWAS.BAYES.html (accessed on 6 July 2020).
- Williams, J.; Ferreira, M.A.R.; Ji, T. BICOSS: Bayesian iterative conditional stochastic search for GWAS. BMC Bioinform. 2022, 23, 475. [Google Scholar] [CrossRef]
- R Core Team. R: A Language and Environment for Statistical Computing; R Foundation for Statistical Computing: Vienna, Austria, 2022. [Google Scholar]
- Ruijter, J.M.; Ramakers, C.; Hoogaars, W.M.H.; Karlen, Y.; Bakker, O.; van den Hoff, M.J.B.; Moorman, A.F.M. Amplification efficiency: Linking baseline and bias in the analysis of quantitative PCR data. Nucleic Acids Res. 2009, 37, e45. [Google Scholar] [CrossRef]
- Parry, G.; Ward, S.; Cernac, A.; Dharmasiri, S.; Estelle, M. The Arabidopsis SUPPRESSOR OF AUXIN RESISTANCE proteins are nucleoporins with an important role in hormone signaling and development. Plant Cell 2006, 18, 1590–1603. [Google Scholar] [CrossRef]
- Li, C.; Liu, L.; Teo, Z.W.N.; Shen, L.; Yu, H. Nucleoporin 160 Regulates Flowering through Anchoring HOS1 for Destabilizing CO in Arabidopsis. Plant Commun. 2020, 1, 100033. [Google Scholar] [CrossRef] [PubMed]
- Silverstone, A.L.; Tseng, T.-S.; Swain, S.; Dill, A.; Jeong, S.Y.; Olszewski, N.E.; Sun, T.-P. Functional analysis of SPINDLY in gibberellin signaling in Arabidopsis. Plant Physiol. 2007, 143, 987–1000. [Google Scholar] [CrossRef] [PubMed]
- Dong, M.A.; Farre, E.M.; Thomashow, M.F. Circadian Clock-Associated 1 And Late Elongated Hypocotyl Regulate Expression of the C-Repeat Binding Factor (CBF) pathway in Arabidopsis. Proc. Natl. Acad. Sci. USA 2011, 108, 7241–7246. [Google Scholar] [CrossRef] [PubMed]
- Dong, M.A.; Farre, E.M.; Thomashow, M.F. The Glycerophosphoryl Diester Phosphodiesterase-Like Proteins SHV3 and its Homologs Play Important Roles in Cell Wall Organization. Plant Cell Physiol. 2008, 49, 1522–1535. [Google Scholar]
- Cingolani, P.; Platts, A.; Wang, L.L.; Coon, M.; Nguyen, T.; Wang, L.; Land, S.J.; Lu, X.; Ruden, D.M. A program for annotating and predicting the effects of single nucleotide polymorphisms, SnpEff: SNPs in the genome of Drosophila melanogaster strain w1118; iso-2; iso-3. Fly 2012, 6, 80–92. [Google Scholar] [CrossRef] [PubMed]
- Compant, S.; Duffy, B.; Nowak, J.; Clément, C.; Barka, E.A. Use of plant growth-promoting bacteria for biocontrol of plant diseases: Principles, mechanisms of action, and future prospects. Appl. Environ. Microbiol. 2005, 71, 4951–4959. [Google Scholar] [CrossRef]
- Fukami, J.; Nogueira, M.A.; Araujo, R.S.; Hungria, M. Accessing inoculation methods of maize and wheat with Azospirillum brasilense. Amb Express 2016, 6, 3. [Google Scholar] [CrossRef]
- Di Benedetto, N.A.; Corbo, M.R.; Campaniello, D.; Cataldi, M.P.; Bevilacqua, A.; Sinigaglia, M.; Flagella, Z. The role of Plant Growth Promoting Bacteria in improving nitrogen use efficiency for sustainable crop production: A focus on wheat. Aims Microbiol. 2017, 3, 413–434. [Google Scholar] [CrossRef]
- Timmusk, S.; Behers, L.; Muthoni, J.; Muraya, A.; Aronsson, A.-C. Perspectives and Challenges of Microbial Application for Crop Improvement. Front. Plant Sci. 2017, 8, 49. [Google Scholar] [CrossRef]
- Roy, S.; Liu, W.; Nandety, R.S.; Crook, A.; Mysore, K.S.; Pislariu, C.I.; Frugoli, J.; Dickstein, R.; Udvardi, M.K. Plant Growth-Promoting Rhizobacteria: Context, Mechanisms of Action, and Roadmap to Commercialization of Biostimulants for Sustainable Agriculture. Front. Plant Sci. 2018, 9, 1473. [Google Scholar]
- Gange, A.C.; Gadhave, K.R. Plant growth-promoting rhizobacteria promote plant size inequality. Sci. Rep. 2018, 8, 13828. [Google Scholar] [CrossRef]
- Battenfield, S.D.; Sheridan, J.L.; Silva, L.D.C.E.; Miclaus, K.J.; Dreisigacker, S.; Wolfinger, R.D.; Peña, R.J.; Singh, R.P.; Jackson, E.W.; Fritz, A.K.; et al. Breeding-assisted genomics: Applying meta-GWAS for milling and baking quality in CIMMYT wheat breeding program. PLoS ONE 2018, 13, e0204757. [Google Scholar] [CrossRef]
- Gupta, P.K.; Kulwal, P.L.; Jaiswal, V. Association mapping in plants in the post-GWAS genomics era. Adv. Genet. 2019, 104, 75–154. [Google Scholar]
- Tsai, H.-Y.; Janss, L.L.; Andersen, J.R.; Orabi, J.; Jensen, J.D.; Jahoor, A. Genomic prediction and GWAS of yield, quality and disease-related traits in spring barley and winter wheat. Sci. Rep. 2020, 10, 3347. [Google Scholar] [CrossRef]
- Eichler, E.E.; Flint, J.; Gibson, G.; Kong, A.; Leal, S.M.; Moore, J.H.; Nadeau, J.H. Missing heritability and strategies for finding the underlying causes of complex disease. Nat. Rev. Genet. 2010, 11, 446–450. [Google Scholar] [CrossRef]
- Johannes, F.; Porcher, E.; Teixeira, F.K.; Saliba-Colombani, V.; Simon, M.; Agier, N.; Bulski, A.; Albuisson, J.; Heredia, F.; Audigier, P.; et al. Assessing the impact of transgenerational epigenetic variation on complex traits. PLoS Genet. 2009, 5, e1000530. [Google Scholar] [CrossRef]
- Manolio, T.A.; Collins, F.S.; Cox, N.J.; Goldstein, D.B.; Hindorff, L.A.; Hunter, D.J.; McCarthy, M.I.; Ramos, E.M.; Cardon, L.R.; Chakravarti, A.; et al. Finding the missing heritability of complex diseases. Nature 2009, 461, 747–753. [Google Scholar] [CrossRef]
- Bergelson, J.; Roux, F. Towards identifying genes underlying ecologically relevant traits in Arabidopsis thaliana. Nat. Rev. Genet. 2010, 11, 867–879. [Google Scholar] [CrossRef]
- Bodenhausen, N.; Horton, M.W.; Bergelson, J. Bacterial Communities Associated with the Leaves and the Roots of Arabidopsis thaliana. PLoS ONE 2013, 8, e56329. [Google Scholar] [CrossRef]
- Brachi, B.; Morris, G.P.; Borevitz, J.O. Genome-wide association studies in plants: The missing heritability is in the field. Genome Biol. 2011, 12, 232. [Google Scholar] [CrossRef]
- Wang, J.; Joshi, T.; Valliyodan, B.; Shi, H.; Liang, Y.; Nguyen, H.T.; Zhang, J. A Bayesian model for detection of high-order interactions among genetic variants in genome-wide association studies. BMC Genom. 2015, 16, 1011. [Google Scholar] [CrossRef] [PubMed]
- Beneduzi, A.; Ambrosini, A.; Passaglia, L.M.P. Plant growth-promoting rhizobacteria (PGPR): Their potential as antagonists and biocontrol agents. Genet. Mol. Biol. 2012, 35, 1044–1051. [Google Scholar] [CrossRef] [PubMed]
- Zhang, Z.; Ersoz, E.; Lai, C.-Q.; Todhunter, R.J.; Tiwari, H.K.; Gore, M.A.; Bradbury, P.J.; Yu, J.; Arnett, D.K.; Ordovas, J.M.; et al. Mixed linear model approach adapted for genome-wide association studies. Nat. Genet. 2010, 42, 355–360. [Google Scholar] [CrossRef] [PubMed]
- Javot, H.; Penmetsa, R.V.; Terzaghi, N.; Cook, D.R.; Harrison, M.J. A Medicago truncatula phosphate transporter indispensable for the arbuscular mycorrhizal symbiosis. Proc. Natl. Acad. Sci. USA 2007, 104, 1720–1725. [Google Scholar] [CrossRef]
- Cipriano, M.; Freitas-Iório, R.; Dimitrov, M.; de Andrade, S.; Kuramae, E.; Silveira, A. Plant-Growth Endophytic Bacteria Improve Nutrient Use Efficiency and Modulate Foliar N-Metabolites in Sugarcane Seedling. Microorganisms 2021, 9, 479. [Google Scholar] [CrossRef]
- Levy, A.; Salas Gonzalez, I.; Mittelviefhaus, M. Genomic features of bacterial adaptation to plants. Nat. Genet. 2018, 50, 138–150. [Google Scholar] [CrossRef]
- Mou, S.; Liu, Z.; Guan, D.; Qiu, A.; Lai, Y.; He, S. Functional analysis and expressional characterization of rice ankyrin repeat-containing protein, OsPIANK1, in basal defense against Magnaporthe oryzae attack. PLoS ONE 2013, 8, e59699. [Google Scholar] [CrossRef]
- Wang, F.; Shang, Y.; Fan, B.; Yu, J.-Q.; Chen, Z. Arabidopsis LIP5, a Positive Regulator of Multivesicular Body Biogenesis, Is a Critical Target of Pathogen-Responsive MAPK Cascade in Plant Basal Defense. PLoS Pathog. 2014, 10, e1004243. [Google Scholar] [CrossRef]
- Buono, R.A.; Valencia, J.P.; Miller, N.D.; Goodman, K.; Spitzer, C.; Spalding, E.P.; Otegui, M.S. Role of SKD1 Regulators LIP5 and IST1-LIKE1 in Endosomal Sorting and Plant Development. Plant Physiol. 2016, 171, 251–264. [Google Scholar] [CrossRef]


Disclaimer/Publisher’s Note: The statements, opinions and data contained in all publications are solely those of the individual author(s) and contributor(s) and not of MDPI and/or the editor(s). MDPI and/or the editor(s) disclaim responsibility for any injury to people or property resulting from any ideas, methods, instructions or products referred to in the content. |
© 2023 by the authors. Licensee MDPI, Basel, Switzerland. This article is an open access article distributed under the terms and conditions of the Creative Commons Attribution (CC BY) license (https://creativecommons.org/licenses/by/4.0/).