Article

Understanding the Effect of Different Glucose Concentrations in the Oligotrophic Bacterium Bacillus subtilis BS-G1 through Transcriptomics Analysis

Key Laboratory of Ministry of Education for Protection and Utilization of Special Biological Resources, School of Life Sciences, Ningxia University, Yinchuan 750021, China
*
Author to whom correspondence should be addressed.
Microorganisms 2023, 11(10), 2401; https://doi.org/10.3390/microorganisms11102401
Submission received: 26 August 2023 / Revised: 16 September 2023 / Accepted: 22 September 2023 / Published: 26 September 2023
(This article belongs to the Section Environmental Microbiology)

Abstract

:
Glucose is an important carbon source for microbial growth, and its content in infertile soils is essential for the growth of bacteria. Since the mechanism of oligotrophic bacterium adaptation in barren soils is unclear, this research employed RNA-seq technology to examine the impact of glucose concentration on the oligotrophic bacterium B. subtilis BS-G1 in soil affected by desertification. A global transcriptome analysis (RNA-Seq) revealed that the significantly differentially expressed genes (DEGs) histidine metabolism, glutamate synthesis, the HIF-1 signaling pathway, sporulation, and the TCA cycle pathway of B. subtilis BS-G1 were significantly enriched with a 0.015 g/L glucose concentration (L group), compared to a 10 g/L glucose concentration (H group). The DEGs amino acid system, two-component system, metal ion transport, and nitrogen metabolism system of B. subtilis BS-G1 were significantly enriched in the 5 g/L glucose concentration (M group), compared with the H group. In addition, the present study identified the regulation pattern and key genes under a low-glucose environment (7 mRNAs and 16 sRNAs). This study primarily investigates the variances in the regulatory pathways of the oligotrophic B. subtilis BS-G1, which holds substantial importance in comprehending the mechanism underlying the limited sugar tolerance of oligotrophic bacteria.

1. Introduction

The limitation of nutrients in ecosystems is a significant constraint on the vitality of microbial life [1]. Numerous microorganisms that thrive in nutrient-poor environments, including freshwater lakes, deserts, plateaus, and oceans, have been identified [2,3,4,5]. Among these microorganisms, nutrient-poor bacteria can be classified as specialized or parthenogenetic. Obligately oligotrophic bacteria can only proliferate in media containing carbon concentrations ranging from 1 to 15 mg/L and are not well-suited to nutrient-rich conditions [6,7]. Conversely, facultatively oligotrophic bacteria are capable of growth and adaptation in both high and low concentrations of organic carbon [8]. Due to their predominant distribution in highly nutrient-depleted environmental settings, this particular assemblage of bacteria exhibits sluggish growth rates, protracted growth cycles, a diminutive size, and the ability to traverse 0.45 μm filter membranes. Consequently, researchers have designated them as filterable bacteria and ultramicrobacteria [9,10]. Given their exacting requirements for survival conditions, oligotrophic bacteria are difficult to culture in the laboratory [11]. For example, the discovery of Planctomycetes can be attributed to the Hungarian biologist Nador Gimesi who, in 1924, initially found it at the lake Langymanyos. However, due to the unavailability of a pure culture strain, researchers worldwide were limited to studying it solely through its morphological description. It was not until 1973 that Staley successfully isolated the strain, marking a significant milestone in the understanding of Planctomycetes [12]. In 1976, Bauld and Staley provided a formal description of this strain as the inaugural species within the phylum Planctomycetes, relying on phenotypic and genetic characterization. Subsequently, from 1987 to 2006, Carl Woese and Strous et al. further substantiated the relationship between Planctomycetes and Chlamydomonas through phenotypic observations and comparisons of protein sequences [13]. The precise identification of the strain took a total of 76 years (1924–2020), with 49 of those years (1924–1973) attributed to the inability to acquire a pure culture of the strain, which hindered its comprehensive study by microbiologists [14].
Bacteria are required to swiftly acclimate to ongoing fluctuations in their surroundings, encompassing scarcities in nutrients, variations in oxygen availability, and exposure to abiotic stresses (e.g., alterations in temperature) [7,15,16]. This adaptability is especially crucial for bacteria that exist independently. Glucose is the optimum carbon source for bacteria, as it supplies both the energy and material resources necessary for strain growth. Therefore, a diminished concentration of glucose hurts strain growth [9,17,18]. Previous studies have demonstrated that propionic acid, a metabolite known for its growth-inhibitory properties, accumulates significantly in a culture medium under controlled glucose concentrations of 1 g/L and 0.2 g/L, consequently impacting the growth conditions of B. subtilis [10]. Additionally, it has been proposed that the presence of β-glucosidase (UnBgl1A) enables B. subtilis to withstand a glucose concentration of 0.9 M [9,19]. However, previous research investigating the adaptation of B. subtilis to low-sugar conditions employed glucose concentration as a manipulated variable to examine its impact on strain growth rate, the production of fermentation products (such as microbial fibrillases), the feedback inhibition of β-glucosidase, and glucose transport [9,10,19,20]. The phosphoenolpyruvate-dependent phosphotransferase system (PTS) is of the utmost importance in the bacterial glucose transportation process, facilitating the movement of specific sugars across the bacterial inner membrane through sugar phosphorylation [21,22,23,24,25]. It has been observed that bacteria commonly possess a PTS for glucose uptake, and it has been discovered that a non-glucose PTS can transport glucose as well (e.g., the cellobiose PTS can facilitate intracellular glucose transport) [22]. Another study revealed that the PTS is capable of detecting variations in nutrient levels within the surrounding environment, thereby facilitating appropriate cellular responses to these fluctuations [26].
Bacterial small regulatory RNAs (sRNAs), which typically range from 50 to 500 nucleotides in length, serve as significant post-transcriptional regulators of gene expression in response to environmental stimuli stressors [27,28,29,30,31,32]. sRNAs, which are transcribed from intergenic regions and do not undergo translation, exhibit a high degree of conservation among homologs [33]. These sRNAs exert their influence on mRNA stability and translation by forming base pairs with the 5′-untranslated region (5′-UTR) of the target mRNA or with bases in the ribosome-binding site (RBS) [28,34,35,36]. sRNAs can positively or negatively regulate target genes. For example, sRNAs can negatively regulate their targets by inhibiting translation or stimulating degradation via ribonuclease RNase E [37,38,39,40]. The interaction of sRNAs with target mRNAs generally requires the RNA chaperone Hfq, which binds to sRNAs, promotes sRNA–mRNA base pairing, and directly binds and regulates the translation of certain mRNAs [39,41,42,43]. Furthermore, one sRNA usually regulates multiple mRNAs, and one mRNA can be handled by various sRNAs, thus forming a regulatory network to respond to changing environments [44]. sRNAs have been identified in many bacteria, including Escherichia coli, Staphylococcus aureus, and Vibrio cholerae, where they play key roles in these bacteria’s adaptation to environmental stress and virulence [41,42,45]. sRNAs also affect the pathogenesis of Gram-positive Enterococcus faecalis by regulating its growth and survival under various environmental stresses, including iron stress [43].
Many researchers have studied the responses of oligotrophic bacteria to low nutrition. Prochlorococcus, a cyanobacterium, exhibits a high abundance in oligotrophic marine environments [46]. Studies have shown that nitrogen limitation reduces the photosynthetic rate of Prochlorococcus, while it increases the concentration of metabolic intermediates [47]. Researchers have found that Erwinia amylovora responds to oligotrophic environments by reducing its cell volume and regulating the expression of genes related to hunger, oxidative stress, motility, pathogenicity, and virulence [48]. Furthermore, Prochlorococcus can decrease protein abundance and suppress gene translation under conditions of nitrogen limitation, consequently diminishing the cell’s nitrogen requirements [49]. B. subtilis is characterized by a fast growth rate and low nutritional requirements. Under unfavorable growing conditions and nutrient deficiency, the organism typically enters a period of spore dormancy, during which it develops spores that exhibit a robust resilience to adverse circumstances. B. subtilis exhibits multiple coping strategies in response to abiotic stresses such as ethanol, alkali, low-nutrient, and nitrogen stresses. B. subtilis mitigates the deleterious effects of salt stress on the strain through the modulation of antioxidant defense and the glyoxalase system, alongside the maintenance of ion homeostasis and osmotic regulation [50]. The synthesis of tryptophan in B. subtilis is enhanced under conditions of ethanol stress [51]. In the presence of alkaline stress, the biomass of Bacillus natto exhibited an increase, while the rate of spore formation demonstrated a decrease. Additionally, the synthesis and accumulation of menaquinone-7 (MK-7) were facilitated [52]. The oligotrophic B. subtilis cells showed an increased tolerance to chloramphenicol, ampicillin, and oxidative stress [53]. However, researchers have discovered that, when subjected to severe hunger conditions, B. subtilis cells exhibit the formation of spherical non-dormant structures, which exhibit prolonged viability for several months [53]. ABC transport-binding proteins are critical for the transport and metabolism of nutrients in oligotrophic bacteria in the ocean [54,55]. In addition, eutrophic bacteria transport external nutrients through the ABC transport system, while oligotrophic bacteria prefer to use the PTS to absorb external nutrients [55,56,57,58]. Oligotrophic bacteria grow slowly in media and pick low-molecular-weight (LMW) organic molecules for growth compared to high concentrations of organic matter (HMW biopolymers) [59,60,61]. Many researchers have explored the hunger stress response of oligotrophic bacteria in water environments. However, there are few reports on the low-sugar tolerance strategies of the oligotrophic bacteria of poor soil, and the mechanism of their adaptation to low sugar is still unclear. Due to the impact of climate change, land use, and human activities, the ecosystem may become unstable, necessitating the implementation of a strategy to detect microbial responses to environmental changes. This approach can serve as an early warning system, enabling the timely detection of environmental changes and facilitating the implementation of appropriate remedial measures. Research has demonstrated that the assessment of cyanobacteria density in aquatic environments can effectively predict alterations in water quality, thereby assisting managers in mitigating water quality issues [62]. In addition, researchers have used qRT-PCR to quantify Microcystis spp. toxin genes in lakes to determine the dynamics of cyanobacterial blooms [63,64]. Ningxia is one of the provinces with the most severe desertification in China, with a desertification area of 2.898 million hm2, accounting for 55.8% of the total land area of Ningxia. Land degradation has seriously affected the local ecological environment and people’s lives [19,65]. Hence, the accurate anticipation of alterations in soil nutrient levels holds significant relevance in the context of managing sandy soils. This study employed RNA-Seq to elucidate the adaptation patterns of B. subtilis BS-G1 under varying glucose concentrations. In addition, this study aims to identify the crucial mRNAs and sRNAs involved in low-glucose adaptation and establish a theoretical foundation for the development of biogenetic early warning indicators for soil impoverishment.

2. Materials and Methods

2.1. Strain

The oligotrophic bacterium of B. subtilis BS-G1 was isolated from microbial crusts that developed early in the desertification area of Ningxia. B. subtilis W1, B. subtilis MX31, B. subtilis ACCC11025, B. subtilis 168, and B. subtilis L1 were stored in our laboratory (Ningxia University, Yinchuan, China).

2.2. Growth Curve and Determination of Residual Sugar Content

One loop of each strain was taken from an agar plate, inoculated in 5 g/L oligotrophic culture medium, and incubated at 37 °C, 150 r/min. After approximately 8 h, the bacterial concentration reached approximately 1.2 (OD600). This was reserved as seed solution. The seed solution was inoculated in an oligotrophic medium with 3 glucose concentrations (0.015 g/L, 5 g/L, and 10 g/L) and cultured at 37 °C and 150 r/min for the growth curve. The bacterial residual sugar content in the medium was measured every 2 h using a biosensor analyzer, SBA-40D.

2.3. Construction of Transcriptome and Processing of Biological Information

The activated B. subtilis BS-G1 seed solution was picked and inoculated with 2% inoculum in the oligotrophic culture medium, cultured at 37 °C, 150 r/min for 8 h. The bacterial mixture was then centrifuged at 10,000× g for 15 min to obtain the total bacterial pellets. The pellets were gently washed three times with PBS (10 mM, pH 7.4) and all experiments were conducted with three biological replicates. The Trizol reagent method was employed to extract total RNA from the collected cells, while DNase I (Takara, Beijing, China) was used to remove genomic DNA.
Fragmented mRNA was used as a template to synthesize the first strand of cDNA, and RNase H was used to degrade the RNA strand for the preparation of the second strand of cDNA. The purified cDNA was repaired and connected to the sequencing adapter, and the library was completed after purification. RNA-seq paired-end sequencing was performed using Illumina HiSeq X Ten (2 × 150 bp).

2.4. Reading Mapping and Analysis

Read quality was first examined using FastQC. The original read data from RNA-Seq libraries were then mapped to the B. subtilis BS-G1 genome, using Bowtie2 with standard parameterization. The calculated uniquely mapped read counts were fed into DESeq2 (version 1.40.2) for the quantitation of significant gene expression with standard parameterization. DEGs identified by DESeq2 were filtered using a moderate absolute |log2(Fold Change)| > 1 and p-value < 0.05. The read counts were transformed into TPM to evaluate the gene expression levels. The Kyoto Encyclopedia of Genes and Genomes (KEGG) database was used to annotate the lists of significantly expressed genes with pathway details. The Gene Ontology (GO) database predicted the functions of the genes in B. subtilis BS-G1.

2.5. Bioinformatics Analysis

The bioinformatics analysis was conducted utilizing data generated by the Illumina platform. The analyses were conducted utilizing the cloud platform (cloud.majorbio.com, accessed on 17 August 2020) provided by Shanghai Majorbio Bio-pharm Technology Co., Ltd. (Shanghai, China).

2.6. Quantitative Real-Time PCR (qRT-PCR)

qRT-PCR determined the gene expression level. The extracted RNA was used for reverse transcription to obtain cDNA according to the manufacturer’s protocol (Prime Script RT reagent Kit, Takara, Beijing, China). TB Green Premix Ex Taq II (Takara) was utilized to carry out the qRT-PCR reaction. The 2−ΔΔCT method was used to assess the fold change in the target genes compared to the internal reference gene. Each qRT-PCR was performed at least three times. Table S14 includes the primers used for qRT-PCR.

2.7. Statistical Analysis

A one-way ANOVA was used for comparisons among multiple groups. p-value < 0.05 (*), p-value < 0.01 (**), p-value < 0.001 (***), and p-value < 0.0001 (****) were considered statistically significant, and p-value > 0.05 was non-significant (ns). GraphPad Prism was used for statistical analysis.

3. Results

3.1. Growth Curves and Glucose Utilization

Through the assessment of the growth curve of B. subtilis BS-G1 and five control strains under a glucose concentration of 0.015 g/L, it was observed that solely B. subtilis BS-G1 exhibited normal growth patterns. B. subtilis BS-G1 exhibits normal growth within a glucose concentration range of 0.015–10 g/L, and an elevation in glucose concentration within the culture medium proves advantageous for the strain’s growth (Figure 1). The findings of this study suggest that B. subtilis BS-G1 exhibits the characteristics of a facultative oligotrophic bacterium.
By determining the sugar uptake curves of B. subtilis BS-G1 and five control strains at a 0.015 g/L glucose concentration, it was found that the fastest rate of sugar uptake was found in B. subtilis BS-G1 (Figure 2a). The rate of sugar uptake of B. subtilis BS-G1 in the range of 0.015–10 g/L glucose sugar concentration was found to increase with the increase in the glucose concentration, and the strain sugar uptake curve reached a stabilization period at 16 h of incubation (Figure 2b).

3.2. Transcriptome Analysis of B. subtilis under Different Glucose Concentrations

In this study, we constructed nine cDNA libraries, including bacteria from the B. subtilis BS-G1 strain with three glucose concentrations (L group, M group, H group). Samples were used for processing and controls. After removing sequencing adapters and low-quality data, 592,812,250 filtered reads were obtained with a Q30 base percentage that was higher than 96.11% for each sample. Then, the filtered reads from each sample were aligned to the reference genome, and the filtered reads for each sample were compared with the reference genome. The mapping efficiency was between 98.91% and 99.32%. Higher mapping percentages indicated a good sequencing quality of the samples (Table S1). A transcriptome data analysis showed that 4020 genes (mRNA) were expressed in B. subtilis BS-G1 under different glucose concentrations. The above genes were compared with GO, COG, and KEGG databases. Among them, the COG annotation rate was 77.63%, and the GO annotation rate was 73.25%. The KEGG annotation rate was 54.60% from the perspective of the KEGG pathway (Table S2). We analyzed the differences in the gene expression of B. subtilis BS-G1 treated with different glucose concentrations for 12 h. The results show 1821 differentially expressed DEGs (mRNAs) in the L group vs. the H group (LvsH), of which 1099 DEGs were significantly upregulated and 722 DEGs were significantly downregulated. At the same time, 1571 DEGs were detected in the M group vs. the H group (MvsH), of which 845 DEGs were significantly upregulated and 726 DEGs were considerably downregulated (Figure S1). The DEGs fold change distributions of LvsH and MvsH showed that the genes with the most significant fold change in DEGs were distributed between 1 ≤ |Log2FC| < 2 (Figure S2).

3.3. Transcriptome Differential Gene Annotation

The DEGs were annotated and classified according to the COG database. As shown in Figure 3, among the six functions, the number of upregulated DEGs is higher than the number of downregulated DEGs. These six functions are “cell cycle control, cell division, chromosome allocation,” “intracellular trafficking, secretion, and vesicular trafficking,” “transcription,” “amino acid transport and metabolism,” “nucleotide transport and metabolism,” and “lipid transport and metabolism” (Figure 3). The annotation results of the DEGs in KEGG pathways showed that the four KEGG functions with the most DEGs in the LvsH and MvsH were “amino acid transport and metabolism,” “carbohydrate transport and metabolism,” “membrane transport,” and “lipid metabolism” (Figure 4). The KEGG annotation results are consistent with previous analyses based on COG categories. The results also show that different sugar levels mainly affected the “amino acid metabolism,” “carbohydrate metabolism,” “membrane transport,” “cofactor and vitamin metabolism,” and “energy metabolism process” of B. subtilis BS-G1.

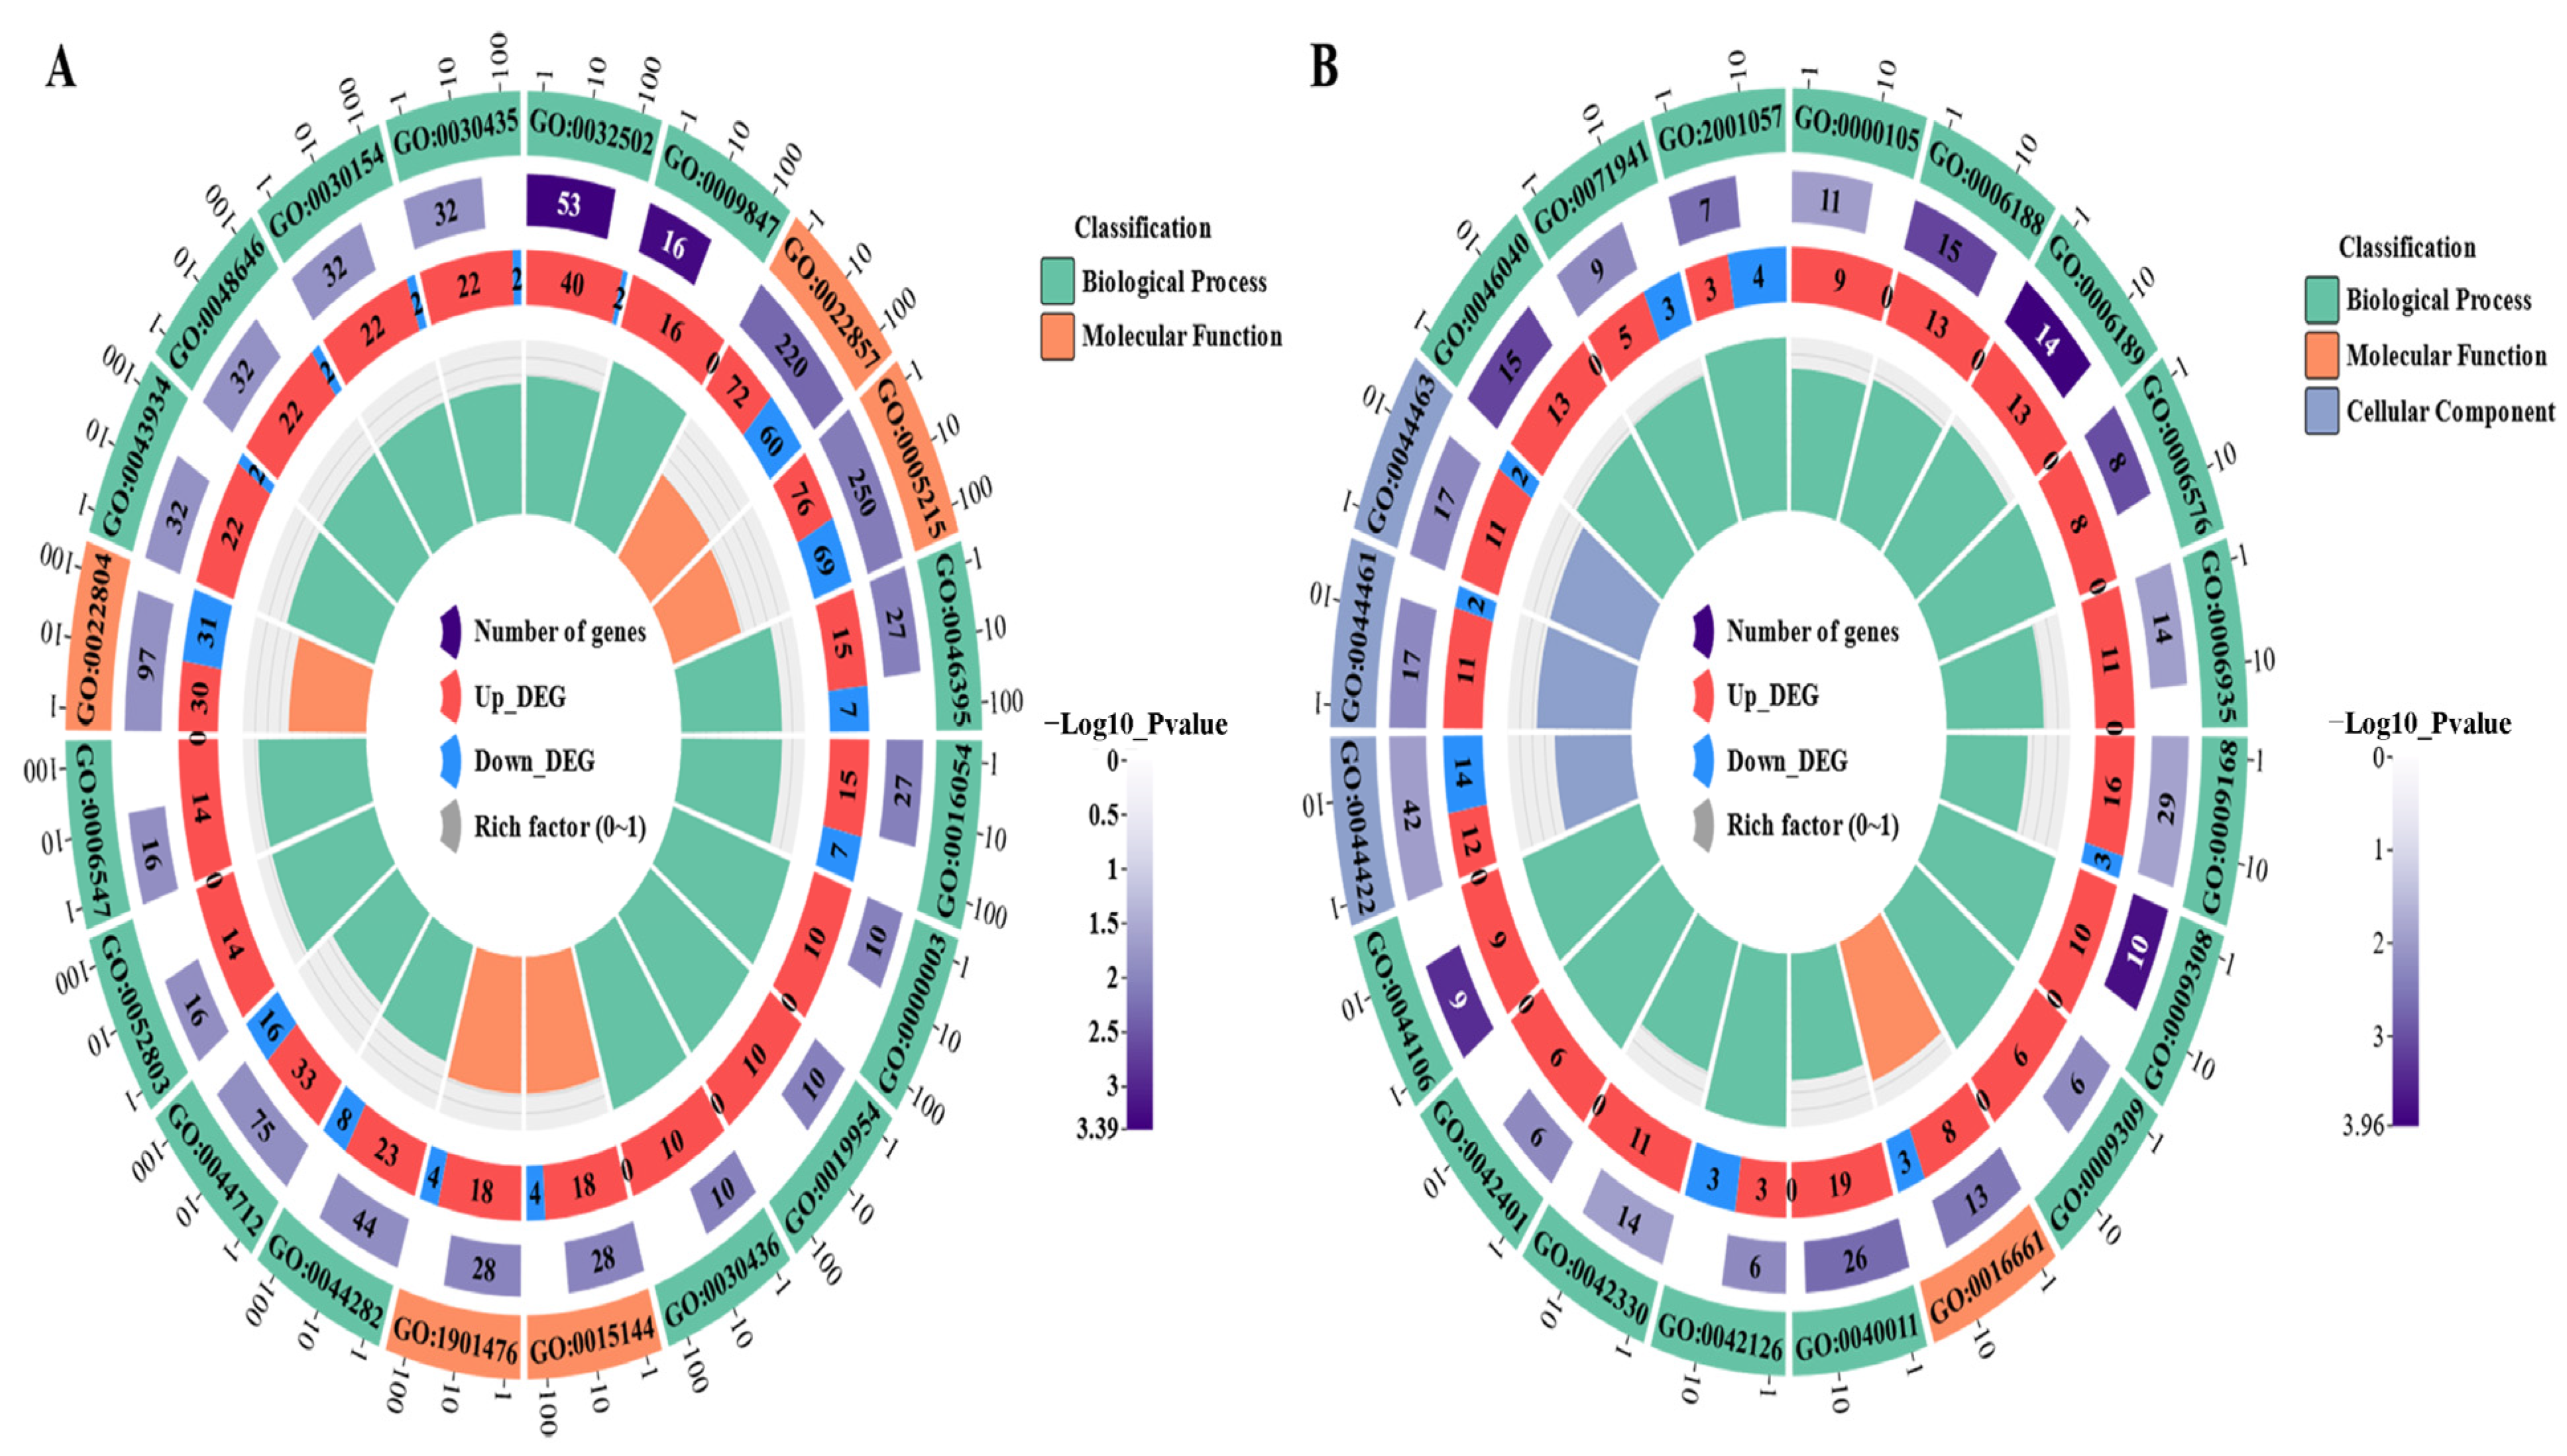
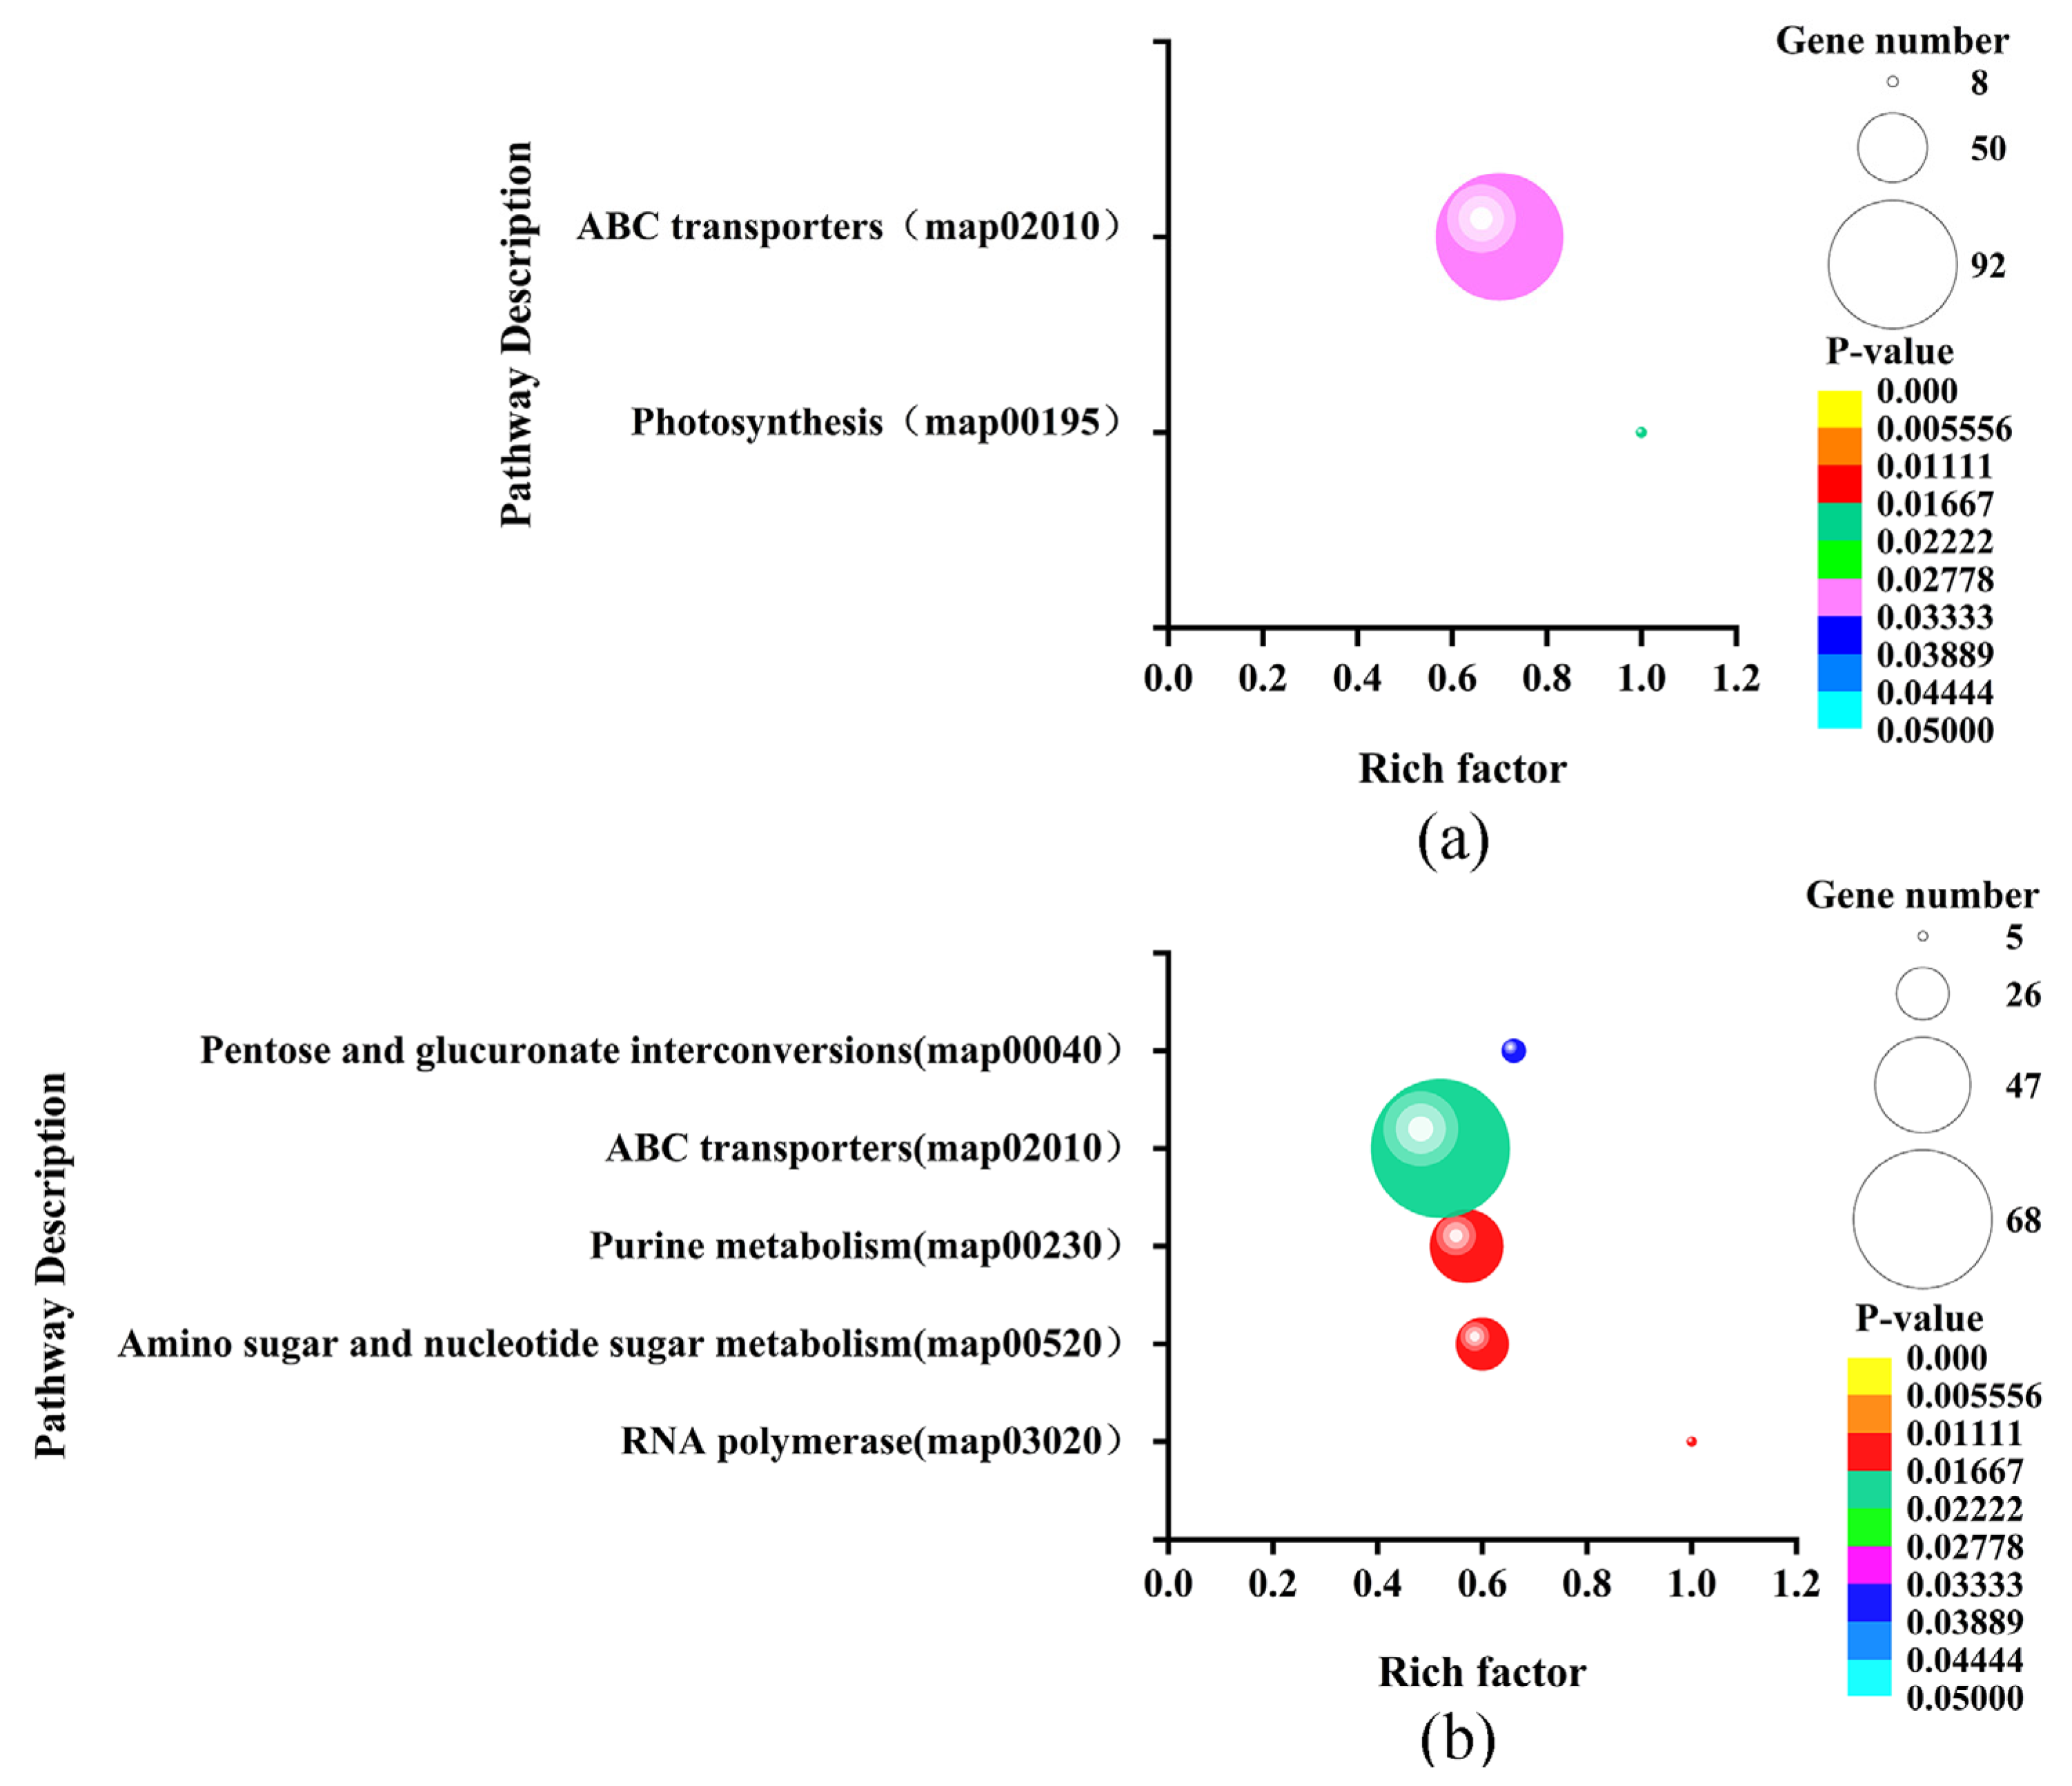
3.4. GO Functional Enrichment and KEGG Pathway Enrichment

To systematically determine the DEGs’ possible functions and participating pathways, we performed GO and KEGG pathway enrichment analyses on the DEGs. The GO enrichment analysis showed that the GO annotations of the DEGs were divided into three parts: biological process (BP), cellular composition (CC), and molecular function (MF). It was found that the top 20 GO terms that were enriched by the DEGs of LvsH were mainly divided into three categories, namely transporter activity, sporulation, and catabolism of histidine and acidic organic compounds (Table S6). The top 20 GO terms that were significantly enriched in DEGs in MvsH were mainly enriched in five aspects: histidine synthesis, nucleotide synthesis and metabolism, oxidoreductase activity, sports, and metabolism of nitrogenous inorganic salts (Table S7). The corresponding numbers of DEGs in the significantly enriched pathways in LvsH and MvsH are shown in Figure 5.
The KEGG enrichment analysis showed that the DEGs of LvsH were mainly concentrated in the porphyrin and chlorophyll metabolism, PTS, histidine metabolism, glycolysis/gluconeogenesis, butyrate metabolism, and HIF-1 signaling pathway (Figure 6a). The DEGs of MvsH were mainly concentrated in KEGG pathways such as the arginine biosynthesis, flagellar assembly, two-component system, and nitrogen metabolism (Figure 6b).

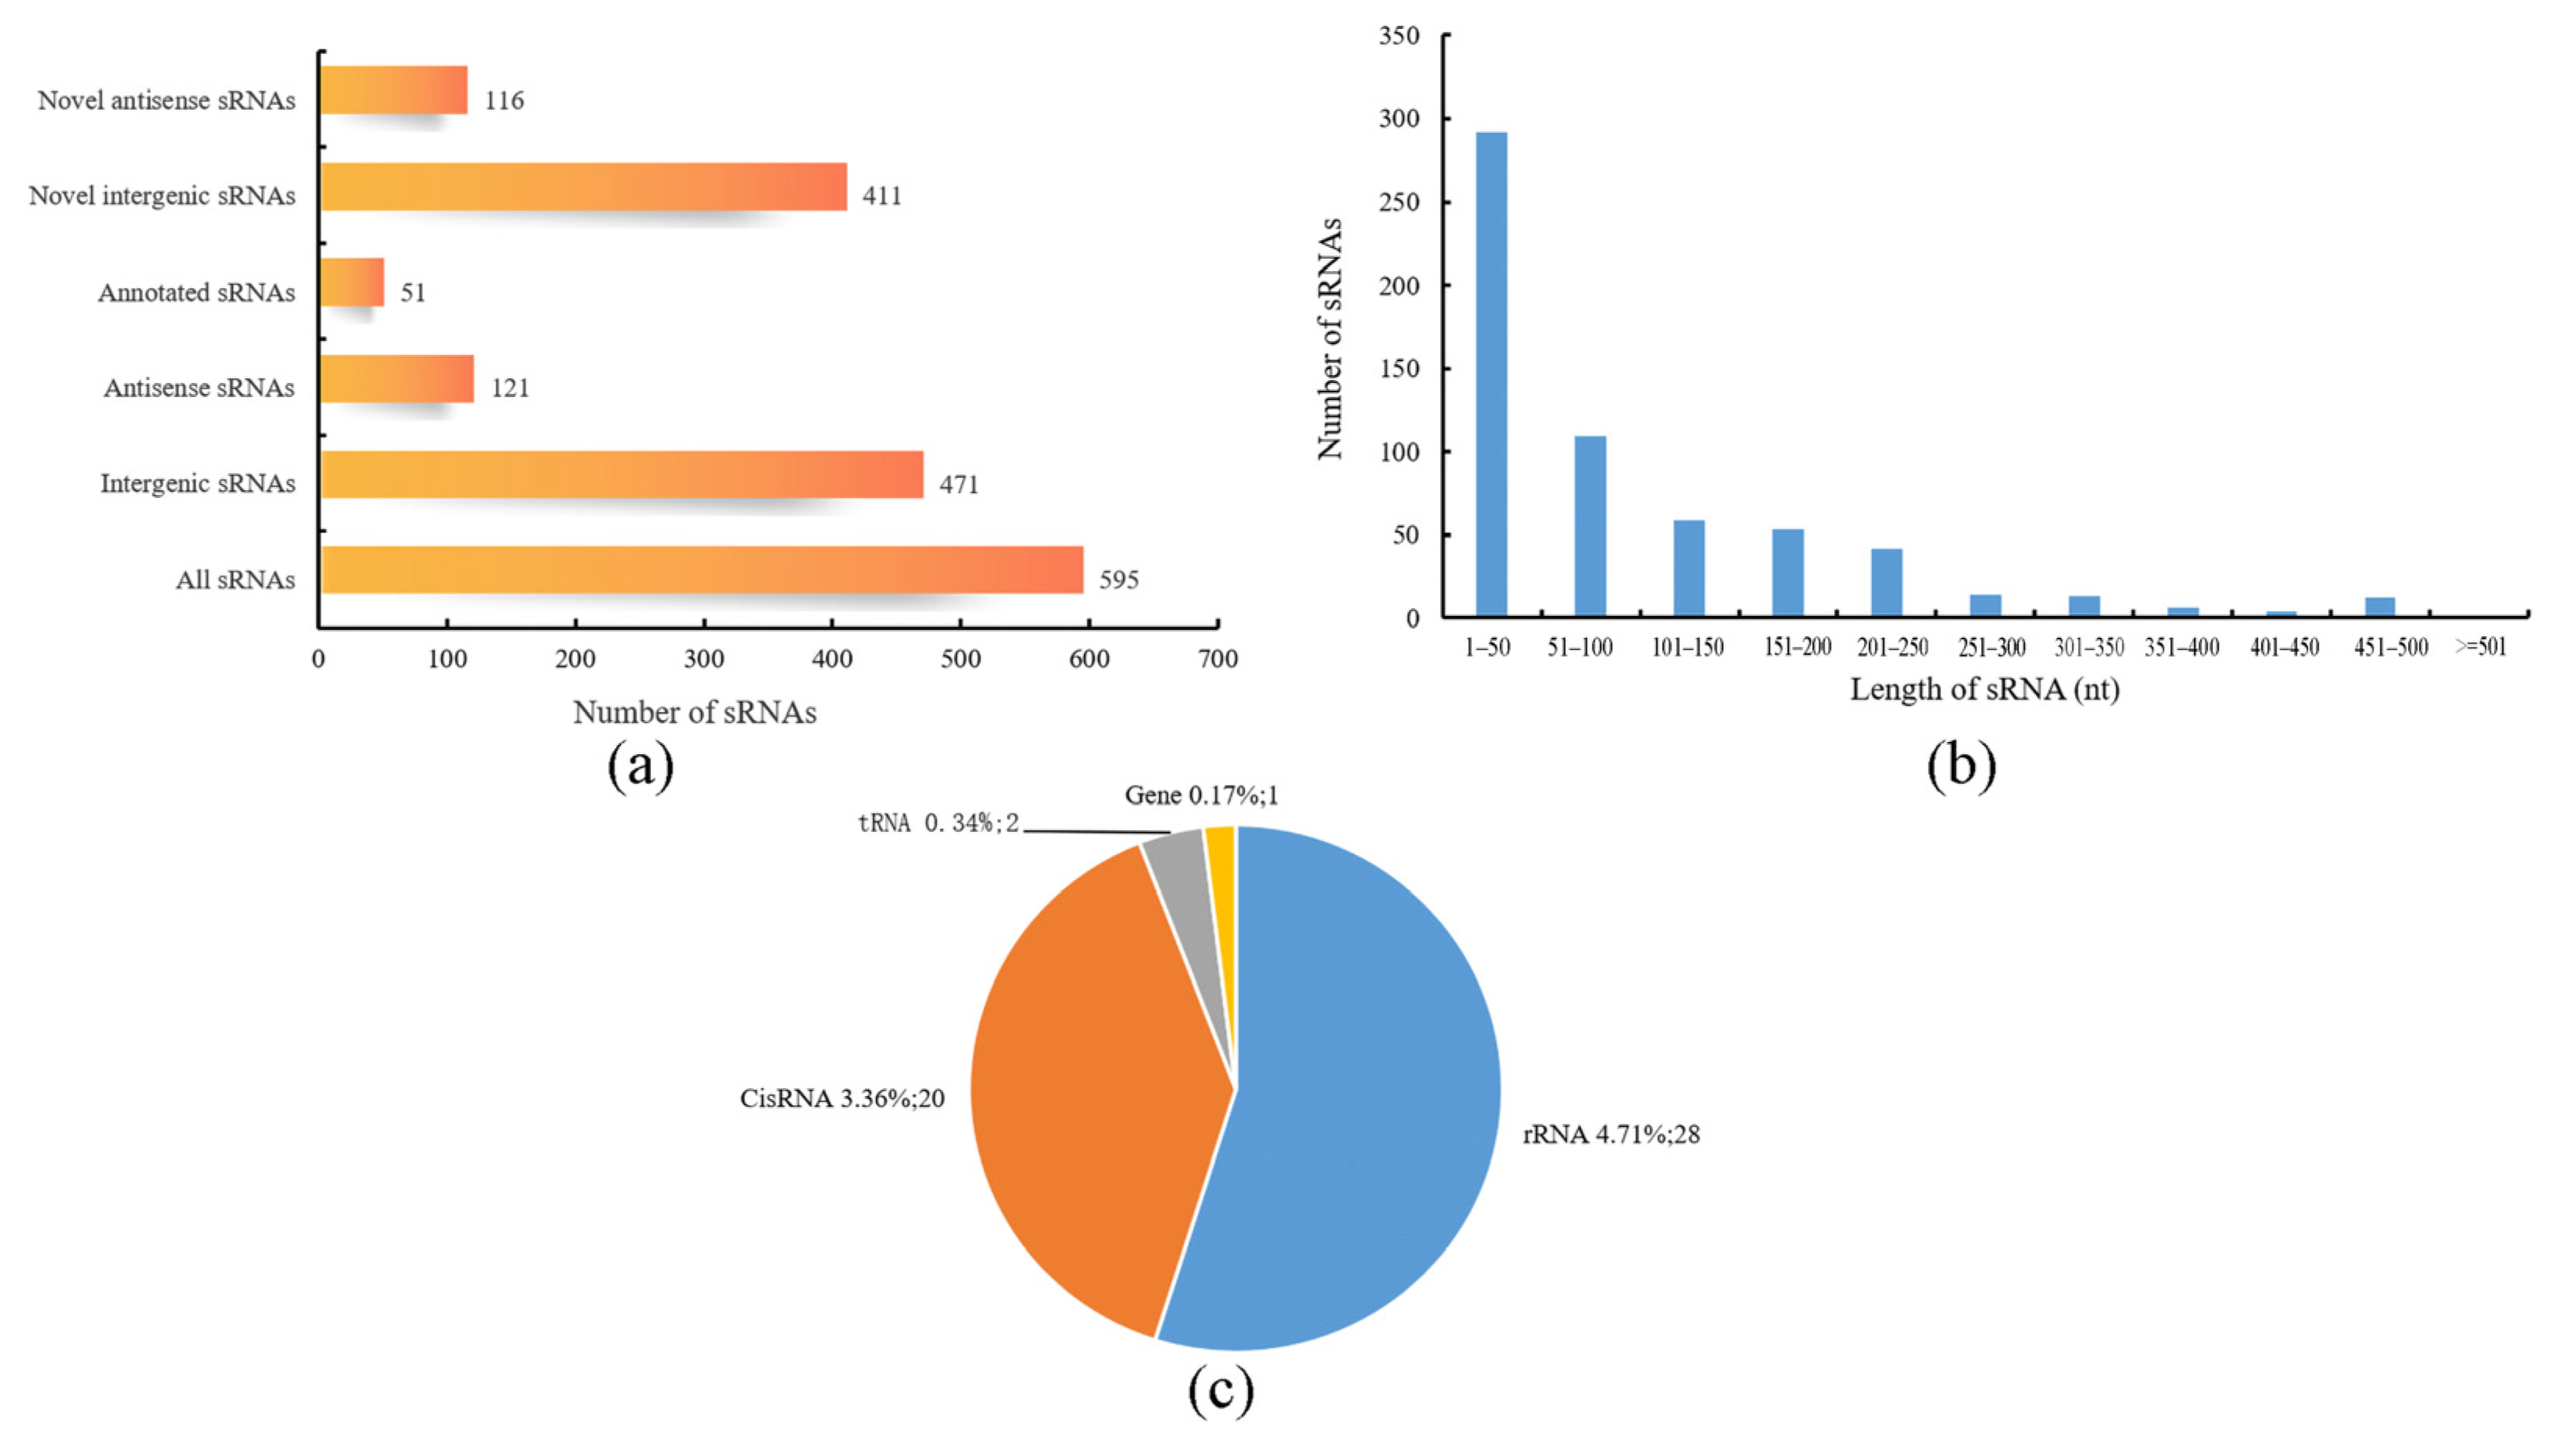
3.5. sRNA Analysis of B. subtilis BS-G1 under Different Glucose Concentrations

A total of 595 sRNAs were identified in the B. subtilis BS-G1 strain, and these ranged from 1 nt to 500 nt in length, with an average length of 95 nt (Figure 7b). The sRNAs can be divided into two types: one is the sRNAs that act on the intergenic region of the target mRNA, and the other is the antisense sRNAs that work on the SD sequence or part of the coding region of the target mRNA. Among the sRNAs that were identified in this study, there were 471 intergenic sRNAs and 121 antisense sRNAs, of which 51 were annotated (Figure 7a). Comparing the sRNAs with known functions in the Rfam database, 51 sRNAs were annotated, including 28 rRNAs, 2 tRNAs, 20 CisRNAs, and one which was annotated as a bacterial large signal recognition particle RNA (Figure 7c). In terms of the differential expression analysis display, compared with the H group, the L group had the most differentially expressed sRNAs, including 101 upregulated sRNAs and 41 downregulated sRNAs. The M group had 24 upregulated sRNAs and 30 downregulated sRNAs (Figure 8).

3.6. Annotation of Significantly Differentially Expressed sRNAs Target Genes

We compared sRNAs’ target genes that were significantly differentially expressed in LvsH and MvsH with the COG database. The results revealed that the key categories were “carbohydrate transport and metabolism,” “amino acid transport and metabolism,” “transcription,” and “cell wall/membrane/envelope biogenesis” (Figure 9). This is consistent with the COG annotation results for DEGs. In addition, the target genes in the LvsH were also involved in “inorganic ion transport and metabolism,” “replication, recombination and repair,” and “energy production and conversion” (Figure 9a). Target genes were also assigned to “signal transduction mechanisms” and “coenzyme transport and metabolism” in the MvsH (Figure 9b).

3.7. Enrichment Analysis of sRNA Target Genes

To further evaluate the function of the significantly differentially expressed sRNAs’ target genes, we performed GO and KEGG enrichment analysis on these target genes. The sRNAs’ target genes that were significantly differentially expressed in LvsH were greatly enriched. The top 20 GO terms in the set were divided into six categories: ATPase activity, hydrolase activity, transporter activity, localization, material transport, and nucleoside triphosphatase activity (Table S8). The sRNAs’ target gene enrichment pathways of MvsH are classified into 10 categories, namely transporter, nucleoside sugar synthesis, plasma membrane, others, nucleotide synthesis and metabolism, nitrogen metabolism, metal ion transport, ATPase activity, anhydride hydrolase, and amino acid synthesis (Table S9). The KEGG enrichment results show that LvsH significantly differentially expressed the sRNAs’ target genes and enriched two genes, including those related to photosynthesis and the ABC transporter, as shown in the KEGG pathway (Figure 10a). MvsH significantly differentially expressed the sRNAs’ target genes and enriched five KEGG pathways, namely “RNA polymerase, amino sugar and nucleotide sugar metabolism, purine metabolism, ABC transporter, pentose and glucuronate interconversion” (Figure 10b).

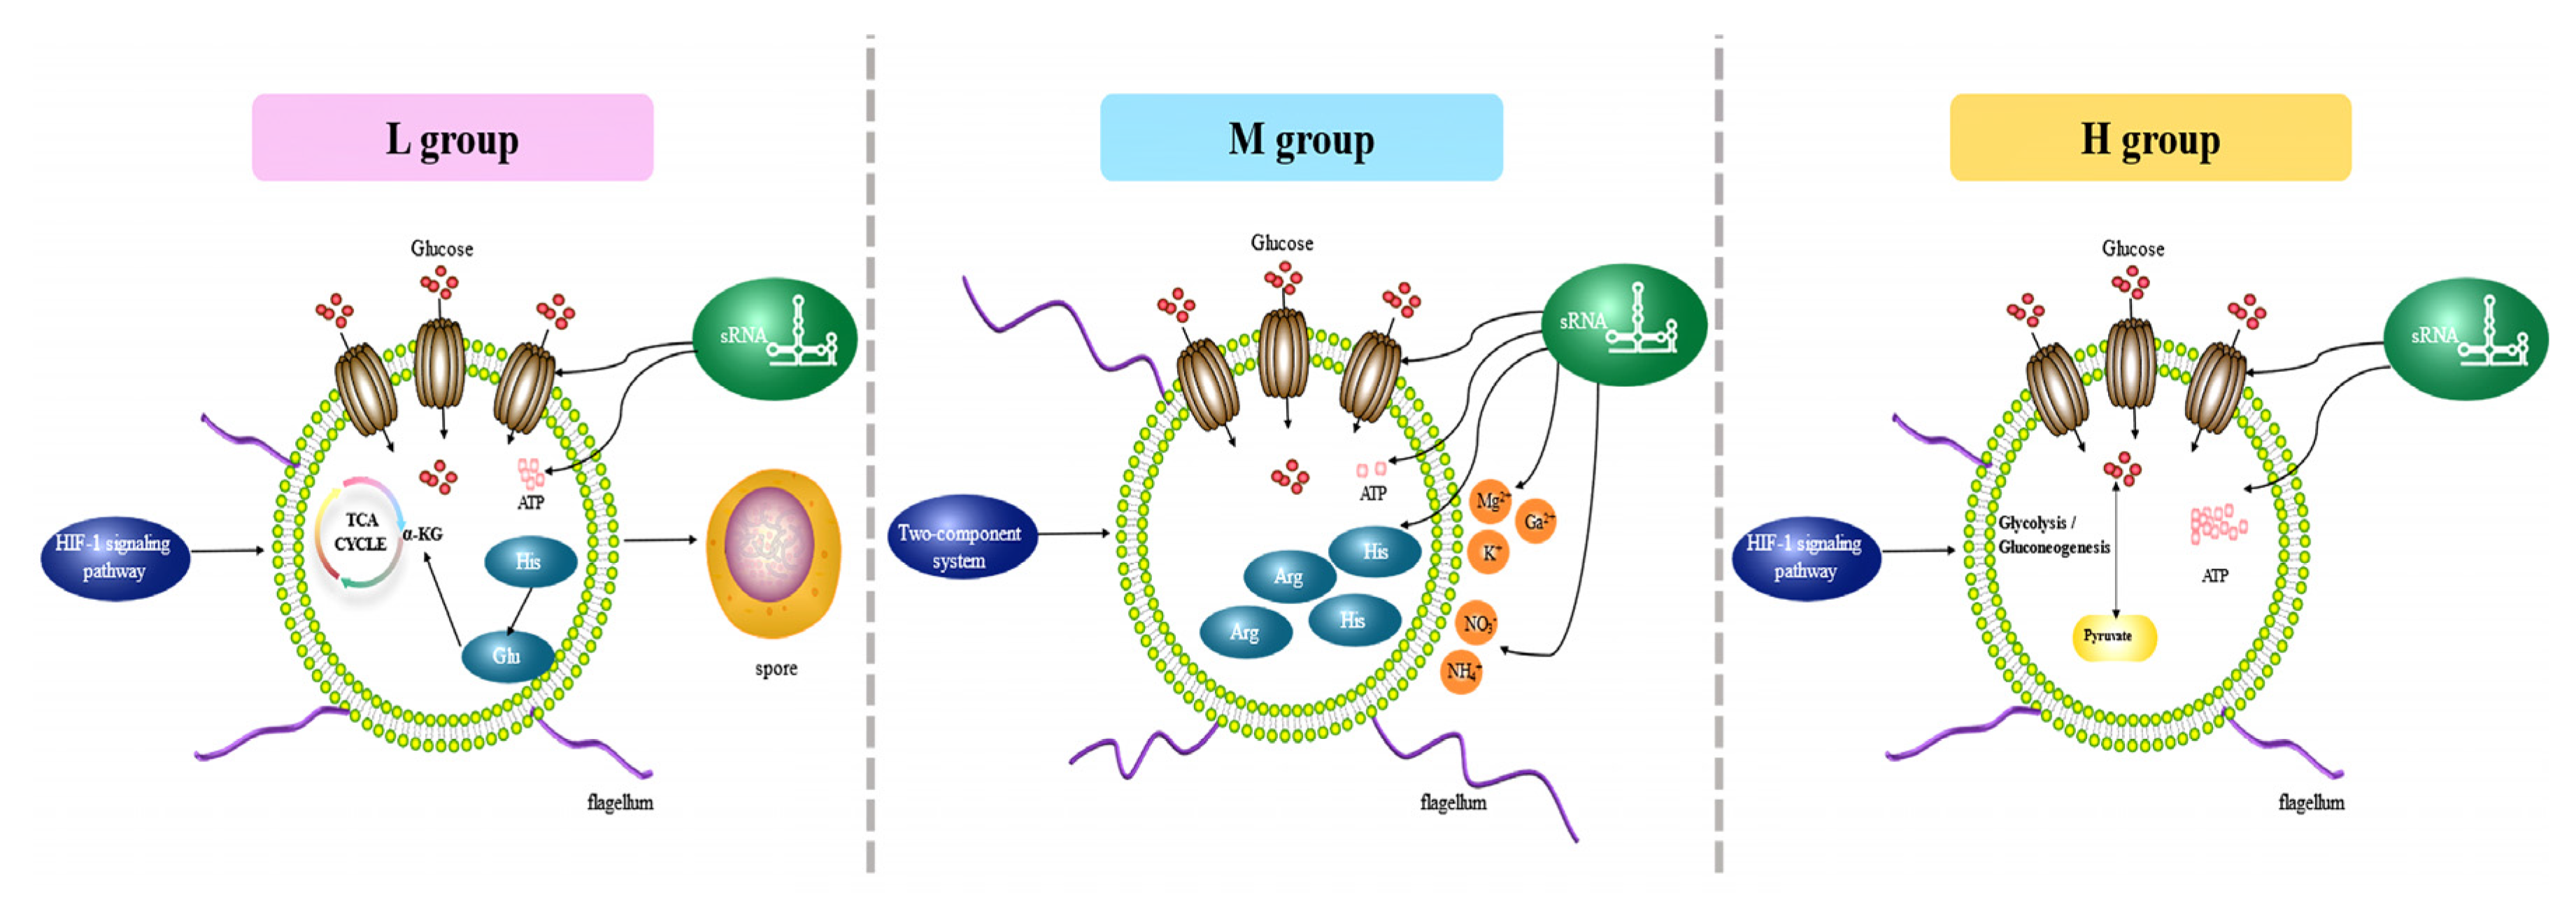
3.8. Adaptation Patterns and Key Genes in a Low-Glucose Environment

Based on the enrichment results of the B. subtilis BS-G1 strain DEGs and the significantly differentially expressed sRNA target genes identified by GO/KEGG, we constructed the adaptation model of the B. subtilis BS-G1 strain under different glucose concentrations (Figure 11). As the concentration of glucose in the medium decreased, the activity of the glucose transporter increased, the aerobic oxidation pathway of glucose weakened, the amount of ATP produced decreased, and it gradually transformed into a dormant body. In addition, B. subtilis BS-G1 in the H group and L group sensed changes in the external nutrient content through the HIF-1 signaling pathway, while B. subtilis BS-G1 in the M group received external environmental signals through a two-component system and quickly transmitted them to the bacteria to make more nutritional changes, leading to positive and effective adaptive responses. Nitrogen-containing inorganic salts (NH4+ and NO3−) and metal ions (Mg2+, K+, and Ca2+) in the culture medium were utilized by strains in the M group. The production and metabolism of amino acids played a positive regulatory role in the strain’s adaptation to different glucose environments, and the output of histidine and arginine in the M group increased. The L group of histidine is converted into glutamic acid, and glutamic acid enters the TCA cycle through further metabolism to generate α-ketoglutarate. Among the amino acid groups, the imidazole group of histidine can form coordination compounds with metal ions in the medium, which is beneficial to maintaining cell homeostasis and controlling the transportation of nutrients. The highly helical flagella of the strains in the M group increased the motility, driving the strains to more beneficial nutritional small molecules or ions and avoiding substances that were not conducive to their growth. At different glucose concentrations, sRNAs’ targets regulate transporter activity, ion transport, amino acid production, and ATP generation pathways.

3.9. Critical Genes for Low-Sugar Adaptation

To explore the adaptation mechanism of B. subtilis BS-G1 under a low concentration of glucose, we determined the vital pathway for the strain to adapt to an environment of 0.015 g/L glucose through an GO/KEGG enrichment analysis of the DEGs and sRNA target genes of LvsH, namely the transport pathway. All genes in the transport pathway were screened (screening condition |Log2FC| ≥ 5), and, finally, crucial mRNAs (7) and sRNAs (15) that were adapted to the 0.015 g/L glucose environment were obtained. The seven key mRNAs were divided into three categories, amino acid ABC transporters, PTS component proteins, and glutaminase ABC transporters (Table 1 and Table 2).
Taking seven key mRNAs as the central genes and analyzing their interaction with their corresponding sRNAs, the two key mRNAs (gene0435 and gene3876) with the highest degree of network connection were determined. mtlA (gene0435) and celB (gene3876) are mannitol and mannose PTS transporter subunits, respectively. Among them, three key sRNAs (sRNA0504, sRNA0362, and sRNA0200) were connected to two key mRNAs (Figure 12).

3.10. qRT-PCR Validation of DEGs

To further verify the reliability of the transcriptome results, we selected five DEGs (gene3877, gene0435, gene0646, gene1536, gene0436) that are related to carbohydrate transport for qRT-PCR (Figure S3). Although the relative expression values determined by qRT-PCR did not exactly match those obtained from transcriptome sequencing, they were similar to the gene expression trends (up or downregulation) obtained from the transcriptomes.

4. Discussion

It has been shown in previous reports that the transport system of bacteria is closely related to stress [66,67]. In this study, we explored possible mechanisms of sugar stress through transcriptome analysis. This study showed that the four pathways and PTS related to transporter activity were significantly enriched in the LvsH by GO functional enrichment and KEGG enrichment (Figure 5 and Figure 6). It was reported that the transporter activity genes of Lactiplantibacillus plantarum ZDY2013 were significantly differentially expressed under acid stress [66]. This is consistent with the results of this study. In this study, the DEGs associated with LvsH transporter activity were mainly divided into ABC transporters, MFS transporters, and PTS transporters. Studies have shown that, under acid-stress conditions, genes related to ABC and PTS transporters in L. plantarum ZDY2013 changed significantly [66]. The MFS transporter is the most important secondary active transporter on the cell membrane, and can selectively transport monosaccharides, oligosaccharides, nucleotides, and other substrates. Studies have shown that, under pH stress, the expression of the MFS transporter of Enterococcus faecalis is upregulated, thereby enhancing the efflux capacity of hydrogen ions and enhancing the strain’s tolerance to acid [67]. Glucose is mainly transported across membranes through the PTS. Studies have shown that, under butanol stress, the transcription of PTS genes transporting mannitol and cellobiose in L. plantarum WCFS1 is downregulated [68]. It has been reported that, under oxidative stress, the expression of multiple PTS genes in Listeria monocytogenes YjbH is downregulated, and the degree of downregulation is as great as hundreds of times the normal amount [69]. In addition, transport proteins are important osmoregulators that are responsible for the uptake and excretion of vital substances such as inorganic ions, sugars, and amino acids. This plays a critical role in regulating the osmotic pressure of the B. subtilis BS-G1 strain in a low-concentration glucose environment.
Metal ions play an essential role in maintaining cellular homeostasis and controlling transport. Among them, K+ and Na+ play a vital role in cell homeostasis, membrane transport, and the regulation of osmotic pressure [70,71,72]. Ktr system potassium transporter A (gene3042) was significantly upregulated in both LvsH and MvsH, and the degree of upregulation of LvsH was more prominent (Tables S10 and S11). There are two forms of Na+ transporter, symport and anti-transport. Na+ symport may be related to the absorption of amino acids, sugars, organic cations, or anions. The sodium–proton antiporter (gene0984) was significantly upregulated in both LvsH and MvsH. Studies have shown that, when Dietzia sp. DQ12-45-1b after Na+/H+ antiporter mutation and wild-type Dietzia sp., DQ12-45-1b were cultured in 0.25–1 M NaCl. Simultaneously, in cells of the wild-type strain, the degree of enrichment was significantly higher than that of the mutant strain [73]. K+ and Na+ are closely related to the spore germination process, and spore germination will stimulate the release of K+ and Na+ [74]. In addition, studies have shown that the accumulation of K+ also induces the germination of spores [75]. In this study, “endospore-forming prespores” and “intracellular immature spores” were highly enriched among GO functional enrichments in DEGs of the LvsH. Under harsh conditions, B. subtilis can be transformed into endospores to survive under the regulation of SigB [76]. When favorable growing conditions return, the spores exit dormancy and germinate. Mg2+ is an essential divalent cation for every cell and an important cofactor in DNA replication, transcription, and translation [77,78,79]. Mg2+ must pass through the biomembrane through Mg2+ transporters. So far, there are four Mg2+ transporters: CorA, MgtA/B, MgtA, and NramP [80]. However, in prokaryotes, Mg2+ is mainly transported by CorA and MgtA [77,78,79]. In this study, corA (gene0850) was significantly upregulated in both LvsH and MvsH, and the upregulation degree of LvsH was higher than that of MvsH (Tables S10 and S11). Jayanti Saha et al. analyzed the genome and comparative genome of Pseudomonas aeruginosa and believed that corA might be necessary for strains to resist heavy metal toxicity [81]. It is indicated that, in the L group, B. subtilis BS-G1 tried to maintain the homeostasis of cells by strengthening the transport of Mg2+ in the medium. Iron ions are essential cofactors for cellular processes, playing important roles in respiration, nitrogen fixation, DNA synthesis, the TCA cycle, and oxygen transport [82,83,84]. As a regulator of iron uptake, Fur can bind to Fe2+ to control the vehicle of Fe2+ [83,85]. In this study, both LvsH and MvsH iron transporters (gene0417, gene0416, and gene3287) were significantly downregulated, but the degree of downregulation of LvsH was lower than that of MvsH (Tables S10 and S11). Transcriptome analysis of the metal ion uptake system of Clostridium beijerinckii NRRL B-598 by Maryna Vasylkivska’s team found that the expression of genes related to the iron uptake system increased during the sporulation stage [70]. Iron has been reported to help facilitate the germination process of spores [86]. When Samuel Plante et al. studied spore germination and the siderophore transporter Str1, they believed that siderophores might be secreted when the bacteria transformed from a swollen round reproductive body to a vase-shaped dormant body [86]. As a second messenger, Ca2+ can participate in many physiological activities of organisms, including maintaining cell membrane homeostasis, regulating the growth and development of organisms, and regulating enzyme activities [86,87]. Studies have shown that Ca2+ helps to reduce the accumulation of cadmium in Phanerochaete chrysosporium, thereby reducing the toxic effect of cadmium on the strain [87]. This study showed that the calcium/proton exchanger chaA (gene0837) was significantly upregulated in LvsH but not significantly differentially expressed in MvsH. Studies by Yingkun Wan et al. showed that, after chaA-knockout E. coil and wild-type E. coil were treated with gentamicin for six days, the number of cells in the knockout strain was notably reduced compared to the wild-type strain [88].
Chemotaxis in B. subtilis and other bacteria is a widely studied adaptive mechanism by which bacteria detect chemical compounds and exhibit movement towards or away from specific compounds [89,90,91]. This mechanism plays an important role in cell growth, biofilm formation, virulence, and infectivity. The bacterial flagellum is a macromolecular complex consisting of approximately 20,000–30,000 protein subunits, including about 30 different proteins [90]. Our results show that there is a significant upregulation of flagellar synthesis genes in the M group. This study demonstrated that P. extremaustralis exhibited the upregulation of flagellar genes (flgB, flgN, flgM) in response to an oxygen-stress environment. This upregulation led to an increased motility of the strain, enabling it to evade toxic compounds such as H2O2 [92].
sRNAs are regulators involved in gene expression in organisms. Under adverse circumstances, organisms will regulate gene transcription levels through sRNAs or produce new proteins to cope with the stress [93]. In this study, LvsH and MvsH identified 156 and 161 differentially expressed sRNAs’ target genes related to carbohydrate metabolism and transport, respectively (Tables S12 and S13). The researchers placed Salmonella enterica under non-starvation and carbon-source-starvation treatments and found that the differentially expressed sRNAs’ target genes contained multiple genes related to carbohydrate transport and metabolism [94]. In Caulobacter crescentus with oligotrophic characteristics, an sRNA that is closely related to carbon starvation was identified, CrfA, which can target and regulate the mRNA of various membrane transporters [95]. In this study, LvsH and MvsH significantly differentially expressed sRNA target genes, and GO and KEGG functional enrichment showed that ABC transporters, membrane functions, and fatty acid biosynthesis were considerably enriched, indicating that, under different carbon-source conditions, sRNAs may be transported. Protein diversification regulates the strain’s carbon source uptake capacity. In addition, we found that sacA (gene3825, gene3444) in LvsH and sacA (gene3825), sacB (gene4085), and sacC (gene4086) in MvsH strains were all significantly upregulated (Tables S15 and S16). Sac proteins belong to the Bgl-Sac anti-termination protein family, which is essential in responding to carbon-source starvation. Sac anti-termination protein consists of one RNA-binding domain and two regulatory domains (PRD1 and PRD2), these being reversible phosphorylation binding sites which act in response to cognate carbon sources. In the absence of carbon sources, the protein phosphorylates PRD1 through the EII transporter of the PTS, making it inactive [85]. In the presence of a carbon source, the EII transporter dephosphorylates PRD1, while the HPr protein (a non-sugar-specific component of the PTS) phosphorylates PRD2. When PRD1 is not phosphorylated and PRD2 is phosphorylated, the anti-terminator protein will form a homodimer, which can combine with the target gene to form an anti-terminator structure, thereby ensuring the regular operation of the PTS [96].
Histidine is the α-amino β-imidazolyl propionic acid of the eight-gene operon hisGDC[NB]HAF[IE] [97]. The HisF gene encodes a cyclase that forms a heterodimer holoenzyme imidazole glycerol phosphate synthase (IGPS) with HisH (a transglutaminase), and this enzyme connects three different biological pathways, namely nitrogen metabolism, histidine biosynthesis, and the de novo synthesis of purines [98,99]. At the L group, histidine is converted into glutamic acid under the action of iminomethylglutamic acid, and glutamic acid is converted to glutamic acid by glutamic acid dehydrogenase (GDH), or alanine or aspartic acid transaminases (TAs) convert TCA cycle intermediate α-ketoglutarate (α-KG). After α-KG enters the tricarboxylic acid cycle, it is converted into oxaloacetate, which is converted into phosphoenolpyruvate by phosphoenolpyruvate carboxylase and enters the gluconeogenesis pathway to generate glucose, thus providing the medium with a carbon source. Coxiella burnetiid IC can use glutamate as its sole carbon source and metabolize glutamate to produce ketoglutarate and enter the TCA cycle and gluconeogenesis pathway [100]. In addition, the L group strengthens purine metabolism, and purine, as the most abundant metabolic substrate in all organisms, provides essential components for synthesizing DNA and RNA. In addition to being the building blocks of DNA and RNA, purines provide crucial energy and cofactors for cell survival and proliferation. Under the environment of the M group, the glutamine produced by the nitrogen metabolism of B.subtilis BS-G1 can enter the histidine synthesis pathway through HisF. The imidazole group of histidine forms a coordination compound with metal ions (Ca2+, Mg2+, and K+), which is beneficial for the strain to maintain cell homeostasis, membrane transport, and the regulation of osmotic pressure. Therefore, the synthesis and metabolism of histidine play a crucial regulatory role in adapting B.subtilis BS-G1 to different concentrations.
This study identified seven critical mRNAs that were adapted to the L group, among which mtlA (gene0435) and celB (gene3876, gene3860) are used for the specific transport of mannitol and cellobiose, respectively [101,102]. Studies have shown that, when the mannitol-specific PTS transporter (mtlA) was overexpressed, the strain enhanced the uptake rate of PTS sugars, including N-acetylglucosamine, methyl α-glucoside, and 2-deoxyglucose [103]. The researchers propose that the overexpression of PTS transporter genes specifically enhances the uptake rate of PTS substrates, which may be caused by stimulatory protein–protein interactions between MtlA and target PTS transporters, but the specific mechanism is unclear [103]. In the L group, the strain can transport ammonium ions in the culture medium into the cell, through the glutamine ABC transporter (gene2655 and gene2653), across the membrane [104]. Previous research has demonstrated that the utilization of ABC transporter proteins, which are connected to the transportation of heavy metal ions, can serve as biomarkers for the identification of heavy metal pollution in soil through the examination of their expression [58]. Glucose serves as a primary carbon source for microorganisms, and prior empirical findings have demonstrated that the expression of seven crucial mRNAs related to carbohydrate transport is notably elevated under conditions of low glucose levels. Notably, the genes mtlA (gene0435) and celB (gene3876, gene3860) are prevalent across various strains, including Vibrio cholerae, Escherichia coli, Lactococcus lactis, Clavibacter michiganensis, and Listeria monocytogenes [105,106,107,108]. The subsequent research direction of our team involves utilizing mtlA (gene0435) and celB (gene3876 and gene3860) as bio-alert indicators to assess the nutrient status of soil based on their expression.

5. Conclusions

Bacterial adaptation to changing environments is often accompanied by transcriptome remodeling. This study presents evidence of distinct mRNAs’ and sRNAs’ expression patterns between the LvsH and MvsH. Notably, both groups exhibit a significant upregulation of transport proteins, suggesting that B. subtilis BS-G1 can adapt to varying glucose concentrations by enhancing its substance transport activity. Furthermore, our investigation identifies seven crucial mRNA and three sRNA molecules that are associated with L-group adaptation. These key mRNA molecules are further classified into three categories: amino acid ABC transporters, PTS component proteins, and glutaminase ABC transporters. This finding has shown that B. subtilis BS-G1 exhibits a response to low sugar stress through the upregulation of glucose and amino acid transport, as well as the increased production of glutaminase within the bacterial culture medium. This study developed a model to investigate the adaptation of B.subtilis BS-G1 to varying sugar concentrations, focusing on the elucidation of the adaptation process in environments with reduced glucose levels. B. subtilis BS-G1 promoted a high expression of PTS transporters (mtlA and celB) through sRNA targeting in the L group, thereby increasing the rate of glucose uptake by B. subtilis BS-G1. In addition, after the histidine produced in the strain is transformed into glutamic acid, the final metabolite α-ketoglutarate produced through further metabolism enters the TCA cycle and the gluconeogenesis pathway successively, providing carbon for the growth of the strain.
The objective of this research was to investigate the impact of varying glucose concentrations on B. subtilis BS-G1. Transcriptomics analysis was employed to ascertain the alterations in mRNAs and sRNAs induced by different glucose concentrations, thereby establishing a basis for future investigations. However, this study lacked a verification experiment for seven key mRNAs, and further experimental verification will be conducted by inhibiting the expression of critical genes (mRNAs and sRNAs). This study offers a theoretical foundation for a comprehensive investigation into the mechanism of oligotrophic microbial adaptation in low-sugar environments. Additionally, it identifies potential avenues for future research aimed at further understanding the mechanisms of oligotrophic microbial adaptation in nutrient-depleted soil environments.

Supplementary Materials

The following supporting information can be downloaded at: https://www.mdpi.com/article/10.3390/microorganisms11102401/s1, Table S1: Statistical table of raw data of B. subtilis BS-G1 transcriptome induced by different glucose concentrations; Table S2: Gene annotation information of B. subtilis BS-G1 under different glucose concentrations; Table S3: Annotation information of the top 20 genes expressed in B. subtilis BS-G1 in L group; Table S4: Annotation information of the top 20 genes expressed in B. subtilis BS-G1 at M group; Table S5: Annotation information of the top 20 genes expressed in B. subtilis BS-G1 at H group; Table S6: GO enrichment analysis results of DEGs (LvsH); Table S7: GO enrichment analysis results of DEGs (MvsH); Table S8: GO enrichment of LvsH differentially expressed sRNAs target genes (top twenty); Table S9: MvsH differentially expressed sRNAs target genes GO enrichment (top twenty); Table S10: DEGs statistics of LvsH-encoded metal ion and vitamin transporters; Table S11: DEGs statistics of MvsH-encoded metal ion and vitamin transporters; Table S12: COG annotations of LvsH significantly differentially expressed sRNAs target genes; Table S13: COG annotations of significantly differentially expressed sRNAs target genes by MvsH; Table S14: Genes and primers for validation of DEGs expression using qRT-PCR; Table S15: LvsH differentially expressed gene list; Table S16: MvsH differentially expressed gene list; Figure S1: The statistic of DEGs number; Figure S2: Fold change distribution of DEGs present in samples with different treatments; Figure S3: The relative mRNA expression of genes determined by qRT-PCR. (p-value < 0.05 (*), p-value < 0.01 (**), p-value < 0.001 (***), and p-value < 0.0001 (****) were con-sidered statistically significant, and p-value > 0.05 was non-significant (ns).)

Author Contributions

J.S.: conceptualization, funding acquisition, supervision, writing review and editing. L.C.: sample collection and processing, writing original draft, visualization, writing—review and editing. C.W.: investigation, validation. All authors have read and agreed to the published version of the manuscript.

Funding

This research was funded by the Ningxia Natural Science Foundation (Ning Xia Key R&D Project), grant number 2017BY081. The funder is the Science and Technology Department of Ningxia.

Data Availability Statement

The RNA-Seq data are available at the NCBI Sequence Read Archive (SRA) under BioProject PRJNA 1011444 (SRA accession number SRR25890184, SRR25890183, SRR25890177, SRR25890170, SRR25890182, SRR25890181, SRR25890180, SRR25890179, SRR25890178. Sample accession numbers, SAMN37221208, SAMN37221209, SAMN37221210, SAMN37221217, SAMN37221218, SAMN37221219, SAMN37221220, SAMN37221221, SAMN37221222).

Acknowledgments

We thank all members of the Su laboratory for their helpful suggestions.

Conflicts of Interest

The authors declare no conflict of interest.

References

  1. Props, R.; Monsieurs, P.; Vandamme, P.; Leys, N.; Denef, V.J.; Boon, N. Gene Expansion and Positive Selection as Bacterial Adaptations to Oligotrophic Conditions. mSphere 2019, 4, e00011-19. [Google Scholar] [CrossRef] [PubMed]
  2. Chiriac, M.C.; Haber, M.; Salcher, M.M. Adaptive Genetic Traits in Pelagic Freshwater Microbes. Environ. Microbiol. 2023, 25, 606–641. [Google Scholar] [CrossRef] [PubMed]
  3. Chen, Y.; Neilson, J.W.; Kushwaha, P.; Maier, R.M.; Barberán, A. Life-History Strategies of Soil Microbial Communities in an Arid Ecosystem. ISME J. 2021, 15, 649–657. [Google Scholar] [CrossRef]
  4. Cao, J.; Jiao, Y.; Che, R.; Holden, N.M.; Zhang, X.; Biswas, A.; Feng, Q. The Effects of Grazer Exclosure Duration on Soil Microbial Communities on the Qinghai-Tibetan Plateau. Sci. Total Environ. 2022, 839, 156238. [Google Scholar] [CrossRef]
  5. Dong, C.; Wei, L.; Wang, J.; Lai, Q.; Huang, Z.; Shao, Z. Genome-Based Taxonomic Rearrangement of Oceanobacter-Related Bacteria Including the Description of Thalassolituus Hydrocarbonoclasticus Sp. Nov. and Thalassolituus Pacificus Sp. Nov. and Emended Description of the Genus Thalassolituus. Front. Microbiol. 2022, 13, 1051202. [Google Scholar] [CrossRef] [PubMed]
  6. Ishida, Y.; Kadota, H. Growth Patterns and Substrate Requirements of Naturally Occurring Obligate Oligotrophs. Microb. Ecol. 1981, 7, 123–130. [Google Scholar] [CrossRef]
  7. de Araújo, H.L.; Martins, B.P.; Vicente, A.M.; Lorenzetti, A.P.R.; Koide, T.; Marques, M.V. Cold Regulation of Genes Encoding Ion Transport Systems in the Oligotrophic Bacterium Caulobacter Crescentus. Microbiol. Spectr. 2021, 9, e0071021. [Google Scholar] [CrossRef]
  8. Ishida, Y.; Imai, I.; Miyagaki, T.; Kadota, H. Growth and Uptake Kinetics of a Facultatively Oligotrophic Bacterium at Low Nutrient Concentrations. Microb. Ecol. 1982, 8, 23–32. [Google Scholar] [CrossRef]
  9. Ogura, M.; Sato, T.; Abe, K. Bacillus Subtilis YlxR, Which Is Involved in Glucose-Responsive Metabolic Changes, Regulates Expression of tsaD for Protein Quality Control of Pyruvate Dehydrogenase. Front. Microbiol. 2019, 10, 923. [Google Scholar] [CrossRef]
  10. Park, Y.S.; Kai, K.; Iijima, S.; Kobayashi, T. Enhanced Beta-Galactosidase Production by High Cell-Density Culture of Recombinant Bacillus Subtilis with Glucose Concentration Control. Biotechnol. Bioeng. 1992, 40, 686. [Google Scholar] [CrossRef]
  11. Dedysh, S.N. Cultivating Uncultured Bacteria from Northern Wetlands: Knowledge Gained and Remaining Gaps. Front. Microbiol. 2011, 2, 184. [Google Scholar] [CrossRef] [PubMed]
  12. Staley, J.T. Budding Bacteria of the Pasteuria-Blastobacter Group. Can. J. Microbiol. 1973, 19, 609–614. [Google Scholar] [CrossRef] [PubMed]
  13. Strous, M.; Pelletier, E.; Mangenot, S.; Rattei, T.; Lehner, A.; Taylor, M.W.; Horn, M.; Daims, H.; Bartol-Mavel, D.; Wincker, P.; et al. Deciphering the Evolution and Metabolism of an Anammox Bacterium from a Community Genome. Nature 2006, 440, 790–794. [Google Scholar] [CrossRef]
  14. Kaboré, O.D.; Godreuil, S.; Drancourt, M. Planctomycetes as Host-Associated Bacteria: A Perspective That Holds Promise for Their Future Isolations, by Mimicking Their Native Environmental Niches in Clinical Microbiology Laboratories. Front. Cell Infect. Microbiol. 2020, 10, 519301. [Google Scholar] [CrossRef]
  15. Zhuang, H.; Wu, Z.; Xu, L.; Leu, S.-Y.; Lee, P.-H. Energy-Efficient Single-Stage Nitrite Shunt Denitrification with Saline Sewage through Concise Dissolved Oxygen (DO) Supply: Process Performance and Microbial Communities. Microorganisms 2020, 8, 919. [Google Scholar] [CrossRef] [PubMed]
  16. Koza, N.A.; Adedayo, A.A.; Babalola, O.O.; Kappo, A.P. Microorganisms in Plant Growth and Development: Roles in Abiotic Stress Tolerance and Secondary Metabolites Secretion. Microorganisms 2022, 10, 1528. [Google Scholar] [CrossRef]
  17. Carreón-Rodríguez, O.E.; Gosset, G.; Escalante, A.; Bolívar, F. Glucose Transport in Escherichia Coli: From Basics to Transport Engineering. Microorganisms 2023, 11, 1588. [Google Scholar] [CrossRef]
  18. Wen, J.; Zhao, X.; Si, F.; Qi, G. Surfactin, a Quorum Sensing Signal Molecule, Globally Affects the Carbon Metabolism in Bacillus Amyloliquefaciens. Metab. Eng. Commun. 2021, 12, e00174. [Google Scholar] [CrossRef]
  19. Chamoli, S.; Kumar, P.; Navani, N.K.; Verma, A.K. Secretory Expression, Characterization and Docking Study of Glucose-Tolerant β-Glucosidase from B. Subtilis. Int. J. Biol. Macromol. 2016, 85, 425–433. [Google Scholar] [CrossRef]
  20. Pan, S.; Chen, G.; Wu, R.; Cao, X.; Liang, Z. Non-Sterile Submerged Fermentation of Fibrinolytic Enzyme by Marine Bacillus Subtilis Harboring Antibacterial Activity with Starvation Strategy. Front. Microbiol. 2019, 10, 1025. [Google Scholar] [CrossRef]
  21. Norris, N.; Levine, N.M.; Fernandez, V.I.; Stocker, R. Mechanistic Model of Nutrient Uptake Explains Dichotomy between Marine Oligotrophic and Copiotrophic Bacteria. PLoS Comput. Biol. 2021, 17, e1009023. [Google Scholar] [CrossRef] [PubMed]
  22. Wang, Y.; Hammes, F.; Boon, N.; Egli, T. Quantification of the Filterability of Freshwater Bacteria through 0.45, 0.22, and 0.1 Microm Pore Size Filters and Shape-Dependent Enrichment of Filterable Bacterial Communities. Environ. Sci. Technol. 2007, 41, 7080–7086. [Google Scholar] [CrossRef] [PubMed]
  23. Sánchez-Cañizares, C.; Prell, J.; Pini, F.; Rutten, P.; Kraxner, K.; Wynands, B.; Karunakaran, R.; Poole, P.S. Global Control of Bacterial Nitrogen and Carbon Metabolism by a PTSNtr-Regulated Switch. Proc. Natl. Acad. Sci. USA 2020, 117, 10234–10245. [Google Scholar] [CrossRef] [PubMed]
  24. Jeckelmann, J.M.; Erni, B. Carbohydrate Transport by Group Translocation: The Bacterial Phosphoenolpyruvate: Sugar Phosphotransferase System. Subcell. Biochem. 2019, 92, 223–274. [Google Scholar] [CrossRef]
  25. Fragoso-Jiménez, J.C.; Baert, J.; Nguyen, T.M.; Liu, W.; Sassi, H.; Goormaghtigh, F.; Van Melderen, L.; Gaytán, P.; Hernández-Chávez, G.; Martinez, A.; et al. Growth-Dependent Recombinant Product Formation Kinetics Can Be Reproduced through Engineering of Glucose Transport and Is Prone to Phenotypic Heterogeneity. Microb. Cell Fact. 2019, 18, 26. [Google Scholar] [CrossRef]
  26. Morabbi Heravi, K.; Altenbuchner, J. Cross Talk among Transporters of the Phosphoenolpyruvate-Dependent Phosphotransferase System in Bacillus Subtilis. J. Bacteriol. 2018, 200, e00213-18. [Google Scholar] [CrossRef]
  27. Storz, G.; Vogel, J.; Wassarman, K.M. Regulation by Small RNAs in Bacteria: Expanding Frontiers. Mol. Cell 2011, 43, 880–891. [Google Scholar] [CrossRef]
  28. Wagner, E.G.H.; Romby, P. Small RNAs in Bacteria and Archaea: Who They Are, What They Do, and How They Do It. Adv. Genet. 2015, 90, 133–208. [Google Scholar] [CrossRef]
  29. Papenfort, K.; Melamed, S. Small RNAs, Large Networks: Posttranscriptional Regulons in Gram-Negative Bacteria. Annu. Rev. Microbiol. 2023, 77, 36944261. [Google Scholar] [CrossRef]
  30. Taneja, S.; Dutta, T. On a Stake-out: Mycobacterial Small RNA Identification and Regulation. Noncoding RNA Res. 2019, 4, 86–95. [Google Scholar] [CrossRef]
  31. Charbonnier, M.; González-Espinoza, G.; Kehl-Fie, T.E.; Lalaouna, D. Battle for Metals: Regulatory RNAs at the Front Line. Front. Cell Infect. Microbiol. 2022, 12, 952948. [Google Scholar] [CrossRef] [PubMed]
  32. Parise, M.T.D.; Parise, D.; Aburjaile, F.F.; Pinto Gomide, A.C.; Kato, R.B.; Raden, M.; Backofen, R.; de Carvalho Azevedo, V.A.; Baumbach, J. An Integrated Database of Small RNAs and Their Interplay with Transcriptional Gene Regulatory Networks in Corynebacteria. Front. Microbiol. 2021, 12, 656435. [Google Scholar] [CrossRef] [PubMed]
  33. Gottesman, S.; Storz, G. Bacterial Small RNA Regulators: Versatile Roles and Rapidly Evolving Variations. Cold Spring Harb. Perspect. Biol. 2011, 3, a003798. [Google Scholar] [CrossRef]
  34. Fröhlich, K.S.; Papenfort, K. Regulation Outside the Box: New Mechanisms for Small RNAs. Mol. Microbiol. 2020, 114, 363–366. [Google Scholar] [CrossRef] [PubMed]
  35. Romilly, C.; Deindl, S.; Wagner, E.G.H. The Ribosomal Protein S1-Dependent Standby Site in tisB mRNA Consists of a Single-Stranded Region and a 5′ Structure Element. Proc. Natl. Acad. Sci. USA 2019, 116, 15901–15906. [Google Scholar] [CrossRef] [PubMed]
  36. Melson, E.M.; Kendall, M.M. The sRNA DicF Integrates Oxygen Sensing to Enhance Enterohemorrhagic Escherichia Coli Virulence via Distinctive RNA Control Mechanisms. Proc. Natl. Acad. Sci. USA 2019, 116, 14210–14215. [Google Scholar] [CrossRef]
  37. Balasubramanian, D.; Vanderpool, C.K. New Developments in Post-Transcriptional Regulation of Operons by Small RNAs. RNA Biol. 2013, 10, 337–341. [Google Scholar] [CrossRef]
  38. Sheehan, L.M.; Budnick, J.A.; Fyffe-Blair, J.; King, K.A.; Settlage, R.E.; Caswell, C.C. The Endoribonuclease RNase E Coordinates Expression of mRNAs and Small Regulatory RNAs and Is Critical for the Virulence of Brucella Abortus. J. Bacteriol. 2020, 202, e00240-20. [Google Scholar] [CrossRef]
  39. Quendera, A.P.; Seixas, A.F.; dos Santos, R.F.; Santos, I.; Silva, J.P.N.; Arraiano, C.M.; Andrade, J.M. RNA-Binding Proteins Driving the Regulatory Activity of Small Non-Coding RNAs in Bacteria. Front. Mol. Biosci. 2020, 7, 78. [Google Scholar] [CrossRef]
  40. McQuail, J.; Carpousis, A.J.; Wigneshweraraj, S. The Association between Hfq and RNase E in Long-Term Nitrogen-Starved Escherichia coli. Mol. Microbiol. 2022, 117, 54–66. [Google Scholar] [CrossRef]
  41. De Lay, N.; Schu, D.J.; Gottesman, S. Bacterial Small RNA-Based Negative Regulation: Hfq and Its Accomplices. J. Biol. Chem. 2013, 288, 7996–8003. [Google Scholar] [CrossRef] [PubMed]
  42. Murina, V.N.; Nikulin, A.D. Bacterial Small Regulatory RNAs and Hfq Protein. Biochemistry 2015, 80, 1647–1654. [Google Scholar] [CrossRef] [PubMed]
  43. Lewis, B.P.; Burge, C.B.; Bartel, D.P. Conserved Seed Pairing, Often Flanked by Adenosines, Indicates That Thousands of Human Genes Are microRNA Targets. Cell 2005, 120, 15–20. [Google Scholar] [CrossRef] [PubMed]
  44. Melamed, S.; Peer, A.; Faigenbaum-Romm, R.; Gatt, Y.E.; Reiss, N.; Bar, A.; Altuvia, Y.; Argaman, L.; Margalit, H. Global Mapping of Small RNA-Target Interactions in Bacteria. Mol. Cell 2016, 63, 884–897. [Google Scholar] [CrossRef] [PubMed]
  45. Bobrovskyy, M.; Vanderpool, C.K. Regulation of Bacterial Metabolism by Small RNAs Using Diverse Mechanisms. Annu. Rev. Genet. 2013, 47, 209–232. [Google Scholar] [CrossRef]
  46. Roth-Rosenberg, D.; Aharonovich, D.; Luzzatto-Knaan, T.; Vogts, A.; Zoccarato, L.; Eigemann, F.; Nago, N.; Grossart, H.P.; Voss, M.; Sher, D. Prochlorococcus Cells Rely on Microbial Interactions Rather than on Chlorotic Resting Stages to Survive Long-Term Nutrient Starvation. mBio 2020, 11, e01846-20. [Google Scholar] [CrossRef]
  47. Szul, M.J.; Dearth, S.P.; Campagna, S.R.; Zinser, E.R. Carbon Fate and Flux in Prochlorococcus under Nitrogen Limitation. mSystems 2019, 4, e00254-18. [Google Scholar] [CrossRef]
  48. Santander, R.D.; Oliver, J.D.; Biosca, E.G. Cellular, Physiological, and Molecular Adaptive Responses of Erwinia Amylovora to Starvation. FEMS Microbiol. Ecol. 2014, 88, 258–271. [Google Scholar] [CrossRef]
  49. Read, R.W.; Berube, P.M.; Biller, S.J.; Neveux, I.; Cubillos-Ruiz, A.; Chisholm, S.W.; Grzymski, J.J. Nitrogen Cost Minimization Is Promoted by Structural Changes in the Transcriptome of N-Deprived Prochlorococcus Cells. ISME J. 2017, 11, 2267–2278. [Google Scholar] [CrossRef]
  50. Hasanuzzaman, M.; Raihan, M.R.H.; Nowroz, F.; Fujita, M. Insight into the Mechanism of Salt-Induced Oxidative Stress Tolerance in Soybean by the Application of Bacillus Subtilis: Coordinated Actions of Osmoregulation, Ion Homeostasis, Antioxidant Defense, and Methylglyoxal Detoxification. Antioxidants 2022, 11, 1856. [Google Scholar] [CrossRef]
  51. Tibocha-Bonilla, J.D.; Zuñiga, C.; Lekbua, A.; Lloyd, C.; Rychel, K.; Short, K.; Zengler, K. Predicting Stress Response and Improved Protein Overproduction in Bacillus Subtilis. NPJ Syst. Biol. Appl. 2022, 8, 50. [Google Scholar] [CrossRef] [PubMed]
  52. Chen, X.; Shang, C.; Zhang, H.; Sun, C.; Zhang, G.; Liu, L.; Li, C.; Li, A.; Du, P. Effects of Alkali Stress on the Growth and Menaquinone-7 Metabolism of Bacillus Subtilis Natto. Front. Microbiol. 2022, 13, 899802. [Google Scholar] [CrossRef] [PubMed]
  53. Gray, D.A.; Dugar, G.; Gamba, P.; Strahl, H.; Jonker, M.J.; Hamoen, L.W. Extreme Slow Growth as Alternative Strategy to Survive Deep Starvation in Bacteria. Nat. Commun. 2019, 10, 890. [Google Scholar] [CrossRef]
  54. Ford, B.A.; Sullivan, G.J.; Moore, L.; Varkey, D.; Zhu, H.; Ostrowski, M.; Mabbutt, B.C.; Paulsen, I.T.; Shah, B.S. Functional Characterisation of Substrate-Binding Proteins to Address Nutrient Uptake in Marine Picocyanobacteria. Biochem. Soc. Trans. 2021, 49, 2465–2481. [Google Scholar] [CrossRef] [PubMed]
  55. Lauro, F.M.; McDougald, D.; Thomas, T.; Williams, T.J.; Egan, S.; Rice, S.; DeMaere, M.Z.; Ting, L.; Ertan, H.; Johnson, J.; et al. The Genomic Basis of Trophic Strategy in Marine Bacteria. Proc. Natl. Acad. Sci. USA 2009, 106, 15527–15533. [Google Scholar] [CrossRef]
  56. Schwalbach, M.S.; Tripp, H.J.; Steindler, L.; Smith, D.P.; Giovannoni, S.J. The Presence of the Glycolysis Operon in SAR11 Genomes Is Positively Correlated with Ocean Productivity. Environ. Microbiol. 2010, 12, 490–500. [Google Scholar] [CrossRef]
  57. Tam, R.; Saier, M.H. Structural, Functional, and Evolutionary Relationships among Extracellular Solute-Binding Receptors of Bacteria. Microbiol. Rev. 1993, 57, 320–346. [Google Scholar] [CrossRef]
  58. Jaskulak, M.; Grobelak, A.; Vandenbulcke, F. Effects of Sewage Sludge Supplementation on Heavy Metal Accumulation and the Expression of ABC Transporters in Sinapis alba L. during Assisted Phytoremediation of Contaminated Sites. Ecotoxicol. Environ. Saf. 2020, 197, 110606. [Google Scholar] [CrossRef]
  59. Giovannoni, S.J.; Tripp, H.J.; Givan, S.; Podar, M.; Vergin, K.L.; Baptista, D.; Bibbs, L.; Eads, J.; Richardson, T.H.; Noordewier, M.; et al. Genome Streamlining in a Cosmopolitan Oceanic Bacterium. Science 2005, 309, 1242–1245. [Google Scholar] [CrossRef]
  60. Williams, T.J.; Ertan, H.; Ting, L.; Cavicchioli, R. Carbon and Nitrogen Substrate Utilization in the Marine Bacterium Sphingopyxis Alaskensis Strain RB2256. ISME J. 2009, 3, 1036–1052. [Google Scholar] [CrossRef]
  61. Orsi, W.D.; Smith, J.M.; Liu, S.; Liu, Z.; Sakamoto, C.M.; Wilken, S.; Poirier, C.; Richards, T.A.; Keeling, P.J.; Worden, A.Z.; et al. Diverse, Uncultivated Bacteria and Archaea Underlying the Cycling of Dissolved Protein in the Ocean. ISME J. 2016, 10, 2158–2173. [Google Scholar] [CrossRef] [PubMed]
  62. Lofton, M.E.; Brentrup, J.A.; Beck, W.S.; Zwart, J.A.; Bhattacharya, R.; Brighenti, L.S.; Burnet, S.H.; McCullough, I.M.; Steele, B.G.; Carey, C.C.; et al. Using Near-Term Forecasts and Uncertainty Partitioning to Inform Prediction of Oligotrophic Lake Cyanobacterial Density. Ecol. Appl. 2022, 32, e2590. [Google Scholar] [CrossRef] [PubMed]
  63. Chen, K.; Allen, J.; Lu, J. Community Structures of Phytoplankton with Emphasis on Toxic Cyanobacteria in an Ohio Inland Lake during Bloom Season. J. Water Resour. Prot. 2017, 9, 11. [Google Scholar] [CrossRef] [PubMed]
  64. Rinta-Kanto, J.M.; Konopko, E.A.; Debruyn, J.M.; Bourbonniere, R.A.; Boyer, G.L.; Wilhelm, S.W. Lake Erie Microcystis: Relationship between Microcystin Production, Dynamics of Genotypes and Environmental Parameters in a Large Lake. Harmful Algae 2009, 8, 665–673. [Google Scholar] [CrossRef]
  65. Guo, S.; Wang, Y.; Huang, J.; Dong, J.; Zhang, J. Decoupling and Decomposition Analysis of Land Natural Capital Utilization and Economic Growth: A Case Study in Ningxia Hui Autonomous Region, China. Int. J. Environ. Res. Public Health 2021, 18, 646. [Google Scholar] [CrossRef]
  66. Peng, L.; Zhao, K.; Chen, S.; Ren, Z.; Wei, H.; Wan, C. Whole Genome and Acid Stress Comparative Transcriptome Analysis of Lactiplantibacillus Plantarum ZDY2013. Arch. Microbiol. 2021, 203, 2795–2807. [Google Scholar] [CrossRef]
  67. Zhang, L.; Song, D.; Wu, Z. Transcriptome Analysis of Cyclocarya Paliurus Flavonoids Regulation of Differently Expressed Genes in Enterococcus Faecalis under Low pH Stress. Arch. Microbiol. 2021, 203, 2147–2155. [Google Scholar] [CrossRef]
  68. Petrov, K.; Arsov, A.; Petrova, P. Butanol Tolerance of Lactiplantibacillus Plantarum: A Transcriptome Study. Genes 2021, 12, 181. [Google Scholar] [CrossRef]
  69. Cheng, C.; Han, X.; Xu, J.; Sun, J.; Li, K.; Han, Y.; Chen, M.; Song, H. YjbH Mediates the Oxidative Stress Response and Infection by Regulating SpxA1 and the Phosphoenolpyruvate-Carbohydrate Phosphotransferase System (PTS) in Listeria Monocytogenes. Gut Microbes 2021, 13, 1884517. [Google Scholar] [CrossRef]
  70. Vasylkivska, M.; Jureckova, K.; Branska, B.; Sedlar, K.; Kolek, J.; Provaznik, I.; Patakova, P. Transcriptional Analysis of Amino Acid, Metal Ion, Vitamin and Carbohydrate Uptake in Butanol-Producing Clostridium Beijerinckii NRRL B-598. PLoS ONE 2019, 14, e0224560. [Google Scholar] [CrossRef]
  71. Stautz, J.; Hellmich, Y.; Fuss, M.F.; Silberberg, J.M.; Devlin, J.R.; Stockbridge, R.B.; Hänelt, I. Molecular Mechanisms for Bacterial Potassium Homeostasis. J. Mol. Biol. 2021, 433, 166968. [Google Scholar] [CrossRef]
  72. Stülke, J.; Krüger, L. Cyclic Di-AMP Signaling in Bacteria. Annu. Rev. Microbiol. 2020, 74, 159–179. [Google Scholar] [CrossRef]
  73. Fang, H.; Qin, X.Y.; Zhang, K.D.; Nie, Y.; Wu, X.L. Role of the Group 2 Mrp Sodium/Proton Antiporter in Rapid Response to High Alkaline Shock in the Alkaline- and Salt-Tolerant Dietzia Sp. DQ12-45-1b. Appl. Microbiol. Biotechnol. 2018, 102, 3765–3777. [Google Scholar] [CrossRef] [PubMed]
  74. Dürre, P. Physiology and Sporulation in Clostridium. Microbiol. Spectr. 2014, 2, 4. [Google Scholar] [CrossRef] [PubMed]
  75. Eisenstadt, E. Potassium Content during Growth and Sporulation in Bacillus Subtilis. J. Bacteriol. 1972, 112, 264–267. [Google Scholar] [CrossRef] [PubMed]
  76. Vohradsky, J.; Schwarz, M.; Ramaniuk, O.; Ruiz-Larrabeiti, O.; Vaňková Hausnerová, V.; Šanderová, H.; Krásný, L. Kinetic Modeling and Meta-Analysis of the Bacillus Subtilis SigB Regulon during Spore Germination and Outgrowth. Microorganisms 2021, 9, 112. [Google Scholar] [CrossRef]
  77. Stetsenko, A.; Guskov, A. Cation Permeability in CorA Family of Proteins. Sci. Rep. 2020, 10, 840. [Google Scholar] [CrossRef]
  78. Payandeh, J.; Pfoh, R.; Pai, E.F. The Structure and Regulation of Magnesium Selective Ion Channels. Biochim. Biophys. Acta 2013, 1828, 2778–2792. [Google Scholar] [CrossRef]
  79. Pohland, A.C.; Schneider, D. Mg2+ Homeostasis and Transport in Cyanobacteria—At the Crossroads of Bacterial and Chloroplast Mg2+ Import. Biol. Chem. 2019, 400, 1289–1301. [Google Scholar] [CrossRef]
  80. Trachsel, E.; Redder, P.; Linder, P.; Armitano, J. Genetic Screens Reveal Novel Major and Minor Players in Magnesium Homeostasis of Staphylococcus Aureus. PLoS Genet. 2019, 15, e1008336. [Google Scholar] [CrossRef]
  81. Saha, J.; Dey, S.; Pal, A. Whole Genome Sequencing and Comparative Genomic Analyses of Pseudomonas Aeruginosa Strain Isolated from Arable Soil Reveal Novel Insights into Heavy Metal Resistance and Codon Biology. Curr. Genet. 2022, 68, 481–503. [Google Scholar] [CrossRef] [PubMed]
  82. Cheng, D.; He, Q. PfsR Is a Key Regulator of Iron Homeostasis in Synechocystis PCC 6803. PLoS ONE 2014, 9, e101743. [Google Scholar] [CrossRef] [PubMed]
  83. Cheng, Y.; Zhang, T.; Cao, Y.; Wang, L.; Chen, W. New Insights into the Function of the Proteins IsiC and IsiD from Synechocystis Sp. PCC 6803 under Iron Limitation. Appl. Microbiol. Biotechnol. 2021, 105, 4693–4707. [Google Scholar] [CrossRef] [PubMed]
  84. Seo, S.W.; Kim, D.; Latif, H.; O’Brien, E.J.; Szubin, R.; Palsson, B.O. Deciphering Fur Transcriptional Regulatory Network Highlights Its Complex Role beyond Iron Metabolism in Escherichia coli. Nat. Commun. 2014, 5, 4910. [Google Scholar] [CrossRef]
  85. Plante, S.; Labbé, S. Spore Germination Requires Ferrichrome Biosynthesis and the Siderophore Transporter Str1 in Schizosaccharomyces Pombe. Genetics 2019, 211, 893–911. [Google Scholar] [CrossRef]
  86. Pivato, M.; Ballottari, M. Chlamydomonas Reinhardtii Cellular Compartments and Their Contribution to Intracellular Calcium Signalling. J. Exp. Bot. 2021, 72, 5312–5335. [Google Scholar] [CrossRef]
  87. Cao, R.; Qin, P.; Li, W.; Shang, C.; Chai, Y.; Jin, D.; Chen, A. Hydrogen Sulfide and Calcium Effects on Cadmium Removal and Resistance in the White-Rot Fungus Phanerochaete Chrysosporium. Appl. Microbiol. Biotechnol. 2021, 105, 6451–6462. [Google Scholar] [CrossRef]
  88. Wan, Y.; Wang, M.; Chan, E.W.C.; Chen, S. Membrane Transporters of the Major Facilitator Superfamily Are Essential for Long-Term Maintenance of Phenotypic Tolerance to Multiple Antibiotics in E. coli. Microbiol. Spectr. 2021, 9, e0184621. [Google Scholar] [CrossRef]
  89. Wani, A.K.; Akhtar, N.; Sher, F.; Navarrete, A.A.; Américo-Pinheiro, J.H.P. Microbial Adaptation to Different Environmental Conditions: Molecular Perspective of Evolved Genetic and Cellular Systems. Arch. Microbiol. 2022, 204, 144. [Google Scholar] [CrossRef]
  90. Coloma-Rivero, R.F.; Flores-Concha, M.; Molina, R.E.; Soto-Shara, R.; Cartes, Á.; Oñate, Á.A. Brucella and Its Hidden Flagellar System. Microorganisms 2021, 10, 83. [Google Scholar] [CrossRef]
  91. Zhou, M.; Liu, Z.; Wang, J.; Zhao, Y.; Hu, B. Sphingomonas Relies on Chemotaxis to Degrade Polycyclic Aromatic Hydrocarbons and Maintain Dominance in Coking Sites. Microorganisms 2022, 10, 1109. [Google Scholar] [CrossRef] [PubMed]
  92. Solar Venero, E.C.; Ricardi, M.M.; Gomez-Lozano, M.; Molin, S.; Tribelli, P.M.; López, N.I. Oxidative Stress under Low Oxygen Conditions Triggers Hyperflagellation and Motility in the Antarctic Bacterium Pseudomonas Extremaustralis. Extremophiles 2019, 23, 587–597. [Google Scholar] [CrossRef] [PubMed]
  93. Sridhar, J.; Gayathri, M. Transcriptome Based Identification of Silver Stress Responsive sRNAs from Bacillus Cereus ATCC14579. Bioinformation 2019, 15, 474–479. [Google Scholar] [CrossRef] [PubMed]
  94. Amin, S.V.; Roberts, J.T.; Patterson, D.G.; Coley, A.B.; Allred, J.A.; Denner, J.M.; Johnson, J.P.; Mullen, G.E.; O’Neal, T.K.; Smith, J.T.; et al. Novel Small RNA (sRNA) Landscape of the Starvation-Stress Response Transcriptome of Salmonella Enterica Serovar Typhimurium. RNA Biol. 2016, 13, 331–342. [Google Scholar] [CrossRef] [PubMed]
  95. Landt, S.G.; Lesley, J.A.; Britos, L.; Shapiro, L. CrfA, a Small Noncoding RNA Regulator of Adaptation to Carbon Starvation in Caulobacter Crescentus. J. Bacteriol. 2010, 192, 4763–4775. [Google Scholar] [CrossRef] [PubMed]
  96. Babitzke, P.; Lai, Y.-J.; Renda, A.J.; Romeo, T. Posttranscription Initiation Control of Gene Expression Mediated by Bacterial RNA-Binding Proteins. Annu. Rev. Microbiol. 2019, 73, 43–67. [Google Scholar] [CrossRef]
  97. Chioccioli, S.; Del Duca, S.; Vassallo, A.; Castronovo, L.M.; Fani, R. Exploring the Role of the Histidine Biosynthetic hisF Gene in Cellular Metabolism and in the Evolution of (Ancestral) Genes: From LUCA to the Extant (Micro)Organisms. Microbiol. Res. 2020, 240, 126555. [Google Scholar] [CrossRef]
  98. Fani, R.; Brilli, M.; Fondi, M.; Lió, P. The Role of Gene Fusions in the Evolution of Metabolic Pathways: The Histidine Biosynthesis Case. BMC Evol. Biol. 2007, 7 (Suppl. S2), S4. [Google Scholar] [CrossRef]
  99. Martínez-Guitián, M.; Vázquez-Ucha, J.C.; Álvarez-Fraga, L.; Conde-Pérez, K.; Lasarte-Monterrubio, C.; Vallejo, J.A.; Bou, G.; Poza, M.; Beceiro, A. Involvement of HisF in the Persistence of Acinetobacter Baumannii During a Pneumonia Infection. Front. Cell Infect. Microbiol. 2019, 9, 310. [Google Scholar] [CrossRef]
  100. Kuba, M.; Neha, N.; De Souza, D.P.; Dayalan, S.; Newson, J.P.M.; Tull, D.; McConville, M.J.; Sansom, F.M.; Newton, H.J. Coxiella Burnetii Utilizes Both Glutamate and Glucose during Infection with Glucose Uptake Mediated by Multiple Transporters. Biochem. J. 2019, 476, 2851–2867. [Google Scholar] [CrossRef]
  101. Byer, T.; Wang, J.; Zhang, M.G.; Vather, N.; Blachman, A.; Visser, B.; Liu, J.M. MtlR Negatively Regulates Mannitol Utilization by Vibrio Cholerae. Microbiology 2017, 163, 1902–1911. [Google Scholar] [CrossRef] [PubMed]
  102. Zheng, Z.; Jiang, T.; Zou, L.; Ouyang, S.; Zhou, J.; Lin, X.; He, Q.; Wang, L.; Yu, B.; Xu, H.; et al. Simultaneous Consumption of Cellobiose and Xylose by Bacillus Coagulans to Circumvent Glucose Repression and Identification of Its Cellobiose-Assimilating Operons. Biotechnol. Biofuels 2018, 11, 320. [Google Scholar] [CrossRef] [PubMed]
  103. Aboulwafa, M.; Zhang, Z.; Saier, M.H. Protein-Protein Interactions in the Cytoplasmic Membrane of Escherichia coli: Influence of the Overexpression of Diverse Transporter-Encoding Genes on the Activities of PTS Sugar Uptake Systems. Microb. Physiol. 2020, 30, 36–49. [Google Scholar] [CrossRef] [PubMed]
  104. Chen, Q.; Li, F.; Zuo, X.; Chen, J.; Qin, P.; Wang, C.; Xu, J.; Yang, D.; Xing, B.; Liu, Y.; et al. Reversible Domain Closure Modulates GlnBP Ligand Binding Affinity. PLoS ONE 2022, 17, e0263102. [Google Scholar] [CrossRef]
  105. Zhang, M.G.; Liu, J.M. Transcription of Cis Antisense Small RNA MtlS in Vibrio Cholerae Is Regulated by Transcription of Its Target Gene, mtlA. J. Bacteriol. 2019, 201, e00178-19. [Google Scholar] [CrossRef]
  106. Poorinmohammad, N.; Hamedi, J.; Masoudi-Nejad, A. Genome-Scale Exploration of Transcriptional Regulation in the Nisin Z Producer Lactococcus Lactis Subsp. Lactis IO-1. Sci. Rep. 2020, 10, 3787. [Google Scholar] [CrossRef]
  107. Jang, H.; Kim, S.T.; Sang, M.K. Suppressive Effect of Bioactive Extracts of Bacillus Sp. H8-1 and Bacillus Sp. K203 on Tomato Wilt Caused by Clavibacter Michiganensis Subsp. Michiganensis. Microorganisms 2022, 10, 403. [Google Scholar] [CrossRef]
  108. Cao, T.N.; Joyet, P.; Aké, F.M.D.; Milohanic, E.; Deutscher, J. Studies of the Listeria Monocytogenes Cellobiose Transport Components and Their Impact on Virulence Gene Repression. J. Mol. Microbiol. Biotechnol. 2019, 29, 10–26. [Google Scholar] [CrossRef]
Figure 1. Growth curve. (a) Growth curves of B. subtilis BS-G1 and five control strains at 0.015 g/L glucose concentration; (b) Growth curves of B. subtilis BS-G1 at different glucose concentrations.
Microorganisms 11 02401 g001
Figure 2. Glucose uptake curve. (a) Glucose uptake curves of B. subtilis BS-G1 and five control strains at 0.015 g/L glucose concentration uptake curve; (b) B. subtilis BS-G1 at 0.015–10 g/L glucose concentration glucose uptake curve.
Microorganisms 11 02401 g002
Figure 3. COG functional classification of DEGs. (a) COG functional classification results of LvsH; (b) COG functional classification results of MvsH.
Microorganisms 11 02401 g003
Figure 4. KEGG functional classification of DEGs. (a) KEGG functional classification results of LvsH; (b) KEGG functional classification results of MvsH.
Microorganisms 11 02401 g004
Figure 5. GO enrichment analysis results of DEGs. (A) GO enrichment results of LvsH; (B) GO enrichment results of MvsH (the diagram of GO enrichment: from outside to inside, the outermost circle is the ID number of GO enrichment, the second circle is the background gene, the third circle is the number of DEGs, and the fourth circle is the enrichment factor. That is, the number of DEGs divided by the number of background genes).
Microorganisms 11 02401 g005
Figure 6. KEGG enrichment analysis results of DEGs. (a) KEGG enrichment results of LvsH; (b) KEGG enrichment results of MvsH.
Microorganisms 11 02401 g006
Figure 7. Characteristics of sRNAs. (a) Statistics of cis-acting sRNAs and trans-acting sRNAs; (b) sRNA length distribution; (c) Rfam annotation statistics of sRNAs.
Microorganisms 11 02401 g007
Figure 8. Significantly differentially expressed sRNAs.
Microorganisms 11 02401 g008
Figure 9. COG annotation classification of target genes with significant differential expression of sRNAs. (a) COG annotation classification results of LvsH; (b) COG annotation classification results of MvsH.
Microorganisms 11 02401 g009
Figure 10. KEGG enrichment of significantly differentially expressed sRNAs target genes. (a) KEGG enrichment of target genes of LvsH differentially expressed sRNA; (b) KEGG enrichment of target genes of MvsH-expressed sRNA.
Microorganisms 11 02401 g010
Figure 11. Adaptation mode of B. subtilis BS-G1 under different glucose concentrations.
Microorganisms 11 02401 g011
Figure 12. Crucial mRNAs and sRNAs interaction network diagram.
Microorganisms 11 02401 g012
Table 1. Critical genes (mRNA) adapted to L group.
Key Gene IDDescriptionGene NameLog2FC (LvsH)
gene2652amino acid ABC transporter ATPase/7.448
gene2985ABC transporter permease/10.238
gene3860ScelB9.383
gene0435PTS mannitol transporter subunit IIBmtlA7.98
gene3876oligo-beta-mannoside permease IIC proteincelB7.362
gene2653glutamine ABC transporter substrate-binding protein/7.496
gene2655glutamine ABC transporter permease/5.051
Table 2. Critical mRNAs and sRNAs adapted to L group.
sRNA_idLog2FC (LvsH)Target Gene ID
sRNA020011.71890433gene0435; gene3876
sRNA011311.533039gene3860
sRNA008411.40169888gene3876
sRNA008511.40169888gene3876
sRNA014811.40169888gene3876
sRNA020710.90597229gene0435
sRNA02059.776851885gene3876
sRNA03668.533373277gene0435
sRNA03366.681651624gene0435
sRNA03626.434679786gene0435; gene2655
sRNA01166.373911204gene0435
sRNA03606.357940855gene2653
sRNA05426.212579528gene2652
sRNA05576.026353075gene2985
sRNA01995.159987109gene2655
sRNA05045.048301125gene2985; gene0435
sRNA00154.964673587gene3876
sRNA05334.896095911gene0435
sRNA04194.801798083gene2985; gene3876
sRNA02394.618899947gene3876
sRNA02494.578804747gene0435
sRNA04953.975578933gene0435
sRNA04113.854669068gene3876
sRNA05093.764795398gene2985
sRNA02213.520639327gene0435
sRNA04143.022561069gene3876
sRNA04812.967066947gene0435; gene2985
sRNA04171.934699587gene3876
sRNA03641.373518955gene3876
sRNA00111.103524326gene3876
sRNA0157−1.52566018gene3876
sRNA0404−1.81557978gene0435
sRNA0375−2.395421117gene2985; gene0435
Disclaimer/Publisher’s Note: The statements, opinions and data contained in all publications are solely those of the individual author(s) and contributor(s) and not of MDPI and/or the editor(s). MDPI and/or the editor(s) disclaim responsibility for any injury to people or property resulting from any ideas, methods, instructions or products referred to in the content.

