Article

The Transformation of Hg2+ during Anaerobic S0 Reduction by an AMD Environmental Enrichment Culture

1
School of Minerals Processing and Bioengineering, Central South University, Changsha 410083, China
2
Key Lab of Biometallurgy of Ministry of Education of China, Central South University, Changsha 410083, China
*
Author to whom correspondence should be addressed.
These authors have contributed equally to this work.
Microorganisms 2023, 11(1), 72; https://doi.org/10.3390/microorganisms11010072
Submission received: 27 November 2022 / Revised: 18 December 2022 / Accepted: 19 December 2022 / Published: 27 December 2022

Abstract

:
Mercury (Hg) is a highly toxic and persistent heavy metal pollutant. The acid mine drainage (AMD) environment in sulfide-mining areas is a typical Hg pollution source. In this paper, the transformation of Hg2+ during anaerobic S0 reduction by an AMD environmental enrichment culture was studied by multiple spectroscopic and microscopic techniques. The experimental results showed that the microbial S0 reduction of the AMD enrichment culture was significantly inhibited in the presence of Hg2+. The results of cell surface morphology and composition analysis showed that there was obvious aggregation of flocculent particles on the cell surface in the presence of Hg2+, and the components of extracellular polymeric substances on the cell surface changed significantly. The results of surface morphology and C/S/Hg speciation transformation analyses of the solid particulate showed that Hg2+ gradually transformed to mercuric sulfide and Hg0 under anaerobic S0 reduction by the AMD enrichment culture. The microbial community structure results showed that Hg2+ significantly changed the enrichment community structure by decreasing their evenness. The dominant microorganisms with S0 reduction functions are closely related to mercury transformation and are the key driving force for the transformation of substrate solid particulate and cellular substances, as well as the fixation of Hg2+.

1. Introduction

Heavy metal pollution has become among the most serious environmental problems in acid mine drainage (AMD) along with the mining of metal sulfide ores, causing potential threats to human health [1]. Among the numerous heavy metal elements existing in AMD, mercury (Hg) is among the most toxic heavy metal pollutants, with global distribution and persistent pollution. Hg can occur in various states and species in the environment, including the oxidation states of Hg(0) (elemental mercury), Hg(I) (mercurous), and Hg(II) (mercuric) [2], and the organic forms of methyl mercury (MeHg) and ethyl mercury (EtHg), which determine the toxicity and environmental impact of Hg [3]. The transformation of Hg species in a polluted environment has become a research hotspot in recent decades [4,5,6].
Microorganisms play an important role in the transformation of Hg species, mainly including the oxidation, reduction, methylation, and demethylation of Hg [7,8]. Under anaerobic conditions, microorganisms can tolerate organic and inorganic mercury in the environment by reducing and methylating Hg2+ and demethylating MeHg [9,10]. Microbial resistance to MeHg transported into cells relies on proton-assisted cleavage of the Hg-C bond of MeHg by organomercury lyase (MerB) and the reduction of mercuric Hg2+ into nontoxic Hg0 by mercuric reductase (MerA) in the mer operon, and inorganic mercury and organic mercury finally diffuse to the outside of cells in the form of Hg0 and are released into the atmosphere [11,12,13]. For example, Acidithiobacillus ferrooxidans, which is abundant in the AMD environment, can convert toxic Hg2+ into relatively inert Hg0 by MerA, which is necessary for this bacterium to survive in the Hg-polluted AMD environment [14].
AMD is a typical extreme acidic environment rich in Hg2+, in which the microbial community structure is different from that of other environments. Niane et al. studied mercury-resistant bacteria in contaminated aquatic sediments in the Kedougou region, Senegal, and found that the microbial community structure characteristics of the AMD environment tend to be tolerant to high Hg concentrations compared with other freshwater areas [15]. Of note, microorganisms in the AMD environment are closely related to the iron-sulfur cycle. Among them, microbially mediated sulfur reduction is of great significance in the remediation of heavy metal pollution. For example, sulfur-reducing bacteria are widely used in the treatment of heavy metals in landfill sites, which is primarily due to their ability to effectively immobilize Hg2+ and affect the bioavailability of Hg2+ by forming HgS [16,17]. The main sulfur species entering the AMD environment in sulfide-mining areas are sulfate and S0, formed by the chemical and/or microbial oxidation of pyrite. These sulfur species are easily reduced and oxidized under the action of sulfur-reducing and sulfur-oxidizing microorganisms. Microbial sulfur reduction usually occurs under anaerobic conditions with sulfate or S0 as the electron acceptor and generates low-valence sulfur such as S2−, which can further react with heavy metal ions to form metal sulfide precipitates, thus reducing the toxicity of heavy metal ions and inhibiting their mobility [18,19]. Compared with microbially mediated sulfate reduction, there are relatively few studies on microbially mediated S0 reduction for AMD treatment [20,21], and the effects of Hg2+ on S0 reduction mediated by acidophiles and the relevant mechanisms are worthy of study.
Therefore, this work focused on mercury transformation during anaerobic S0 reduction by an AMD environmental enrichment culture. On the basis of the effect of Hg2+ on the anaerobic S0 reduction of the AMD environment enrichment culture, the microbial diversity of the enrichment culture in the process was analyzed. The mechanisms of microbially mediated anaerobic S0 reduction related to mercury transformation were further studied by multiple spectroscopy and microanalysis techniques. The relevant results not only provide a reference for screening mercury-tolerant microorganisms but also provide basic information for mercury pollution control and remediation in heavy metal-polluted areas.

2. Materials and Methods

2.1. Preparation of the AMD Enrichment

The sediment sample was collected from the Dabaoshan mine site in Guangdong Province, China, and an approximately 120 g sediment sample was added to a homemade bioreactor (Figure S1) containing 12 L 9K basal medium with 1 g/L S0 for incubation at ambient temperature. The 9K basic medium consisted of (NH4)2SO4 3.0 g/L, KCL 0.1 g/L, K2HPO4 0.5 g/L, MgSO4·7H2O 0.5 g/L, Ca(NO3)2 0.01 g/L, and CH3COONa 20 mM, and the initial pH was adjusted to 2.8 with 2 M H2SO4 solution. After 60 days of incubation, the bacteria at the bottom of the bioreactor were collected through the sampling port and enriched in an anaerobic incubator (LAI-3T-N1) at 30 °C, with solely the addition of S0 as the energy substrate. After 3–4 generations of cultivation, an AMD enrichment culture with high S0 reduction activity was obtained by monitoring the dissolved S2− concentrations during cultivation.

2.2. Experimental Setup

The AMD environmental enrichment culture was cultured in 250 mL conical flasks containing 100 mL sterile 9K basic medium with an initial pH of 2.8 and an initial cell density of 8 × 10⁷ cells/mL. The concentration of Hg2+ used in the present study was 2 mg/L, which was obtained by a pre-experiment investigating the effect of different concentrations of Hg2+-[Hg(NO3)2] on microbial aerobic growth (Figure S2). The experimental groups were statically cultured in an anaerobic incubator at 30 °C without Hg2+ and with 2 mg/L Hg2+, and each experimental group was tested in triplicate. During the experiment, the solution samples, solid particulate and cells were collected at different times for further analysis. Sampling operations were carried out in the anaerobic incubator, where the solution samples were obtained at 1–2 day intervals in the initial stage and 3–5 days in the later stage of exponential growth. The solid particulate was collected and frozen immediately in an ultralow temperature freezer (−80 °C) and then dried under vacuum conditions to analyze their morphology and composition. The cells were collected by the differential velocity centrifugation method, and then the microbial morphology and surface composition were analyzed. Each experiment was performed in triplicate, and the mean value ± standard deviation of the data determined was presented for the following analyses.

2.3. Analytical Methods

2.3.1. Physical and Chemical Characterization of the Culture Liquor

The cell density was directly counted by light microscopy (Nexcopy NE900, Yongxin, Ningbo, China) with a blood corpuscle counter (XB-K-25, Qiujing, Shanghai, China). The concentration of dissolved ΣS2− ([S2−]aq) was determined spectrophotometrically by the methylene blue method, and the concentration of dissolved Hg2+ ([Hg2+]aq) was measured by an inductively coupled plasma emission spectrometer.

2.3.2. Surface Morphology and Chemical Composition of Solid Particulate and Microbial Cells

The solid particulate and cell samples were obtained in the experiment and freeze-dried. The surface morphology and element distribution of the solid particulate and the cells in different periods were characterized by the scanning electron microscopy (SEM) and X-ray energy dispersive spectroscopy (EDS) (MIRA 3 LMU, Tescan, Brno, Crech Republic). Briefly, the samples were prefixed with 2.5% formaldehyde for 4 h, dehydrated with graded ethanol, and introduced into the SEM chamber for observation. The internal structure and element distribution of the single cell was characterized by transmission electron microscopy (TEM)-EDS (Talos F200X, Thermo Fisher, Sunnyvale, CA, USA). Before the TEM observation, the microbial cells were prefixed with 2.5% formaldehyde for 4 h, immersed with 1% osmic acid for 2 h, dehydrated with graded ethanol, transferred through epichlorohydrin, embedded in epoxy resin, and cut into ultrathin section. The surface composition and functional groups of the solid particulate and the cells were characterized by FT-IR. The FT-IR spectra were collected in the range of 4000–500 cm−1 by an FT-IR spectrometer (Nexus 670, Nicolet, Madison, WI, USA) after mixing 0.9 mg of each sample with 80 mg of KBr and pressing the mixture into a pellet. The phase composition of the solid particulate was analyzed by Raman spectroscopy. Briefly, the Raman spectra were recorded at room temperature in the range of 200–4000 cm−1 by a Raman spectrometer (DXR, Thermo Fisher, Sunnyvale, CA, USA).

2.3.3. C, S and Hg Speciation on the Surface of Solid Particulate

The C, S and Hg speciation transformation on the surface of the solid particulate was analyzed by X-ray photoelectron spectroscopy (XPS) with an X-ray photoelectron spectrometer (ESCALAB Xi+, Thermo Fisher, Sunnyvale, CA, USA). All photoelectron binding energies were referenced to C 1s adventitious contamination peaks set at 285.0 eV, and the linear combination of the measured spectrum was fitted with CASAXPS software (v2.3.16).

2.3.4. Analysis of Microbial Diversity

Microbial diversity was determined by Illumina high-throughput sequencing at Magigene Co., Ltd., Guangzhou, China. The total DNA of the cell samples was extracted by the total DNA Extraction Kit (DNeasy Powersoil Kit, Qiagen, Hilden, Germany). The integrity and purity of DNA were detected by 1% agarose gel electrophoresis, and the concentration and purity of DNA were detected by a NanoDrop One. The 16S rRNA gene was amplified with barcode primers and PremixTaq (TaKaRa, Shiga, Japan) and sequenced on an Illumina HiSeq platform. The sequencing was completed by Guangdong Meige Gene Technology Co., Ltd., and the reads without correct barcode information and an essential quality score of Q20 or higher were removed using Mothur, and then mapped against consensus 16S RNA V3–V4 sequences, yielding 87,283 and 88,075 filtered reads on average for the groups without and with Hg2+, respectively, accounting 98.9 and 99% of the total reads. After quality control splicing, sequencing data were clustered into operational taxonomic units (OTUs) at 97% similarity. The obtained OTUs were annotated with the Silva database, and the alpha and beta diversity analyses were performed using R software version 4.2.1 and related packages [22].

3. Results and Discussion

3.1. Effects of Hg2+ on Microbial S0 Reduction and Hg2+ Fixation

The [S2−]aq for the experimental group without Hg2+ was significantly higher than that with the addition of Hg2+ at the early cultivation stage, and then gradually increased to the stationary stage with no significant difference for both groups in the later cultivation stage (Figure 1), indicating the microbial S0 reduction was inhibited initially by Hg2+, and the inhibition effect of Hg2+ on microbial cells was gradually relieved as the culture time increased. The [Hg2+]aq for the group with Hg2+ showed a downward trend at days 0–22, and then decreased to approximately zero (Figure 1). These results indicated that the presence of Hg2+ can inhibit microbial S0 reduction at the early cultivation stages, resulting in the extension of the adaptation period for bacterial growth (Figure S2). Bacteria enter exponential growth after adapting to or gradually relieving Hg stress through bioremediation by mercury-resistant bacteria (Figure S2) [10]. Furthermore, Hg2+ in the solution can react with S2− to produce HgS and can also be reduced to Hg0 by mercury-reducing bacteria [12,13,23], resulting in a decrease in [Hg2+]aq in the solution and reducing the inhibition of Hg2+ on microbial cells.

3.2. Microbial Cell Morphology and Surface Composition

According to the results in Figure 2a,b, the microbial cells were mainly rod shaped, spherical, and ellipsoidal. In the absence of Hg2+, the cell surface was smooth (Figure 2a), while in the presence of Hg2+, granular and flocculent substances were common around the cells (Figure 2b). The EDS analysis results showed relatively high proportions of C, N, O, P and S on the cells for each group, with 1.52% and 1.71% of S for the groups without and with Hg2+, respectively. In addition, in the presence of Hg2+, a small amount of Hg was also detected on the cell surface. These results indicated that for the group with the addition of Hg2+, microorganisms can enrich Hg through their cell surface substances and produce flocculent granules. Of note, the presence of Hg was closely related to S, which may be because the cell surface is rich in thiol groups (-SH), and the thiol groups can capture Hg2+ on the cell surface by forming S-Hg bonds with Hg2+ [24].
To illustrate the utilization of Hg by microbial cells, the internal structure and elemental distribution of cells for the group with Hg2+ were analyzed by TEM-EDS (Figure 3). Figure 3a shows that the outline of the cell section was clearly visible, and many small black depositional dots accumulated on the cell wall and inside the cell. EDS of the arbitrarily selected area (dotted rectangle in Figure 3a) shows that the black depositional dots in the bacterial cell contained a large amount of Hg and S (Figure 3b), which further proved the process by which bacteria capture Hg2+ through extracellular polymer substances (EPS) and transport it to the interior of the cell for utilization.
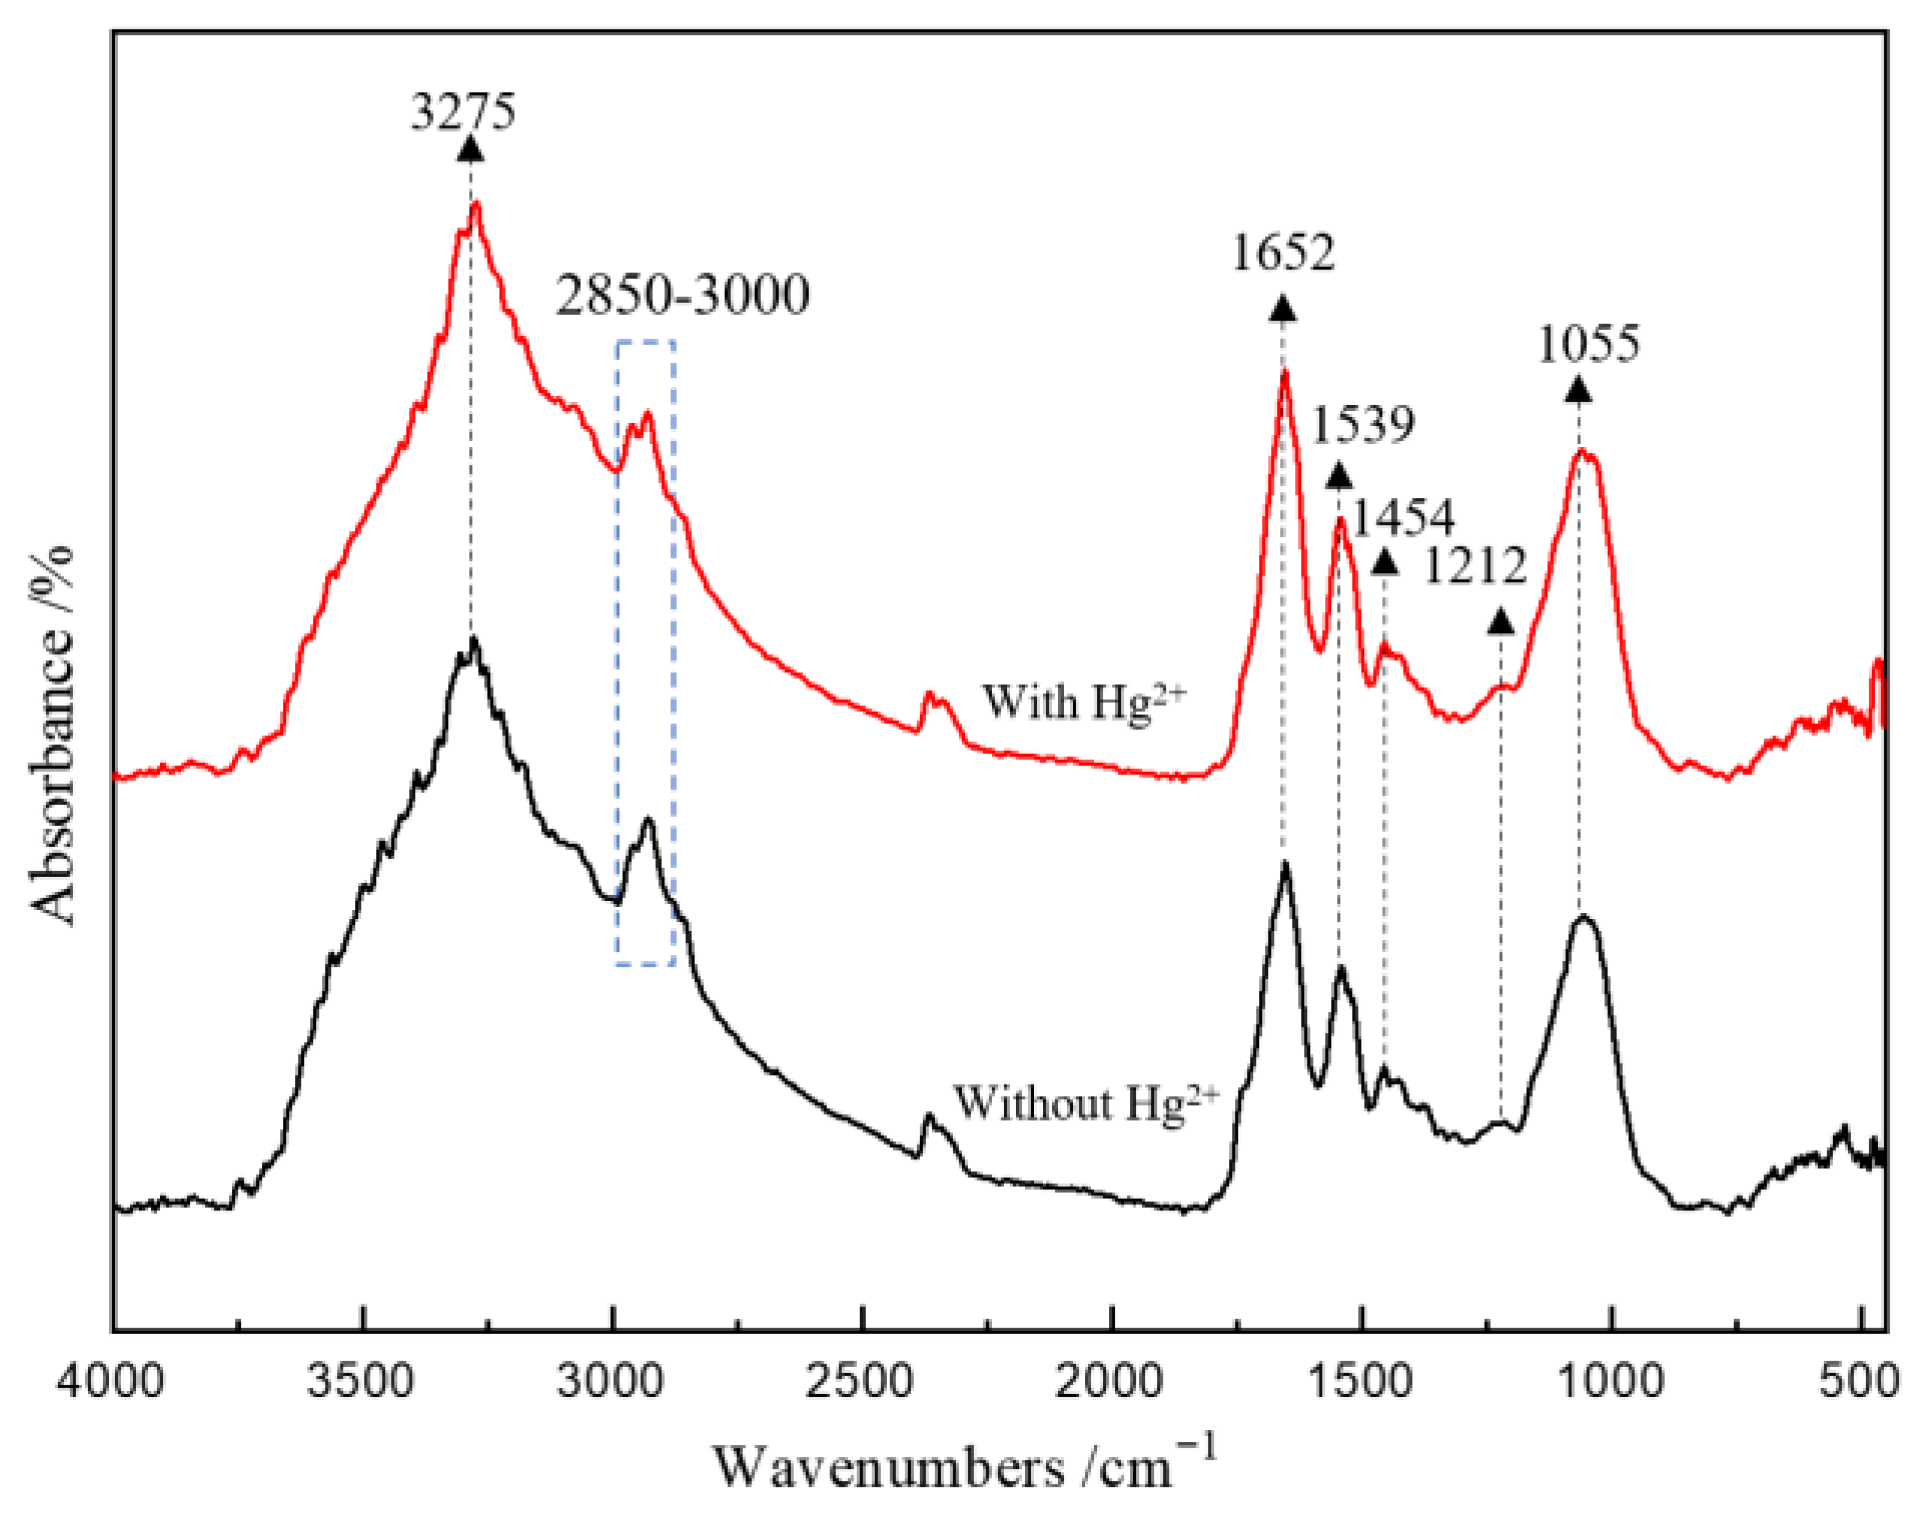
The FT-IR spectra of the cells for the groups without and with Hg2+ are shown in Figure 4. The cells for all groups had absorption bands with different intensities at 3275, 2850–3000, 1652, 1539, 1454, 1212 and 1055 cm−1. Among them, the band at 3275 cm−1 is due to the stretching vibration of the O-H bond, the bands at 2850–3000 cm−1 are due to the vibration of -CH2 and -CH3 in fatty acids, the bands at 1652 cm−1 and 1539 cm−1 are associated with C=O and N-H in protein amide bonds, the band at 1454 cm−1 is due to the vibration of the benzene ring skeleton, the band at 1212 cm−1 is assigned to the stretching vibration of the C-O group, and the band at 1055 cm−1 is associated with S=O [25]. Compared with the FT-IR results of microbial cells without Hg2+, it was found that for the group with Hg2+, the intensity of the bands at 2850–3000 cm−1 and 1212 cm−1 apparently decreased, indicating that the existence of Hg2+ resulted in the decreased expression of some polysaccharides and lipids in bacteria. In addition, the bands at 1652 and 1539 cm−1 became sharper and increased in intensity for the group with Hg2+, indicating an increase in cell surface protein expression. These results are very likely to be related to the Hg tolerance mechanism of the AMD enrichment culture; that is, the microorganism secretes more -SH-containing extracellular proteins under the stress of Hg2+ and adsorbs and immobilizes Hg2+ to attenuate or mitigate its toxicity [26,27].

3.3. Surface Morphology and Composition of Solid Particulate

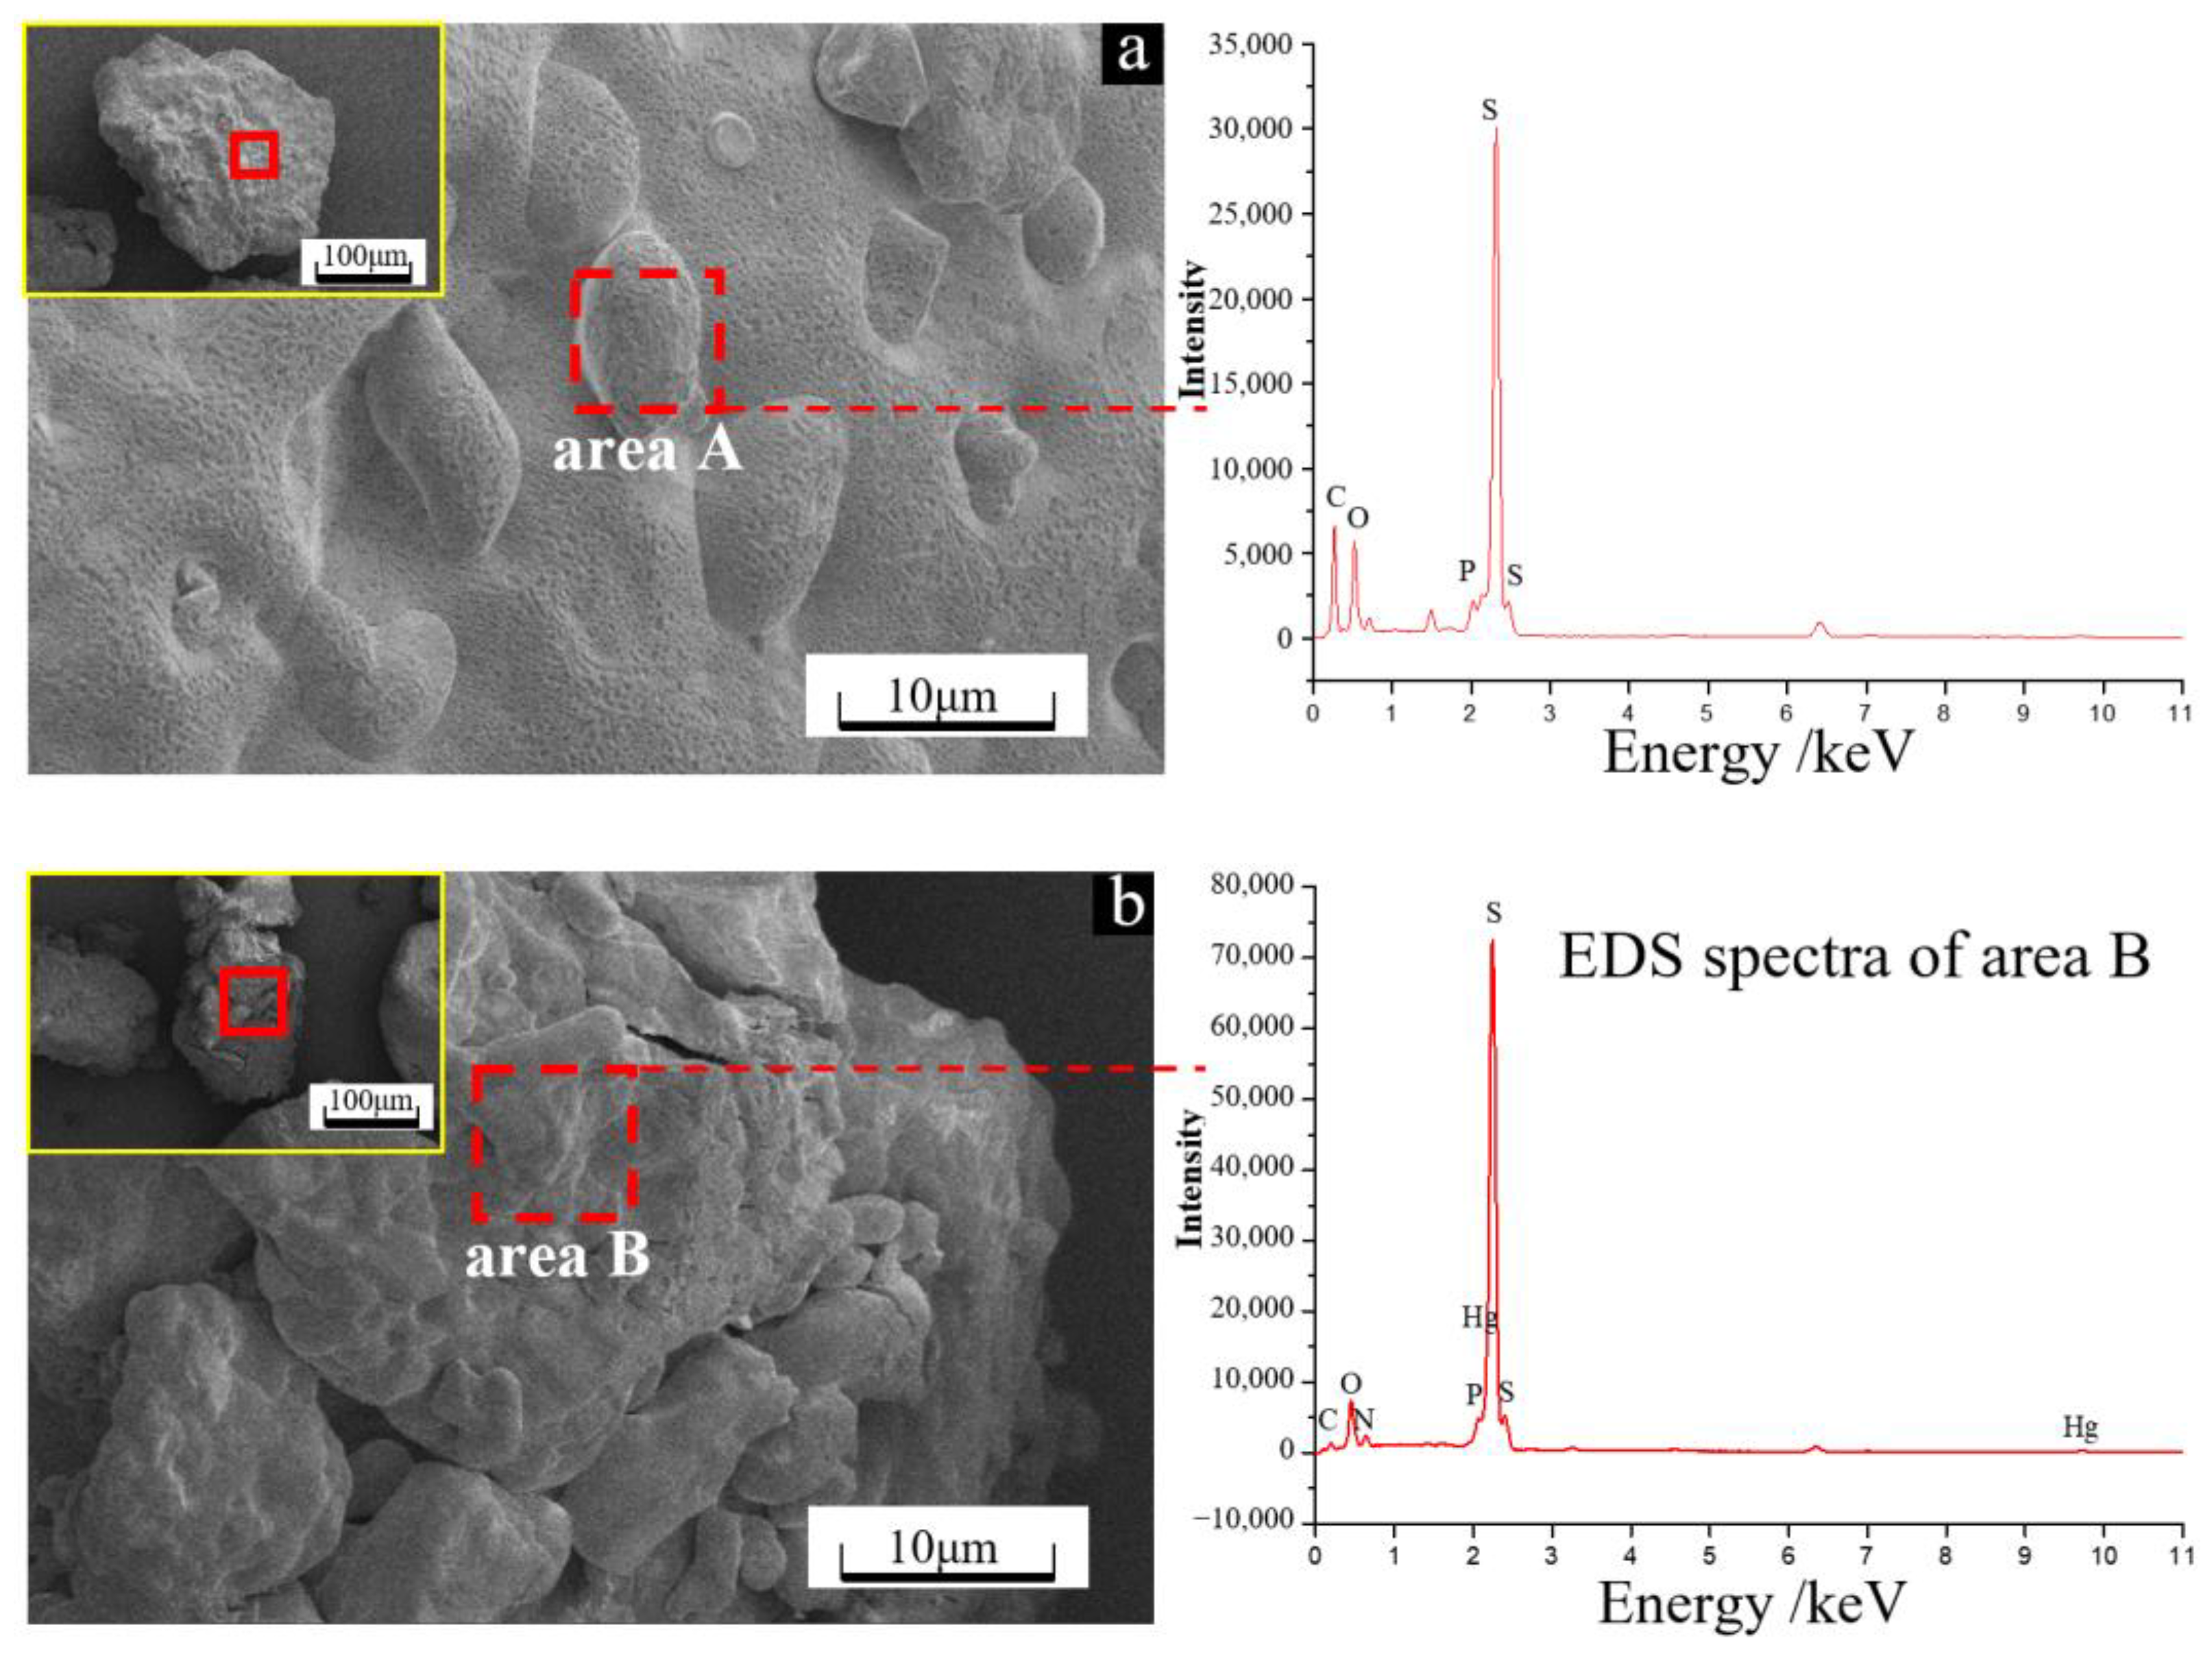
In the absence of Hg2+, the surface morphology of the solid particulate was relatively intact with concave traces of depressions eroded by bacteria (Figure 5a), while in the presence of Hg2+, it was relatively rough with loose particles (Figure 5b). The EDS results showed that in the absence of Hg2+, the surface of the solid particulate mainly consisted of S (49.7%), C (70.8%) and O (14.0%), while in the presence of Hg2+, the surface contained small amounts of Hg in addition to S, C and O, and the proportions of S, C and O decreased. These results indicated that in the absence of Hg2+, microbial cells might adhere and erode to the sulfur surface, forming corrosion pits on the surface and increasing extracellular polymers, while in the presence of Hg2+, microbial cells might enter the sulfur particles for action, resulting in loose granules on the surface.
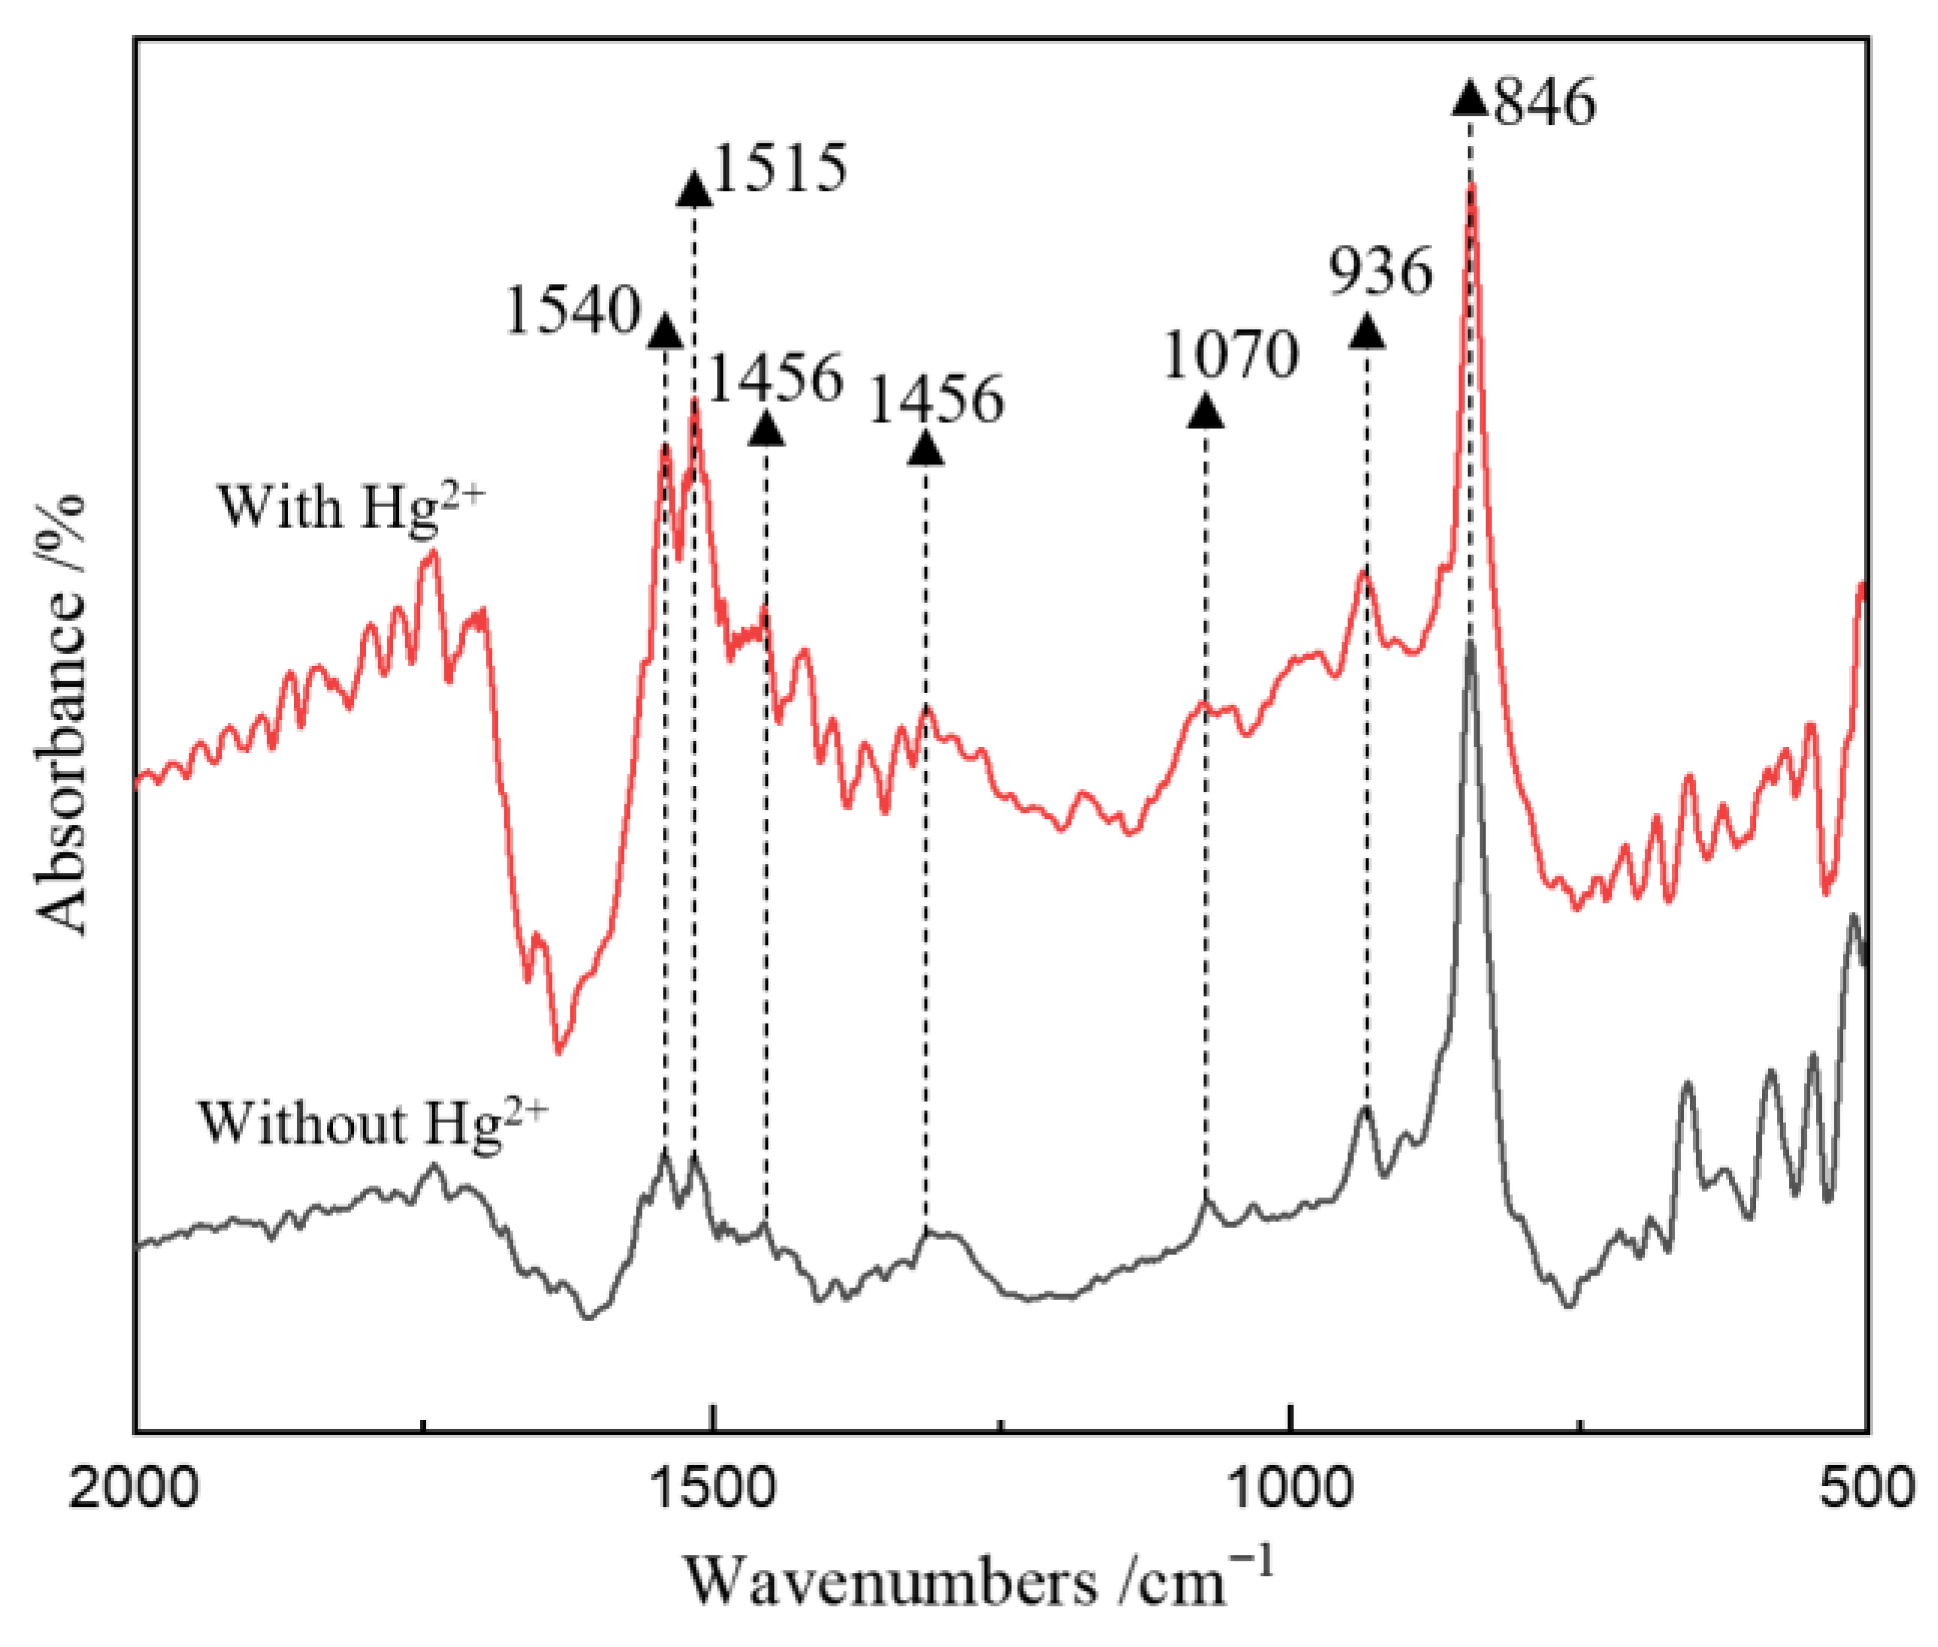
The surface composition of the particulate matter during the experiment was further analyzed by FT-IR spectroscopy, and the results are shown in Figure 6. According to a previous study [28], the FT-IR band at 846 cm−1 is the characteristic peak of S0 (Figure 6). For both groups without and with Hg2+, vibration bands related to phosphate groups and hydrocarbons (at 900 ~ 1500 cm−1) and protein amide bonds (at 1515 and 1540 cm−1) appeared (Figure 6), indicating the adsorption of microbes on the S0 surface. Notably, for the group with Hg2+, the intensity of the bands at 900~1500 cm−1 and the bands at 1515 and 1540 cm−1 are higher than that for the group without Hg2+, indicating more microbial cells adsorbed on the S0 surface.

3.4. Dynamics of C, S and Hg Speciation on Solid Particulate Surface

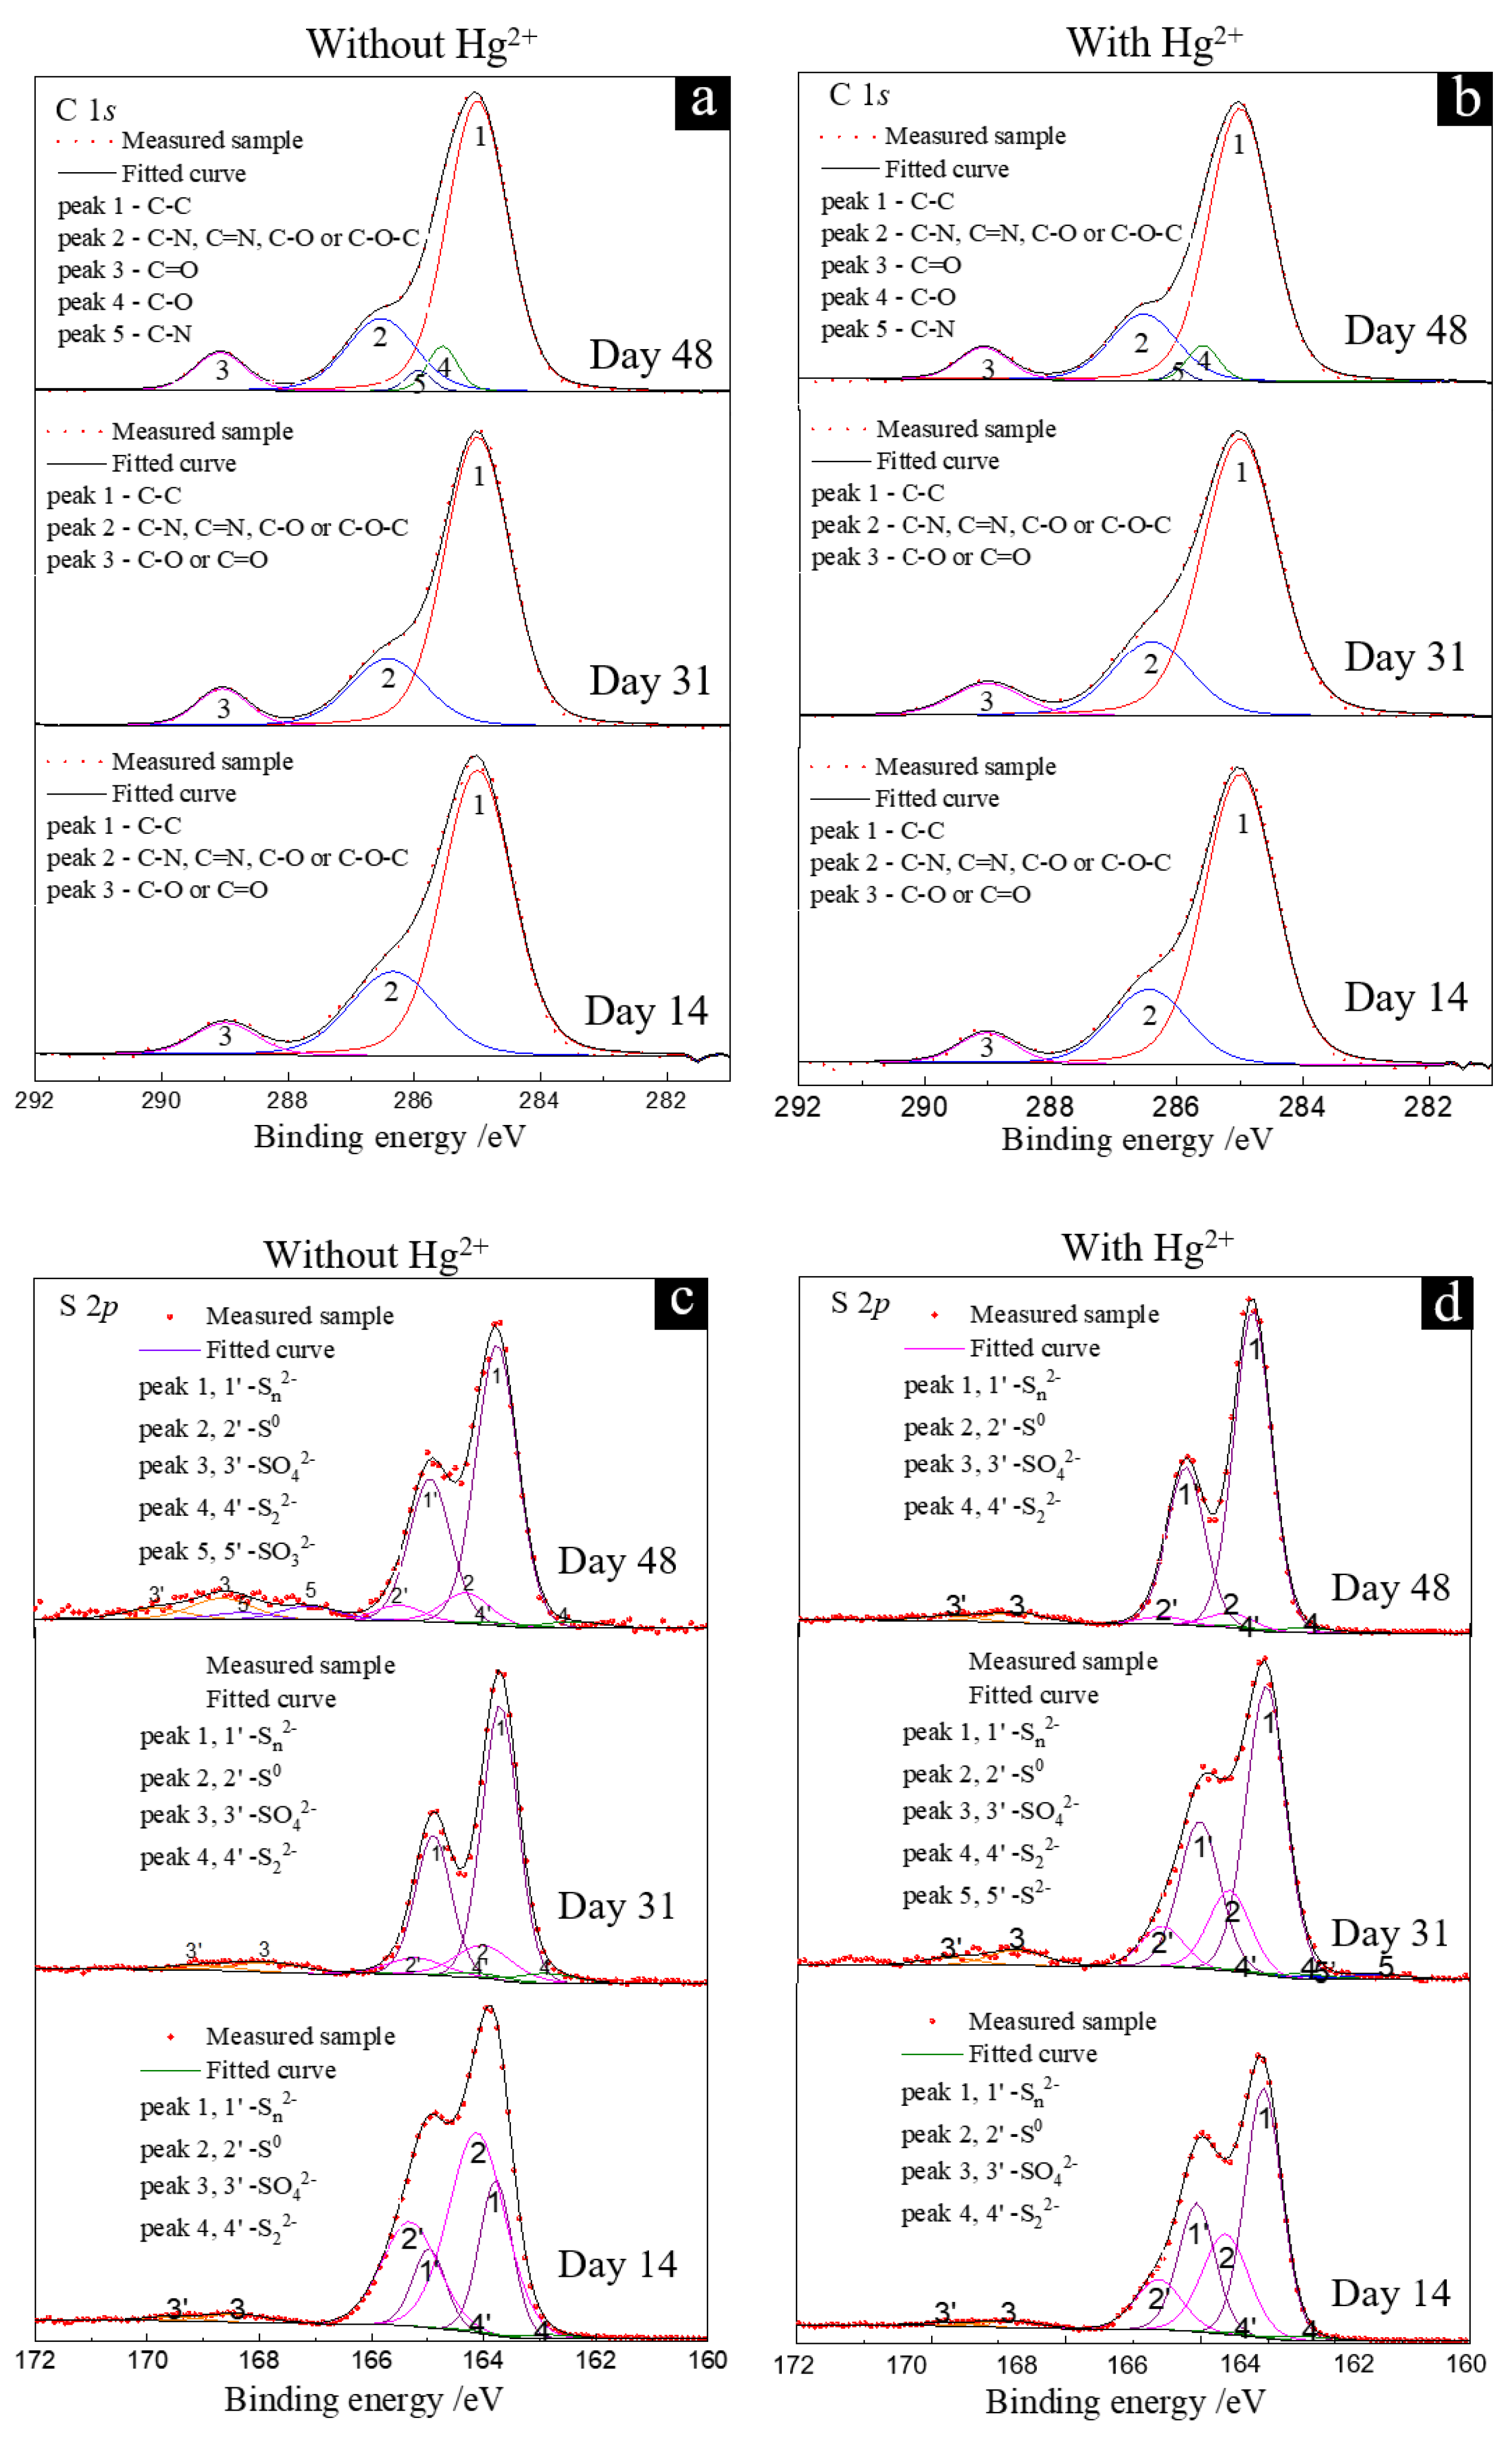
During the S0 reduction by the AMD enrichment culture, complex speciation transformations of C, S and Hg occurred, which were closely related to the changes in solution physical and chemical properties, the mineral and microbial surface structure, and the microbial community composition. To analyze the fate of Hg and the formation process and mechanism of secondary products during the anaerobic reduction of S0 by the AMD enrichment culture, the C/S/Hg speciation transformation on the solid particulate surface was analyzed based on XPS spectroscopy and the results are shown in Figure 7.
The fitting results of the C 1s XPS spectra (Figure 7a,b) showed that the main carbon species on the surface of the solid particulate included C-C/C-H (284.8 eV), C-O (286.4 eV), and O-C=O (289.0 eV) [29,30]. By comparing the C 1s XPS spectra for both groups on days 14, 31 and 48, it was found that with increasing culture time, the intensity of fitting peak 3 of C = O increased, and new peaks 4 (C=O) and 5 (C-N) appeared at 285.5 eV and 285.9 eV, indicating the existence of microbial substances on the surface of solid particulate, which are consistent with the results of the FT-IR spectra. Notably, the intensities of fitting peaks 2 and 3 at day 14 for the group in the presence of Hg2+ were lower than those without Hg2+, while their intensities were similar for both groups at days 31 and 48, indicating that the growth of the AMD enrichment culture gradually returned to normal after adaptation to Hg2+ and produced more EPS on the surface of the solid particulate.
The fitting results of the S 2p XPS spectra (Figure 7c,d) showed that the S species on the S0 surface were mainly composed of Sn2− (163.6 ± 0.3 eV), S0 (164.2 ± 0.4 eV), SO42− (168.0 ± 0.3 eV), S22− (162.6 ± 0.3 eV), S2− (161.5 ± 0.3 eV) and SO32− (166.8 ± 0.4 eV) [31]. By comparing the S 2p XPS spectra on days 14, 31 and 48, it was found that the characteristic peak of S0 gradually decreased during the utilization of S0 for both groups, accompanied by a gradual increase in the intensity and proportion of the peak at 163.8 eV, indicating that S0 is continuously reduced to Sn2−, S22− and S2−. Notably, by comparing the group without Hg2+, the intensity of the Sn2− peak for the group with Hg2+ was significantly lower than that of the S0 peak at day 14, which was probably due to the fixation of Hg2+ on the solid S0 surface.
The fitting results of the Hg 4f XPS spectra show that the Hg species on the surface of the solid particulate mainly exist in the form of Hg2+, Hg0 and Hg-S (Figure 7e). By comparing the Hg 4f XPS spectra on days 14, 31 and 48, it was found that with increasing culture time, new peaks appeared at approximately 104.5 eV (Hg-S) and 100.0 eV (Hg0) for the group with Hg2+, and the peak position of Hg2+ (peak 1) moved to the right, indicating a trend of Hg2+ reduction. The formation of Hg0 by microbial Hg2+ reduction was also observed by Raman spectroscopy (Figure S3), which is considered to be an important detoxification pathway for microbial growth in the presence of Hg2+ [11,12,13].
Based on the C 1s, S 2p and Hg 4f on the surface of the solid particulate, it can be inferred that the speciation transformation of C, S and Hg is closely related to the anaerobic S0 reduction process by the AMD enrichment culture. Under anaerobic conditions, the interaction between the AMD enrichment culture and S0 leads to the transformation of S and Hg species, the reduction of S0 in the solid phase and an increase in [S2−]aq in the solution. In addition, combined with EDS analysis of AMD-enriched cells and solid particulate, it can be confirmed that the fixation of Hg2+ further affects the fate behavior of Hg, making it transfer from solution to substrate sulfur and the cell surface. HgS and Hg2+ can further combine with EPS and are transported to cells and transformed into Hg0 through microbial action [32].

3.5. Microbial Community Structure

To further illustrate the correlation between anaerobic S0 reducing microorganisms and Hg2+ transformation, the microbial community structures for the groups without and with Hg2+ were analyzed based on 16S rDNA high-throughput sequencing, and the number of OTUs was 501 and 490, respectively. The richness and Simpson indexes of the OTUs were used for the alpha-diversity analysis, and principal component analysis (PCA) was used for the beta-diversity analysis (Figure S4). The richness index can characterize the richness of the microbial community, and the Simpson index can reflect the evenness of the microbial community. The results in Figure S4a,b show that the richness index for both groups was not significantly different, while the Simpson index for the group with Hg2+ was significantly lower than that for the group without Hg2+, and the results in Figure S4c show that the difference of the microbial community for the group with Hg2+ is relatively small by compassion with that without Hg2+. These results indicated that the addition of Hg2+ did not change the richness of the microbial community but decreased the evenness of microbial diversity, and had enrichment effect on microbial community.
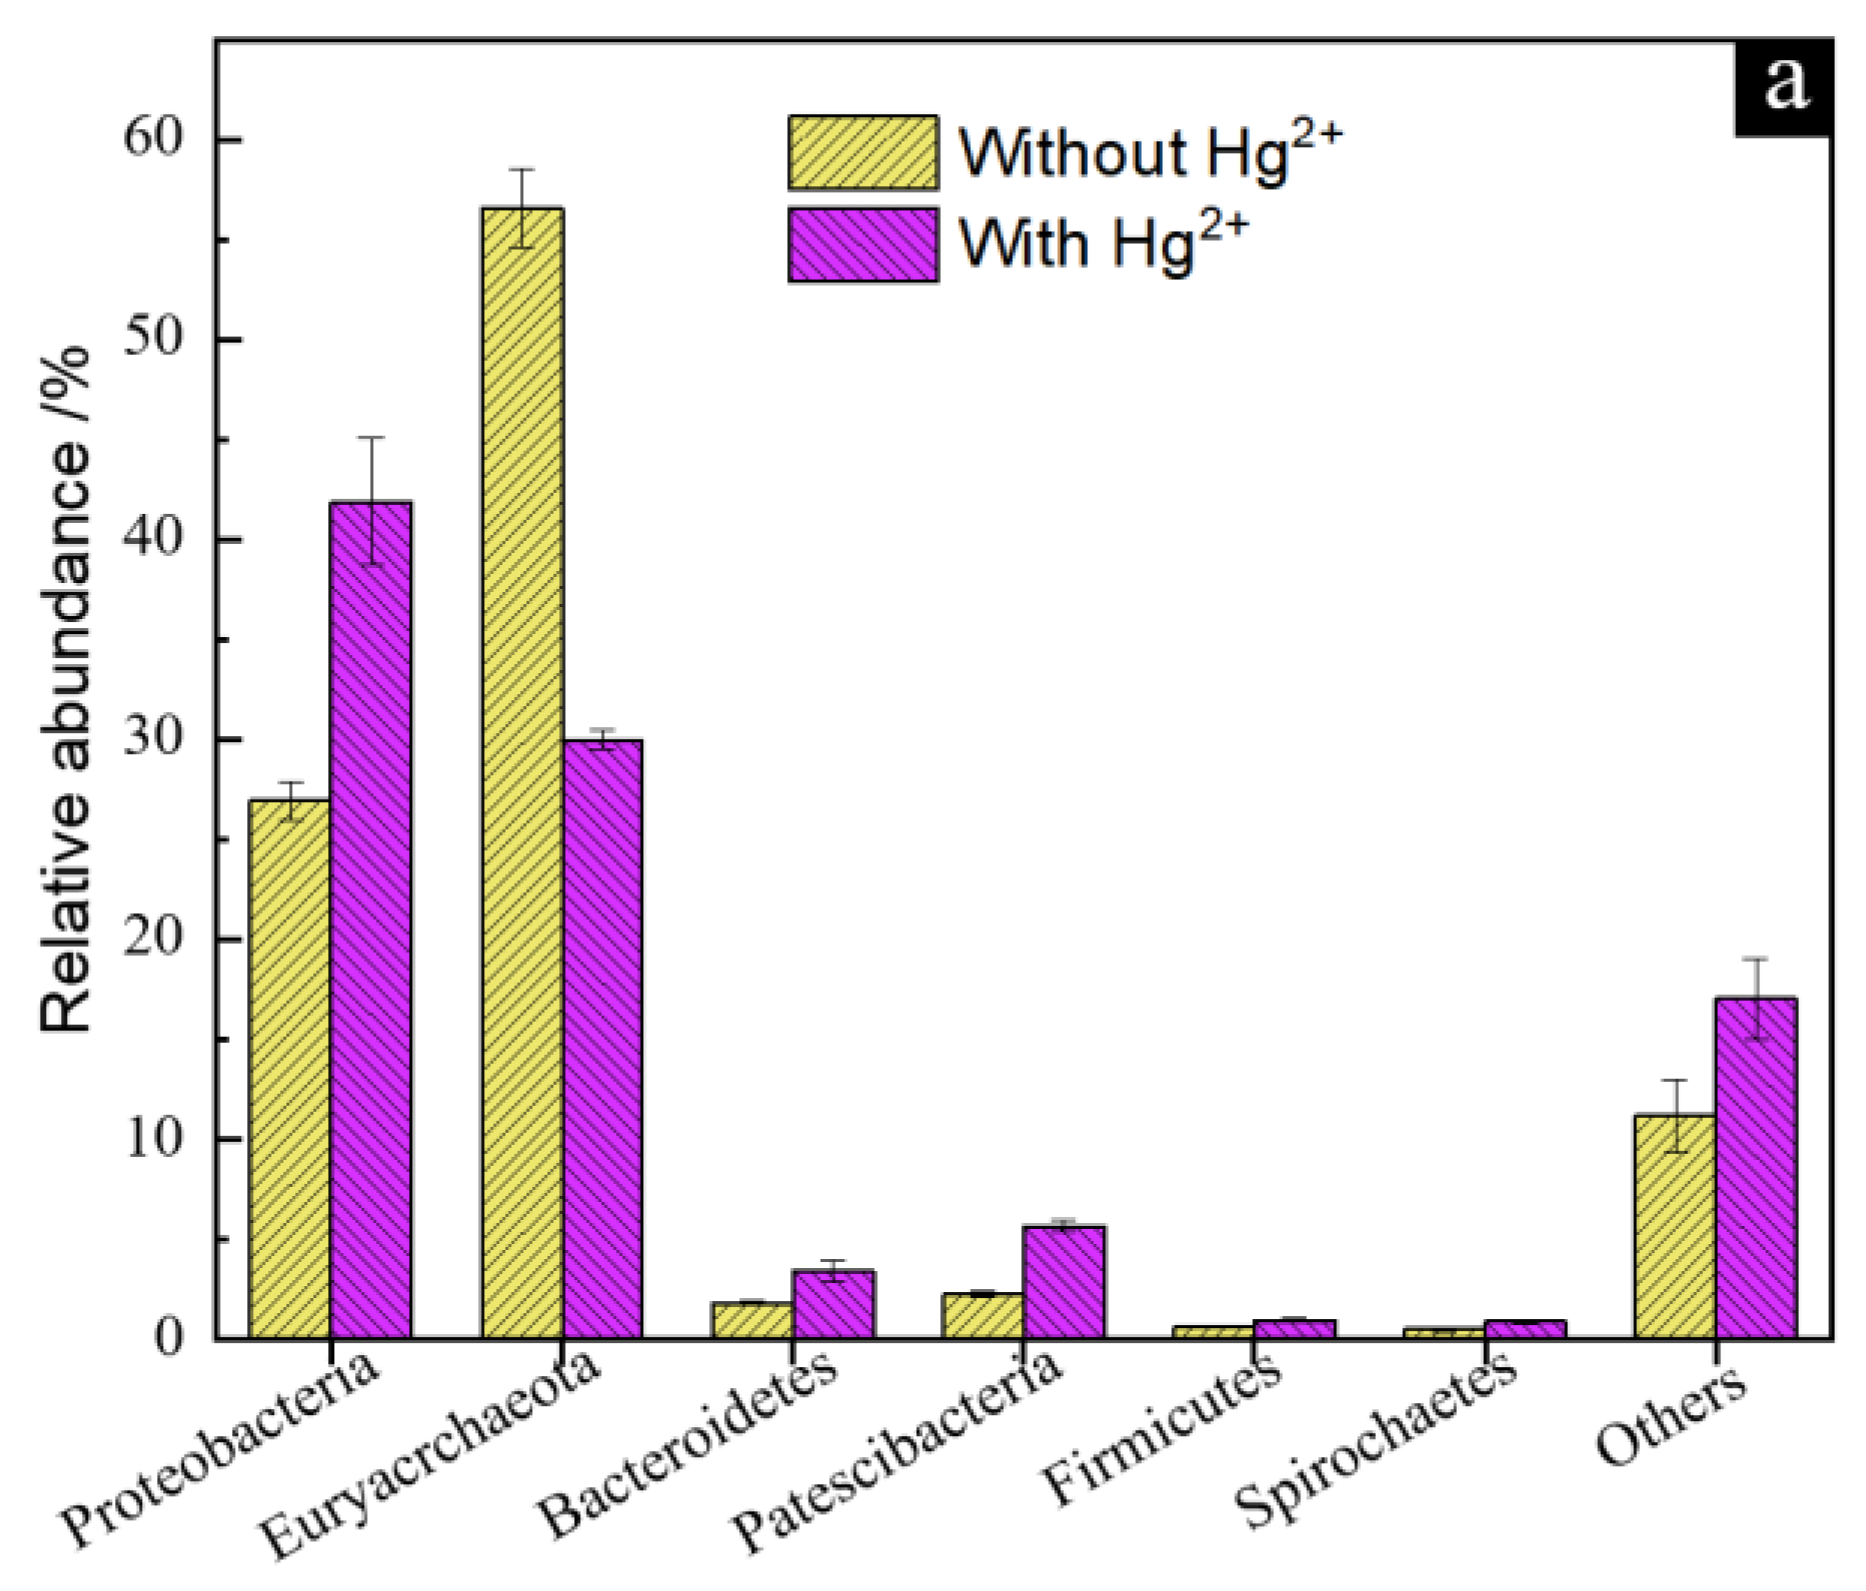
The microbial OTUs can be assigned to 29 phyla, 62 classes, 135 orders, 149 families and 170 genera for the group without Hg2+, and 35 phyla, 63 classes, 131 orders, 152 families and 174 genera for the group with Hg2+. The relative abundance results of the microbial community at the phylum level show that Proteobacteria and Euryarchaeota were dominant for both cases without and with Hg2+ (Figure 8a). By comparing with the group without Hg2+, the relative abundance of Proteobacteria, Patescibacteria and Bacteroides for the group with Hg2+ was significantly increased, and the relative abundance of Euryarchaeota decreased, indicating that Euryarchaeota is significantly inhibited by Hg2+, while Proteobacteria, Patescibacteria and Bacteroides can tolerate Hg2+ for growth and metabolism. Liu et al. [33] and Vishnivetskaya et al. [34] found dominant mercury-resistant bacteria such as Proteobacteria and Euryarchaeota in Hg-contaminated paddy soil. Patescibacteria widely exists in anaerobic environments such as groundwater and sediments and has very small cells and genomes, simple structures, and metabolic functions, which may explain why it can tolerate Hg2+ and become the dominant strain [17]. In addition, Bacteroidetes, Firmicutes and Spirochaetes have been reported to be resistant to Hg2+ or able to survive in extreme environments rich in heavy metal ions [35,36,37,38].
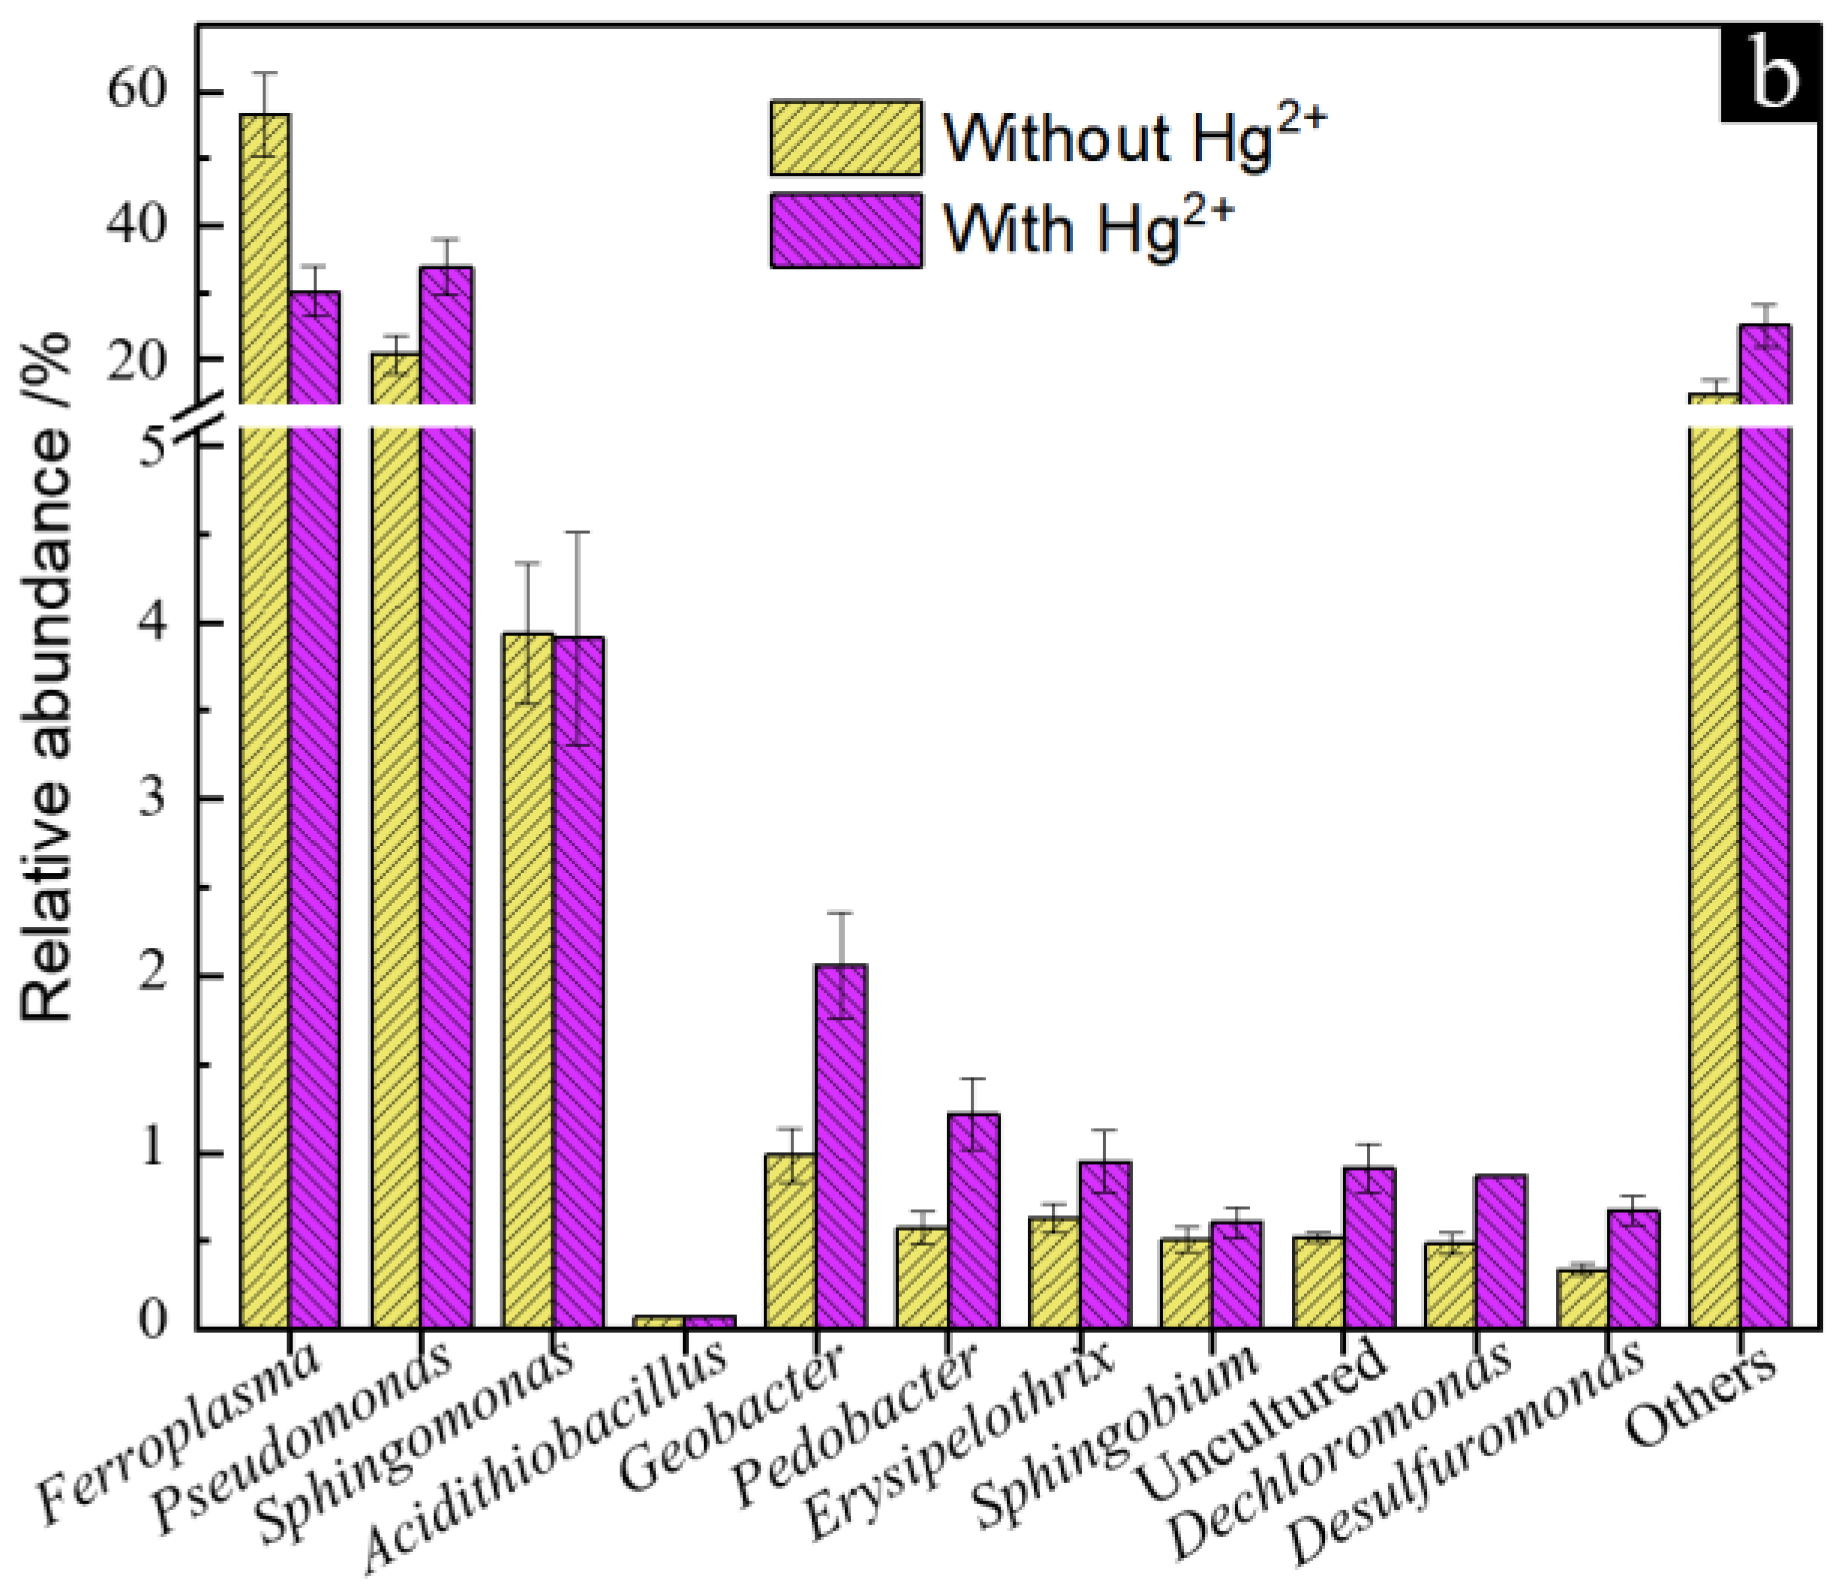
The microorganisms with a relative abundance of more than 0.1% at the genus level were further selected to show their differences (Figure 8b). Compared with the group without Hg2+, the relative abundance of Pseudomonas, Geobacter, Pedobacter, Dechloromonas and Desulfuromonas for the group with Hg2+ increased, and the relative abundance of Ferroplasma decreased. Previous studies have shown that Geobacter and Desulfuromonas have the ability of mercury methylation [39], and Pseudomonas has the ability of methylmercury demethylation and mercury reduction through its mer operon [40,41]. Of note, although bacteria with mercury methylation ability are abundant, the MeHg species was not detected in the solution of the culture medium for the group with Hg2+ added, which was probably because almost all the dissolved Hg2+ was transformed to HgS and Hg0, resulting in the relatively low concentration of MeHg. In addition, the model bacterium Geobacter sulfurereducens is an iron-reducing bacterium with a sulfur reduction function that can reduce Hg2+, and Pseudomonas and Desulfuromonas are key sulfur-reducing bacteria that can reduce S0 to H2S under anaerobic conditions [42,43]. These results indicated that the existence of Hg2+ could significantly change the community structure of the AMD enrichment culture under anaerobic S0 reduction, leading to microbial succession to the community with Hg2+ transformation function.

4. Environmental Significance

The above results show that the transformation of Hg2+ in the process of anaerobic S0 reduction by an AMD environmental enrichment culture is closely related to the microbial sulfur reduction function, and the proposed correlation mechanism is shown in Figure S5. It was concluded that the anaerobic S0 reduction process of the AMD environmental enrichment culture was inhibited in the presence of Hg2+. However, with the development of culture, the AMD enrichment culture could transform Hg2+ into Hg0 and HgS, gradually relieving the inhibition of Hg2+ in the environment, and microbial S0 reduction also recovered rapidly. The process of disinhibition is closely related to the extracellular substances of the enrichment culture, especially the -SH groups of proteins. Of note, the genera Pseudomonas, Geobacter, Pedobacter, Dechloromonas and Desulfuromonas, with mercury reduction and sulfur reduction functions, occupied the main community for the cases with the addition of Hg2+, resulting in the enhancement of Hg resistance and the S0 reduction function of the microbial community. Anaerobic S0 reduction microorganisms continuously reduced S0 to S2−, and the produced S2− could combine with Hg2+ in the solution and continuously generate HgS on the solid particulate and cell surface, which promoted Hg2+ transformation. These processes may be the key driving force for the transformation and fixation of soluble Hg2+ in the anaerobic S0 reduction process by AMD enrichment culture. Hg-reducing microorganisms can also promote Hg2+ transformation by reducing Hg2+ to Hg0, and the evenness of the microbial community related to Hg reduction will decrease. The conversion of the AMD enrichment culture to a microbial community structure with Hg2+ transformation functions could improve the adaptability of the AMD environmental enrichment culture to Hg2+, which is an important detoxification mechanism.

5. Conclusions

The microbial growth and S0 reduction of the AMD enrichment culture were significantly inhibited in the early stage of cultivation by the addition of Hg2+. With increasing culture time, microorganisms gradually tolerate and release the inhibitory effect of Hg2+ in the environment. On the one hand, microorganisms can enrich Hg2+ through their cell surface substances and produce flocculent and granular particles. On the other hand, bacteria can capture Hg2+ through extracellular polymers and further transport it to the interior of cells. Through microbial mercury reduction, Hg0 can be formed in the cell. In the presence of Hg2+, the evenness of the microbial community decreased, and the anaerobic microorganisms related to mercury metabolism and sulfur reduction gradually became dominant. The dominant microorganisms with S0 reduction functions are closely related to mercury transformation and are the key driving force for the transformations of solid particulate and cells and the fixation of Hg2+.

Supplementary Materials

The following supporting information can be downloaded at: https://www.mdpi.com/article/10.3390/microorganisms11010072/s1, Figure S1: Schematic diagram of the bioreactor used for microbial enrichment in AMD environment; Figure S2: Changes in the cell density, [S2−]aq and total Hg during microbially anaerobic S0 reduction for the groups with 0, 1.0, 2.0 and 5.0 mg/L Hg2+; Figure S3: The Raman spectra of the solid particulate on days 14, 31 and 48 for the reference samples, and for the groups without and with Hg2+; Figure S4: The richness index richness and Simpson index diversity of the microbial community for the groups without and with Hg2+; Figure S5: The proposed correlation mechanism between Hg2+ transformation and anaerobic S0 reduction by AMD enrichment culture.

Author Contributions

Conceptualization, H.L.; methodology, Y.L. and Z.N.; investigation, Y.Z. and Y.L.; data curation, Y.Z., Y.L. and Y.W., validation, Y.L. and L.C.; Writing—Original draft preparation, Y.Z. and Y.L.; Writing—Reviewing and editing, H.L. and Z.N., funding acquisition, H.L. and Z.N. All authors have read and agreed to the published version of the manuscript.

Funding

This research was funded by the National Natural Science Foundation of China, grant number 41830318 and 41802038.

Institutional Review Board Statement

Not applicable.

Informed Consent Statement

Not applicable.

Data Availability Statement

Sequence data were deposited at NCBI under accession number PRJNA910676.

Acknowledgments

We thank Jinlan Xia from Central South University, Changsha, China, for his support to the experimental conditions. Thanks to the three anonymous reviewers and the academic editor for their constructive review.

Conflicts of Interest

The authors declare no conflict of interest.

References

  1. Rodríguez-Galán, M.; Baena-Moreno, F.M.; Vázquez, S.; Arroyo-Torralvo, F.; Vilches, L.F.; Zhang, Z.E. Remediation of acid mine drainage. Environ. Chem. Lett. 2019, 17, 1529–1538. [Google Scholar] [CrossRef]
  2. O′Connor, D.; Hou, D.Y.; Ok, Y.K.; Mulder, J.; Duan, L.; Wu, Q.R.; Wang, S.; Tack, F.M.G.; Rinklebe, J. Mercury speciation, transformation, and transportation in soils, atmospheric flux, and implications for risk management: A critical review. Environ. Int. 2019, 126, 747–761. [Google Scholar] [CrossRef] [PubMed]
  3. Lee, C.S.; Fisher, N.S. Bioaccumulation of methylmercury in a marine copepod. Environ. Toxicol. Chem. 2016, 36, 1287–1293. [Google Scholar] [CrossRef] [PubMed] [Green Version]
  4. Driscoll, C.T.; Mason, R.P.; Chan, H.M.; Jacob, D.J.; Pirrone, N. Mercury as a global pollutant: Sources, pathways, and effects. Environ. Sci. Technol. 2013, 47, 4967–4983. [Google Scholar] [CrossRef]
  5. Klein, R.; Tischler, J.S.; Mühling, M.; Schlömann, M. Bioremediation of mine water. Adv. Biochem. Eng. Biotechnol. 2014, 141, 109–172. [Google Scholar]
  6. Ndu, U.; Barkay, T.; Schartup, A.T.; Mason, R.P.; Reinfelder, J.R. The effect of aqueous speciation and cellular ligand binding on the biotransformation and bioavailability of methylmercury in mercury-resistant bacteria. Biodegradation 2016, 27, 29–36. [Google Scholar] [CrossRef]
  7. Lovley, D.R. Dissimilatory metal reduction. Annu. Rev. Microbiol. 1993, 47, 263–290. [Google Scholar] [CrossRef] [PubMed]
  8. Wang, J.X.; Shaheen, S.M.; Jing, M.; Anderson, C.W.N.; Swertz, A.C.; Wang, S.L.; Feng, X.; Rinklebe, J. Mobilization, methylation, and demethylation of mercury in a paddy soil under systematic redox changes. Environ. Sci. Technol. 2021, 55, 10133–10141. [Google Scholar] [CrossRef]
  9. Pak, K.R.; Bartha, R. Mercury methylation and demethylation in anoxic lake sediments and by strictly anaerobic bacteria. Appl. Environ. Microbiol. 1998, 64, 1013–1017. [Google Scholar] [CrossRef] [Green Version]
  10. Bravo, G.; Vega-Celedón, P.; Gentina, J.C.; Seeger, M. Effects of mercury II on Cupriavidus metallidurans strain MSR33 during mercury bioremediation under aerobic and anaerobic conditions. Processes 2020, 8, 893. [Google Scholar] [CrossRef]
  11. Hamlett, N.V.; Landale, E.C.; Davis, B.H.; Summers, A.O. Roles of the Tn21 merT, merP, and merC gene products in mercury resistance and mercury binding. J. Bacteriol. 1992, 174, 6377–6385. [Google Scholar] [CrossRef] [PubMed]
  12. Kim, E.H.; Mason, R.P.; Porter, E.T.; Soulen, H.L. The impact of resuspension on sediment mercury dynamics, and methylmercury production and fate: A mesocosm study. Mar. Chem. 2006, 102, 300–315. [Google Scholar] [CrossRef]
  13. Du, H.; Ma, M.; Igarashi, Y. Biotic and abiotic degradation of methylmercury in aquatic ecosystems: A review. Bull. Environ. Contam. Toxicol. 2019, 102, 605–611. [Google Scholar] [CrossRef]
  14. Sasaki, Y.; Minakawa, T.; Miyazaki, A.; Silver, S.; Kusano, T. Functional dissection of a mercuric ion transporter, MerC, from Acidithiobacillus ferrooxidans. Biosci. Biotechnol. Biochem. 2005, 69, 1394–1402. [Google Scholar] [CrossRef] [PubMed] [Green Version]
  15. Niane, B.; Devarajan, N.; Poté, J.; Moritz, R. Quantification and characterization of mercury resistant bacteria in sediments contaminated by artisanal small-scale gold mining activities, Kedougou region, Senegal. J. Geochem. Explor. 2019, 205, 106353. [Google Scholar] [CrossRef]
  16. Möller, A.; Grahn, A.; Welander, U. Precipitation of heavy metals from landfill leachates by microbially-produced sulphide. Environ. Technol. 2004, 25, 69–77. [Google Scholar] [CrossRef] [PubMed]
  17. Tian, R.M.; Ning, D.L.; He, Z.L.; Zhang, P.; Spencer, S.J.; Gao, S.H.; Shi, W.; Wu, L.; Zhang, Y.; Yang, Y.; et al. Small and mighty: Adaptation of superphylum Patescibacteria to groundwater environment drives their genome simplicity. Microbiome 2020, 8, 51. [Google Scholar] [CrossRef] [Green Version]
  18. Sun, R.R.; Li, Y.; Lin, N.N.; Ou, C.X.; Wang, X.Y.; Zhang, L.; Jiang, F. Removal of heavy metals using a novel sulfidogenic AMD treatment system with sulfur reduction: Configuration, performance, critical parameters and economic analysis. Environ. Int. 2020, 136, 105457. [Google Scholar] [CrossRef]
  19. Fischer, S.; Jarsjö, J.; Rosqvist, G.; Mörth, C.M. Catchment-scale microbial sulfate reduction (MSR) of acid mine drainage (AMD) revealed by sulfur isotopes. Environ. Pollut. 2022, 292, 118478. [Google Scholar] [CrossRef]
  20. Hedderich, R.; Klimmek, O.; Kröger, A.; Dirmeier, R.; Keller, M.; Stetter, K.O. Anaerobic respiration with elemental sulfur and with disulfides. FEMS Microbiol. Rev. 1998, 22, 353–381. [Google Scholar] [CrossRef]
  21. Wang, J.T.; Zhang, L.; Kang, Y.; Chen, G.H.; Jiang, F. Long-term feeding of elemental sulfur alters microbial community structure and eliminates mercury methylation potential in sulfate-reducing bacteria abundant activated sludge. Environ. Sci. Technol. 2018, 52, 4746–4753. [Google Scholar] [CrossRef] [PubMed]
  22. Quast, C.; Pruesse, E.; Yilmaz, P.; Gerken, J.; Schweer, T.; Yarza, P.; Peplies, J.; Glöckner, F.O. The SILVA ribosomal RNA gene database project: Improved data processing and web-based tools. Nucleic Acids Res. 2013, 41, D590–D596. [Google Scholar] [CrossRef] [PubMed]
  23. Parks, J.M.; Johs, A.; Podar, M.; Bridou, R.; Hurt, R.A., Jr.; Smith, S.D.; Tomanicek, S.J.; Qian, Y.; Brown, S.D.; Brandt, C.C.; et al. The genetic basis for bacterial mercury methylation. Science 2013, 339, 1332–1335. [Google Scholar] [CrossRef] [PubMed] [Green Version]
  24. Shi, L.; Jia, F.J.; Wang, L.; Jalalah, M.; Al-Assiri, M.S.; Gao, T.; Harraz, F.A.; Li, G. Fabrication of an artificial ionic gate inspired by mercury-resistant bacteria for simple and sensitive detection of mercury ion. Sens. Actuators B. Chem. 2021, 326, 128976. [Google Scholar] [CrossRef]
  25. Zhang, H.D.; Ma, Y.L.; Zhou, Y.H.; Liu, H.C.; Nie, Z.Y.; Pan, X.; Fan, X.-L.; Xia, J.-L. The differential inhibitive effects and fates of As(III) and As(V) mediated by Sulfobacillus thermosulfidooxidans grown on S0, Fe2+ and FeS2. Ecotoxicol. Environ. Safe. 2021, 222, 112502. [Google Scholar] [CrossRef]
  26. Cheng, J.P.; Zhao, W.C.; Liu, Y.Y.; Wu, C.; Liu, C.; Wang, W.H. Adsorption properties and gaseous mercury transformation rate of natural biofilm. Bull. Environ. Contam. Toxicol. 2008, 81, 516–520. [Google Scholar] [CrossRef]
  27. Dash, H.R.; Das, S. Interaction between mercuric chloride and extracellular polymers of biofilm-forming mercury resistant marine bacterium Bacillus thuringiensis PW-05. RSC Adv. 2016, 6, 109793–109802. [Google Scholar] [CrossRef]
  28. Liu, H.C.; Xia, J.L.; Nie, Z.Y.; Peng, A.A.; Ma, C.Y.; Zheng, L.; Zhao, Y.-D. Comparative study of sulfur utilization and speciation transformation of two elemental sulfur species by thermoacidophilic Archaea Acidianus manzaensis YN-25. Process. Biochem. 2013, 48, 1855–1860. [Google Scholar] [CrossRef]
  29. Payne, B.P.; Biesinger, M.C.; McIntyre, N.S. X-ray photoelectron spectroscopy studies of reactions on chromium metal and chromium oxide surfaces. J. Electron. Spectros. Relat. Phenomena. 2011, 184, 29–37. [Google Scholar] [CrossRef]
  30. Viltres, H.; Odio, O.F.; Lartundo-Rojas, L.; Reguera, E. Degradation study of arsenic oxides under XPS measurements. Appl. Surf. Sci. 2020, 511, 145606. [Google Scholar] [CrossRef]
  31. Corkhill, C.L.; Wincott, P.L.; Lloyd, J.R. The oxidative dissolution of arsenopyrite (FeAsS) and enargite (Cu3AsS4) by Leptospirillum ferrooxidans. Geochim. Cosmochim. Acta 2008, 72, 5616–5633. [Google Scholar] [CrossRef]
  32. Liu, Y.; Wang, C.; Liu, H.C.; Nie, Z.Y.; Zhou, Y.H.; Xia, J.L. Research progresses on occurrence forms and microbial transformation of mercury. Chinese J. Appl. Environ. Biology. 2022, 28, 1–10. (In Chinese) [Google Scholar]
  33. Liu, X.; Ma, A.Z.; Zhuang, G.Q.; Zhuang, X.L. Diversity of microbial communities potentially involved in mercury methylation in rice paddies surrounding typical mercury mining areas in China. MicrobiologyOpen 2018, 7, e577. [Google Scholar] [CrossRef] [PubMed]
  34. Vishnivetskaya, T.A.; Hu, H.Y.; Van Nostrand, J.D.; Wymore, A.M.; Xu, X.H.; Qiu, G.L.; Feng, X.; Zhou, J.; Brown, S.D.; Brandt, C.C.; et al. Microbial community structure with trends in methylation gene diversity and abundance in mercury-contaminated rice paddy soils in Guizhou, China. Environ. Sci. Proc. Imp. 2018, 20, 673–685. [Google Scholar] [CrossRef] [Green Version]
  35. Rasmussen, L.D.; Zawadsky, C.; Binnerup, S.J.; Øregaard, G.; Sørensen, S.J.; Kroer, N. Cultivation of hard-to-culture subsurface mercury-resistant bacteria and discovery of new merA gene sequences. Appl. Environ. Microbiol. 2008, 74, 3795–3803. [Google Scholar] [CrossRef] [Green Version]
  36. Allen, R.C.; Tu, Y.K.; Nevarez, M.J.; Bobbs, A.S.; Friesen, J.W.; Lorsch, J.R.; McCauley, J.A.; Voet, J.G.; Hamlett, N.V. The mercury resistance (mer) operon in a marine gliding flavobacterium, Tenacibaculum discolor 9A5. FEMS Microbiol. Ecol. 2013, 83, 135–148. [Google Scholar] [CrossRef] [Green Version]
  37. Azaroff, A.; Urriza, M.G.; Gassie, C.; Monperrus, M.; Guyoneaud, R. Marine mercury-methylating microbial communities from coastal to Capbreton Canyon sediments (North Atlantic Ocean). Environ. Pollut. 2020, 262, 114333. [Google Scholar] [CrossRef]
  38. McDaniel, E.A.; Peterson, B.D.; Stevens, S.L.R.; Tran, P.Q.; Anantharaman, K.; McMahon, K.D. Expanded phylogenetic diversity and metabolic flexibility of mercury-methylating microorganisms. mSystems 2020, 5, e00299-20. [Google Scholar] [CrossRef]
  39. Kerin, E.J.; Gilmour, C.C.; Roden, E.; Suzuki, M.T.; Coates, J.D.; Mason, R.P. Mercury methylation by dissimilatory iron-reducing bacteria. Appl. Environ. Microbiol. 2006, 72, 7919–7921. [Google Scholar] [CrossRef] [Green Version]
  40. Fatimawali; Kepel, B.; Tallei, T.E. Potential of organic mercury-resistant bacteria isolated from mercury contaminated sites for organic mercury remediation. Pak. J. Biol. Sci. 2019, 22, 45–50. [Google Scholar]
  41. Fong, J.C.; De Guzman, B.E.; Lamborg, C.H.; Sison-Mangus, M.P. The mercury-tolerant microbiota of the zooplankton Daphnia aids in host survival and maintains fecundity under mercury stress. Environ. Sci. Technol. 2019, 53, 14688–14699. [Google Scholar] [CrossRef] [PubMed]
  42. Nealson, K.H.; Saffarini, D. Iron and manganese in anaerobic respiration: Environmental significance, physiology, and regulation. Annu. Rev. Microbiol. 1994, 48, 311–343. [Google Scholar] [CrossRef] [PubMed]
  43. Zhang, L.; Wu, D.; Liang, J.L.; Wang, L.; Zhou, Y. Triclosan transformation and impact on an elemental sulfur-driven sulfidogenic process. Chem. Eng. J. 2021, 421, 129634. [Google Scholar] [CrossRef]
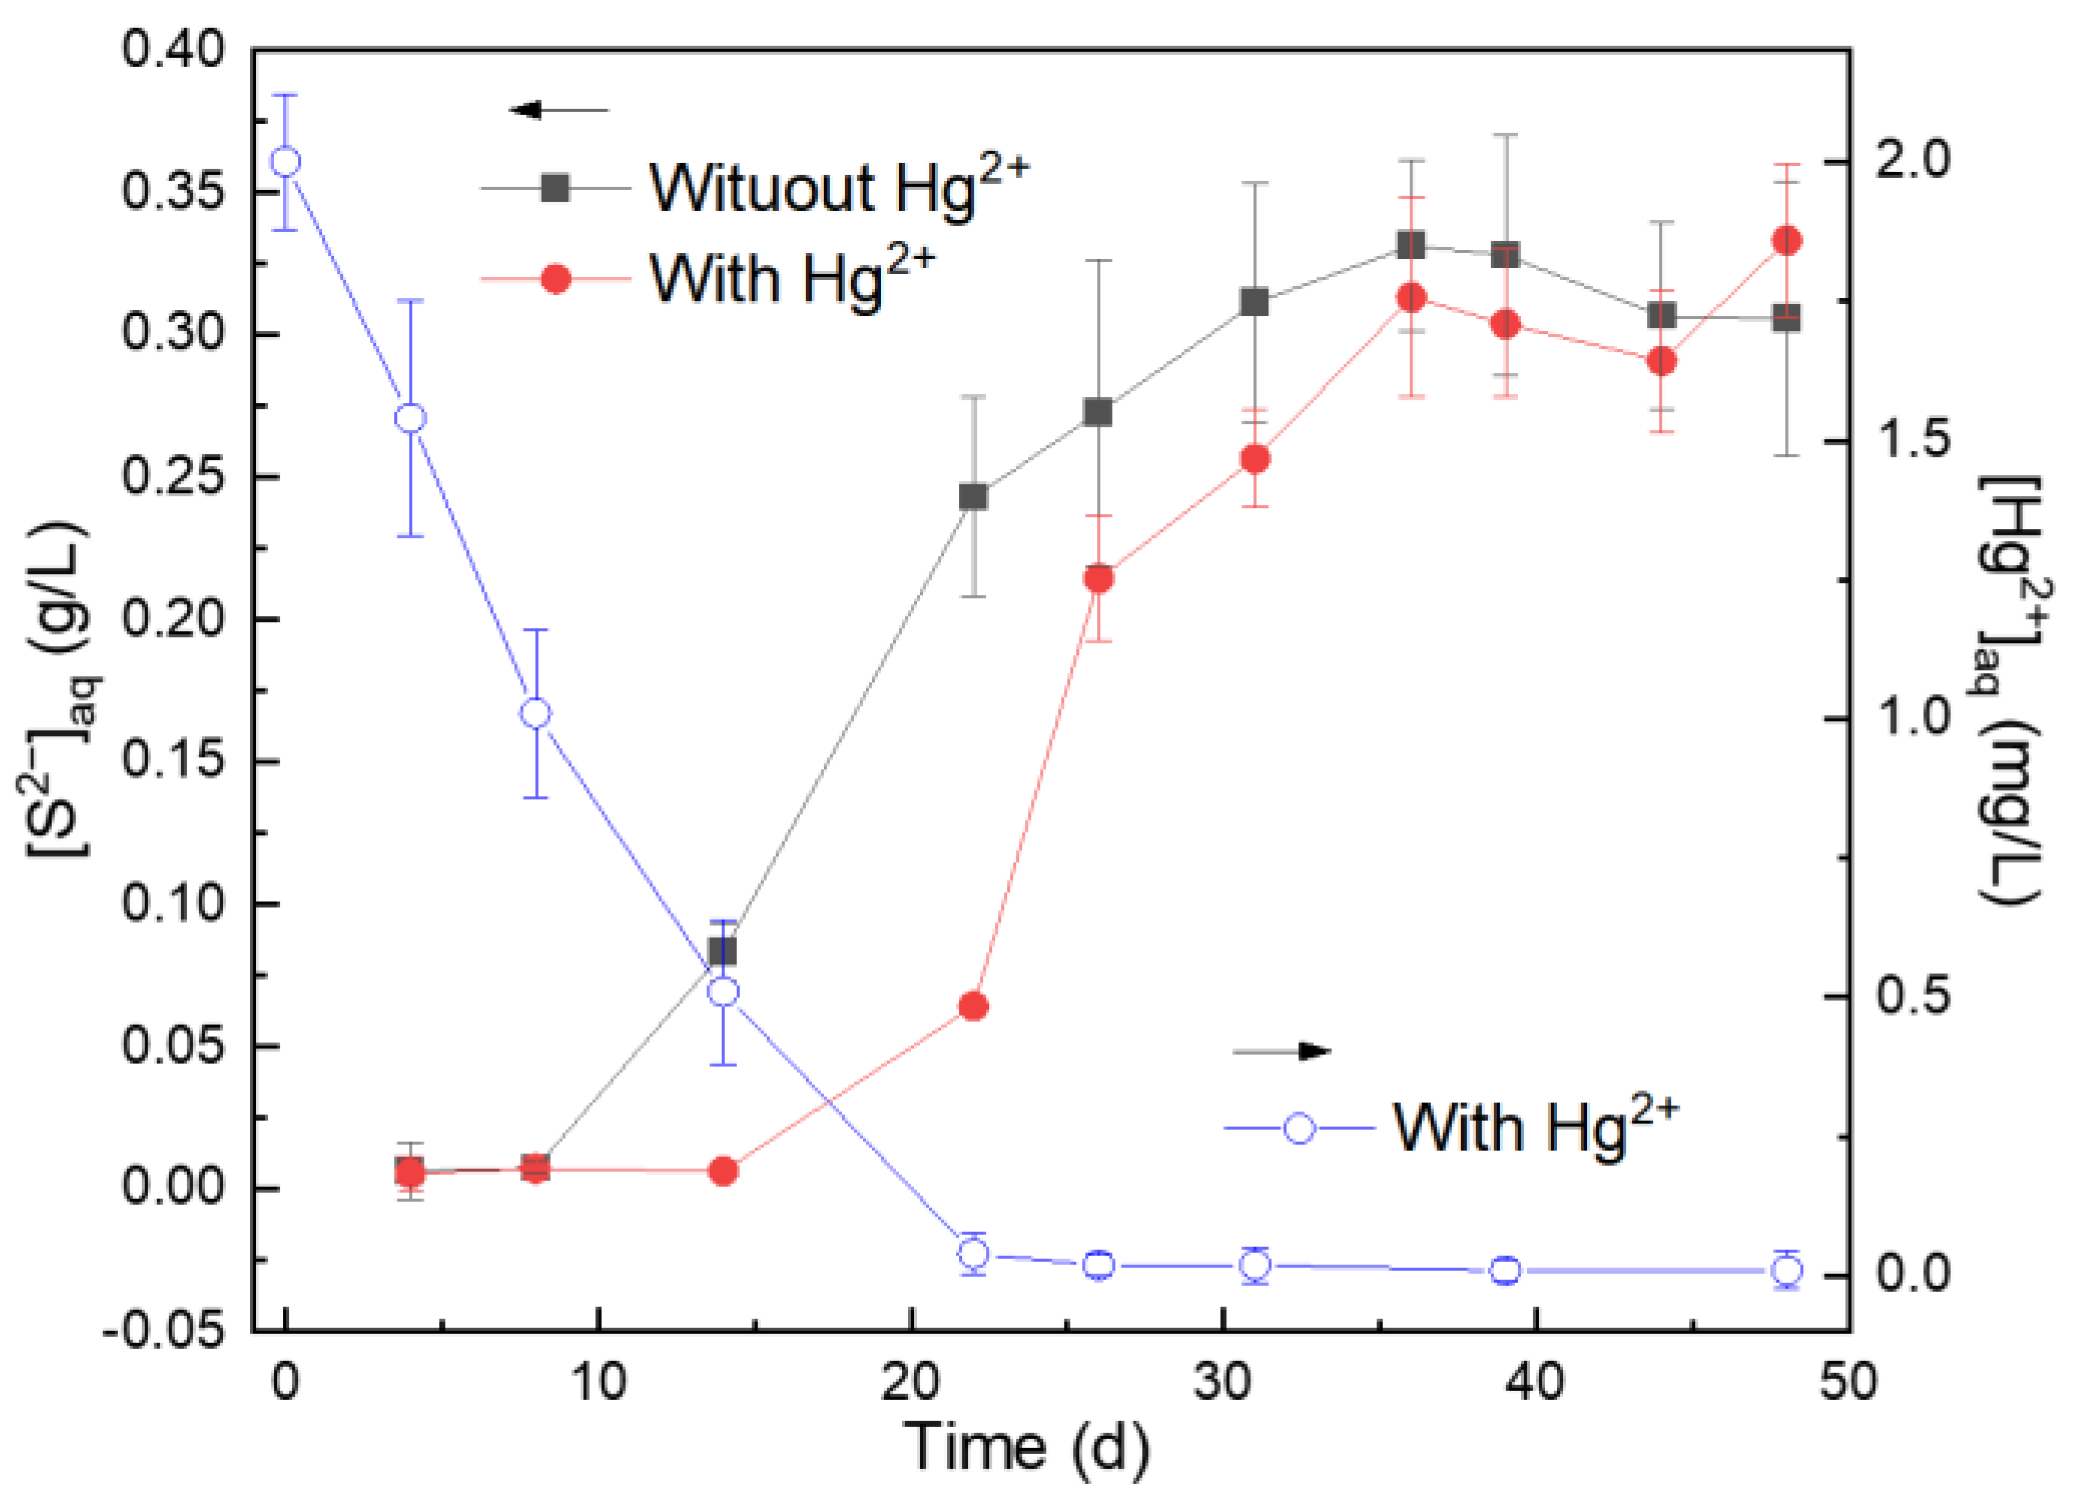
Figure 1. Changes in [S2−]aq and [Hg2+]aq in the solution during microbially anaerobic S0 reduction for the groups without and with Hg2+.
Microorganisms 11 00072 g001
Figure 2. SEM images and EDS spectra of the microbial cells on day 48 for the groups without (a) and with (b) Hg2+.
Microorganisms 11 00072 g002
Figure 3. TEM image (a) and EDS spectra (b) of the cells on day 48 for the group with Hg2+, where the black, red and blue arrows in panel (a) show the cell wall, the genetic material and the formed Hg-containing particles, respectively.
Microorganisms 11 00072 g003
Figure 4. The FT-IR spectra of AMD-enriched microbial cells at day 48 for the groups without and with Hg2+.
Microorganisms 11 00072 g004
Figure 5. SEM image and EDS spectra of the solid particulate on day 48 for the groups without (a) and with (b) Hg2+.
Microorganisms 11 00072 g005
Figure 6. FT-IR spectra of the solid particulate at day 48 for the groups without and with Hg2+.
Microorganisms 11 00072 g006
Figure 7. The C 1s (a,b), S 2p (c,d) and Hg 4f (e) XPS spectra of the solid particulate on days 14 (a), 31 (b) and 48 (c) for the groups without (a,c) and with (b,d,e) Hg2+.
Microorganisms 11 00072 g007aMicroorganisms 11 00072 g007b
Figure 8. The microbial community composition histogram at the phylum level (a) and the genus level (b) for the groups without and with Hg2+.
Microorganisms 11 00072 g008aMicroorganisms 11 00072 g008b
Disclaimer/Publisher’s Note: The statements, opinions and data contained in all publications are solely those of the individual author(s) and contributor(s) and not of MDPI and/or the editor(s). MDPI and/or the editor(s) disclaim responsibility for any injury to people or property resulting from any ideas, methods, instructions or products referred to in the content.