
Gut Microbiota Composition in Undernourished Children Associated with Diet and Sociodemographic Factors: A Case–Control Study in Indonesia

 , and
, and
Abstract
1. Introduction
2. Materials and Methods
2.1. Ethical Approval and Protocol Registry
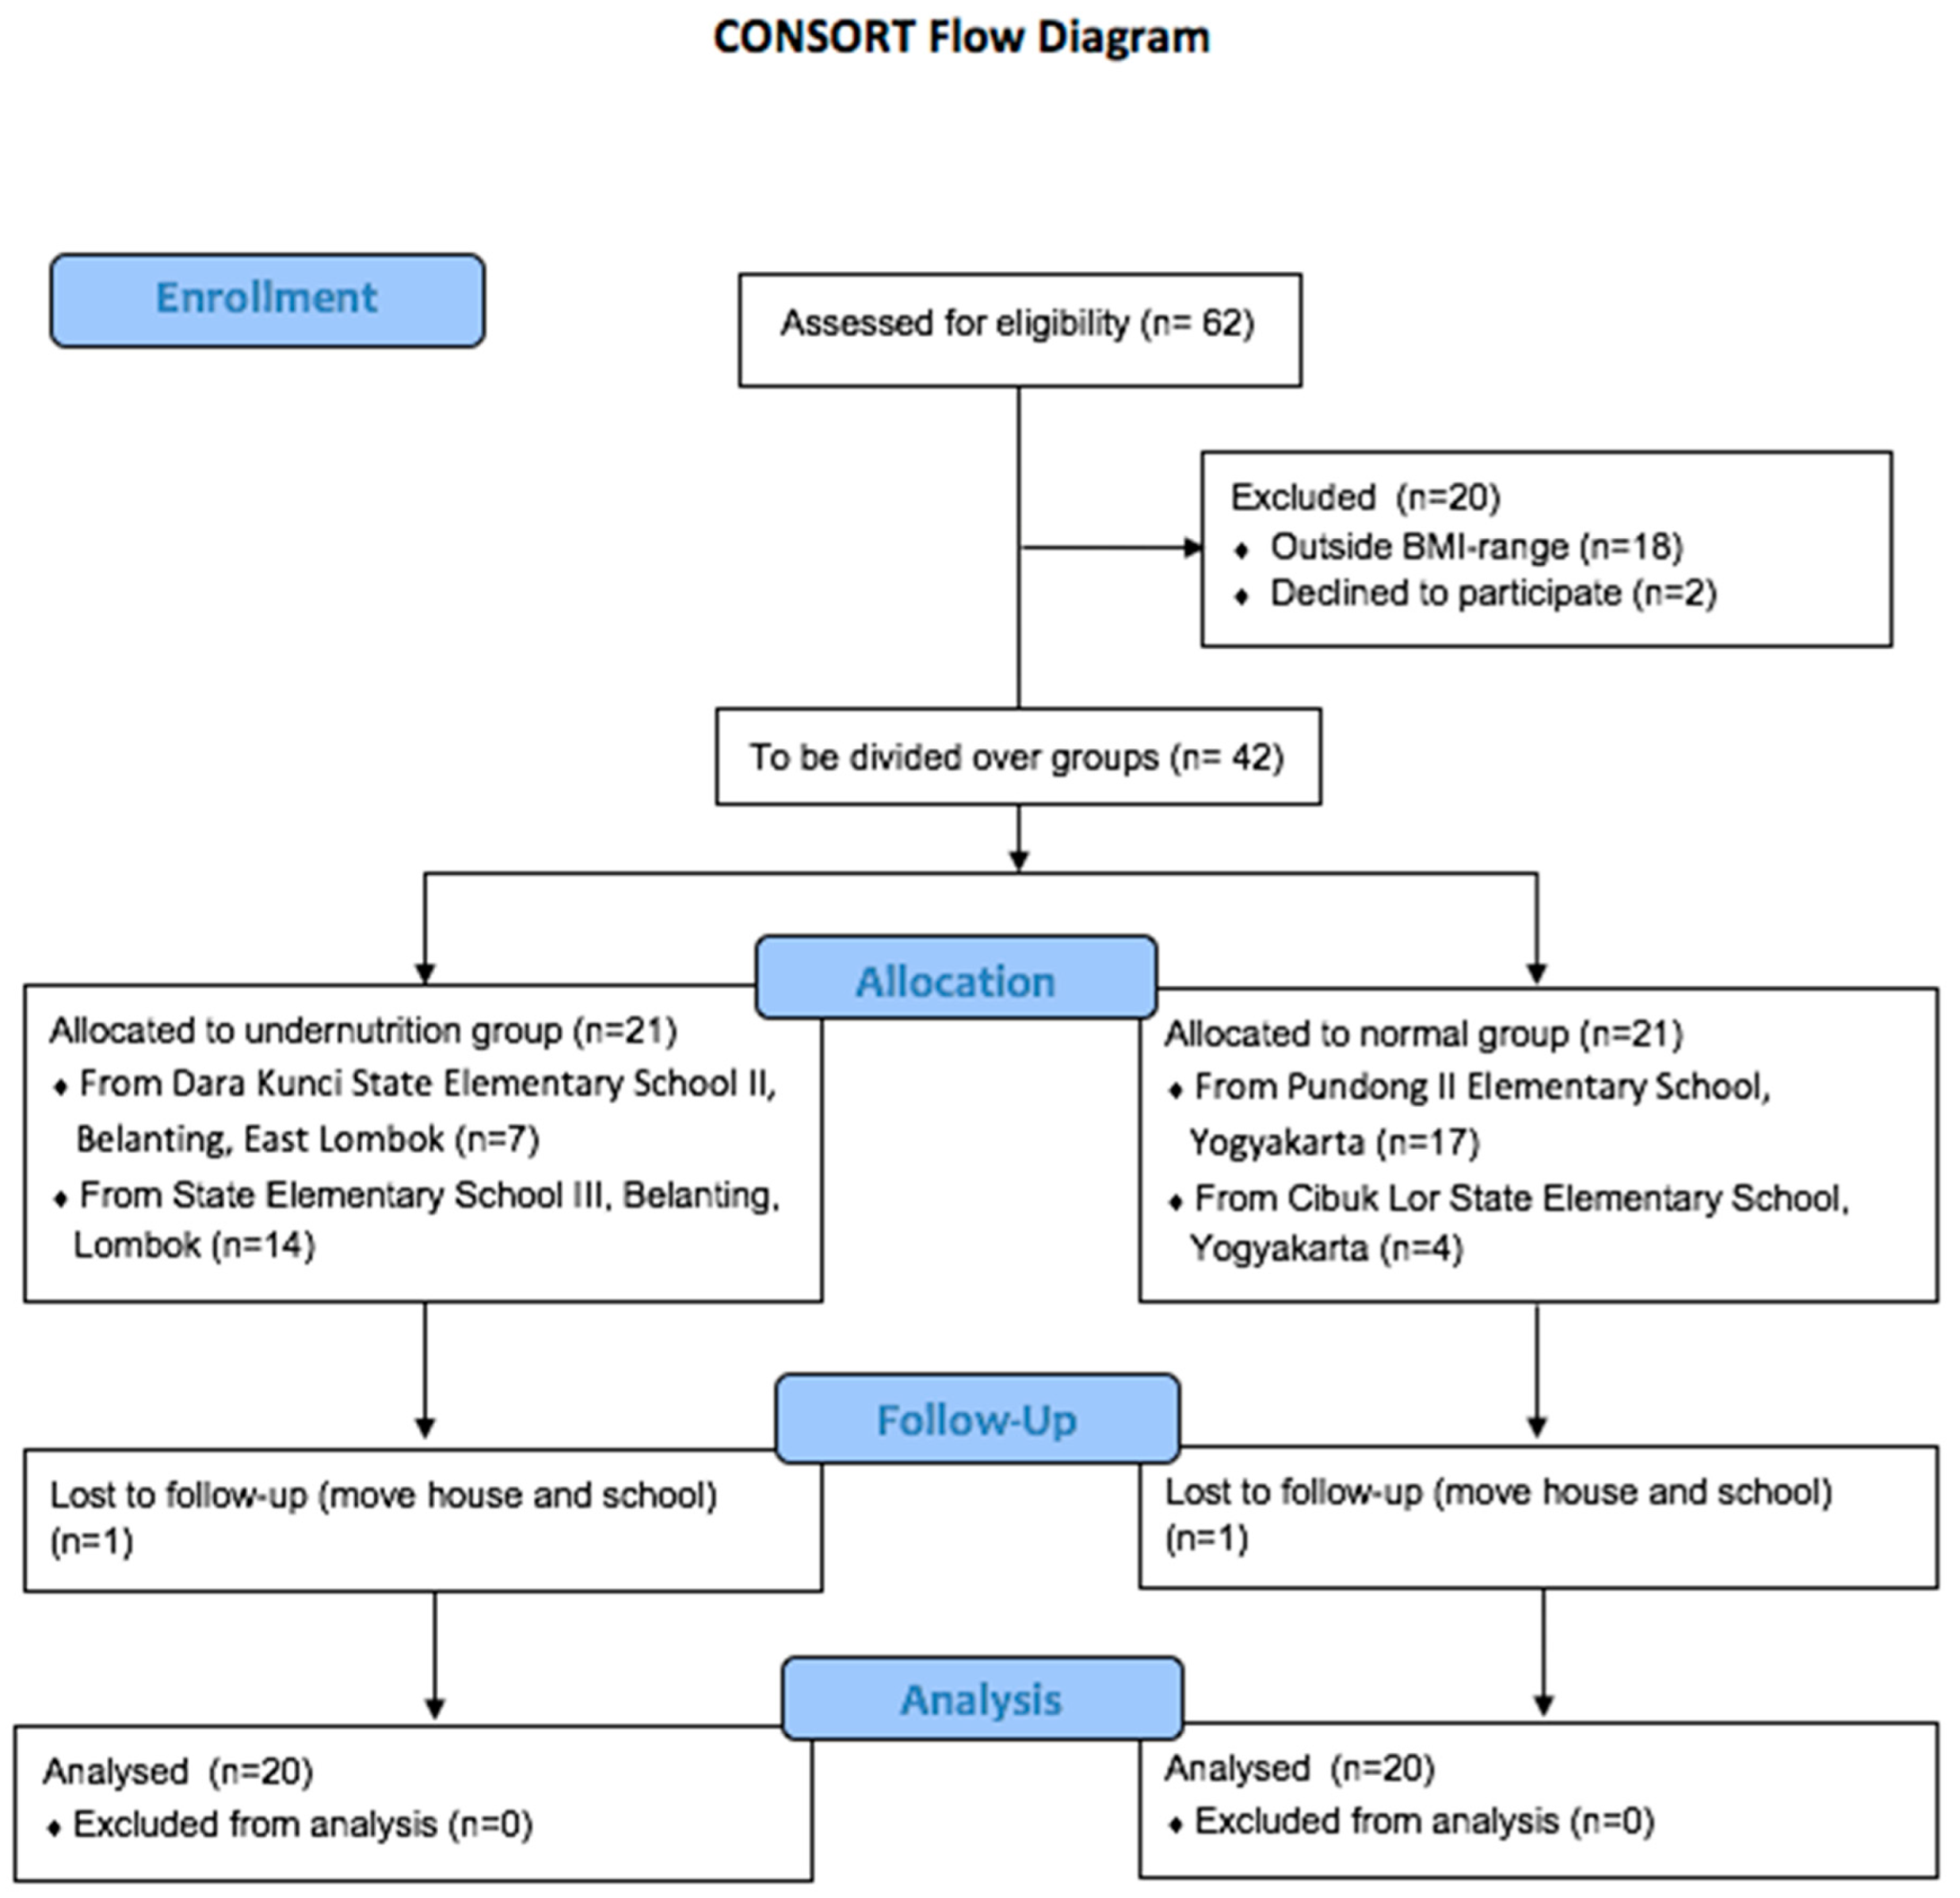
2.2. Study Design
2.3. Dietary Information
2.4. Fecal Sample Collection
2.5. DNA Extraction
2.6. 16S rRNA Gene Amplicon Sequencing
2.7. Sequencing Data Processing
2.8. Statistical Analysis
3. Results
3.1. Subject Characteristics
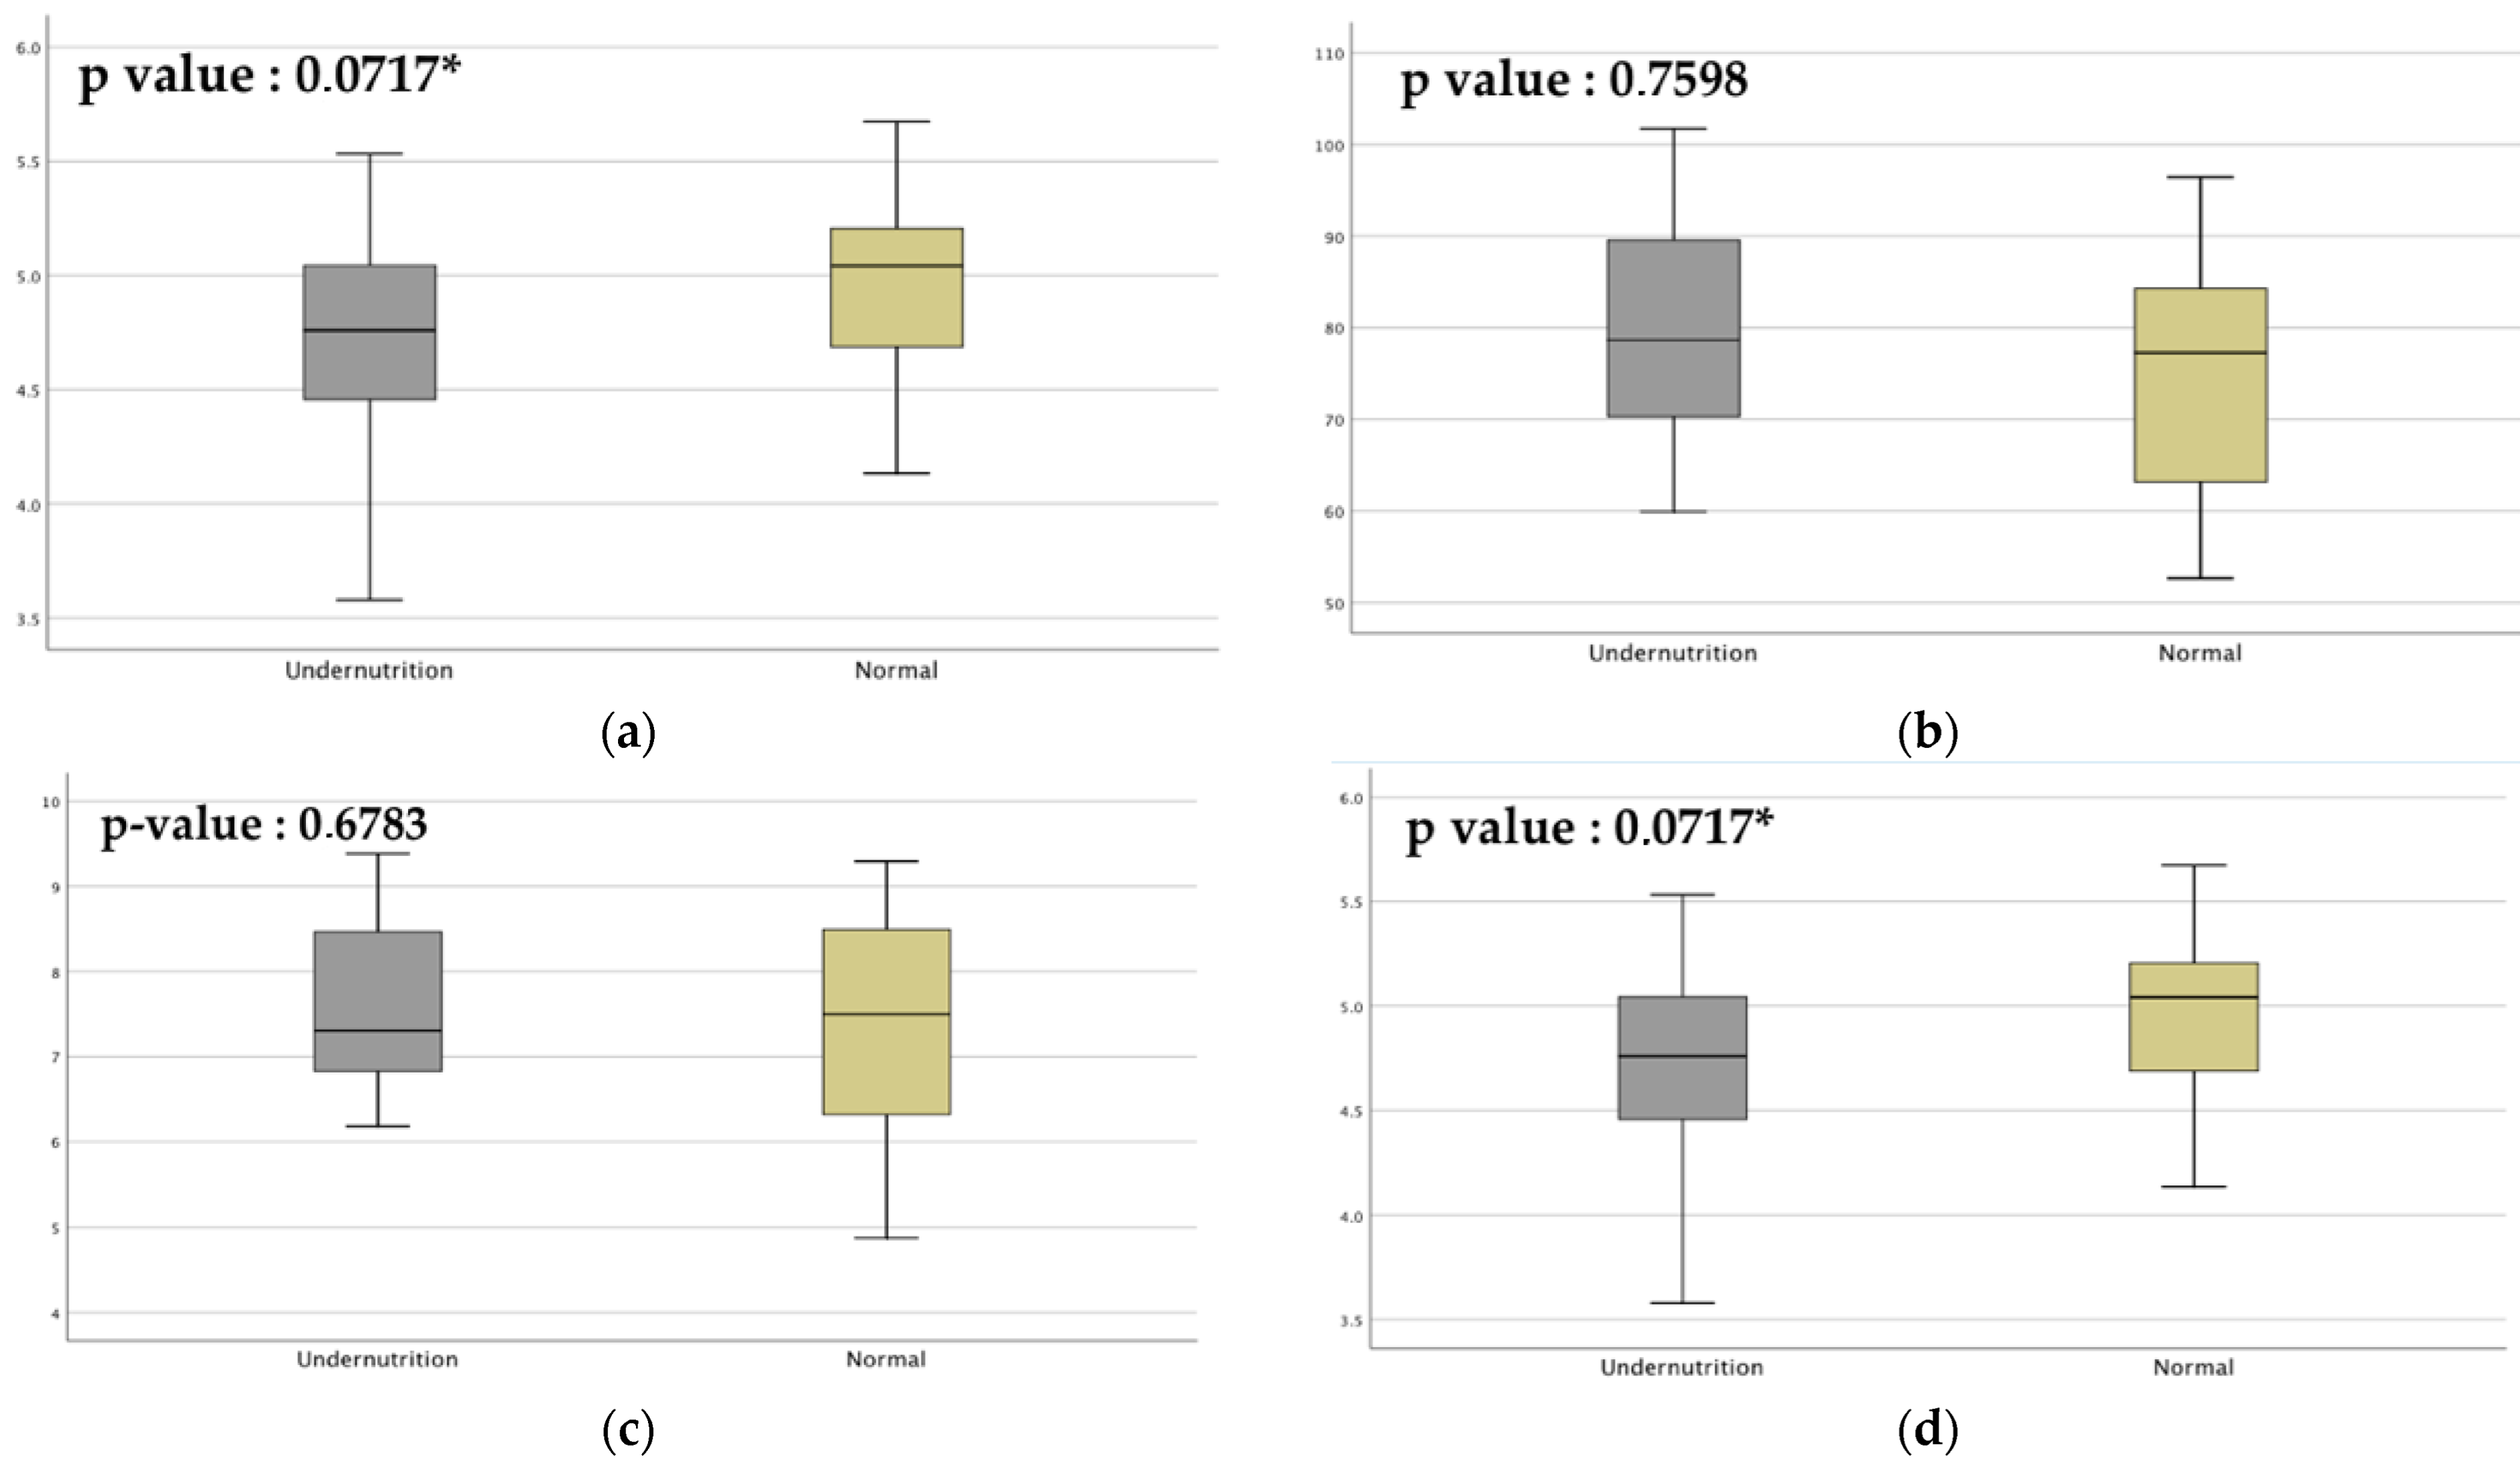
3.2. Dietary Intake Differs between Normal and Undernourished Children
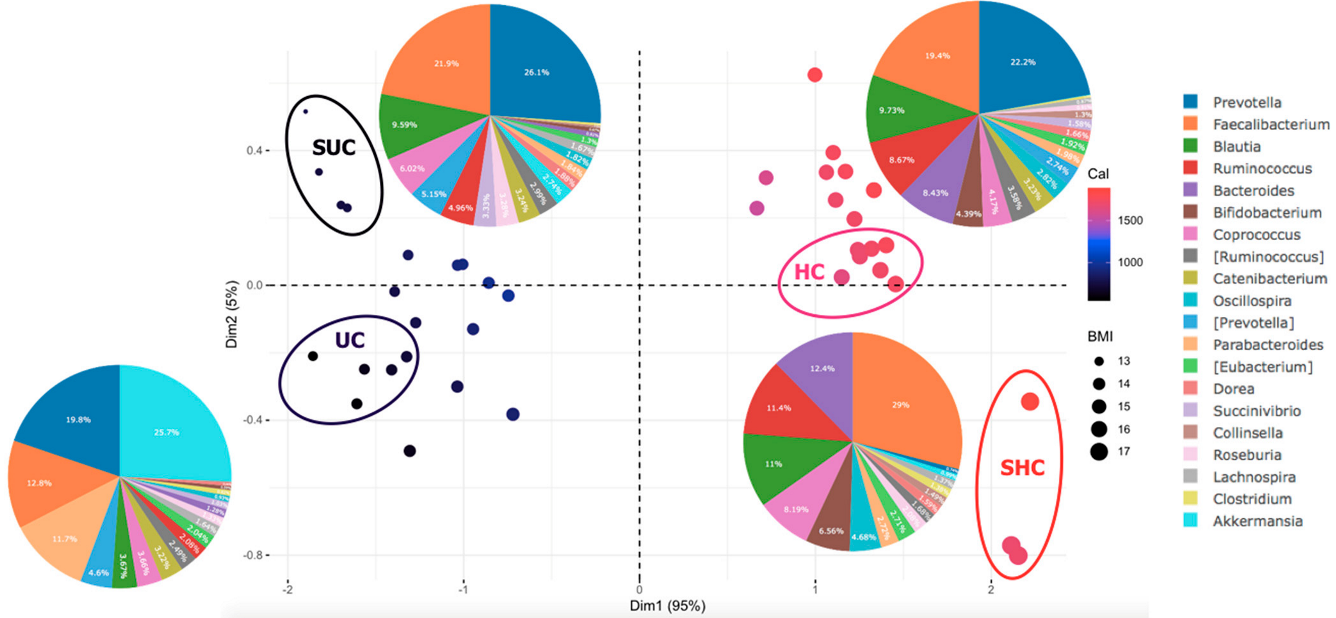
3.3. Gut Microbiota Composition Differs between Normal and Undernourished Children
3.4. Diet Affects Gut Microbiota Composition in Undernourished Children
3.5. Sociodemographic Factors Affect Gut Microbiota Composition in Undernourished Children
4. Discussion
5. Conclusions
Supplementary Materials
Author Contributions
Funding
Institutional Review Board Statement
Informed Consent Statement
Data Availability Statement
Acknowledgments
Conflicts of Interest
References
- Cederholm, T.; Barazzoni, R.; Austin, P.; Ballmer, P.; Biolo, G.; Bischoff, S.C.; Compher, C.; Correia, I.; Higashiguchi, T.; Holst, M.; et al. ESPEN Guidelines on Definitions and Terminology of Clinical Nutrition. Clin. Nutr. 2017, 36, 49–64. [Google Scholar] [CrossRef]
- Saghir Ahmad, K.Y. Malnutrition: Causes and Strategies. J. Food Process. Technol. 2015, 6, 4. [Google Scholar] [CrossRef]
- UNICEF; WHO; World Bank Group. Joint Child Malnutrition Estimates. Levels and Trends in Child Malnutrition: Key Findings Pf the 2019 Edition. 2019. Available online: https://www.unicef.org/reports/joint-child-malnutrition-estimates-levels-and-trends-child-malnutrition-2019 (accessed on 4 July 2022).
- UNICEF; WHO; World Bank Group. Joint Child Malnutrition Estimates; WHO: Geneva, Switzerland, 2021; Volume 24, pp. 51–78. [Google Scholar]
- Kementerian Kesehatan Badan Penelitian dan Kesehatan. Hasil utama riskesdas 2018. Kementrian Kesehat. RI 2018, 53, 1689–1699. [Google Scholar]
- Badan Pusat Statistik. Statistik Indonesia; Badan Pusat Statistik: Jakarta, Indonesia, 2018. [Google Scholar]
- Victora, C.G.; Christian, P.; Vidaletti, L.P.; Gatica-Domínguez, G.; Menon, P.; Black, R.E. Revisiting Maternal and Child Undernutrition in Low-Income and Middle-Income Countries: Variable Progress towards an Unfinished Agenda. Lancet 2021, 397, 1388–1399. [Google Scholar] [CrossRef]
- Hoffman, D.J.; Campos-Ponce, M.; Taddei, C.R.; Doak, C.M. Microbiome, Growth Retardation and Metabolism: Are They Related? Ann. Hum. Biol. 2017, 44, 201–207. [Google Scholar] [CrossRef]
- Kumar, M.; Ji, B.; Babaei, P.; Das, P.; Lappa, D.; Ramakrishnan, G.; Fox, T.E.; Haque, R.; Petri, W.A.; Bäckhed, F.; et al. Gut Microbiota Dysbiosis Is Associated with Malnutrition and Reduced Plasma Amino Acid Levels: Lessons from Genome-Scale Metabolic Modeling. Metab. Eng. 2018, 49, 128–142. [Google Scholar] [CrossRef]
- Carding, S.; Verbeke, K.; Vipond, D.T.; Corfe, B.M.; Owen, L.J. Dysbiosis of the Gut Microbiota in Disease. Microb. Ecol. Heal. Dis. 2015, 26, 26191. [Google Scholar] [CrossRef]
- Subramanian, S.; Huq, S.; Yatsunenko, T.; Haque, R.; Mahfuz, M.; Alam, M.A.; Benezra, A.; Destefano, J.; Meier, M.F.; Muegge, B.D.; et al. Persistent Gut Microbiota Immaturity in Malnourished Bangladeshi Children. Nature 2014, 510, 417–421. [Google Scholar] [CrossRef] [PubMed]
- Vonaesch, P.; Morien, E.; Andrianonimiadana, L.; Sanke, H.; Mbecko, J.R.; Huus, K.E.; Naharimanananirina, T.; Gondje, B.P.; Nigatoloum, S.N.; Vondo, S.S.; et al. Stunted Childhood Growth Is Associated with Decompartmentalization of the Gastrointestinal Tract and Overgrowth of Oropharyngeal Taxa. Proc. Natl. Acad. Sci. USA 2018, 115, E8489–E8498. [Google Scholar] [CrossRef]
- Gordon, J.I.; Dewey, K.G.; Mills, D.A.; Medzhitov, R.M. The Human Gut Microbiota and Undernutrition. Sci. Transl. Med. 2012, 4, 137ps12. [Google Scholar] [CrossRef]
- Thursby, E.; Juge, N. Introduction to the Human Gut Microbiota. Biochem. J. 2017, 474, 1823–1836. [Google Scholar] [CrossRef]
- Scepanovic, P.; Hodel, F.; Mondot, S.; Partula, V.; Byrd, A.; Hammer, C.; Alanio, C.; Bergstedt, J.; Patin, E.; Touvier, M.; et al. A Comprehensive Assessment of Demographic, Environmental, and Host Genetic Associations with Gut Microbiome Diversity in Healthy Individuals. Microbiome 2019, 7, 130. [Google Scholar] [CrossRef]
- Nakayama, J.; Watanabe, K.; Jiang, J.; Matsuda, K.; Chao, S.H.; Haryono, P.; La-Ongkham, O.; Sarwoko, M.A.; Sujaya, I.N.; Zhao, L.; et al. Diversity in Gut Bacterial Community of School-Age Children in Asia. Sci. Rep. 2015, 5, 8397. [Google Scholar] [CrossRef]
- De Filippis, F.; Pellegrini, N.; Vannini, L.; Jeffery, I.B.; La Storia, A.; Laghi, L.; Serrazanetti, D.I.; Di Cagno, R.; Ferrocino, I.; Lazzi, C.; et al. High-Level Adherence to a Mediterranean Diet Beneficially Impacts the Gut Microbiota and Associated Metabolome. Gut Microbiota 2016, 65, 1812–1821. [Google Scholar] [CrossRef] [PubMed]
- World Health Organization. BMI-for-Age Girls OMS 2007 (Percentiles); World Health Organization: Geneva, Switzerland, 2007. [Google Scholar]
- World Health Organization. BMI-for-Age BOYS. 5 to 19 Years (Percentiles); World Health Organization: Geneva, Switzerland, 2007. [Google Scholar]
- Nutrisurvey. Available online: http://www.nutrisurvey.de/index.html (accessed on 2 January 2022).
- Nakayama, J. Pyrosequence-Based 16S RRNA Profiling of Gastro-Intestinal Microbiota. Biosci. Microflora 2010, 29, 83–96. [Google Scholar] [CrossRef][Green Version]
- Voreades, N.; Kozil, A.; Weir, T.L. Diet and the Development of the Human Intestinal Microbiome. Front. Microbiol. 2014, 5, 494. [Google Scholar] [CrossRef] [PubMed]
- Stojanov, S.; Berlec, A.; Štrukelj, B. The Influence of Probiotics on the Firmicutes/Bacteroidetes Ratio in the Treatment of Obesity and Inflammatory Bowel Disease. Microorganisms 2020, 8, 1715. [Google Scholar] [CrossRef]
- Ze, X.; Duncan, S.H.; Louis, P.; Flint, H.J. Ruminococcus Bromii Is a Keystone Species for the Degradation of Resistant Starch in the Human Colon. ISME J. 2012, 6, 1535–1543. [Google Scholar] [CrossRef]
- Beam, A.; Clinger, E.; Hao, L. Effect of Diet and Dietary Components on the Composition of the Gut Microbiota. Nutrients 2021, 13, 2795. [Google Scholar] [CrossRef]
- Hapsari, L.; Lestari, D.A. Fruit Characteristic and Nutrient Values of Four Indonesian Banana Cultivars (Musa Spp.) at Different Genomic Groups. Agrivita 2016, 38, 303–311. [Google Scholar] [CrossRef][Green Version]
- Indrasari, S.D.; Kristamtini, K.; Wiranti, E.W. Vitamin C and Total Sugar Content Characterization on 31 Accessions of Banana Collection of Banana Germplasm Plants of Yogyakarta. Biol. Med. Nat. Prod. Chem. 2017, 6, 53. [Google Scholar] [CrossRef]
- Rahman, A. Health Benefits, Chemistry and Mechanism of Carica Papaya a Crowning Glory. Adv. Nat. Sci. 2013, 6, 26. [Google Scholar] [CrossRef]
- Monira, S.; Nakamura, S.; Gotoh, K.; Izutsu, K.; Watanabe, H.; Alam, N.H.; Endtz, H.P.; Cravioto, A.; Ali, S.I.; Nakaya, T.; et al. Gut Microbiota of Healthy and Malnourished Children in Bangladesh. Front. Microbiol. 2011, 2, 228. [Google Scholar] [CrossRef] [PubMed]
- Pham, T.P.T.; Tidjani Alou, M.; Bachar, D.; Levasseur, A.; Brah, S.; Alhousseini, D.; Sokhna, C.; Diallo, A.; Wieringa, F.; Million, M.; et al. Gut Microbiota Alteration Is Characterized by a Proteobacteria and Fusobacteria Bloom in Kwashiorkor and a Bacteroidetes Paucity in Marasmus. Sci. Rep. 2019, 9, 9084. [Google Scholar] [CrossRef] [PubMed]
- Méndez-Salazar, E.O.; Ortiz-López, M.G.; Granados-Silvestre, M.D.L.Á.; Palacios-González, B.; Menjivar, M. Altered Gut Microbiota and Compositional Changes in Firmicutes and Proteobacteria in Mexican Undernourished and Obese Children. Front. Microbiol. 2018, 9, 2494. [Google Scholar] [CrossRef]
- Abenavoli, L.; Scarpellini, E.; Colica, C.; Boccuto, L.; Salehi, B.; Sharifi-Rad, J.; Aiello, V.; Romano, B.; De Lorenzo, A.; Izzo, A.A.; et al. Gut Microbiota and Obesity: A Role for Probiotics. Nutrients 2019, 11, 2690. [Google Scholar] [CrossRef]
- Shen, Z.-H.; Zhu, C.-X.; Quan, Y.-S.; Yang, Z.-Y.; Wu, S.; Luo, W.-W.; Tan, B.; Wang, X.-Y. Relationship between Intestinal Microbiota and Ulcerative Colitis: Mechanisms and Clinical Application of Probiotics and Fecal Microbiota Transplantation. World J. Gastroenterol. 2011, 6124, 5–14. [Google Scholar] [CrossRef]
- Preidis, G.A.; Ajami, N.J.; Wong, M.C.; Bessard, B.C.; Conner, M.E.; Petrosino, J.F. Composition and Function of the Undernourished Neonatal Mouse Intestinal Microbiome. J. Nutr. Biochem. 2015, 26, 1050–1057. [Google Scholar] [CrossRef]
- Hoffmann, C.; Dollive, S.; Grunberg, S.; Chen, J.; Li, H.; Wu, G.D.; Lewis, J.D.; Bushman, F.D. Archaea and Fungi of the Human Gut Microbiome: Correlations with Diet and Bacterial Residents. PLoS ONE 2013, 8, e66019. [Google Scholar] [CrossRef]
- Franco-De-Moraes, A.C.; De Almeida-Pititto, B.; Da Rocha Fernandes, G.; Gomes, E.P.; Da Costa Pereira, A.; Ferreira, S.R.G. Worse Inflammatory Profile in Omnivores than in Vegetarians Associates with the Gut Microbiota Composition. Diabetol. Metab. Syndr. 2017, 9, 62. [Google Scholar] [CrossRef]
- Xu, W.; Larbi, A. Markers of T Cell Senescence in Humans. Int. J. Mol. Sci. 2017, 18, 1742. [Google Scholar] [CrossRef] [PubMed]
- Belzer, C.; De Vos, W.M. Microbes Insidefrom Diversity to Function: The Case of Akkermansia. ISME J. 2012, 6, 1449–1458. [Google Scholar] [CrossRef]
- Cani, P.D.; de Vos, W.M. Next-Generation Beneficial Microbes: The Case of Akkermansia Muciniphila. Front. Microbiol. 2017, 8, 1765. [Google Scholar] [CrossRef] [PubMed]
- Plovier, H.; Everard, A.; Druart, C.; Depommier, C.; Van Hul, M.; Geurts, L.; Chilloux, J.; Ottman, N.; Duparc, T.; Lichtenstein, L.; et al. A Purified Membrane Protein from Akkermansia Muciniphila or the Pasteurized Bacterium Improves Metabolism in Obese and Diabetic Mice. Nat. Med. 2017, 23, 107–113. [Google Scholar] [CrossRef] [PubMed]
- Everard, A.; Belzer, C.; Geurts, L.; Ouwerkerk, J.P.; Druart, C.; Bindels, L.B.; Guiot, Y.; Derrien, M.; Muccioli, G.G.; Delzenne, N.M.; et al. Cross-Talk between Akkermansia Muciniphila and Intestinal Epithelium Controls Diet-Induced Obesity. Proc. Natl. Acad. Sci. USA 2013, 110, 9066–9071. [Google Scholar] [CrossRef]
- Lakshmanan, A.P.; Kohil, A.; El Assadi, F.; Al Zaidan, S.; Al Abduljabbar, S.; Bangarusamy, D.K.; Al Khalaf, F.; Petrovski, G.; Terranegra, A. Akkermansia, a Possible Microbial Marker for Poor Glycemic Control in Qataris Children Consuming Arabic Diet—A Pilot Study on Pediatric T1dm in Qatar. Nutrients 2021, 13, 836. [Google Scholar] [CrossRef]
- Li, J.; Lin, S.; Vanhoutte, P.M.; Woo, C.W.; Xu, A. Akkermansia Muciniphila Protects against Atherosclerosis by Preventing Metabolic Endotoxemia-Induced Inflammation in Apoe-/- Mice. Circulation 2016, 133, 2434–2446. [Google Scholar] [CrossRef]
- Ibragimova, S.; Ramachandran, R.; Ali, F.R.; Lipovich, L.; Ho, S.B. Dietary Patterns and Associated Microbiome Changes That Promote Oncogenesis. Front. Cell Dev. Biol. 2021, 9, 1–21. [Google Scholar] [CrossRef]
- Verhoog, S.; Taneri, P.E.; Díaz, Z.M.R.; Marques-Vidal, P.; Troup, J.P.; Bally, L.; Franco, O.H.; Glisic, M.; Muka, T. Dietary Factors and Modulation of Bacteria Strains of Akkermansia Muciniphila and Faecalibacterium Prausnitzii: A Systematic Review. Nutrients 2019, 11, 1565. [Google Scholar] [CrossRef]
- Igbokwe, O.; Adimorah, G.; Ikefuna, A.; Ibeziako, N.; Ubesie, A.; Ekeh, C.; Iloh, K. Socio-Demographic Determinants of Malnutrition among Primary School Aged Children in Enugu, Nigeria. Pan Afr. Med. J. 2017, 28, 248. [Google Scholar] [CrossRef]
- Shafqat, N.; Manzoor, S.; Abbasi, S. Relationship of Sociodemographic Factors with Malnutrition in Preschool Children: A Community Based Study. J. Med. Res. 2013, 5, 5. [Google Scholar]
- Kumera, G.; Gedle, D.; Alebel, A.; Feyera, F.; Eshetie, S. Undernutrition and Its Association with Socio-Demographic, Anemia and Intestinal Parasitic Infection among Pregnant Women Attending Antenatal Care at the University of Gondar Hospital, Northwest Ethiopia. Matern. Health Neonatol. Perinatol. 2018, 4, 18. [Google Scholar] [CrossRef] [PubMed]
- Nagpal, R.; Mainali, R.; Ahmadi, S.; Wang, S.; Singh, R.; Kavanagh, K.; Kitzman, D.W.; Kushugulova, A.; Marotta, F.; Yadav, H. Gut Microbiome and Aging: Physiological and Mechanistic Insights. Nutr. Heal. Aging 2018, 4, 267–285. [Google Scholar] [CrossRef] [PubMed]


| Category | Normal (n = 20) | Undernutrition (n = 20) | p-Value 1 |
|---|---|---|---|
| Male | 6 (30%) | 12 (60%) | |
| Female | 14 (70%) | 8 (40%) | |
| Age (years) | 9.65 ± 0.67 | 9.99 ± 0.99 | 0.063 |
| Body weight (kg) | 27.82 ± 3.21 | 21.57 ± 2.61 | <0.001 |
| Body height (cm) | 131.69 ± 5.54 | 129.31 ± 6.38 | 0.123 |
| BMI (kg/m2) | 15.98 ± 0.73 | 12.87 ± 0.4 | 0.001 |
| Nutrient Intake | Normal | Undernourished | RDA | %RDA | p-Value 1 | |
|---|---|---|---|---|---|---|
| Normal | Undernourished | |||||
| Energy (kcal) | 1718.3 ± 74.67 | 779 ± 122.81 | 2036.3 | 84.38 ± 3.67 | 38.26 ± 6.03 | <0.001 |
| Macronutrient | ||||||
| Protein (g) | 72.64 ± 10.65 | 25.69 ± 6.21 | 60.1 | 17.3 ± 2.29 | 13.4 ± 2.76 | <0.001 |
| Fat (g) | 80.57 ± 6.8 | 23.96 ± 5.99 | 69.1 | 41.65 ± 3.79 | 27.4 ± 5.92 | <0.001 |
| Carbohydrate (g) | 173.64 ± 21.9 | 114.34 ± 23.98 | 290.7 | 41.15 ± 5.19 | 59.2 ± 7.23 | <0.001 |
| Dietary fiber (g) | 7.51 ± 1.2 | 3.59 ± 1.49 | 28 | 26.81 ± 4.29 | 12.85 ± 5.31 | <0.001 |
| PUFA (g) | 16.15 ± 2.9 | 5.79 ± 3.33 | 10 | 16.15 ± 2.9 | 57.86 ± 33.26 | <0.001 |
| Vitamin | ||||||
| Vitamin A (μg) | 1089.84 ± 429.04 | 279.96 ± 129.92 | 900 | 121.09 ± 47.67 | 31.11 ± 14.44 | <0.001 |
| Vitamin E (mg) | 4.22 ± 1.13 | 2.07 ± 0.96 | 11 | 38.4 ± 10.30 | 18.80 ± 8.74 | <0.001 |
| Vitamin B1 (mg) | 0.53 ± 0.09 | 0.23 ± 0.08 | 1 | 53.5 ± 5.19 | 23.2 ± 7.75 | <0.001 |
| Vitamin B2 (mg) | 1.03 ± 0.25 | 0.35 ± 0.13 | 1.2 | 86.13 ± 21.05 | 28.79 ± 10.8 | <0.001 |
| Vitamin B6 (mg) | 1.05 ± 0.15 | 0.45 ± 0.13 | 1 | 105.15 ± 14.63 | 45 ± 13.07 | <0.001 |
| Vitamin C (mg) | 19.29 ± 9.54 | 21.09 ± 19.43 | 90 | 21.44 ± 10.60 | 23.44 ± 21.59 | 0.725 |
| Folic acid (μg) | 116.06 ± 24.51 | 63.45 ± 34.54 | 400 | 29.02 ± 6.13 | 15.86 ± 8.64 | <0.001 |
| Mineral | ||||||
| Sodium (mg) | 761.49 ± 269.16 | 337.98 ± 470.85 | 2000 | 38.07 ± 13.46 | 16.90 ± 23.54 | <0.001 |
| Potassium (mg) | 1227.32 ± 234.58 | 530.59 ± 158.89 | 2000 | 61.37 ± 11.73 | 26.53 ± 7.94 | <0.001 |
| Calcium (mg) | 334.45 ± 140.37 | 211.94 ± 100.56 | 1100 | 30.4 ± 12.76 | 19.27 ± 9.14 | 0.001 |
| Magnesium (mg) | 175.65 ± 23.39 | 102.73 ± 32.44 | 250 | 70.26 ± 9.38 | 41.09 ± 12.97 | <0.001 |
| Phosphorus (mg) | 844.21 ± 127.38 | 358.76 ± 90.99 | 1250 | 67.54 ± 10.19 | 28.7 ± 7.28 | <0.001 |
| Iron (mg) | 7.31 ± 2.35 | 3.26 ± 0.96 | 15 | 48.73 ± 15.66 | 21.7 ± 6.37 | <0.001 |
| Zinc (mg) | 8.04 ± 1.29 | 3.56 ± 0.65 | 7 | 114.82 ± 18.47 | 50.87 ± 9.35 | <0.001 |
| Phylum | Relative Abundance | p Value 1 | |
|---|---|---|---|
| Normal | Undernourished | ||
| Firmicutes | 65.76 ± 9.94 | 62.18 ± 12.03 | 0.044 |
| Bacteroidetes | 29.97 ± 8.05 | 23.47 ± 7.89 | 0.014 |
| Actinobacteria | 4.84 ± 4.30 | 0.85 ± 0.32 | <0.001 |
| Proteobacteria | 1.96 ± 4.29 | 2.56 ± 2.49 | <0.001 |
| Verrucomicrobia | 0.18 ± 0.41 | 13.46 ± 12.52 | 0.007 |
| Fusobacteria | 0.12 ± 0.38 | 0.10 ± 0.29 | 0.779 |
| Phylum | Genus | Relative Abundance | p-Value 1 | |
|---|---|---|---|---|
| Normal | Undernourished | |||
| Firmicutes | Caprococus | 3.83 ± 1.83 | 3.23 ± 1.83 | 0.265 |
| Ruminococcus | 5.09 ± 3.14 | 2.28 ± 1.50 | 0.002 | |
| Roseburia | 1.01 ± 0.85 | 1.52 ± 1.61 | 0.201 | |
| Clostridium | 0.28 ± 0.33 | 0.34 ± 0.43 | 0.904 | |
| Blautia | 5.67 ± 1.95 | 4.77 ± 3.01 | 0.142 | |
| Faecalibacterium | 12.65 ± 4.41 | 9.60 ± 5.00 | 0.086 | |
| Lachnospira | 0.63 ± 0.47 | 0.92 ± 0.97 | 0.583 | |
| Bacteroidetes | Prevotella | 15.36 ± 14.28 | 13.45 ± 9.34 | 0.841 |
| Bacteroides | 4.30 ± 3.93 | 0.72 ± 0.38 | <0.001 | |
| Actinobacteria | Bifidobacterium | 3.26 ± 2.9 | 0.35 ± 0.30 | <0.001 |
| Collinsella | 0.82 ± 0.43 | 0.23 ± 0.13 | <0.001 | |
| Proteobacteria | Succinivibrio | 1.60 ± 3.94 | 1.93 ± 2.38 | 0.004 |
| Verrucomicrobia | Akkermansia | 0.15 ± 0.37 | 12.56 ± 12.35 | 0.002 |
| Fusobacteria | Fusobacterium | 0.10 ± 0.35 | 0.09 ± 0.27 | 0.883 |
| Gender | BMI | Age | Parents‘ Education | Income | Medical Record | Sanitation | Parents‘ Occupation | Parents‘ Knowledge | Exclusive Breastfeeding | Actinobacteria | Bacteroidetes | Firmicutes | Proteobacteria | Prevotella | |
|---|---|---|---|---|---|---|---|---|---|---|---|---|---|---|---|
| BMI | 0.34 | ||||||||||||||
| Age | 0.30 | 0.11 | |||||||||||||
| Parents‘ education | −0.26 | 0.09 a | −0.25 | ||||||||||||
| Income | 0.22 | 0.36 | −0.04 a | 0.41 | |||||||||||
| Medical record | 0.08 a | −0.02 a | −0.05 a | 0.23 | 0.17 | ||||||||||
| Sanitation | −0.15 | 0.13 | −0.40 | 0.48 | 0.32 | 0.21 | |||||||||
| Parents‘ occupation | 0.13 | 0.34 | −0.07 | 0.30 | 0.76 | 0.16 | 0.33 | ||||||||
| Parents‘ knowledge | 0.11 | 0.01 a | 0.16 | 0.45 | 0.30 | 0.09 a | 0.42 | 0.20 | |||||||
| Exclusive breastfeeding | −0.18 | 0.08 a | −0.01 a | −0.08 a | −0.04 a | −0.04 a | −0.04 a | 0.01 a | −0.12 | ||||||
| Actinobacteria | −0.21 | 0.50 | −0.20 | 0.33 | 0.13 | 0.12 | 0.39 | 0.26 | 0.33 | −0.25 | |||||
| Bacteroidetes | 0.54 | −0.21 | −0.13 | 0.07 | −0.10 | 0.13 | −0.02 a | −0.15 | −0.02 a | −0.14 | −0.08 a | ||||
| Firmicutes | −0.44 | 0.46 | 0.02 a | 0.26 | 0.15 | 0.02 a | 0.37 | 0.26 | 0.17 | 0.29 | 0.17 | −0.59 | |||
| Proteobacteria | −0.06 a | −0.18 | 0.21 | −0.13 | −0.07 a | 0.18 | −0.17 | 0.12 | −0.06 | −0.22 | −0.27 | −0.24 | −0.02 a | ||
| Prevotella | 0.43 | −0.13 | 0.18 | 0.12 | −0.11 | 0.20 | 0.08 a | −0.11 | 0.00 a | −0.11 | −0.03 a | 0.93 | −0.38 | −0.13 | |
| Bacteroides | −0.38 | 0.62 | −0.06 a | 0.41 | 0.16 | −0.15 | 0.43 | 0.16 | 0.35 | −0.07 a | 0.45 | −0.32 | −0.5 | −0.33 | −0.39 |
Publisher’s Note: MDPI stays neutral with regard to jurisdictional claims in published maps and institutional affiliations. |
© 2022 by the authors. Licensee MDPI, Basel, Switzerland. This article is an open access article distributed under the terms and conditions of the Creative Commons Attribution (CC BY) license (https://creativecommons.org/licenses/by/4.0/).
Share and Cite
Gatya, M.; Fibri, D.L.N.; Utami, T.; Suroto, D.A.; Rahayu, E.S. Gut Microbiota Composition in Undernourished Children Associated with Diet and Sociodemographic Factors: A Case–Control Study in Indonesia. Microorganisms 2022, 10, 1748. https://doi.org/10.3390/microorganisms10091748
Gatya M, Fibri DLN, Utami T, Suroto DA, Rahayu ES. Gut Microbiota Composition in Undernourished Children Associated with Diet and Sociodemographic Factors: A Case–Control Study in Indonesia. Microorganisms. 2022; 10(9):1748. https://doi.org/10.3390/microorganisms10091748
Chicago/Turabian StyleGatya, Mifta, Dwi Larasatie Nur Fibri, Tyas Utami, Dian Anggraini Suroto, and Endang Sutriswati Rahayu. 2022. "Gut Microbiota Composition in Undernourished Children Associated with Diet and Sociodemographic Factors: A Case–Control Study in Indonesia" Microorganisms 10, no. 9: 1748. https://doi.org/10.3390/microorganisms10091748
APA StyleGatya, M., Fibri, D. L. N., Utami, T., Suroto, D. A., & Rahayu, E. S. (2022). Gut Microbiota Composition in Undernourished Children Associated with Diet and Sociodemographic Factors: A Case–Control Study in Indonesia. Microorganisms, 10(9), 1748. https://doi.org/10.3390/microorganisms10091748