1. Introduction
Cheddar cheese forms a significant proportion of the international cheese trade and is produced in many countries today, mostly from cow milk but also using milk from other species such as buffalo. Cheddar cheese production in Canada has risen by 27% over the past 15 years, from 132,000 metric tons in 2005 to 168,067 metric tons in 2021 [
1], of which 30% was produced in facilities located in the province of Ontario. This increased production poses a challenge to accurately match the cheese characteristics to consumer preferences and demand, while avoiding economic losses due to cheese defects.
Cheddar can be described as a semi-hard to hard rennet-coagulated cow’s milk cheese that is classified according to ripening indices (from 2–4 months to 6 years) from internal bacterial ripening. Although the name comes from the origin of the cheese in the village of Cheddar (England), the term has become associated with the specific process of “cheddaring”. In the traditional manner, cheddaring involves cutting drained matted and heated curds into slabs which would be stacked, doubled over and re-stacked to express whey out of the cheese [
2]. This practice would ensure adequate acid development and keep heat within the curd. In current industrial facilities, the curd is piled in automated systems based on a tower or on a conveyor belt. After acidity development, the curd is milled and dry-salted, which halts the starter acidification activity. Curds are then pressed into blocks and ripened at 4–8 °C for a range of 4 months to over 2 years, depending on the characteristics desired. Thus, the difficulty in manufacturing Cheddar cheese lies in the long ripening period to achieve mature flavor, which can deviate by the formation of off-flavors and textural defects such as slits leading to lower quality cheese [
2]. Cheddar has a smooth texture when young, evolving to a slightly crumbly texture and sharp taste when ripened for longer periods.
Much research has been invested in defining the culturable microbiota of Cheddar cheese, and more recently to test the ability of bacterial species to cause defects such as discoloration [
3], off-flavors, or slit openings [
4]. However, without extensive collection of isolates from multiple types of media or experimental introduction of specific species, mainly the dominant species are revealed. These can be categorized into three groups: the starter lactic acid bacteria (SLAB), adjunct lactic acid bacteria (ALAB), and non-starter lactic acid bacteria (NSLAB).
The SLAB are lactose fermenting strains of
Lactococcus lactis, producing lactic acid from lactose [
5,
6], thus contributing to cheese texture through curd acidification [
5]. The second group composed of the ALAB acts as ripening aids that may be added to the milk before coagulation. The third group consisting of the NSLAB [
7,
8] are predominantly comprised of lactobacilli, pediococci, enterococci, and leuconostoc [
6]. Proteolysis by both SLAB and NSLAB contribute to developing the texture and flavor of maturing Cheddar [
9]. Both SLAB and NSLAB provide peptidase enzymes responsible for converting peptides to amino acids. During ripening, starter lactococci can further breakdown amino acids into flavor compounds [
10]. Although lactococci and lactobacilli have shown weak lipolytic activity, both SLAB and NSLAB can contribute to developing free fatty acids in Cheddar cheese (as reviewed by Collins et al. [
11]).
The limitations of culture-dependent methods when applied to profiling the succession of bacteria in cheese include the underestimation of the number of species, with the advantage of providing data on the viable population of microbes, depending on the type of media used, which may be more or less specific [
12]. According to the standard Cheddar cheese ripening model from culture-dependent methods, the initially dominant starter lactococci are gradually superseded by lactobacilli, either from naturally present adventitious bacteria, or from intentionally added adjunct cultures [
13]. Other studies have shown that some lactococci can survive much longer than previously thought [
14]. Flow cytometry has revealed that lactococci progress from a viable reproducing state to permeable non-reproducing cells, while autolytic strains will lyse, consequently freeing their cell contents into the cheese environment [
15]. Thus, the rate of decline of lactococci depends on the autolytic capacity of the mixture of starter strains used, along with their tolerance to the cooking temperature, salt concentration, and pH developed in the cheese.
Culture-independent techniques were essentially developed to address the limitations of culture media, expanding the characterization of microbial biodiversity while defining the dynamics of SLAB and NSLAB microbiota in cheese during ripening as well as investigating the effects of heat treatment of the milk, spatial location, climate and seasonal effects [
16]. Metagenetics uses an amplicon-based high throughput sequencing approach, which target genes of taxonomic significance that have been used to study the microbial communities of starters and dairy products [
17,
18,
19]. The standard 16S rRNA gene amplicon sequencing method (metabarcoding) does not discriminate between viable and dead bacteria, as it is based on DNA extraction from all cells, whether dead or viable. In comparing Cheddar cheese of increasing age from mild (up to 6 months) to vintage (up to 32 months), Ashfari et al. [
20] revealed that three brands of cheese did not show the same changes in the microbiota composition over time when analyzed using 16S rRNA gene sequencing. While
Lactococcus DNA dominated throughout ripening for Brand A,
Lactobacillus DNA became predominant by 18 months (Extra tasty grade) for Brand C. Brand B showed a completely different profile with
Streptococcus DNA dominating up to 18 months, then
Lactococcus dominating the Vintage cheese at 32 months (very little
Lactobacillus). Long-ripened Cheddar cheese may thus contain a highly variable accumulation of
Lactobacillus among brands, which would differentiate the flavor profile of the respective products. Better knowledge of the effect of these changes on the finished product profile will help the cheese industry to design the optimal ripening time and community composition to target specific consumer niches and reduce waste.
Analyzing total DNA is helpful in monitoring the bacterial history of the cheese, but it does not permit discrimination between viable and dead or non-growing microorganisms. This distinction will help to predict the microbes contributing to metabolic activity during later ripening stages. Propidium monoazide (PMA) can be used for the amplification of the viable bacteria in cheese. PMA is a DNA-intercalating dye that can bind free DNA or diffuse into cells with compromised membranes. Once inside the cells, PMA intercalates into the DNA and can be covalently cross-linked by exposure to light, which then strongly inhibits PCR amplification of DNA from these permeable cells [
21]. Therefore, treatment of the cells with PMA before DNA extraction hinders the subsequent amplification of the DNA by PCR, which provides a profile of the presumably viable bacteria with intact cell membranes [
17]. A reduction in PMA-treated DNA compared to total DNA would mean more permeable cells in a sample and a lower number of intact viable cells. Even though membrane integrity is not proof for cell activity, identifying the intact cells would be a step forward in a more comprehensive view of the total bacterial community. This method has been validated for a number of bacterial species, including
Lactococcus lactis [
17] and
Lactobacillus [
22,
23] both in pure culture and in a cheese matrix [
4].
Erkus et al. [
17] used the whole genome sequencing approach to monitor the microbial viability of both the undefined starter cultures and microbial communities during Gouda cheese ripening. They were able to quantify the relative abundance of seven genetic lineages of
L. lactis as well as one lineage of
Leuconostoc mesenteroides subsp.
cremoris from lineage-specific biomarker sequences in complex starter cultures and cheese. They found that PMA treatment was not a limitation to sequencing and its use was able to provide selective profiling for viable populations in a Gouda cheese microbial community. The relative contribution of specific genetic lineages was shown to differ between PMA-treated and non-PMA-treated samples, suggesting that some lineages remained viable longer than others in Gouda cheese [
17]. Similarly, O’Sullivan et al. [
24] studied the microbial communities of continental-type cheese using 16S rRNA gene amplicon sequencing, revealing spatial (rind vs core) and temporal variations (early versus late production day manufacturing) in population composition, as well as the influence of abiotic factors. Core microbiota were more diverse than the rind up to 64 days of ripening, with salt tolerant microbes, then aerobic and aerotolerant genera prevalent on the rind. In the core,
Clostridium increased over ripening to attain around 3% relative abundance, although no defects associated with gas production were noted in this case.
Using PMA 16S rRNA gene amplicon sequencing, Xue et al. [
4] showed that up to 4 months of ripening; viable nonstarter bacteria were predominantly
Lactobacillus spp. (44.3 ± 31.1%),
Streptococcus spp. (29.2% ± 15.8%), and
Staphylococcus spp. (10.4 ± 9.8%). Only
Lactobacillus spp. increased over the 120 days of aging whereas
Streptococcus spp. declined over time, while
Staphylococcus spp. populations remained constant. At 90 and 120 days of ripening, when slits were found,
Lactobacillus and
Turicibacter had increased in relative abundance (averages of 1.2- and 2.2-fold at 90 and 120 days, respectively).
Limosilactobacillus fermentum was the dominant species of
Lactobacillus amplicon sequence variant that increased on average 1.1-fold at 120 days. Cheese containing the
L. fermentum isolates exhibited the highest levels of slit damage. They also showed that the pre- and post-HTST (High-Temperature Short Time)-pasteurization milk used to make the cheese blocks that developed slits could be differentiated by the microbial composition (diversity of lactobacilli, for example) compared to milk that resulted in good-quality cheese without slits.
Given the gap in knowledge about the microbial succession over long ripening periods over 2 years, the aim of our study was to evaluate the microbial diversity and succession in long-ripened Cheddar cheese manufactured at one industrial cheese plant in Ontario over a three-year period using culture-dependent techniques, high throughput 16S rRNA gene amplicon sequencing, and qPCR to quantify target groups of species.
2. Materials and Methods
2.1. Cheese Manufacturing and Sampling
Cheddar cheeses were produced in an industrial facility using heat-treated (thermized) milk following conventional cheese-making methods; curd was cooked at 38.5 °C, pitched at pH 6.15, milled at pH 5.35, and salted at 2.7% (w/w). The approximate weight of milk in each vat was 23,000 kg. The same milk was used in six vats per trial using two different starters (three vats per starter) per trial with a rotation of a total of ten starter mixes consisting of Lactococcus cremoris. Each starter was repeated on average two or three times over the 13 trials. For each of the 13 trials, six cheese blocks were sampled per time point, each from one of the six separate vats, totaling 132 cheeses. Sampling was performed over a course of 32 m at 0–1 m (13 trials), 3–6 m (13 trials), 7–10 m (13 trials), 13–15 m (13 trials), 18–20 m (11 trials), 24 m (7 trials), and 30–32 m (5 trials) time points. Samples that were received at day zero were in the form of cheese curd, at 1 m, they were cheese plugs and samples that were received at three months and older were blocks of 9 kg (20 lb) cuts that were obtained from the 290 kg (640 lb) mother block. The 9 kg block was cut into half in a way that every 4.5 kg (10 lb) block had two or three exterior and interior faces. Sections of the 4.5 kg block (including internal and external faces) were ground before homogenization in buffer as described below.
2.2. Preparing Cheese Homogenate for Bacterial Enumeration and DNA Extraction
Ten grams of each cheese sample was suspended in 90 mL of 45 °C sterile 2% (w/v) trisodium citrate dehydrate solution and homogenized in stomacher bags (Fisher Scientific, Mississauga, ON, Canada) using Seward Stomacher® 400 Circulator for 5 min at 260 rpm. The resulting homogenate was used for bacterial enumeration and DNA extraction.
2.3. Bacterial Enumeration
One milliliter of cheese homogenate was serially diluted in 9 mL of 0.1% peptone water and was plated on selective media for enumeration and cultivation of SLAB and NSLAB. To select for SLAB (mostly Lactococcus spp., but other species such as Enterococcus spp. may also grow), M17 agar (Oxoid Microbiology, Nepean, ON, Canada) with 0.5% w/v glucose (Fisher Scientific, Mississauga, ON, Canada) hereafter referred to as GM17 was used following incubation at 30 °C for 72 h. De Man, Rogosa and Sharpe (MRS) agar (Oxoid Microbiology, Nepean, ON, Canada) with 1 mg/L of vancomycin (Sigma-Aldrich, St. Louis, USA) hereafter referred to as MRSv was used to select for mesophilic NSLAB, which was incubated under anaerobic conditions in a GasPak jar at 30 °C for 72 h.
2.4. Propidium Monoazide (PMA) Treatment
PMA treatment of cells was performed following the protocol described by Desfossés-Foucault et al. [
23] with some modifications. Each bacterial pellet obtained as described below in
Section 2.5 was suspended in 500 μL of 0.1% buffered peptone water and treated with 5 μL of 2.5 mM PMA solution (PMAxx dye, Biotium, Fermont, USA) diluted in nuclease-free water. Samples were incubated on ice in the dark for 15 min. Samples were then exposed to PMA UV light (PhAST Blue, GenIUL, Barcelona, Spain) for 15 min and placed on ice in the dark for another 15 min. The PMA-treated cell suspensions were centrifuged at 10,000×
g for 5 min, washing the cell pellets with 500 μL of 2%
w/
v sodium citrate solution followed by centrifugation at 10,000×
g for 1 min and discarding the supernatant. PMA-treated cell pellets were used for DNA extraction.
2.5. DNA Extraction from Cheese Samples
Ten milliliter of the cheese homogenate was centrifuged at 10,000× g for 10 min at room temperature. After centrifugation, the supernatant was removed, and the fat layer was cleared as much as possible with a sterile cotton swab. Once the fat layer was cleared, cells were suspended in 1 mL of 2% sodium citrate solution for washing. The cell suspension was centrifuged at 10,000× g for 5 min and the supernatant was removed. This step was repeated 3–4 times until no fat was left in the tube. The resulting cell pellet was used for DNA extraction for determining the total and viable bacterial composition. DNA extraction was carried out on cell pellets with and without PMA treatment using Invitrogen PureLink Microbial DNA Purification kit following the manufacturer’s instructions (Invitrogen Canada Inc., Burlington, ON, Canada) with some modifications.
Bacterial pellets were suspended in 800 μL of lysis buffer and transferred to a 2-mL microtube containing 0.3 g of zirconium beads (1-mm diameter). One hundred microliter of lysis enhancer was added, vortexed briefly, and incubated at 75 °C for 10 min. Tubes were shaken for 10 min at maximum speed on the vortex mixer and were then centrifuged at 14,000× g for 2 min. Up to 500 μL of the supernatant was transferred to a clean microcentrifuge tube, avoiding the bead pellet and any debris. Nine hundred microliter of binding buffer was added, vortexed briefly, loaded onto a spin column-tube assembly and centrifuged at 14,000× g for 1 min. The column was washed using 500 μL of wash buffer, and DNA was eluted using 50 μL of elution buffer followed by storage at –20 °C until further analysis. For cheese samples with lower cell count, mostly samples older than one year, three to six cell pellets were treated separately up to the step that the DNA was loaded on the DNA binding column. The extracted nucleic acids from all cell pellets were loaded on a single column, washed, and collected as one sample.
2.6. Quantification of Bacterial Species by qPCR
Absolute quantification of target
Lactococcus spp.,
Lactobacillus spp., and
L. casei/paracasei was performed on total and PMA-treated DNA. Quantitative PCR was carried out in 96-well plates (Hard-Shell Thin-Wall Skirted PCR Plates, Bio-Rad, Mississauga, ON, Canada) using a Bio-Rad real time CFX96 system. Each 20 μL amplification was done in triplicate and contained 10 μL of SsoAdvanced Universal Inhibitor tolerant SYBR Green Supermix (BioRad), 3 μL of RNase free water, 5 μL of DNA, and 1 μL of both forward and reverse 10 μM primer (final concentration of 0.5 μM). A no-template control (NTC) was included on each plate, which had 5 μL of RNase free water instead of the DNA template, as well as a negative control. Amplification was started with denaturation at 95 °C for 10 min, followed by 40 cycles of 95 °C for 30 s and 60 °C (for
Lactococcus spp. and
L. casei/paracasei) and 61.5 °C (for
Lactobacillus spp.) for 30 s (
Table 1). After amplification, a dissociation curve analysis was performed by increasing the temperature by 0.5 °C every second from 65 to 95 °C to confirm the absence of non-specific amplification products. A 133-bp and 123-bp region in the V3 region of the 16S rRNA gene was targeted for
Lactococcus spp. and
L. casei/paracasei, respectively (
Table 1). For
Lactobacillus spp., the forward primer targets the 16S/23S rRNA intergenic spacer region while the reverse primer is specific to the terminal region of the 16S rRNA gene (
Table 1).
For the DNA standard curve, DNA from Lactococcus lactis subsp. cremoris strain LLG1000 (for Lactococcus spp.) and L. paracasei strain LLG2134 (for L. casei/paracasei and Lactobacillus spp.) was extracted using DNeasy Blood and Tissue DNA extraction kit (Qiagen) according to the manufacturer’s instructions with some modifications (centrifugation at 10,000× g; cell pellet suspended in 200 μL lysis buffer, 62.5 μL proteinase K added instead of 25 μL, column washed with 200 μL instead of 500 μL AW1 and AW2, incubations for 1 h instead of 30 m, DNA elution in 50 μL instead of 200 μL). Both strains were isolated from the cheeses in this study and identification was confirmed by MALDI-TOF. DNA quality and concentration were measured using a Nanodrop spectrophotometer (NanoDrop 1000 spectrophotometer, Thermo Scientific, Burlington, ON, Canada) and a Qubit™ 4 Fluorometer with the QuBit® dsDNA BR assay kit (Invitrogen Canada Inc., Burlington, ON, Canada). A serial dilution of 1 in 10 concentrations of each DNA species was prepared up to seven dilutions.
Standard curves were used for conversion of Ct values to gene copy numbers per μL. The target concentration (copies/μL) was calculated from the DNA concentration (cDNA, ng/μL), the Avogadro constant (NA, 6.022 × 10
23 molecules/mol), the genome size (lDNA, bp), and the average molecular mass of a double-stranded DNA base pair (660 × 10
9 ng/mol) using the following equation: number of copies per microliter = (cDNA × NA)/(lDNA × 660 × 10
9) [
25]. Results were then expressed as genome copy number/g of cheese.
Lactococcus-specific primers were tested for specificity using L. lactis subsp. cremoris SK11, L. lactis subsp. lactis IL1403, Lactococcus lactis (target) and L. paracasei ATCC 334, L. paracasei, L. buchneri/L. parabuchneri, L. rhamnosus, L. brevis, L. coryniformis, L. plantarum ATCC 14917, L. helveticus ATCC 12046, and L. zeae ATCC 15820 (negative control), and L. casei/paracasei-specific primers were tested for specificity using L. paracasei ATCC 334, L. paracasei (target) and L. lactis subsp. cremoris SK11, L. lactis subsp. lactis IL1403, Lactococcus lactis, L. buchneri/L. parabuchneri, L. rhamnosus, L. brevis, L. coryniformis, L. plantarum ATCC 14917, L. helveticus ATCC 12046, and L. zeae ATCC 15820 (as negative control, data not shown). In the current study, we used Lactococcus lactis subsp. cremoris strain MG1363 as negative control for L. casei/paracasei and Lactobacillus sp. primers and L. paracasei LLG2134 as negative control for Lactococcus sp. primers.
Table 1.
qPCR primers and standard curve results for 16S rRNA gene quantification of Cheddar cheese bacteria.
Table 1.
qPCR primers and standard curve results for 16S rRNA gene quantification of Cheddar cheese bacteria.
| Bacterial Species | 16S rRNA Primers Sequence (5′ → 3′) | Amplicon Length (bp) | Slope | Intercept Point | Efficiency (%) | R2 |
|---|
| Lactococcus sp. 1 | 3 F: GAGGCAGCAGTAGGGAATCTTC
R: CTGATGAGCTTT-CCACTCTCA | 133 | −3.486 | 33.729 | 93.6 | 0.997 |
| L. casei/paracasei1 | F: GTGCTTGCACTGGATTCGACTTA
R: TGCGGTTCTTGGATCTATGCG | 123 | −3.250 | 35.928 | 103.1 | 0.998 |
| Lactobacillus sp. 2 | F: CTCAAAACTAAA- CAAAGTTTC
R: CTTGTACACA-GCCCGTCA | 250 | −3.494 | 35.937 | 93.3 | 0.992 |
2.7. Community Profiling Using 16S rRNA Gene Amplicon Sequencing
DNA from all cheese samples was subjected to 16S rRNA gene amplicon sequencing using the MiSeq platform (Illumina, San Diego, CA, USA). For each sample, 10 μL of extracted DNA was adjusted to 5 ng/μL concentration and was sent for amplicon sequencing by the Advanced Analysis Centre genomics facility at the University of Guelph, Guelph, Ontario, Canada. Amplicon sequencing libraries were prepared following the procedures described in the 16S Metagenomics Sequencing Library Preparation Guide with modifications (Illumina 2020). V3 and V4 regions (~460 bp) of the 16S rRNA gene were amplified using the following universal primers: forward primer: 5’ CCTACGGGNGGCWGCAG and reverse primer: 5′GACTACHVGGGTATCTAATCC [
28]. The primers for the first stage polymerase chain reaction (PCR) consisted of overhang nucleotide sequences (to ensure compatibility with the Illumina index) and locus-specific sequences.
The first-stage PCR reaction mix (25 μL) contained 1x KAPA HiFi HotStart Ready Mix (KAPA Biosystems), 0.2 μM of each primer (Integrated DNA Technologies), and 5 μL template DNA. The PCR thermal cycling conditions were 95 °C for 3 min; 30 cycles of 95 °C for 30 s, 55 °C for 30 s, and 72 °C for 30 s; followed by 72 °C for 5 min using a GeneAmp PCR System 9700 thermal cycler (Life Technologies, Burlington, ON, Canada). The PCR products were purified using NucleoMag Beads (Macherey-Nagel, D-Mark Biosciences, Toronto, ON, Canada) to removed free primers and primer dimers. The purified PCR products were re-amplified using the Nextera XT Index kit. The indexes were 8 bases long, and each sample for each target was dual indexed.
This second-stage PCR reaction mix (50 μL) contained 1x KAPA HiFi HotStart Ready Mix (KAPA Biosystems), 5 μL each of Nextera XT Index Primers (Illumina), and 5 μL template DNA. The PCR thermal cycling conditions were 95 °C for 3 min; 8 cycles of 95 °C for 30 s, 55 °C for 30 s, and 72 °C for 30 s; followed by 72 °C for 5 min 42 using a GeneAmp PCR System 9700 thermal cycler (Life Technologies). PCR products were purified using NucleoMag Beads (Macherey-Nagel). The purified amplicons were normalized by measuring the concentrations of the purified PCR products using a Qubit, calculating the molar concentrations, and adjusting all molar concentrations to be identical across all samples using a buffer. The purified amplicons were then combined in equal molar ratios based on their DNA concentrations and the pooled fragments were sequenced.
For DNA sequencing using the MiSeq system, the pooled libraries were denatured with NaOH, diluted with hybridization buffer, and then heat-denatured prior to sequencing. PhiX was included at a 15% level to serve as an internal control. Sequencing was conducted using a MiSeq sequencer with the MiSeq v3 reagent kit and 2 × 300 paired-end cycles according to the manufacturer’s protocol. Raw sequence reads were filtered using the MiSeq Sequencer System Software to remove low-quality sequences and trimmed to remove adaptor sequences. The resulting reads were up to 301 bases long.
2.8. Data Analysis
All 16S rRNA gene sequence data were analyzed with QIIME2 version 2017.12 (accessed 20 March 2018 at
http://qiime2.org) [
29] for bacterial taxonomic classification to operational taxonomic units (OTU) to perform diversity analysis. Forward and reverse reads were trimmed at the front ends to remove primer sequences and at the tail ends when quality was consistently below 25. Using DADA2, reads were filtered and combined as OTUs (97%), and chimera were removed. The manually created DAIRYdb reference database was used as a classifier to assign taxonomic names to the representative sequences.
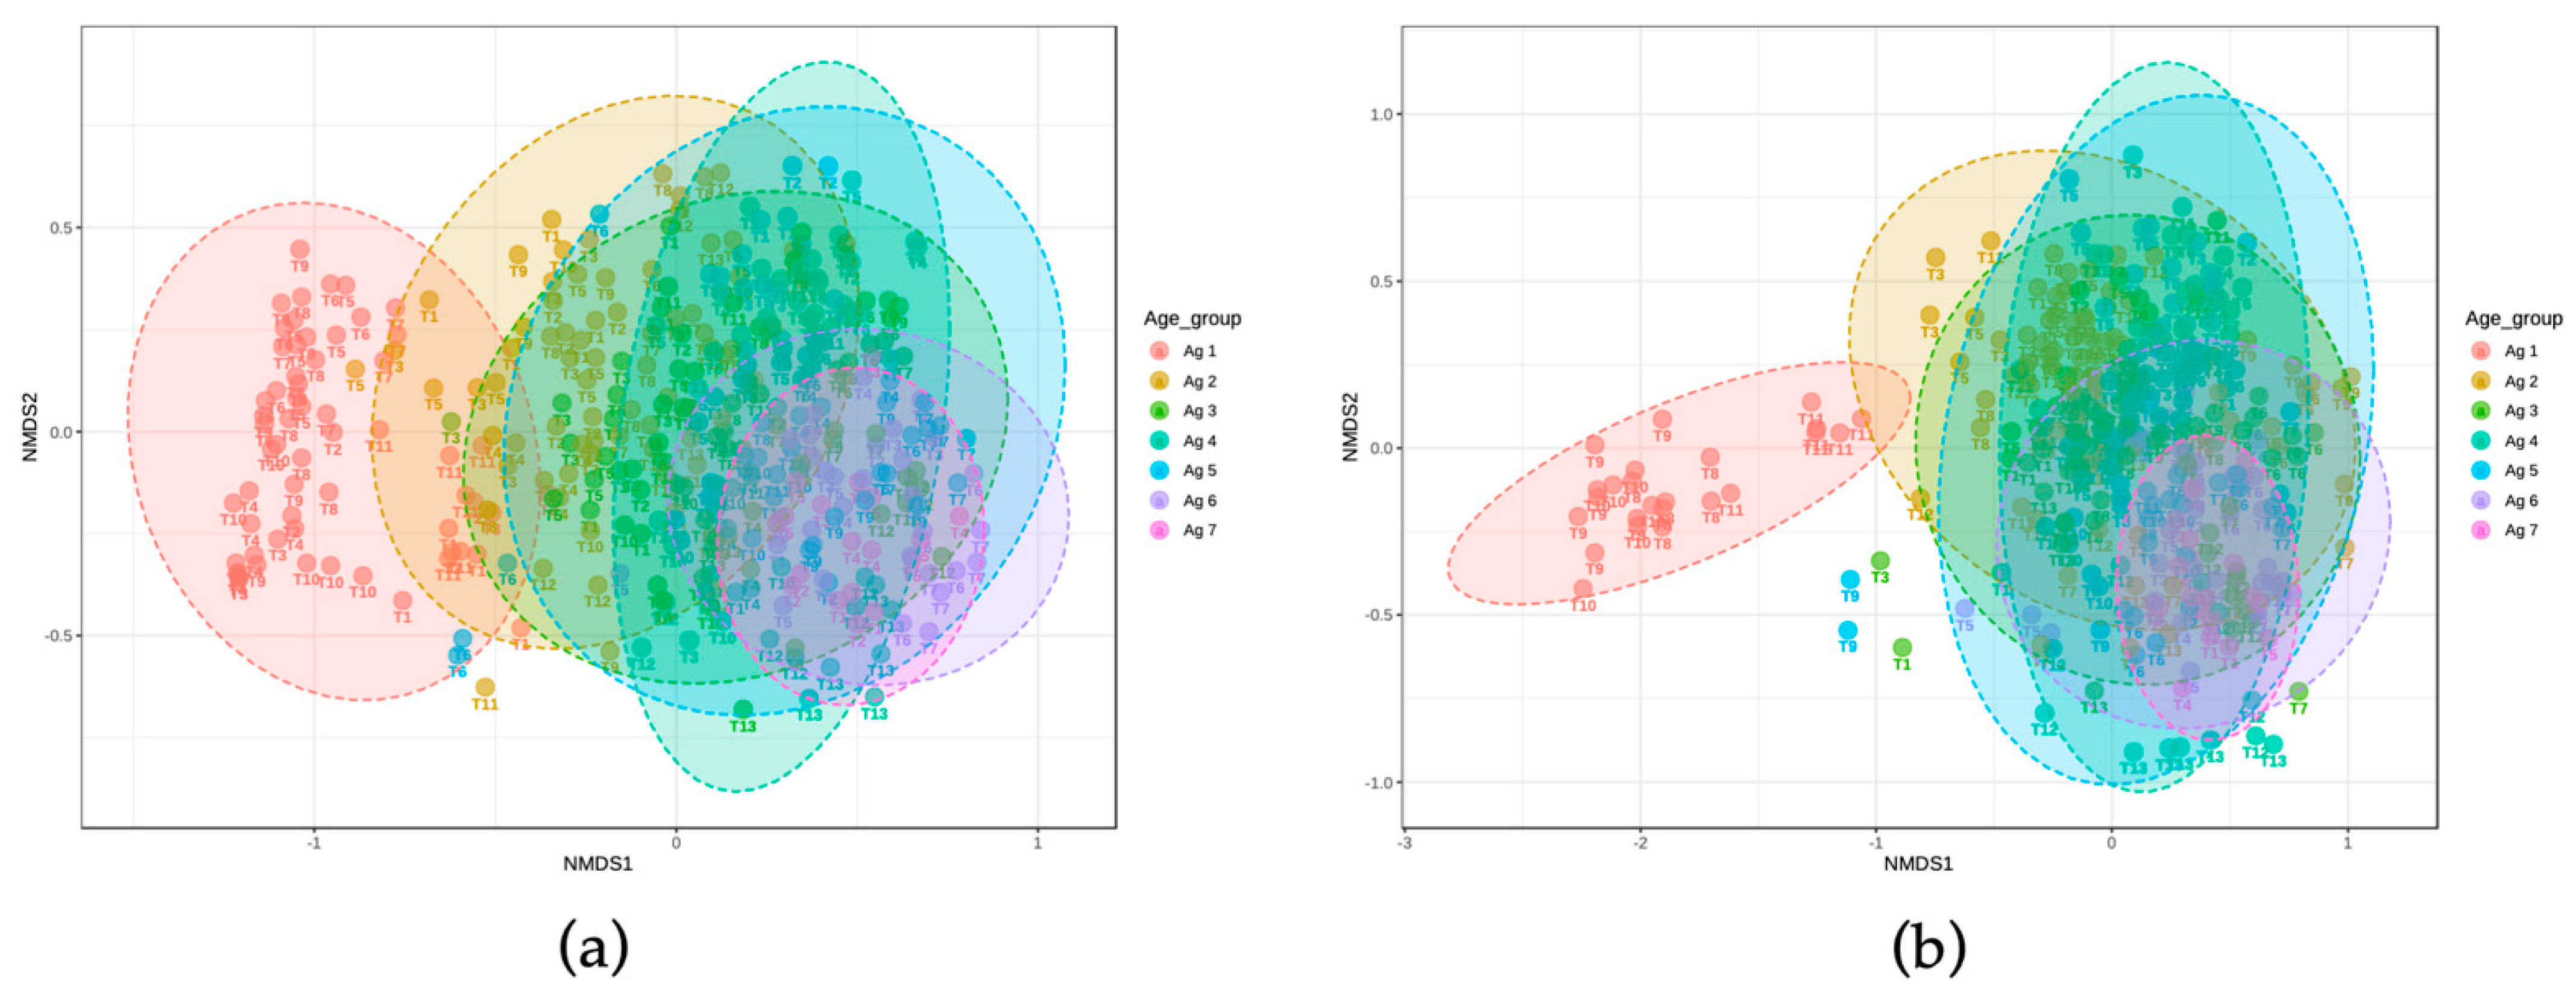
In QIIME2, a rooted tree was constructed to represent sequence diversity that included phylogenetic information (OTU analysis). The QIIME2 diversity “core-metrics-phylogenetic” plugin was used for calculating alpha and beta diversity measures on OTU profiles. For alpha diversity, Chao1 and Shannon indices were selected [
14]. For beta diversity, the Bray–Curtis dissimilarity measures were visualized using NMDS [
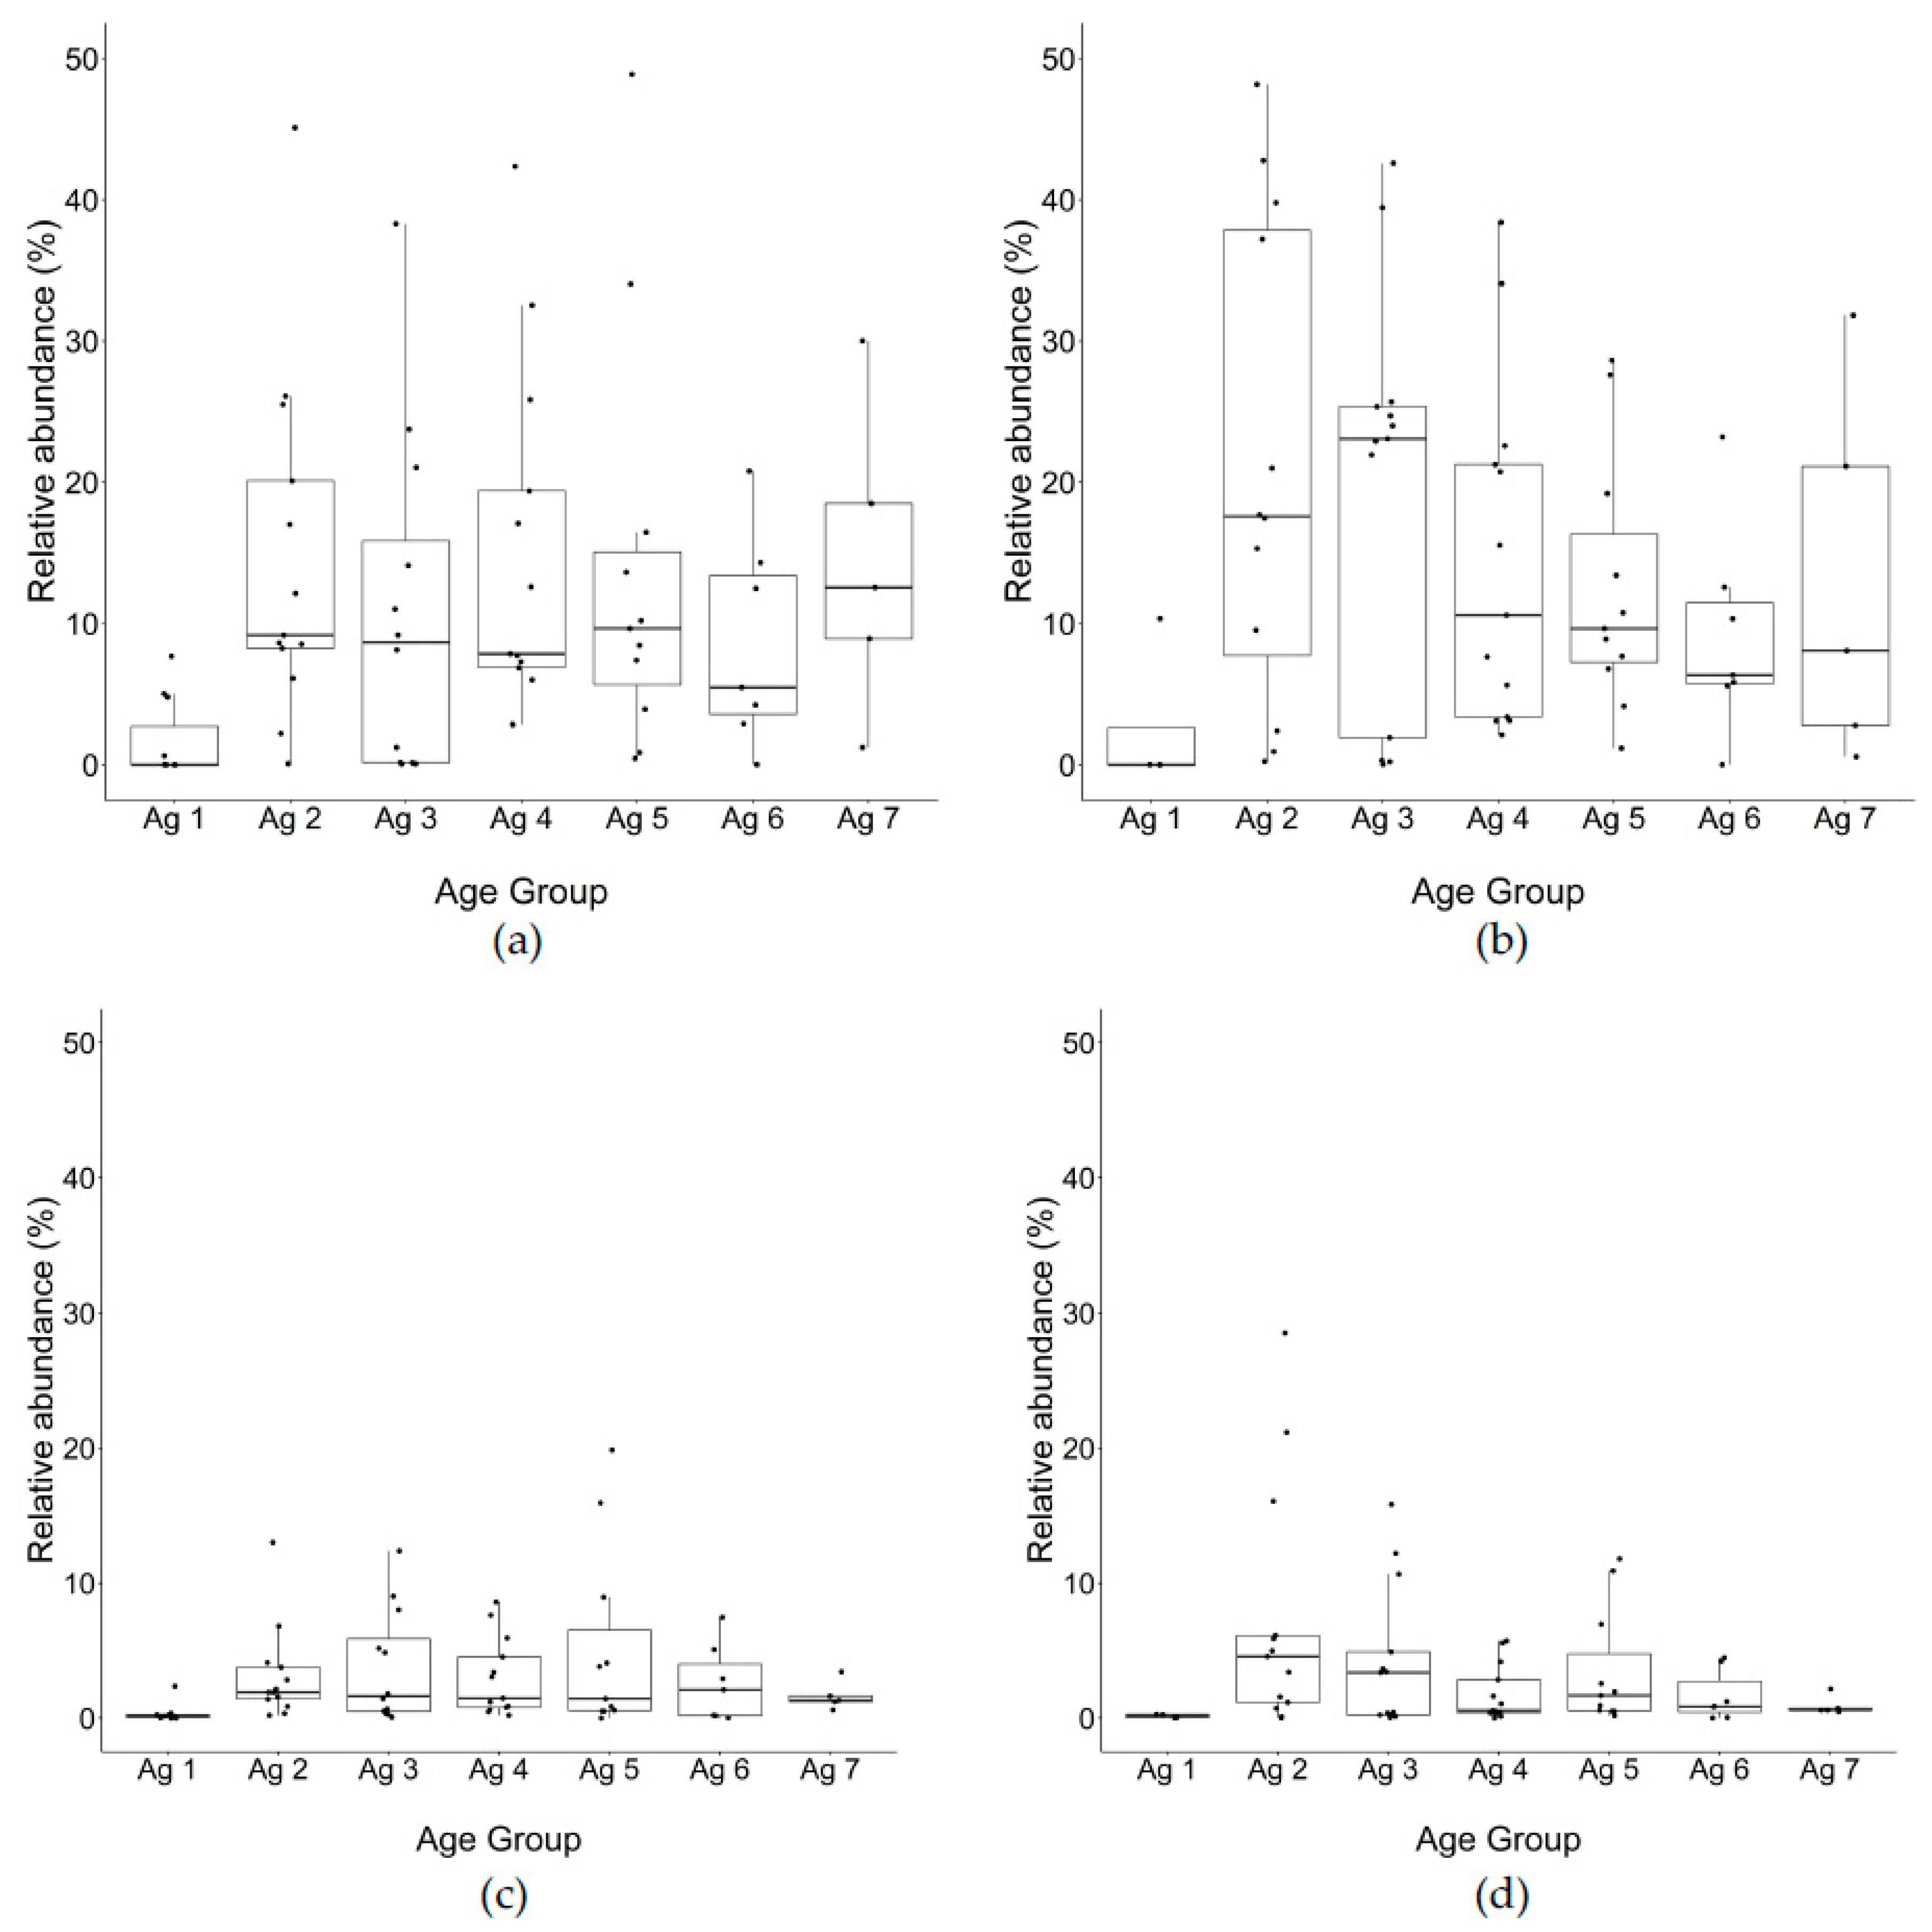
30]. Diversity metrics were compared by grouping samples by starter, trial, and season. The filtered read counts of relative abundance for
Lactococcus spp.,
Lacticaseibacillus, Weissella, Lactobacillus, Streptococcus genera were compiled from 16S rRNA gene amplicon sequences for cheeses from trials 1 to 13 (% of total reads identified to genus level obtained from OTUs). Moreover, we developed a script using R (V3.6.3) on core i7, 16G RAM, 2.8 GHz processor laptop to visualize the distribution profile of the relative abundance of
Lactococcus spp.,
Lacticaseibacillus and
Lactobacillus,
Weissella and
Streptococcus, as shown in boxplots for PMA and non-PMA treated trials across seven age groups.
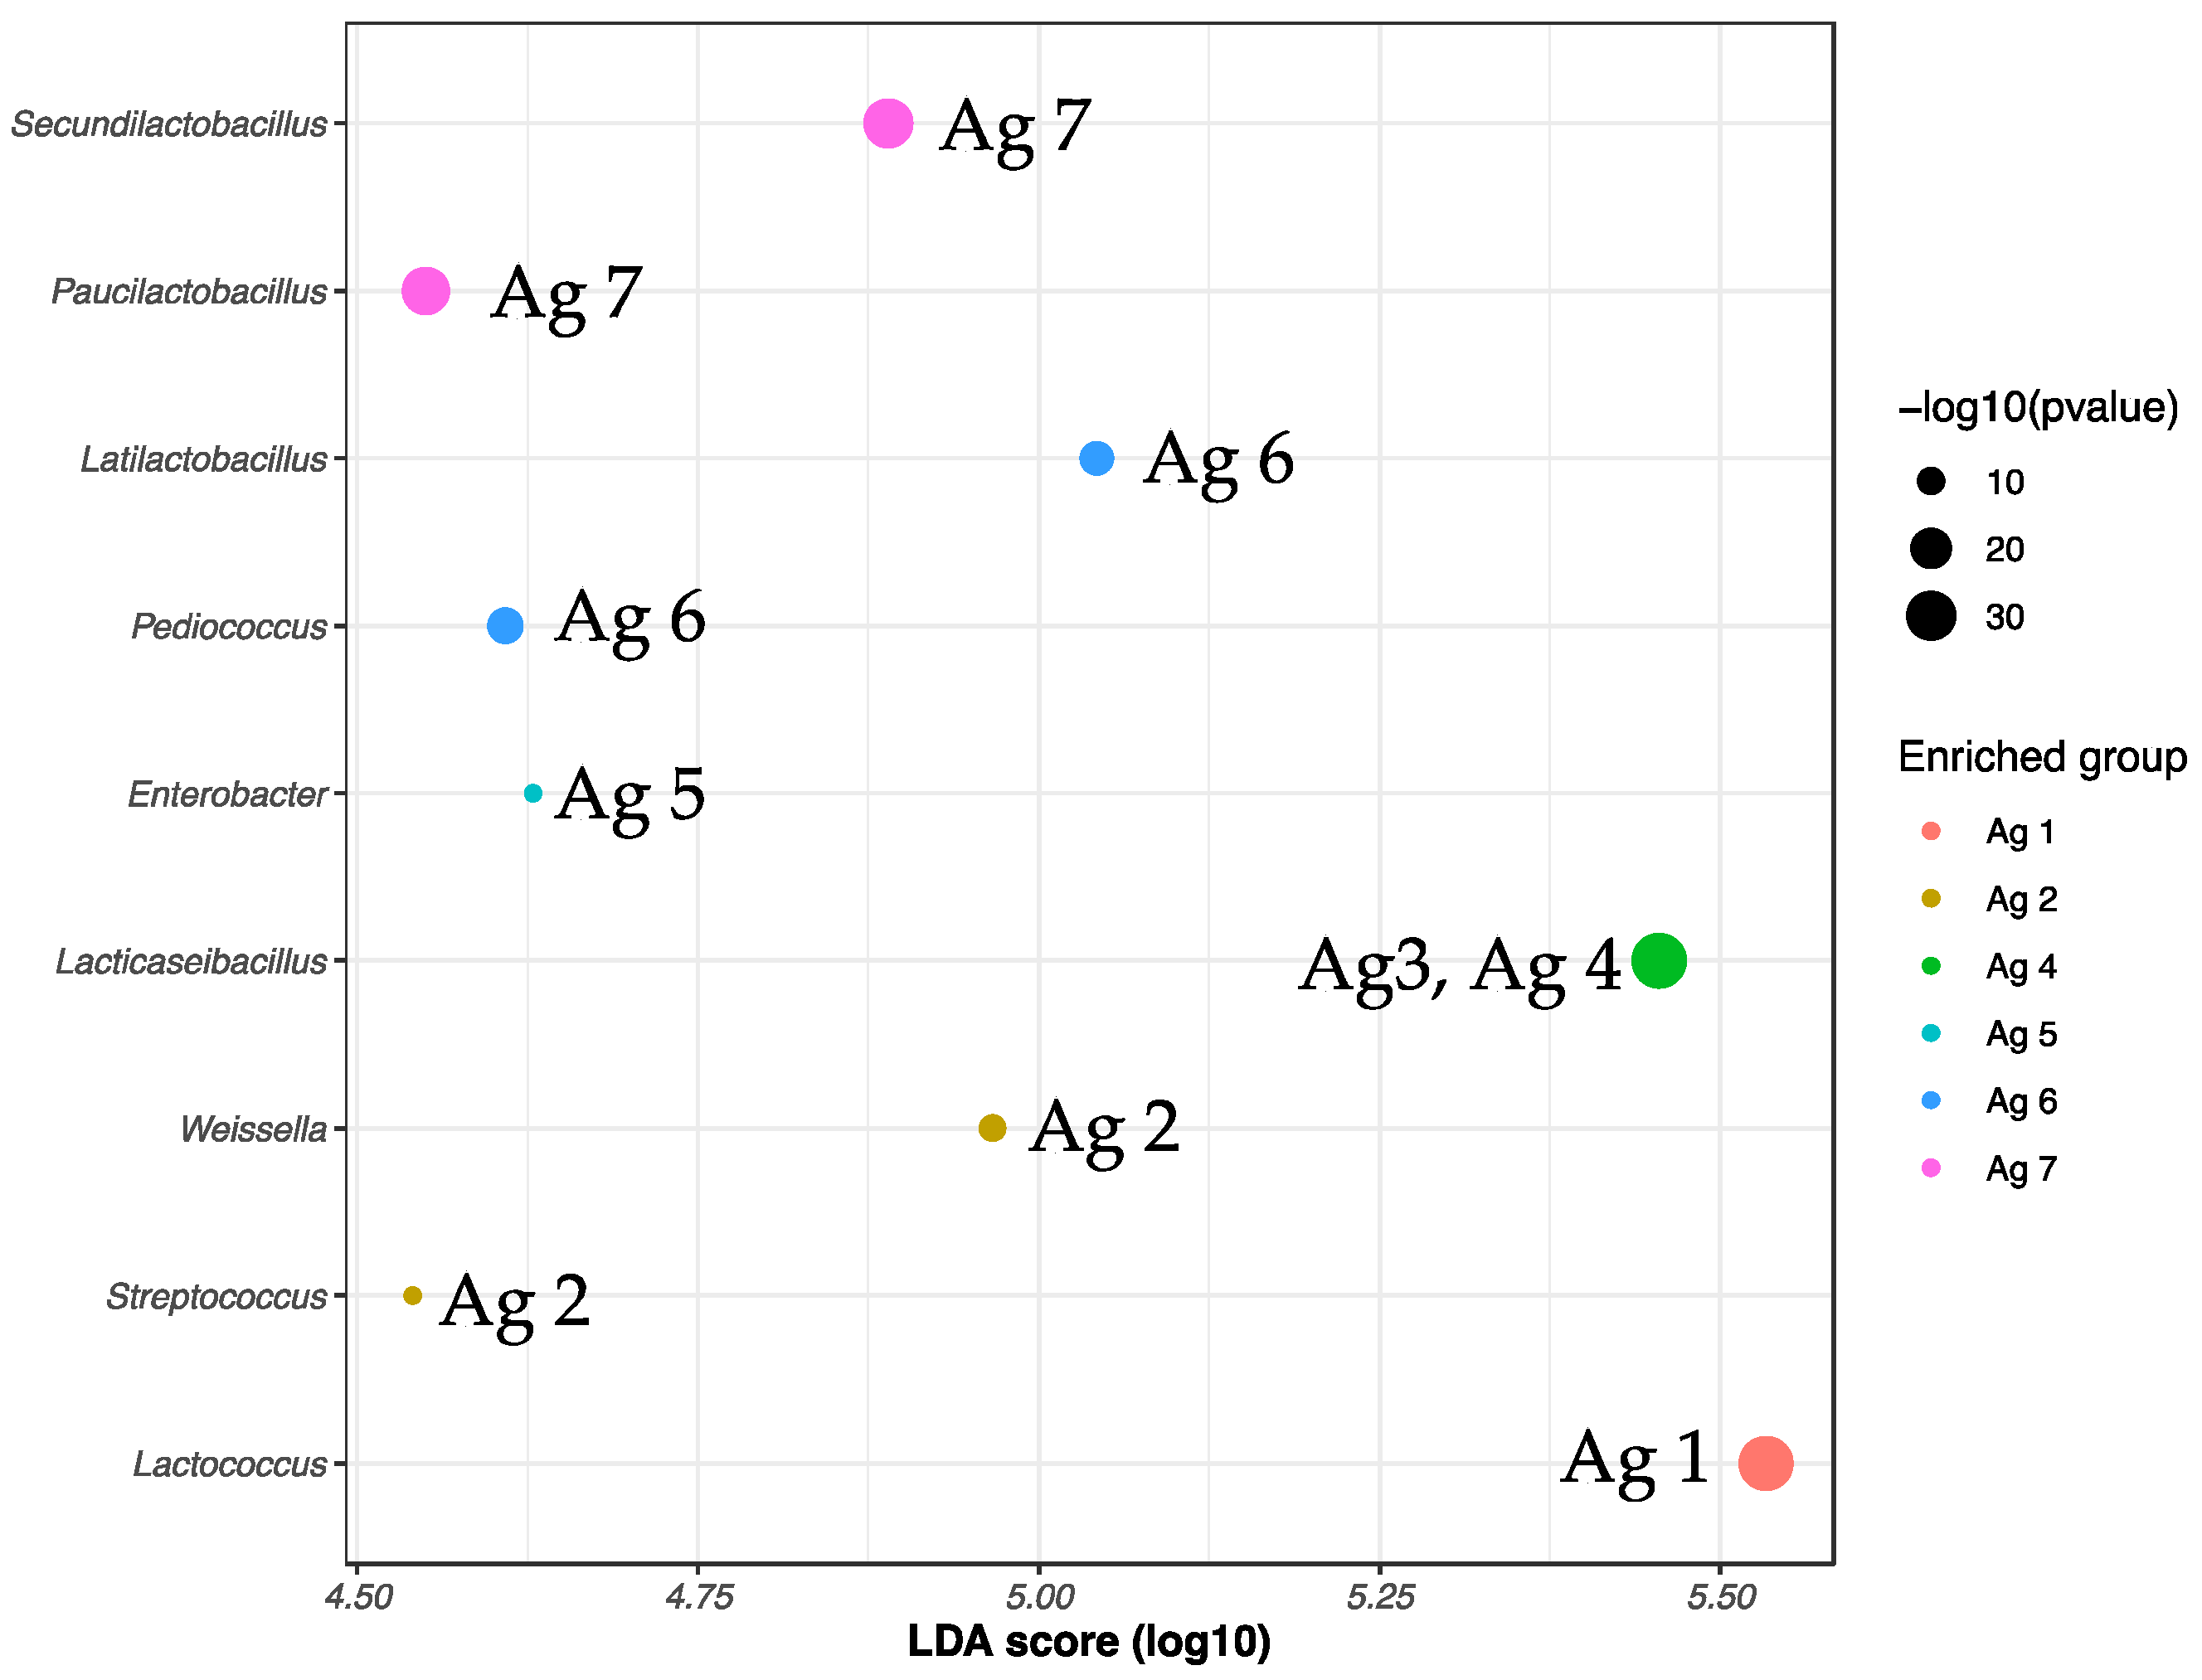
Amplicon sequence variant analysis was carried out on the 16S gene amplicon sequence reads from PMA-treated cheese samples only following the amplicon bioinformatics R script which infers ASVs through dereplication [
31]. DAIRYdb was then used as the reference database to classify ASVs to genus level. Non-filtered reads were used to tabulate
Lactococcus and
Lacticaseibacillus spp. total ASVs, while filtered ASVs with ≥0.1% relative abundance in ≥10% samples were used to characterize overall biomarkers for cheese ages. The linear discriminant analysis effect size (LEfSe) for microbiome biomarker discovery was carried out on filtered ASV data from all PMA samples using microbiomeMarker R package with a Kruskal–Wallis rank sum test (
p < 0.05) and an LDA score cutoff of 2.
Statistical analysis on average viable plate counts, relative abundance (genus level), and qPCR was performed using SPSS, version 28.0.1.1 for Mac OS (SPSS statistics, IBM, East Markham, ON, Canada). A Tukey’s honestly significant difference test was used for post-hoc analyses where there were no violations of the test assumptions for the homogeneity of variance (Levene’s k—sample comparison of variances). Age groups that violated these assumptions were subjected to a 1-way ANOVA using the Games–Howell post-hoc analysis. The significance level was set at a probability value of ≤0.05. The independent samples t test was used (p ≤ 0.05) to compare total and PMA-treated DNA of average of all trials.
4. Discussion
Starter and non-starter lactic acid bacteria have distinct roles in modifying the physical and chemical characteristics of cheese during production (curd formation for SLAB) and ripening (both SLAB and NSLAB). The specific characteristics of the cheese depend on the microbial interactions in metabolizing proteins, fat, and residual carbohydrates [
33]. By using both culture dependent methods and incorporating PMA treatment into the culture independent methods of 16S rRNA gene amplicon sequencing and PMA-qPCR, a comprehensive profile of Cheddar cheese microbiota and specific targets was obtained over a prolonged ripening period of 32 months.
Starters inoculated at ~6 log cfu/mL in cheese milk become concentrated to 7–9 log cfu/g of curd [
34,
35,
36]. It is repeatedly reported that SLAB grow at the beginning of cheese manufacturing (cheese curd formation) and then gradually lose viability during ripening, mainly due to depletion of lactose, low moisture, low pH, non-optimum temperature, and high salt environment (pH 5.0–5.3, 5–13 °C and 4–6% salt in moisture) [
37]. Their rate of decline depends on the processing steps (cooking temperature, salt rate, curd washing) that will affect the degree of autolysis according to the characteristics of the strains used in the starters [
38]. Ganesan et al. [
39] showed that
Lactococcus lactis can remain metabolically active even though they are in a non-culturable state under carbohydrate starvation (i.e., after lactose is depleted at around 30 days of maturation in Cheddar).
Culturable counts of SLAB in cheese curd and at one month were 7–8 log cfu/g, around what has been reported. The sharpest decrease in SLAB viable counts was observed at 3–6 m (1–2 log decrease reaching 5.5–7 log cfu/g). The SLAB count at this age for most trials was similar to that found by Desfossés-Foucault et al. [
36] and Crow et al. [
40] who reported that culturable
Lactococcus spp. counts decreased to 6–7 log cfu/g and 4–6 log cfu/g, respectively, after six months of ripening. However, the maximum decrease for this period in our study was 1–2 log, which was lower than the 2–3 log (from 9 to 6–7 log cfu/g) reported by Desfossés-Foucault et al. [
36] and the 3–5-log decrease reported by Crow et al. [
40]. Desfossés-Foucault et al. [
41] reported a rapid decline in
L. lactis subsp.
cremoris from 9 to 7 log cfu/g of cheese after three days of accelerated ripening at 30 °C (in cheese slurry) and a total lack of detection on GM17 agar after six days (twelve days of simulated accelerated ripening was equivalent to six months at 4–6 °C). In our study, 10 starters were rotated through 13 trials where more similarity in rate of decline was found between starters used in the same trial than between trials for the same starter.
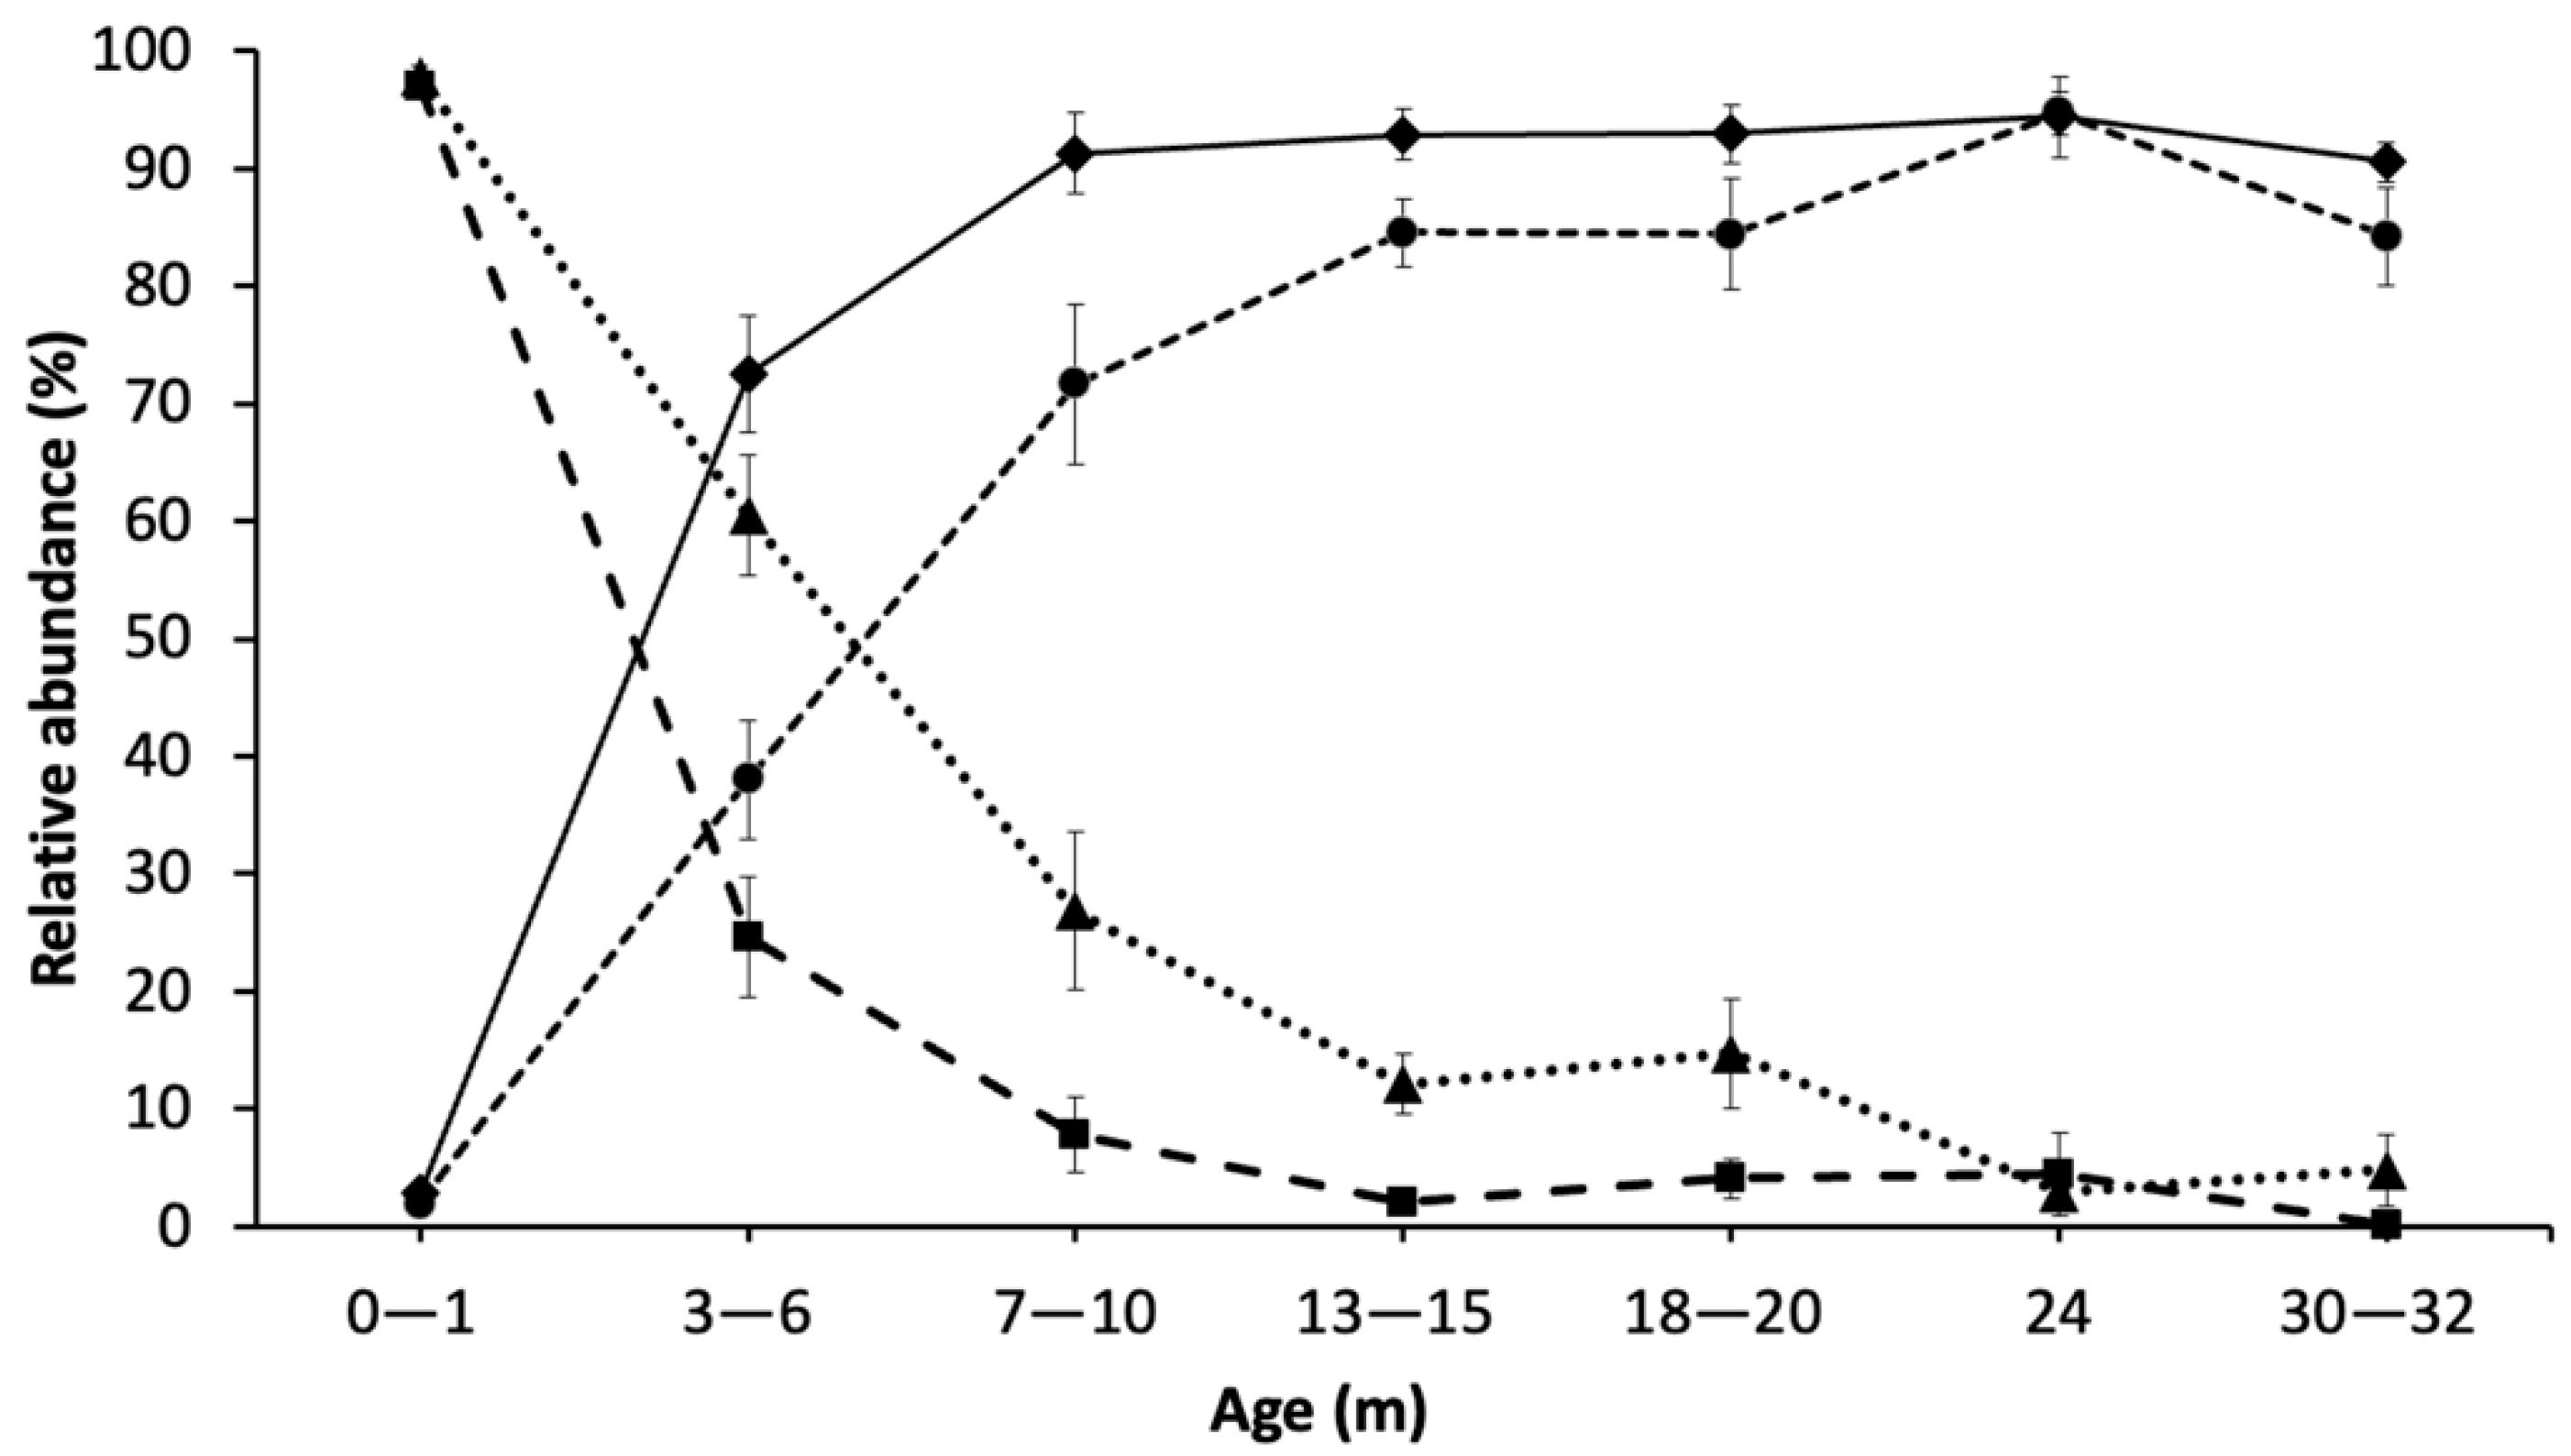
Through 16S rRNA gene amplicon sequencing, Lactococcus spp. comprised on average 97% of the community profile at the beginning of ripening (0–1 m), due to the initial inoculation, growth in thermized milk, and concentration in the curd. Over time, the relative abundance of Lactococcus spp. decreased to 4% and near zero at 30–32 m for total and PMA-treated DNA, respectively. At 13–15 m and later, the changes in Lactococcus spp. from both total DNA and PMA-treated DNA were significantly less than the earlier time points. Compared to total DNA, PMA-treated DNA showed an earlier drastic decrease in Lactococcus (after 0–1 m), indicating that most cells detected at around 3–6 m were permeable. This drop in Lactococcus spp. abundance in PMA-treated DNA started earlier than was shown for the total DNA (3–6 m vs. 13–15 m), indicating that the permeabilized cells may accumulate at a higher rate than cell lysis (loss of total DNA).
Quantification by plate counts and qPCR using total DNA for Lactococcus spp. were consistent, showing the highest values at 0–1 m and decreasing thereafter. The difference between total and PMA-treated DNA was highest at 3–6 m (1.5–2.5 log), which means 150 to 300-fold ratio between intact to permeable Lactococcus spp. cells. SLAB plate count was the lowest, indicating the excluded DNA in PMA treatment was from the cells with damaged membranes at this point and were not able to grow on plates. This difference was lower after 3–6 m and remained the same at 1 log until 30–32 m. The low levels of difference between total and PMA-treated cells shows a low percentage of permeable Lactococcus spp. population with damaged membranes.
Comparing genome copy number and cDNA, Desfossés-Foucault et al. [
36] showed a 100 to 1 ratio between dead/non-rRNA synthesizing to actively rRNA-synthesizing (cells at the beginning of ripening (m 0), which was interpreted as presence of higher number of dead but intact cells that do not synthesize RNA. The equal ratio between genome copy number and cDNA at one month of ripening was interpreted as lysis of those dead but intact cells [
36,
42]. However, based on the results reported in the above study, there is an increase in genome DNA from 2 to 5 m and the difference was again at around 100–fold for genome copy to cDNA, which is similar to the result of total and PMA at the same age in our study. The increase in genome copy number and higher ratio of genome DNA to cDNA however, might show that the smaller difference between genome and cDNA observed at one month in the above study was not necessarily due to cell lysis and the question remained whether the difference between genome and cDNA continued to diverge after 6 m, justifying the current study of cheese up to 32 m of age.
In several of the trials, starter plate counts increased by up to 1.5 log between 3–6 m and 7–10 m. A significant increase in the starter count after the initial decline has not been previously reported. However, a parallel increase was not observed when measuring the genome copy number of
Lactococcus spp. by qPCR. This indicates a shift in the ability of
Lactococcus to form colonies on plates between samples at 3–6 m and at 7–10 m, even though genome copy number remained stable. Bacterial populations with cells able to enter a dormant state can survive during stress such as nutrient depletion, which can be reversible. Kim et al. [
43] showed that dormant cell populations consist of dead cells and persister cells where the non-lysed particles that do not resuscitate are the dead cells, and the dormant cells that resuscitate are the persister cells. Starvation induces the formation of persister cells, which tolerate stress factors such as antibiotics, heat, and acid. Using an antibiotic treatment, Tatenhove-Pel et al. [
44] showed that
L. lactis MG1363 can form a persister subpopulation. Persister cell types have been generated by more than one kind of stress; for example, oxidative and acid stress [
43]. At the beginning of ripening when starters are submitted to a decrease in pH, carbon starvation, a decrease in water activity, and a temperature downshift [
45] they may survive by entering a persister state in which they do not grow or reproduce but maintain a minimal metabolism. This reduces competition for scarce resources but the increase after 6 m could be due to dormant cells that have resuscitated when nutritional conditions change or when the stress is removed [
43].
Based on the decreasing levels of SLAB in most studies at over 6–12 m of ripening, it was expected that no viable
Lactococcus spp. or very low counts would be obtained after the long ripening period of 30–32 m. However, we showed that the SLAB viable counts in these cheeses did not drop significantly at 32 m of ripening, which extends the observations by Xue et al. [
4]. After prolonged ripening (30–32 m), SLAB were culturable from the cheeses in our study up to 7 log, which was only on average half a log lower than the starting point. The final total genome copy number of
Lactococcus spp. by qPCR was in line with the counts on plate at the end of ripening. PMA-qPCR revealed that a significant proportion of the
Lactococcus spp. cells were permeable, as permeable cells were 1.5 log gene copy numbers/g less than total DNA from all cells. The PMA treatment method does not discriminate according to the extent of cell permeability, so cells with lower levels of permeability might still be capable of resuscitating on plates.
It has been accepted that starter viability becomes less important in later stages of ripening and the main role of starters at that stage is release of intracellular enzymes. However, viable bacteria on GM17 agar were obtained from samples as late as 32 m of ripening. Cells able to grow on media can represent (1) a subpopulation of the starter lactic acid bacteria that could grow throughout ripening, (2) persister cells that can resuscitate in cheese, as suggested by an increase in viable counts, (3) the portion of the population that could be resuscitated under optimal conditions of plating and incubation along with no competition from NSLAB as the GM17 is selective against most NSLAB.
Initial NSLAB concentrations in cheese made with high quality milk and sanitary conditions is 2–3 log cfu/g or less but can increase over time and reach 6–8 log after 6 m [
8,
9,
34,
46]. Our study supports these observations as NSLAB increased in relative abundance in all cheeses made from thermized milk at 7–10 m then stabilized in subsequent ripening periods. Surviving NSLAB are adapted to the conditions of acidity (pH 4.9–5.3), osmotic, oxidative, and high salt concentrations, low temperature, low moisture, and nutrient specificity [
9]. These stress factors lead to reduced viability of SLAB and potential autolysis during ripening, releasing enzymes and other cell components that can promote the growth of NSLAB by providing proteolytic products such as proteins, peptides, and amino acids that can be used as substrates for NSLAB growth and flavor development [
9]. Owing to these growth substances and NSLAB tolerance to the cheese environmental conditions, their population slowly increases about 4 to 6 log cfu/g during the first few months of ripening, which can have a significant impact on the ripening [
8]. The decline in relative abundance of
Lactococcus spp. was concurrent with the increase in the NSLAB abundance and at around 3–6 m, the dominance started to shift from
Lactococcus spp. to NSLAB.
The comparison between
Lactococcus spp. and
Lactobacillus spp. genome copy number at 30–32 m measured by qPCR showed a 1–2 log difference that can be translated to up to a 100-fold lower abundance of
Lactococcus spp. at the end of ripening. The low proportion of
Lactococcus at this stage of ripening is corroborated by all three methods of quantification of the
Lactococcus genus or SLAB. The rate of starter autolysis can determine the dominance of NSLAB in semi hard cheeses, especially in Cheddar, Emmental, and Gruyere [
47,
48]. The effect of starter autolysis on the growth of lactobacilli was noted by Desfossés-Foucault et al. [
36] toward the end of 6 m of ripening when a decrease in genome copy number for
Lactococcus coincided with an increase in genome copy number of lactobacilli, particularly in cheeses made from thermized milk. In the present study, at the beginning of ripening, NSLAB (mainly
Lactobacillus, as well as
Streptococcus, and
Weissella genera) constituted an average of 2% of all DNA sequence reads. The increase in the relative abundance of viable NSLAB was concurrent with the decline in the
Lactococcus spp. abundance. The shift in dominance from
Lactococcus spp. to NSLAB proceeded at a variable rate depending on the trial.
The relative abundance of Lactococcus spp. from PMA-treated DNA was almost identical to total DNA at the 0–1 m age in the trials that were tested which suggested that at this point cell permeability of this species is not perceptible. At 3–6 m of ripening, the difference between the relative abundance of total and PMA-treated cells for both Lactococcus spp. and NSLAB was maximal (around 40%), but in opposite directions. While viable cells of Lactococcus were lower than total copy numbers, the relative abundance of viable cells of NSLAB was higher than that measured by total DNA, indicating that viable NSLAB made up a greater proportion of the viable microbial population and that other species were becoming non-viable at a higher rate. This difference gradually decreased to negligible after 24 m. A lower autolysis of starter strains means potential availability of enzyme activity remaining within the cells, which may continue to convert substrates through enzyme activity. This could indicate that at the beginning of ripening bacteria become permeable at a higher rate due to the stress conditions imposed by pH and salt, but as ripening progresses, the sensitive permeable cells do not remain intact, lysing to release DNA which is not recuperated from the cheese during the cellular DNA isolation process, leaving only the less permeable intact cells.
Slow autolysis of NSLAB and decrease in the density is reported in prolonged ripening, releasing enzymes throughout the ripening process [
38,
49]. If they have not been added as an adjunct culture, the origin of
Lacticaseibacillus species is presumably from raw milk, and they are initially in minor proportion compared to the complex microbiota of the raw milk [
50]. In most trials in our study, after attaining maximal abundance between 13 and 24 months, decreased relative abundance of
Lacticaseibacillus was observed in our study after 24 m using quantification of DNA. However, the microbial community increased in evenness at the end of ripening, and NSLAB as a group of genera remained at over 90% of the relative abundance until 30–32 m. Originating from the production and processing environment, the initial diversity of NSLAB may be high early in Cheddar ripening, but overall abundance is low compared to starter (low evenness). Using the RAPD technique on isolates cultivated from Cheddar cheese, Fitzsimons et al. [
51] showed that 8-week-old Irish Cheddar cheese contained
L. paracasei,
L. plantarum, and
L. curvatus [
52], whereas
L. paracasei (96.4%) was dominant in 9 to 24-month-old cheese [
51]. Among the NSLAB genera in our study,
Lacticaseibacillus was the most abundant genus up to 20 m, but the subsequent rate of decline was variable among trials.
Lacticaseibacillus spp. was a significant ASV biomarker for cheeses at age 3 and 4 (3 to 15 m) but four other genera (
Pediococcus, Latilactobacillus, Secundilactobacillus, and
Paucilactobacillus) differentiated the potentially viable (from PMA-treated DNA) microbiota of cheeses from 24 to 32 months. Some of these genera have been associated with cheese gas defects, such as the heterofermentative
Secundilactobacillus and
Paucilactobacillus [
53].
Latilactobacillus curvatus, in particular, exhibits facultative heterofermentative metabolism, capable of forming slits in Cheddar cheese when residual sugars such as galactose are present. However,
Limosilactobacillus was only found as a taxon of rare prevalence and abundance (under 0.01% in under 10% of samples). Species such as
Limosilactobacillus fermentum have been directly linked to slit development in Cheddar cheese [
4]. No presence of slit defect was observed in any of the trial cheeses in our study.
Pediococcus is frequently found as part of the NSLAB of a number of cheeses and can be added as adjunct culture (ALAB) for formation of flavor and calcium lactate crystals in Cheddar cheese [
54]. The variable occurrence of
Pediococcus in the late-ripened Cheddar cheese in our study could be correlated with variability in grading at these later stages. The presence of multiple potential defect-causing genera during late ripening underscores the importance of developing tools to predict the optimal ripening time for marketing cheeses, considering the substantial investment and potential loss of product.
Weissella spp. was the second most abundant genus found at constant levels throughout ripening, with no significant difference between total DNA to PMA-treated DNA, indicating that the cells were intact and presumably viable. The
Weissella species are obligate heterofermenting, catalase-negative organisms that produce D- or DL-isomers of lactic acid as the main end-product of fermentation [
55] and are capable of producing exopolysaccharides. EPS may be technologically significant in certain sectors of the dairy fermentation industry for their rheological and textural effects on products. Some studied strains of
Weissella may contribute to increasing the moisture retention of cheese without significantly affecting the cheese primary proteolysis, but altering the peptide profile of the cheese and increasing amino acids [
56].
Weissella was not used as an adjunct culture in this study, so they most probably originated from raw milk.
Streptococcus was the next abundant taxon found in cheese at all time points, which would have come from milk or previous cheese manufacturing runs, as it was not used as part of the Cheddar starter culture. In a recent study,
Streptococcus was the major (6–7%) sequence variance in facilities with different sources of milk [
16].
Streptococcus may be added as part of the starter in Cheddar cheese production in some regions of the world [
57]. In a standard manufacturing procedure employing a 38 °C cook temperature, even very low levels (0.007%) of
S.
thermophilus combined with normal levels of the mesophilic starter (1.7%) resulted in increased rates of acid production and the formation of significant amounts of galactose (13 mmol kg cheese) [
16]. Martley and Michel [
58] reported that a high proportion of mature Cheddar cheeses exhibiting a pinkish coloration at or just beneath the surface contained significant levels of galactose, which was not observed in this study. Pink discoloration has been related to
Thermus contamination of the milk [
3,
59].
Overall, both viable plate count and qPCR quantification revealed the extended survival of SLAB/
Lactococcus species in 32-m ripened cheese not shown previously. The increase in relative abundance of NSLAB varied significantly among trial cheeses, which might have repercussions on the ripening ability of cheeses depending on trial. During the period from 3–6 m to 18–20 m, significant numbers of permeable SLAB cells are present, while the proportion of permeable
Lacticaseibacillus and
Lactobacillus spp. remains low (high viability), indicating their respective potential contributions to converting substrates. The combination of techniques can shift the focus among targets, highlighting the relative abundance of specific species or groups of species according to their physiological state of viability. While qPCR employs specific primers (reducing competition among targets), the use of 16S rRNA gene primers might favor the abundant taxa (SLAB at the beginning and NSLAB at the later stages of ripening) at the expense of lower abundant taxa. Moreover, in the interpretation of such data, potential PCR bias of preferential amplification, which is due to differential efficacy of primers toward target taxa, must be taken into consideration [
60].


