Article

Effect of Intrinsic Tannins on the Fermentation Quality and Associated with the Bacterial and Fungal Community of Sainfoin Silage

Grassland Science, School of Animal Technology, Shihezi University, Shihezi 832000, China
*
Author to whom correspondence should be addressed.
Microorganisms 2022, 10(5), 844; https://doi.org/10.3390/microorganisms10050844
Submission received: 29 March 2022 / Revised: 15 April 2022 / Accepted: 16 April 2022 / Published: 20 April 2022
(This article belongs to the Section Molecular Microbiology and Immunology)

Abstract

:
Sainfoin (Onobrychis viciifolia) is rich in condensed tannins (CT). CT function includes inhibiting bacterial and fungi activity during the ensiling process. We used polyethylene glycol (PEG) to deactivate tannin activity to find out the effects of CT. The results show that the addition of PEG increased dry-matter loss (8.32% vs. 14.15%, on a dry-matter basis) after 60 d of ensiling, and also increased lactic acid (10.90% vs. 15.90%, on a dry-matter basis) and acetic-acid content (7.32% vs. 13.85%, on a dry-matter basis) after 30 d of ensiling. The PEG-treated group increased its Pediococcus relative abundance (0.37–3.38% vs. 7.82–23.5%,) during the ensiling process, increased its Gibellulopsis relative abundance after 3 d of ensiling (5.96% vs. 19.52%), increased its Vishniacozyma relative abundance after 3 d and 7 d of ensiling (2.36% vs. 17.02%, 3.65% vs. 17.17%), and increased its Aspergillus relative abundance after 7 d, 14 d and 60 d of ensiling (0.28% vs. 1.32%, 0.49% vs. 2.84% and 1.74% vs. 7.56%). However, the PEG-treated group decreased its Alternaria relative abundance during entire ensiling process (14.00–25.21% vs. 3.33–7.49%). These results suggest that condensed tannins inhibit lactic-acid bacteria fermentation though reducing Pediococcus activity, and inhibiting fungi activity depending on different strains.

1. Introduction

A large number of agricultural scientists have studied condensed tannins (CT) over more than 50 years. A major focus is interactions of CT with proteins that can generate important agricultural effects, such as protecting forage protein during ensiling and rumen digestion. This protection can improve silage quality and increase the flow of undegraded proteins into the abomasum. CT is also beneficial for the environment, as it leads to reduced greenhouse-gas (methane) emission from ruminants [1]. Various plants contain CT, such as sericea lespedeza (Lespedeza cuneata Dum.-Cours.), crown vetch (Coronilla varia L.), hedysarum (Hedysarum alpinum L.), birdsfoot trefoil (Lotus corniculatus L.) and sainfoin (Onobrychis viciifolia). Among these plants, CT from sainfoin has the highest capacity to bind protein and causes the least inhibition of cellulose digestion by rumen bacteria [2]. Sainfoin is widely cultivated in the Middle East plateaus, Eastern Europe, Asia and North America because of its high organic-matter content and protein digestibility [3]. Sainfoin has the ability to tolerate drought and alkaline soil [4]. Some of the observed advantages of sainfoin for ruminants include decreased nitrogen (N) excretion in urine and increased fecal N excretion, improved organic-matter (OM) and protein digestion, and increased intestinal amino-acid absorption, which is beneficial for the animals [5,6]. It is well-known that when conserving legumes as silage, severe protein degradation occurs, resulting from the combined action of both plant proteases and microbial activity [7]. Limited proteolysis during sainfoin ensiling was attributed to CT binding with proteins and its antimicrobial activity, which supplied more utilizable CP relative to total CP at the duodenum [8]. Several previous studies showed that CT in sainfoin inhibited Escherichia. coli O157:H7 [9,10]; however, this observation depended on CT dose and E. coli strain. It is not clear how the CT in sainfoin affect the bacterial and fungi community and the quality of silage. Polyethylene glycol (PEG) is a commonly used CT-inactivating agent that can be used to study the effect of tannin on silage because it forms stable PEG-CT complexes, attributed to hydrogen bonding between PEG and CT [11]. Previous studies showed that the addition of PEG increased soluble N, nonprotein N, lactic acid (LA), and ammonia N (AN) in purple prairie clover (Dalea purpurea Vent.) silage, and that CT decreased bacterial and fungi diversity during ensiling [12].
To clarify the bacteria and fungi community during ensiling would illuminate the fermentation process of ensiled forage [13]. As far as we know, however, few researchers have focused on the effects of CT on the bacterial and fungi community, and fermentation characteristics in sainfoin silage. Therefore, the present study was conducted to investigate the effects of CT on the bacterial and fungi community, and fermentation characteristics of ensiled sainfoin.

2. Materials and Methods

2.1. Forage and Ensiling

Sainfoin (Onobrychis viciifolia) was planted in Shihezi City, Xinjiang Province, China. Whole-plant sainfoin was harvested in July 2021 at the early flower stage. After wilting for 12 h to a dry-matter (DM) content of approximately 240 g/kg fresh weight, the sample was chopped into 1–2 cm pieces. The sample was then sprayed with a solution of 640 g/L PEG (Sigma, molecular weight 6000) at A rate of 217 mL/kg DM to achieve a CT:PEG ratio of 1:2 in the samples [12]. Prepare 3 separate piles and treated separately, bagged randomly for control and PEG treated groups.The control samples were sprayed with an equivalent amount of distilled water. After spraying, 1000 g samples of both the treated and control chopped sainfoin were packed into a polyethylene plastic bags (30 cm × 50 cm), then compacted and sealed using a vacuum sealer. Three replicates were prepared of the control and treated samples. The bags were stored indoors at 23 °C. Samples were taken from wilted and ensiled sainfoin (days 3, 7, 14, 30 and 60 of silage fermentation) for later analysis.

2.2. Characteristics of Wilted and Ensiled Sainfoin

Silage samples from a separate bag for a total 5(five fermentation days) *2(two treat-ment) *3(replicates) of each silage were collected. Silage samples were dried and ground, using 1.0 mm in preparation for obtaining the DM content. The water-soluble carbohydrates (WSC) were determined by using boiling water for extraction according to the anthrone method [14]. Total nitrogen (TN) was determined on an automatic Kjeldahl nitrogen analyzer (K9840, Hanon Co., Ltd., Qingdao, China) according to the procedure described by Association of Official Agricultural Chemists. Neutral detergent fiber (NDF) and acid detergent fiber (ADF) contents were analyzed using methods previously described [15].
For fermentation characteristics, the sample from each different fermentation day and treated (control and PEG) silage was taken at 20 g, then combined with 180 mL distilled water and thoroughly blended in a homogenizer (L-1BA, Kuansons Biotechnology Co., Ltd., Shanghai, China). After filtering the mixture of sample solution by four layers of cheesecloth, the supernatant was collected for volatile fatty acids (VFA) and AN content analysis. The pH was measured using a portable pH meter (PHS-3C, Instrument and Electrical Science Instrument Co., Ltd., Shanghai, China). AN content was determined by the phenol-hypochlorite colorimetric method [16]. For measuring the volatile fatty-acid content, the supernatant was filtered through a 0.22 μm dialyzer, then analyzed on a 1200 series high-performance liquid chromatography (HPLC) system (Agilent Technologies, Inc., Waldbronn, Germany), using a C18 column (150 mm × 4.6 mm, FMF-5559-EONU, FLM Scientific Instrument Co., Ltd., Guangzhou, China). For the analysis, Na2HPO4 (1 mM) was used for the mobile phase with a flow rate of 0.6 mL·min−1, with an injection volume of 20 μL and oven temperature of 50 °C [4]. The concentrations of extractable, protein-bound, and fiber-bound CT in sainfoin before and after ensiling were analyzed, using CT purified from whole sainfoin plants as a standard, according to previously described methods [17].
Microbial count was carried out according to methods previously described [18]. Briefly, samples were homogenized in 90 mL of sterilized saline, and then the supernatant was serially diluted. Lactic-acid bacteria (LAB) were detected on De Man Rogosa Sharpe (MRS) agar incubating at 37 °C for 48–72 h. Aerobic bacteria were detected on nutrient agar after incubating at 30 °C for 24 h. Yeasts and molds were detected on Rose Bengal agar after incubating at 30 °C for 78–120 h. The microbial data concentrations presented as log-transformed before statistical analysis.

2.3. Sequencing Analysis of the Bacterial Community

Total DNA of each sample was extracted with a commercial DNA Kit (FastDNA® Spin Kit for Soil, MP Biomedicals, New York, NY, USA). Primers targeting the V3-V4 regions of 16S rDNA (338F: ACTCCTACGGGAGGCAGCAG; 806R: GGACTACHVGGGTWTCTAAT) and primers targeting ITS1 regions (ITS1F: 5′-CTTGGTCATTTAGAGGAAGTAA-3′; ITS2R: 5′-GCTGCGTTCTTCATCGATGC-3′) of fungi were used to conduct PCR amplification according to [19,20]. The amplicons were extracted, purified and analyzed following the method described by [21]. Three replicates for each sample were conducted, and a mixture of the three replicates for each sample was sequenced.

2.4. Statistical Analysis

The fermentation characteristics of sainfoin silage data were subjected to Two-way ANOVA, 2 × 5 factorial Complete Randomized design (PEG and control treatments × five ensiling-time days). Data were analyzed using SPSS software (IBM SPSS 22.0 Software, New York, NY, USA). Significant differences between each treatment were determined by Tukey’s test when p < 0.05. The sequencing data of bacterial communities were analyzed using the online Majorbio Cloud Platform, provided by Majorbio Bio-pharm Technology Corporation, Shanghai, China (www.majorbio.com, accessed on 1 February 2022).

3. Results

3.1. Characteristics of Wilted and Ensiling of Sainfoin

The DM, CP and WSC content of wilted sainfoin was 236.50 g/kg, 223.12 g/ kg DM and 101.43 g/kg DM, respectively (Table 1).
The characteristics of sainfoin silages are shown in Table 2.
The extractable CT in sainfoin dropped to 1.96% (on a dry-matter basis) after 3 d of ensiling, and then maintained a constant level during the ensiling process. The protein-bound tannins increased to 6.97% after 3 d of ensiling, and then maintained a constant level during the ensiling process. After 60 d of ensiling, DM losses were 8.32% and 14.15%, respectively. The highest DM loss of the PEG-treated group was observed compared to the control group during the entire ensiling (p < 0.05). AN content showed the same results as DM loss during ensiling, which were 1.60 g/kg DM and 2.64 g/kg DM after 60 d of ensiling, respectively. The pH dropped to 4.3 for both the control and PEG-treated groups after 60 d of ensiling. There was no difference in pH between the control and PEG-treated groups during the entire ensiling (p > 0.05). The significant difference was found only in LA and acetic acid (AA) content between the control and PEG-treated groups after 30 d of ensiling (p < 0.05), which were 108.99 g/kg vs. 158.89 g/kg and 73.15 g/kg vs. 138.47 g/kg, respectively. The AA content in both treatments was high (>10%, on a dry-matter basis) after 60 d of ensiling. There was no difference of LA to AA ratio between control and PEG-treated groups during the entire ensiling (p > 0.05), and this ratio was below 3 during ensiling. The LAB counts were highest in both the control and PEG-treated groups after 3 d of ensiling, which were 9.04 Log10 cfu/g FM and 9.19 Log10 cfu/g, respectively. The PEG-treated group showed a higher trend in LAB count compared with the control group during ensiling, and this trend became a significant difference after 7 d, 30 d and 60 d of ensiling (p < 0.05). The mold count had the same trend as the LAB count during ensiling, which showed a significant difference after 3 d, 30 d and 60 d of ensiling (p < 0.05). The yeast count showed significant difference between the control and PEG-treated groups after 3 d of ensiling (p < 0.05), which were 3.82 Log10 cfu/g FM and 4.33 Log10 cfu/g FM, respectively.

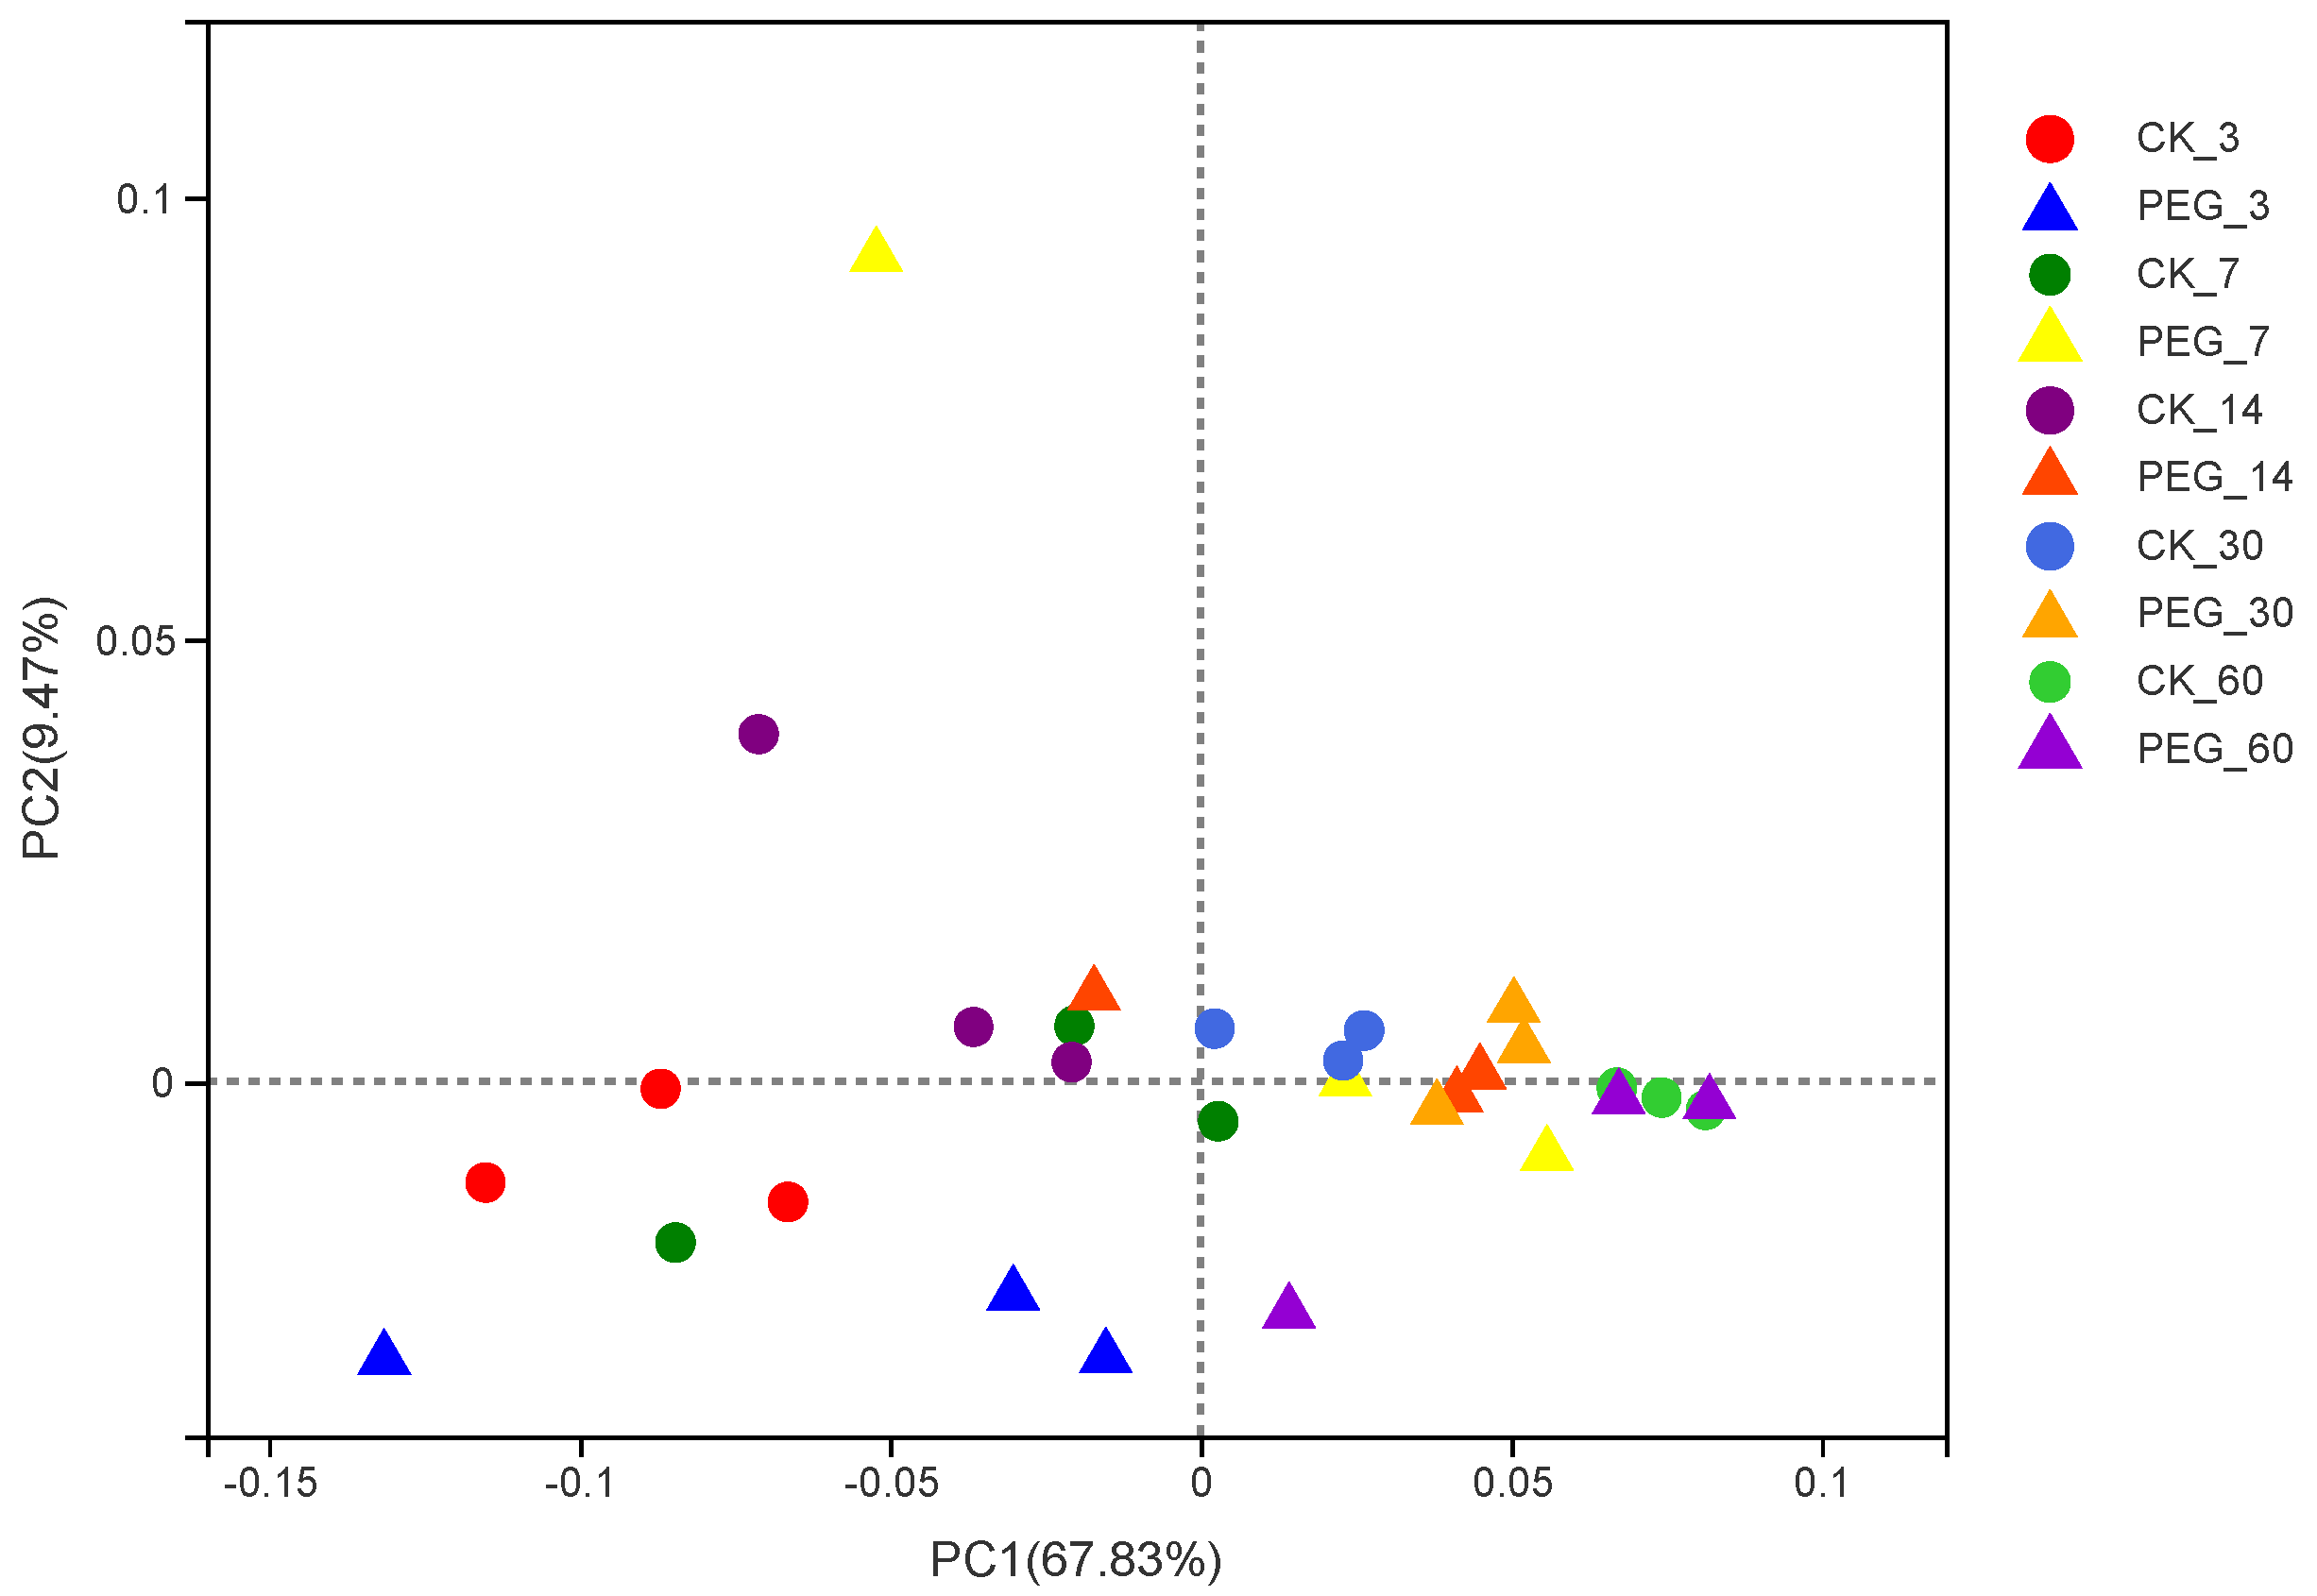
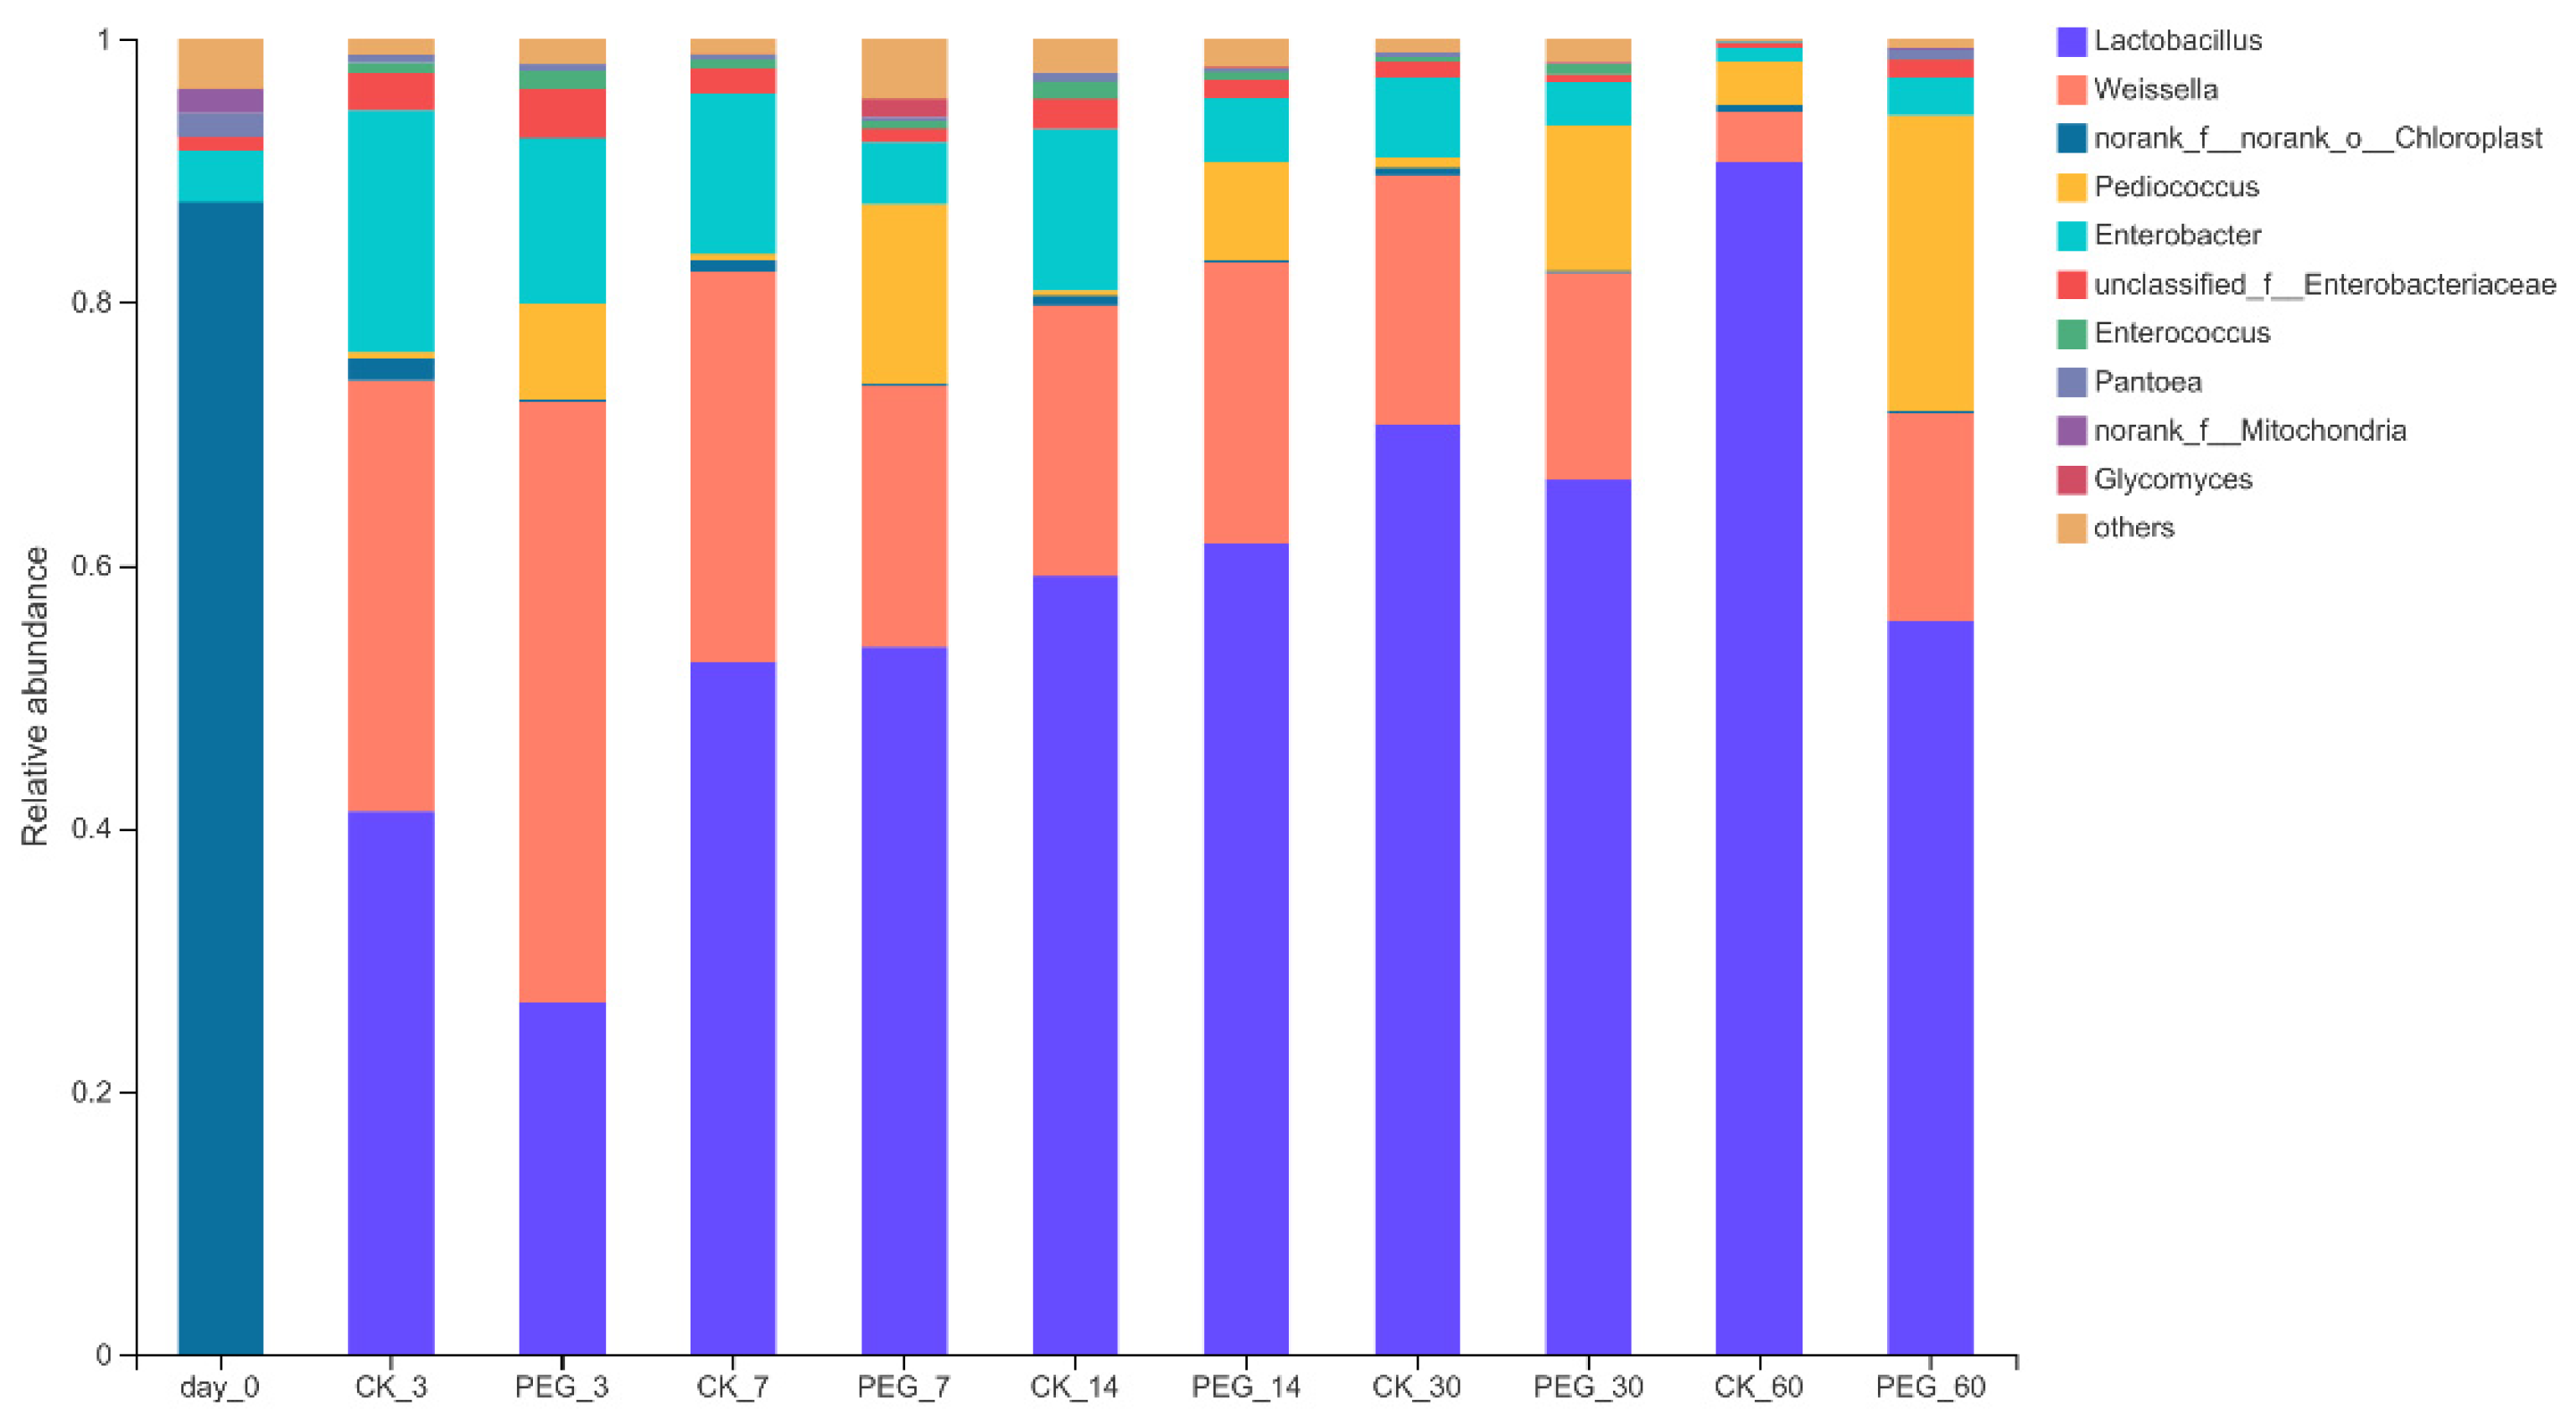
3.2. Bacterial Community of Sainfoin Silage

Alpha diversity of the bacterial community for sainfoin silage is shown in Table 3.
The Good’s coverage index was higher than 0.99, indicating that the degree of sequencing was sufficient for the bacterial community analysis. With or without PEG, the richness of the microbial community in sainfoin decreased during ensiling. The richness and diversity of the microbial community increased in sainfoin with PEG treatment at 30 d. However, there was no difference in the microbial community richness and diversity between silage with or without PEG at 60 d of ensiling. In addition, using a weighted uniFrac distance to assess the bacterial communities, a clear distinction was found between the bacterial communities in the control and PEG-treated silage at 30 d of ensiling (Figure 1; p < 0.01; R = 0.7587).
This may indicate that the impact of tannins on microbial activity at 60 d is not pronounced, likely because the diversity of the microbial community decreased with the increase in the number of dominant bacteria.
The bacterial community of sainfoin at the phylum level before and after ensiling is shown in Figure 2.
In the wilted sainfoin, Cyanobacteria (87.54%) was the predominant phylum, followed by Proteobacteria (9.85%), Firmicutes (1.2%), and Actinobacteria (1.05%).
Analyzing the bacterial community on the genus level (Figure 3) showed that there was a significant difference between the control and PEG silages. In general, Weissella, Lactobacillus, Enterobacter and Pediococcus were the four richest bacterial communities on the genus level. During the ensiling process, the Lactobacillus relative abundance increased as the days of ensiling increased. The Lactobacillus relative abundance of the control and PEG groups was 42.06–90.56% and 27.4–69.92%, respectively. The Enterobacteria relative abundance decreased with ensiling days, with a relative abundance for the control and PEG groups at 1.04–11.92% and 2.78–12.66%, respectively. The Weissella relative abundance slightly decreased after 7 d of ensiling, then stabilized until 30 d of ensiling in the control silage. After 60 d of ensiling, the Weissella relative abundance dropped considerably to 3.85% in the control silage. The Weissella relative abundance in the PEG silage decreased slightly for 7 d but stabilized for the remaining ensiling. Pediococcus showed the most significant difference in relative abundance of the LAB bacteria (p < 0.05), with the Pediococcus relative abundance for the control and PEG group at 0.37–3.38% and 7.82–23.5%, respectively.
Lactobacillus was the main genus (42.06%) in the control silages at 3 d of ensiling, followed by Weissella (31.83%), and Enterobacter (17.96%), with the Pediococcus relative abundance being the lowest (0.50%). For the PEG group, Weissella became the main genus in silages at 3 d of ensiling (42.57%), followed by Lactobacillus (27.4%), Enterobacter (12.66%) and Pediococcus (7.92%). However, there was no significant difference (p > 0.05) between these four bacteria on the genus level between the control and PEG silage at 3 d of ensiling. During ensiling, a significant difference (p < 0.05) in Pediococcus relative abundance between control and PEG silages was found after 7 d of ensiling, with the control and PEG silage Pediococcus relative abundance at 0.37% and 14.2%, respectively. This same significant difference for Pediococcus relative abundance between control and PEG silages was no longer present at 60 d of ensiling. This suggests that CT affected the activity of Pediococcus primarily in the early and middle ensiling stages.

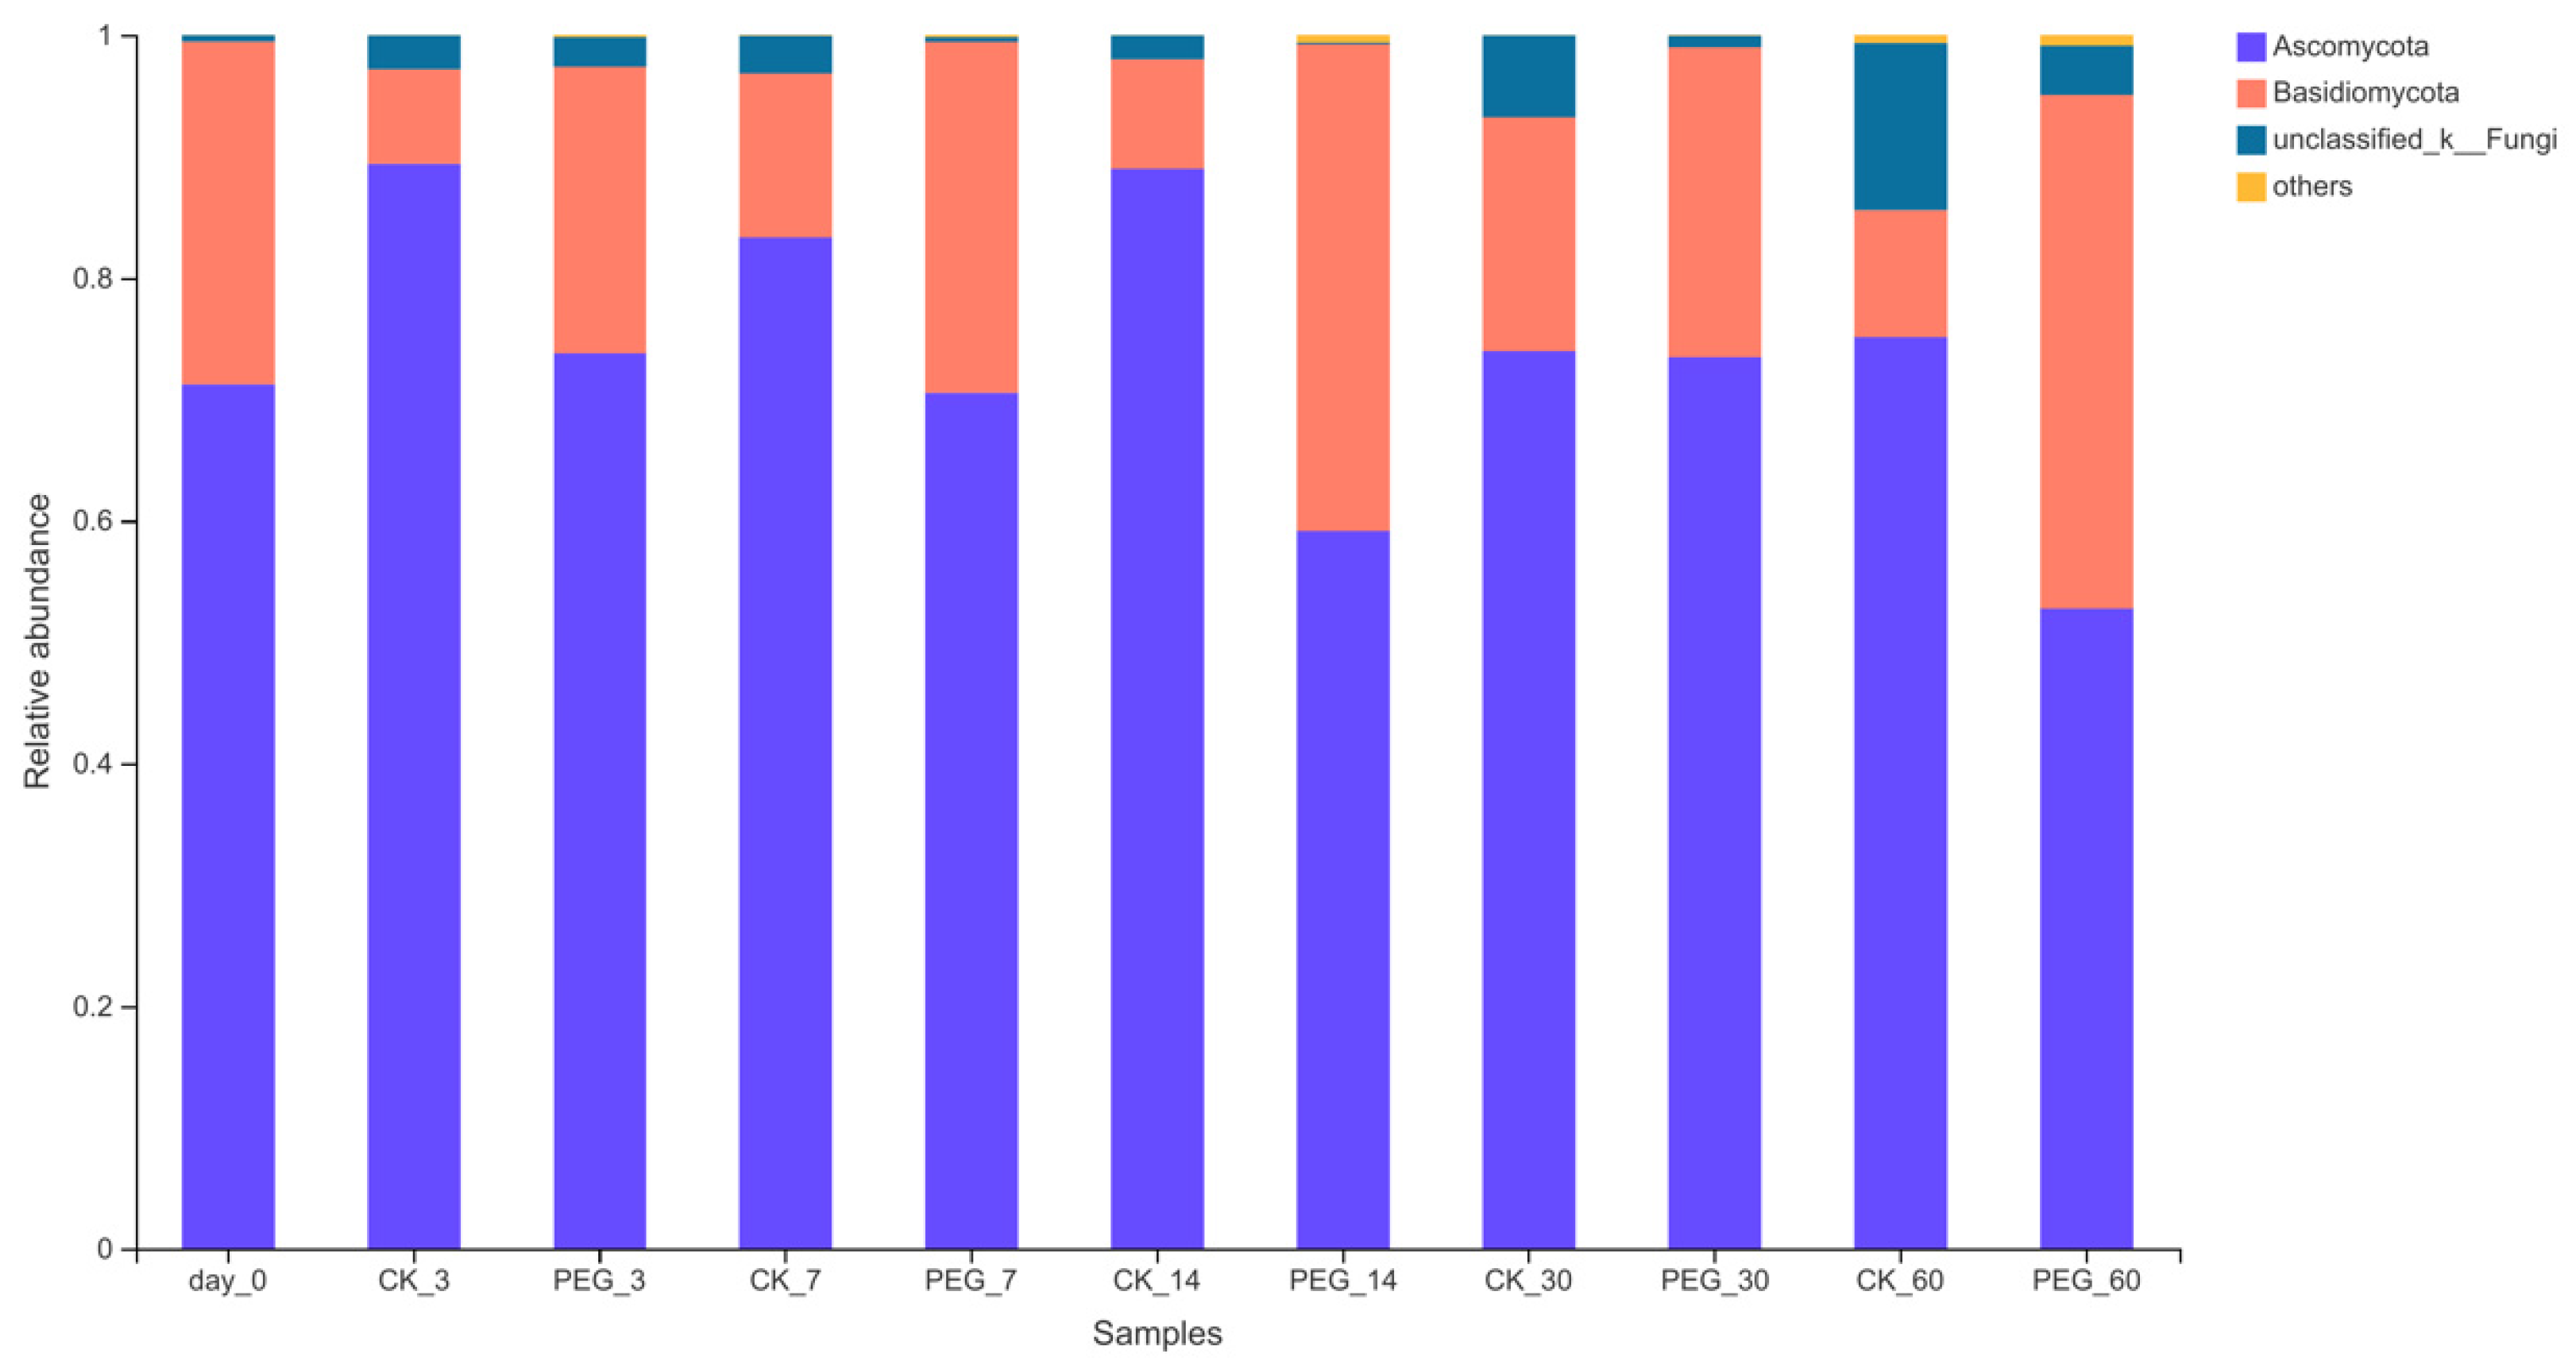
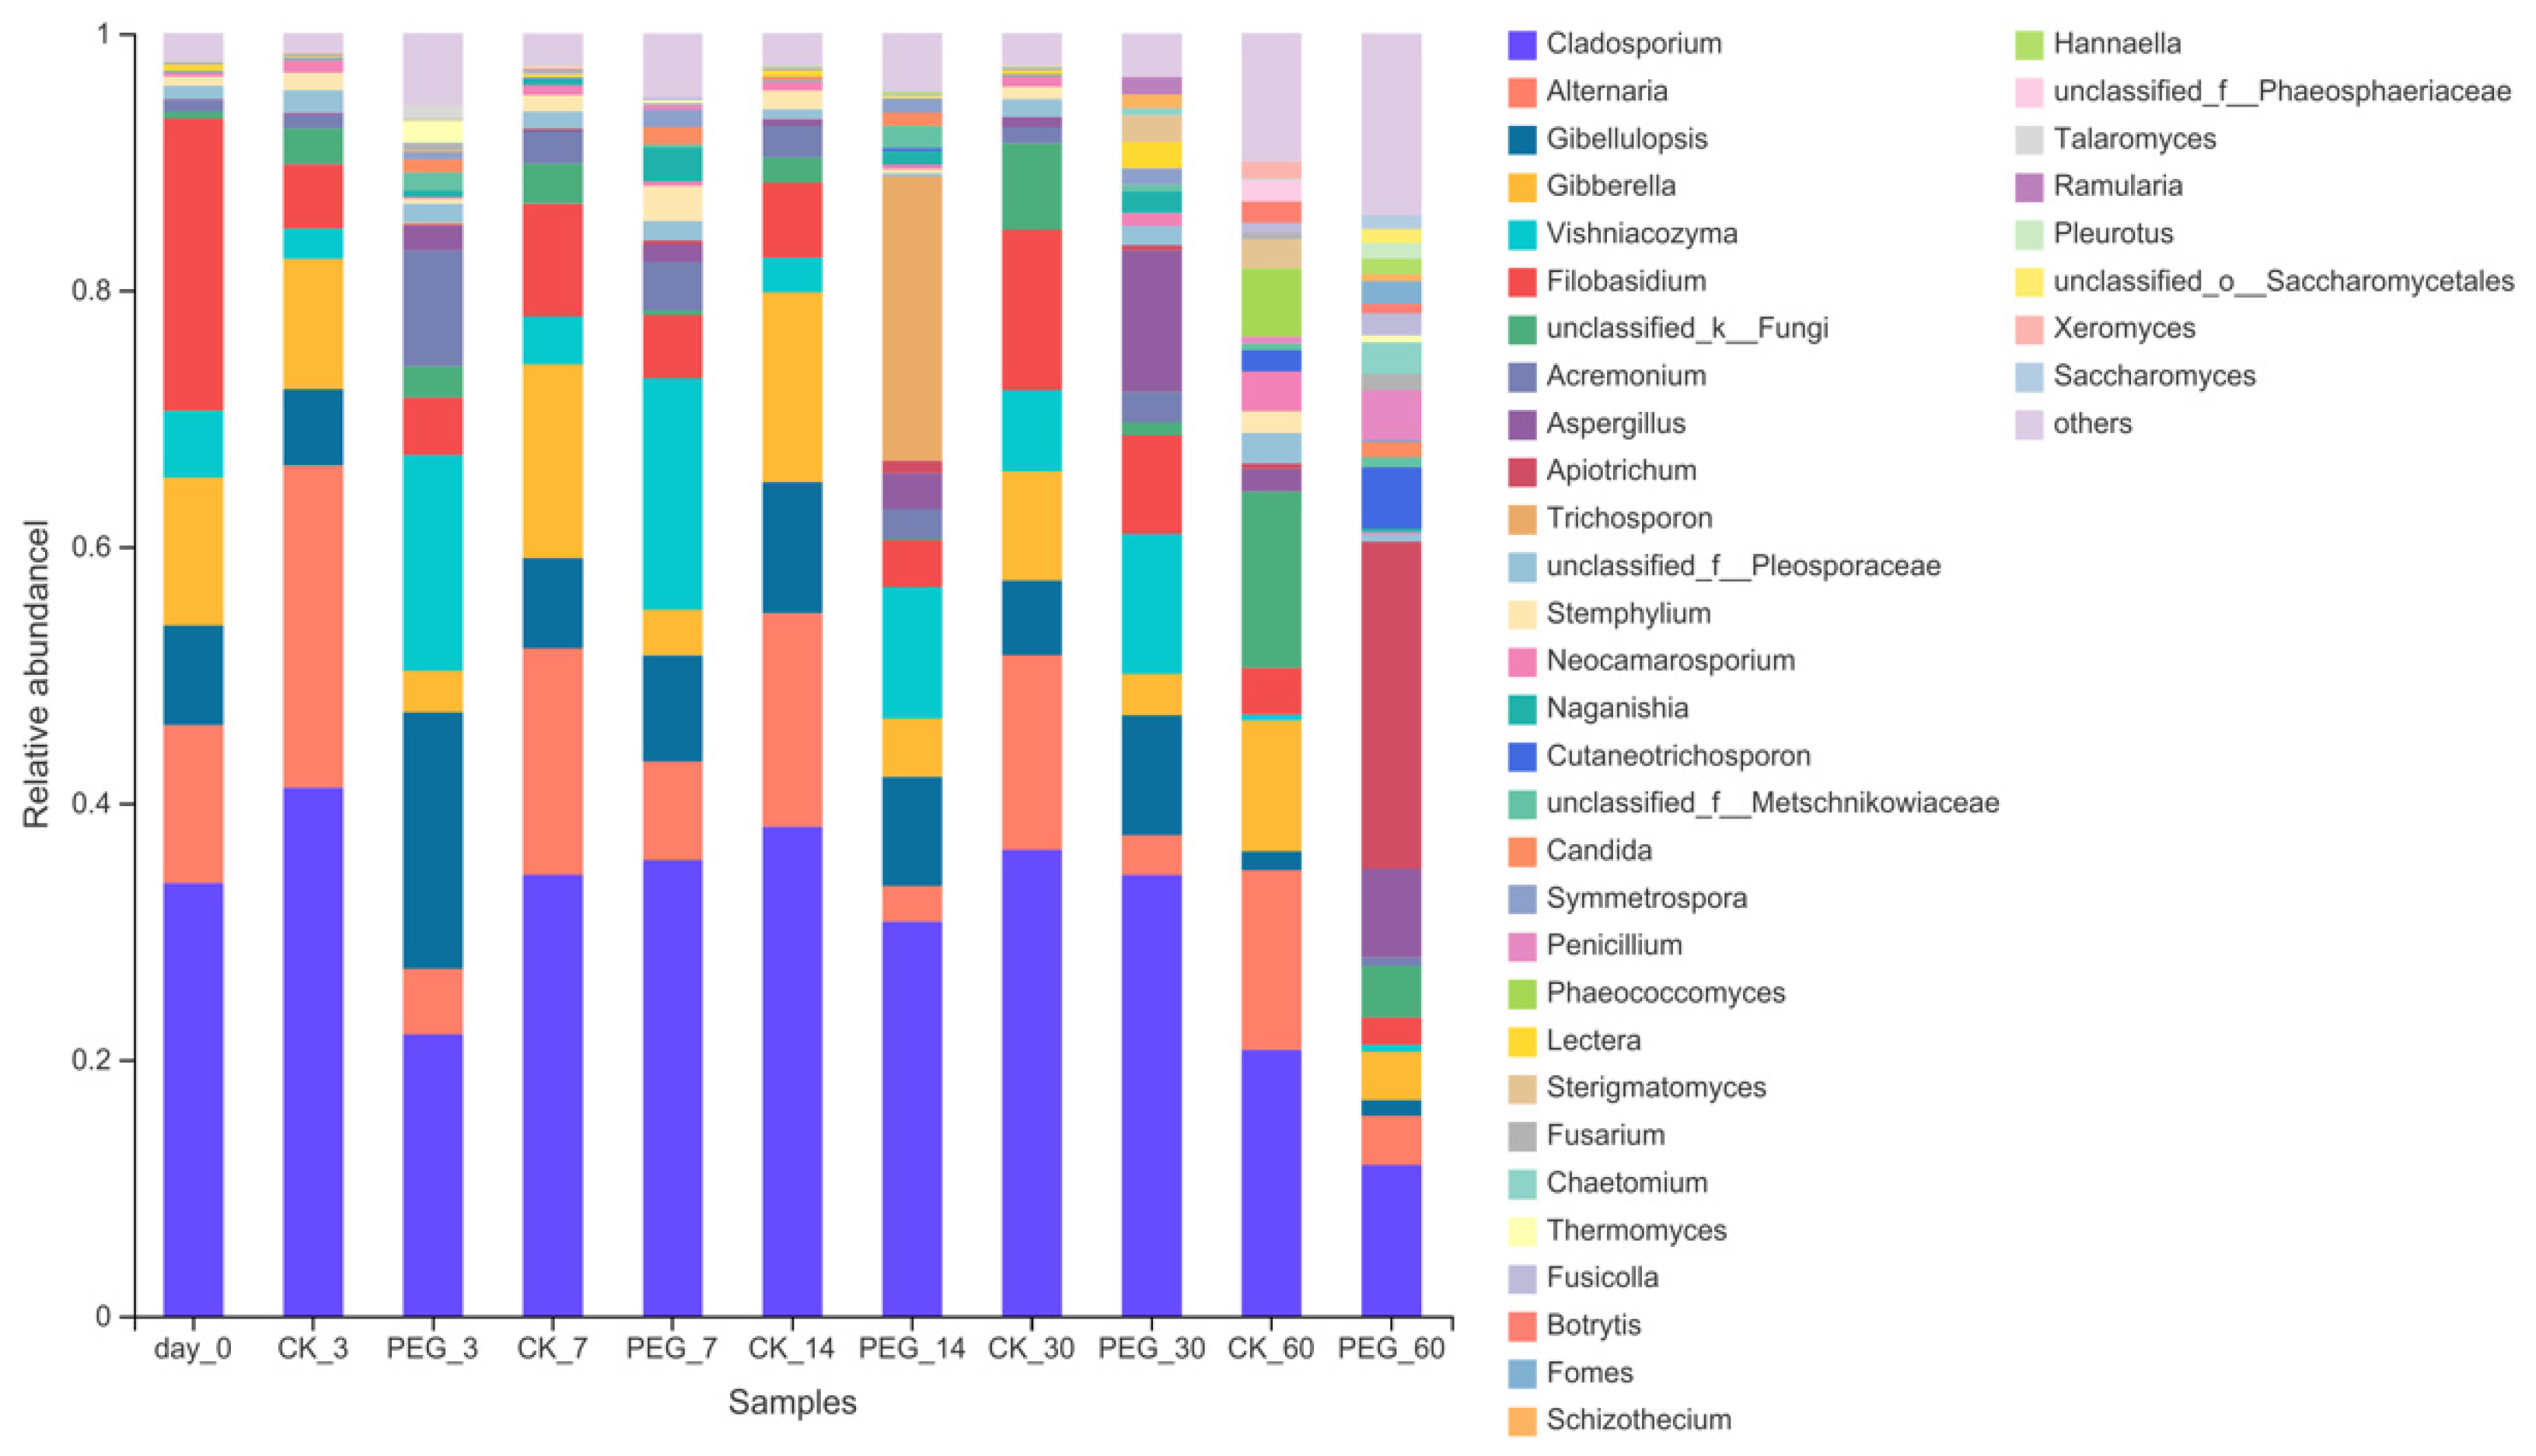
3.3. Fungi Community of Sainfoin Ensiled with or without PEG

Alpha diversity of fungi community show in Table 4.
As a result, the richness of the microbial community decreased in both the control and treated groups with prolonged ensiling. Addition with PEG, however, increased (p < 0.05) the diversity of the microbial community after 3 days of ensiling. There was no difference (p > 0.05) in microbial-community diversity between the control and PEG treatments during ensiling days 7 to ensiling days 60. Addition with PEG decreased (p < 0.05) the richness of the microbial community during 30 days of ensiling. In addition, weighted UniFrac distance was used to assess fungi communities, as shown in Figure 4.
The fungi community of sainfoin at phylum level before and after ensiling are shown in Figure 5.
Ascomycoto were dominant in all group silages with a relative abundance of 59.51–89.43%, followed by Basidiomycota (7.78–39.18%).
Analysis of the fungi community on a genus level is shown in Figure 6.
Cladosporium dominated in wilted sainfoin with a relative abundance of 34.81%, followed by Filobasidium (21.28%), Alternaria (12.39%), Gibberella (11.55%), Gibellulopsis (7.95%) and Vishniacozyma (4.95%). Cladosporium dominated in control groups during entire ensiling with a relative abundance of 20.68–41.30%, followed by Alternaria (14.00–25.21%). Cladosporium dominated in PEG groups during 30 days of ensiling. Addition with PEG increased Gibellulopsis relative abundance after 3 days of ensiling (5.96% vs. 19.52%) and Vishniacozyma relative abundance after 3 days and 7 days of ensiling (2.36% vs. 17.02%, 3.65–17.17%). Addition with PEG increased Aspergillus relative abundance after 7 days, 14 days and 60 days of ensiling (0.28% vs. 1.32%,0.49% vs. 2.84% and 1.74% vs. 7.56%). Addition with PEG decreased Alternaria relative abundance during 60 days of ensiling (14.00–25.21% vs. 3.33–7.49%), Gibberella relative abundance after 3 days and 7 days of ensiling (10.07% vs. 3.22% and 15.05% vs. 3.77%) and Cladosporium relative abundance after 3 days of ensiling (41.30% vs. 22.05%).

4. Discussion

Levels of CT greater than 6% have shown a strong ability to inhibit bacterial activity and protein degradation in silage [18]. In addition, tannic acid is a type of polyphenol substance analogous to CT (both are a complex group of polyphenolic compounds), and 2% tannic acid can inhibit activity in certain bacteria, including lactic acid and coliform bacteria, and decreased protein degradation during ensiling [22]. The CT content-level results suggest that there is biological activity of CT in sainfoin materials. The epiphytic microorganisms and WSC are both important factors for silage fermentation. A WSC content of at least 60 g·kg−1 DM is the common threshold level for achieving well-preserved silage [14]. In this study, the WSC content was 101.43 g·kg−1 DM, which is sufficient for fermentation. LAB counts in the silage were higher than those of the spoilage organisms in wilted sainfoin, such as molds and yeasts, which might be favorable to the establishment of a dominant LAB community during fermentation.
Previous studies found that protein-bound CT increased because the extractable CT decreased after ensiling [23]. The present study found that extractable tannins bound more protein, then stabilized quickly in the early stage of ensiling. The protein-bound CT stabilized because of pH; CT bound to fraction 1 leaf protein from alfalfa stabilized at pH 4–6 [11]. In the current study, the pH ranged from 4.32–5.41 during the ensiling process. The LA and AA ratio indicates fermentation type: a high LA-to-AA ratio (>3) indicates homolactic fermentation, whereas a lower LA-to-AA ratio (<3) indicates heterolactic fermentation [24]. The control and PEG-treated groups LA-to-AA ratio (<3) during the entire ensiling process suggested a heterolactic fermentation. Notably, however, there was no difference in pH between the control and PEG-treated silages during the entire ensiling process. The higher buffering capacity for legumes (500–550 mE/kg of DM for legumes) was likely the reason for these results [25]. Legume silages generally have a final pH of 4.4–4.5 [26]; in this study, pH was 4.3 in both groups after 60 d of ensiling, which indicates adequate quality for silage. The addition of PEG significantly increased DM loss during the entire ensiling process. These results suggest that PEG likely enhanced the activity of silage microbes. Consistently, PEG significantly increased LA and AA contents, as well as LAB counts after 30 d of ensiling. WSC is the main substrate for LAB fermentation. WSC content dropped 60% of from the initial content after 3 d for both control and PEG-treated groups, suggesting that the raw material had a sufficient LAB number for fermentation. The WSC content were lowest in PEG-treated silages during the entire ensiling, likely resulting from higher LAB activity in treated silage compared to control. LAB converted WSC into organic acids, rapidly reducing pH and preserving silages [14]. These results suggest that CT inhibits LAB activity during ensiling. The antibacterial mechanisms of catechins can be broadly classified into inhibition of virulence factors (toxins and extracellular matrix), cell-wall and cell-membrane disruption, inhibition of intracellular enzymes, oxidative stress, DNA damage and iron chelation of six groups [27]. Four types of catechins are the main components of CT in sainfoin [6], suggesting that CT likely has the same antibacterial mechanisms. Several studies confirmed that CT from sainfoin inhibited bacterial via inhibition of intracellular enzymes, and disrupted cell-wall and cell-membrane integrity [10,28].
Yeast activity in silage usually causes nutrient loss during ensiling. Yeast activity is enhanced by ensiling during the beginning stage due to the aerobic environment, then decreased as the silage pH and oxygen is reduced. AA is recognized as an important yeast inhibitor. Here, yeast counts decreased with the accumulation of AA during the ensiling process for both silage groups. Similar levels of AA were found in the control and PEG silages for the duration of the ensiling process, except at 30 d of fermentation. However, a significant difference between yeast counts was only found at 3 d of fermentation, when control and PEG silage yeast counts were 3.82 and 4.33 log10 CFU g−1 FM, respectively. The results suggest that AA was not the sole inhibitor of yeast in these silages. Studies have found that CT-inhibited yeast grow during the ensiling process in a species-dependent manner [12]. It can therefore be concluded that CT and AA both affect the yeast population in silage.
After 60 d of ensiling, Firmicutes became the dominant phylum in both groups, with a relative abundance of 94.52–97.97%; however, the Cyanobacteria relative abundance dropped to 0.12–0.49%. Similar results were observed in [18], except in this study no difference of bacterial relative abundance was found at the phylum level between the control and PEG groups. Such a discrepancy in different studies indicates that there are differences in the bacterial succession in silages using different raw materials, even if the raw materials contain the same type of bacterial communities.
Lactobacillus were the main genus in the control and PEG groups during ensiling. The Lactobacillus relative abundance (90.56%) was much higher after 60 d of ensiling in the control silages. This is because other bacteria in the community dropped to their lowest level at this stage. Some species of Lactobacillus, such as Lactobacillus plantarum NBRC15891, Lactobacillus fermentum NBRC15885 and Lactobacillus delbrueckii NBRC3073 have a strong tolerance for catechins [29]. Since CT in sainfoin contain four types of catechins, this suggest that the CT in sainfoin have little impact on Lactobacillus activity in the ensiling process.
The various Pediococcus are facultative heterofermentative LAB, and produce LA and AA by fermenting hexoses and pentoses, respectively [30]. In this study, PEG-treated silage resulted in a significantly higher relative abundance of Pediococcus than the control silages from 7 d to 30 d of ensiling (p < 0.05). Similar results were found with purple prairie clover silage with added PEG [12]. Some strains of Pediococcus species isolated from forage can grow in a 3.5–6.0 pH environment [31]. Furthermore, Pediococcus species growth and proliferation are well under a pH range of 4.3–4.9 in sainfoin and alfalfa-mixture silages [32]. In this study, the pH ranged from 4.34–4.8 during ensiling. These results indicate that the pediococcus relative abundance may not be affected by pH during ensiling. During the ensiling process, acidity, substrate availability, aerobiosis, moisture, or temperature could affect the fermentation and LAB succession during the ensiling process [33]. In this study, there was no difference in pH between the control and PEG silages. After 60 d of fermentation, the WSC consumption for the control and PEG silages was 69.35% and 76.99% of the initial content, respectively. This observation suggested that the ensiling process was not substrate-limited. Hence, CT strongly influenced LAB succession, particularly for Pediococcus.
Enterobacteria relative abundance decreased with increasing ensiling days, consistent with the pH decrease from 5.2 to 4.3. The critical pH for Enterobacteria was 4.5 [34]. Once the pH dropped below 4.5, Enterobacteria were inhibited [35]. The PEG-treated group had no effect on Enterobacteria relative abundance compared to control silages. However, the lowest AN level was found in control silage throughout the silage-fermentation process. This seems to disagree with the general assumption that the production of AN in silage usually results from the activity of Enterobacteria if Clostridia are not detected (in the present study, Clostridia was not detected) [25]. In addition, as plant tissue gradually breaks down in prolonged silage and releases intracellular enzymes, or as the pH condition became more favorable to the enzymes, plant proteases have an increased effect on protein degradation [18]. Thus, AN content may mainly come from protein degradation by plant proteases.
Fusarium and Alternaria are often considered as field fungi; Penicillium and Aspergillus are storage fungi. Those fungi are usually considered toxin producers. Fusarium, Alternaria and Cladosporium can produce mycotoxins during their growth by infections of grass, resulting in forage crops already containing toxins before being ensiled or grazed [36]; however, very few studies on detection and/or isolation of Cladosporium species from silages [37]. The Cladosporium were dominant fungi in sainfoin silages, which is in agreement with others observed [12,37]. Gibberella is a sexual form of Fusarium. Fusarium is an important toxin-producing fungus; however, several studies observed that mycotoxins produced by Fusarium were already present at the harvest and contents were stabled in silage [38,39]. Furthermore, the main mycotoxin from Fusarium is trichothecenes, which is involved in the plant-infection process. Thus, these traits are not needed for Fusarium growth on harvested silage [40]. As results indicate, addition with PEG decreased Gibberlla relative abundance; however, those impacts may not affect mycotoxin contents in silage. Vishniacozyma exists in plants such as alfalfa, maize and wheat crops [41]. The present study also found Vishniacozyma activity during 30 d of ensiling.
In general, field fungi activity decreased with prolonged ensiling; however, storage fungi activity increased during ensiled. A previous study observed that Alternaria relative abundance decreased; however, Aspergillus relative abundance increased in maize silage [42]. The present study showed the same results when the effect of ensiling days was considered. Significantly, there was the lowest relative abundance of Alternaria in PEG treatment during the entire ensiling. The results suggested that CT probably promotes Alternaria activity during sainfoin ensiling. However, the mechanism of CT promoting Alternaria activity during sainfoin ensiling needs further study. As a storage fungus, Aspergillus can grow under different environments of silage, such as lower oxygen and pH levels [43,44]. A previous study (in vitro) showed that CT extract from Mimosa tenuiflora (Willd.) bark can inhibit Aspergillus flavus growth. The present study showed that relative abundance increased in both groups with prolonged ensiling; however, addition with PEG increased its relative abundance after 7, 14 and 60 days of ensiling. The results suggested that CT might inhibit Aspergillus growth in sainfoin silages.

5. Conclusions

The CT in sainfoin significantly decreased DM loss, content of LA, AA and AN during ensiling. At the same time, CT inhibited bacterial richness and diversity, particularly for Pediococcus. CTs in sainfoin have little inhibitive effect on Vishniacozyma activity; however, CT showed strong inhibit effect on Aspergillus activity during sainfoin ensiling. On the contrary, CTs have no inhibit effect on Alternaria activity, but CT probably promotes its growth. This study indicated that CT from sainfoin can inhibit LAB fermentation by reducing Pediococcus activity and inhibiting fungi activity, depending on different strains.

Author Contributions

R.H.: Conceptualization, methodology, writing—review and editing; F.Z.: resources, validation, supervision; T.W.: resources, investigation; X.L.: resources; Y.Z.: resources, investigation; Y.C.: resources; C.M.: conceptualization, methodology, visualization. All authors have read and agreed to the published version of the manuscript.

Funding

This work was financially supported by the China Agriculture Research System of MOF and MARA (CARS).

Data Availability Statement

The data supporting characteristics of fermentation and wilted sainfoin can be found at Mendeley Data: https://doi.org/10.17632/rxsjb8vw6b.1 (accessed on 26 March 2022). The data supporting the bacteria and fungi community of Sequence Read Archive (SRA) can be found at National Center for Biotechnology Information (NCBI). SRA number for fungi: PRJNA811366. SRA number for bacteria: PRJNA796365 (accessed on 26 March 2020).

Conflicts of Interest

The authors declare that they have no known competing financial interest or personal relationship that could have appeared to influence the work reported in this paper.

References

  1. Zeller, W.E. Activity, Purification, and Analysis of Condensed Tannins: Current State of Affairs and Future Endeavors. Crop Sci. 2019, 59, 886–904. [Google Scholar] [CrossRef]
  2. McAllister, T.A.; Martinez, T.; Bae, H.; Muir, A.; Yanke, L.; Jones, G. Characterization of Condensed Tannins Purified from Legume Forages: Chromophore Production, Protein Precipitation, and Inhibitory Effects on Cellulose Digestion. J. Chem. Ecol. 2005, 31, 2049–2068. [Google Scholar] [CrossRef]
  3. Xu, D.M.; Ding, Z.T.; Wang, M.S.; Bai, J.; Ke, W.C.; Zhang, Y.X.; Guo, X.S. Characterization of the Microbial Community, Metabolome and Biotransformation of Phenolic Compounds of Sainfoin (Onobrychis viciifolia) Silage Ensiled with or without Inoculation of Lactobacillus Plantarum. Bioresour. Technol. 2020, 316, 123910. [Google Scholar] [CrossRef] [PubMed]
  4. Azuhnwi, B.; Boller, B.; Martens, M.; Dohme-Meier, F.; Ampuero, S.; Gunter, S.; Kreuzer, M.; Hess, H.D. Morphology, Tannin Concentration and Forage Value of 15 Swiss Accessions of Sainfoin (Onobrychis viciifolia) as Influenced by Harvest Time and Cultivation Site. Grass Forage Sci. 2011, 66, 474–487. [Google Scholar] [CrossRef]
  5. Theodoridou, K.; Aufre`re, J.; Andueza, D.; Le Morvan, A.; Picard, F.; Stringano, E.; Pourrat, J.; Mueller-Harvey, I.; Baumont, R. Effect of Plant Development during First and Second Growth Cycle on Chemical Composition, Condensed Tannins and Nutritive Value of Three Sainfoin (Onobrychis viciifolia) Varieties and Lucerne. Grass Forage Sci. 2011, 66, 402–414. [Google Scholar] [CrossRef]
  6. Wang, Y.; McAllister, T.A.; Acharya, S. Condensed Tannins in Sainfoin: Composition, Concentration, and Effects on Nutritive and Feeding Value of Sainfoin Forage. Crop Sci. 2015, 55, 13–22. [Google Scholar] [CrossRef]
  7. Cavallarin, L.; Antoniazzi, S.; Borreani, G.; Tabacco, E. Effects of Wilting and Mechanical Conditioning on Proteolysis in Sainfoin (Onobrychis Viciffolia) Wilted Herbage and Silaget. J. Sci. Food Agric. 2005, 85, 831–838. [Google Scholar] [CrossRef]
  8. Brinkhaus, A.G.; Wyss, U.; Arrigo, Y.; Girard, M.; Bee, G.; Zeitza, J.O.; Kreuzer, M.; Dohme-Meier, F. In Vitro Ruminal Fermentation Characteristics and Utilisable CP Supply of Sainfoin and Birdsfoot Trefoil Silages and Their Mixtures with Other Legumes. Animal 2017, 11, 580–590. [Google Scholar] [CrossRef] [Green Version]
  9. Berard, N.C.; Holley, R.A.; McAllister, T.A.; Ominski, K.H.; Wittenberg, K.M.; Bouchard, K.S.; Bouchard, J.J.; Krause, D.O. Poten- Tial to Reduce Escherichia Coli Shedding in Cattle Feces by Using Sainfoin (Onobrychis viciifolia) Forage, Tested in Vitro and in Vivo. Appl. Environ. Microbiol. 2009, 75, 1074–1079. [Google Scholar] [CrossRef] [Green Version]
  10. Liu, X.L.; Hao, Y.Q.; Jin, L.; Xu, Z.J.; McAllister, T.A. Anti-Escherichia Coli O157:H7 Properties of Purple Prairie Clover and Sainfoin Condensed Tannins. Molecules 2013, 18, 2183. [Google Scholar] [CrossRef]
  11. Jones, W.T.; Mangan, J.L. Complexes of the Condensed Tannins of Sainfoin (Onobrychis viciifolia) with Fraction 1 Leaf Protein and with Submaxillary Mucoprotein, and Their Reversal by Polyethylene Glycol and PH. J. Sci. Food Agric. 1977, 28, 126–136. [Google Scholar] [CrossRef]
  12. Peng, K.; Jin, L.; Niu, Y.D.; Huang, Q.; McAllister, T.A.; Yang, H.E.; Denise, H.; Xu, Z.; Acharya, S.; Wang, S.; et al. Condensed Tannins Affect Bacterial and Fungal Microbiomes and Mycotoxin Production during Ensiling and upon Aerobic Exposure. Appl. Environ. Microbiol. 2018, 84, e02274. [Google Scholar] [CrossRef] [PubMed] [Green Version]
  13. Bai, J.; Xu, D.; Wang, M.; Li, Z.; Guo, X. Effects of Antibacterial Peptide-Producing Bacillus Subtilis and Lactobacillus Buchneri on Fermentation, Aerobic Stability, and Microbial Community of Alfalfa Silage. Bioresour. Technol. 2020, 315, 123881. [Google Scholar] [CrossRef] [PubMed]
  14. Ren, H.; Feng, Y.; Pei, J.; Li, J.; Wang, Z.; Fu, S.; Zheng, Y.; Li, Z.; Peng, Z. Effects of Lactobacillus Plantarum Additive and Temperature on the Ensiling T Quality and Microbial Community Dynamics of Cauliflower Leaf Silages. Bioresour. Technol. 2020, 307, 123238. [Google Scholar] [CrossRef] [PubMed]
  15. Van Soest, P.J.; Robertson, J.B.; Lewis, B.A. Methods for Dietary Fiber, Neutral Detergent Fiber, and Nonstarch Polysaccharides in Relation to Animal Nutrition. J. Dairy Sci. 1991, 74, 3583–3597. [Google Scholar] [CrossRef]
  16. Weatherburn, M.W. Phenol-Hypochlorite Reaction for Determination of Ammonia. Anal. Chem. 1967, 39, 971–974. [Google Scholar] [CrossRef]
  17. Terrill, T.H.; Rowan, A.M.; Douglas, G.B.; Barry, T.N. Determination of Extractable and Bound Condensed Tannin Concentrations in Forage Plants, Protein Concentrate Meals and Cereal Grains. J. Sci. Food Agric. 1992, 58, 321–329. [Google Scholar] [CrossRef]
  18. He, L.; Lv, H.; Xing, Y.; Chen, X.; Zhang, Q. Intrinsic Tannins Affect Ensiling Characteristics and Proteolysis of Neolamarckia Cadamba Leaf Silage by Largely Altering Bacterial Community. Bioresour. Technol. 2020, 311, 123496. [Google Scholar] [CrossRef]
  19. Ni, K.K.; Wang, F.F.; Zhu, B.G.; Yang, J.X.; Zhou, G.A.; Pan, Y.; Tao, Y.; Zhong, J. Effects of Lactic Acid Bacteria and Molasses Additives on the Microbial Community and Fermentation Quality of Soybean Silage. Bioresour. Technol. 2017, 238, 706–715. [Google Scholar] [CrossRef]
  20. Adams, R.I.; Miletto, M.; Taylor, J.W.; Bruns, T.D. Dispersal in Microbes: Fungi in Indoor Air Are Dominated by Outdoor Air and Show Dispersal Limitation at Short Distances. ISME J. 2013, 7, 1460. [Google Scholar] [CrossRef] [Green Version]
  21. Su, R.N.; Ni, K.K.; Wang, T.W.; Yang, X.P.; Zhang, J.; Liu, Y.Y.; Shi, W.X.; Yan, L.; Jie, C.; Zhong, J. Effects of Ferulic Acid Esterase-Producing Lactobacillus Fermentum and Cellulase Additives on the Fermentation Quality and Microbial Community of Alfalfa Silage. PeerJ 2019, 7, e7712. [Google Scholar] [CrossRef] [PubMed] [Green Version]
  22. Wang, C.; Pian, R.Q.; Chen, X.Y.; Lv, H.J.; Zhou, W.; Zhang, Q. Beneficial Effects of Tannic Acid on the Quality of Bacterial Communities Present in High-Moisture Mulberry Leaf and Stylo Silage. Front. Microbiol. 2020, 11, 586412. [Google Scholar] [CrossRef] [PubMed]
  23. Rufino-Moya, P.J.; Blanco, M.; Bertolin, J.R. Joy Effect of the Method of Preservation on the Chemical Composition T and in Vitro Fermentation Characteristics in Two Legumes Rich in Condensed Tannins. Anim. Feed Sci. Technol. 2019, 251, 12–20. [Google Scholar] [CrossRef]
  24. Ali, N.; Wang, S.R.; Zhao, J.; Dong, Z.H.; Li, J.F.; Nazar, M.; Shao, T. Microbial Diversity and Fermentation Profile of Red Clover Silage Inoculated with Reconstituted Indigenous and Exogenous Epiphytic Microbiota. Bioresour. Technol. 2020, 314, 123606. [Google Scholar] [CrossRef]
  25. McDonald, P.; Henderson, A.R.; Herson, S. The Biochemistry of Silage; Chalcombe Publications: Kent, UK, 1991; pp. 256–271. [Google Scholar]
  26. Chen, L.Y.; Qu, H.; Bai, S.Q.; Yan, L.J.; You, M.H.; Gou, W.L.; Li, P.; Gao, F. Effect of Wet Sea Buckthorn Pomace Utilized as an Additive on Silage Fermentation Profile and Bacterial Community Composition of Alfalfa. Bioresour. Technol. 2020, 314, 123773. [Google Scholar] [CrossRef]
  27. Renzetti, A.; Betts, J.W.; Fukumoto, K.; Rutherford, R.N. Antibacterial Green Tea Catechins from a Molecular Perspective: Mechanisms of Action and Structure-Activity Relationships. Food Funct. 2020, 11, 9370–9396. [Google Scholar] [CrossRef]
  28. Jones, G.A.; McAllister, T.A.; Muir, A.D.; Cheng, K.J. Effects of Sainfoin (Onobrychis viciifolia) Condensed Tannins on Growth and Proteolysis by Four Strains of Ruminal Bacteria. Appl. Environ. Microbiol. 1994, 60, 1374–1378. [Google Scholar] [CrossRef] [Green Version]
  29. Nakayama, M.; Tomiyama, D.; Shigemune, N.; Mitani, A.; Xu, W.; Miyamoto, T. Cell Surface Hydrophobicity Contributes to Lactobacillus Tolerance to Antibacterial Actions of Catechins. Food Sci. Technol. Res. 2015, 21, 583–588. [Google Scholar] [CrossRef] [Green Version]
  30. Muck, R.; Nadeau, E.M.G.; McAllister, T.A.; Contreras-Govea, F.E.; Santos, M.C.; Kung, L., Jr. Silage Review: Recent Advances and Future Uses of Silage Additives. J. Dairy Sci. 2018, 101, 3980–4000. [Google Scholar] [CrossRef]
  31. Cai, Y.; Kumai, S.; Ogawa, M.; Benno, Y.; Nakase, T. Characterization and Identification of Pediococcus Species Isolated from Forage Crops and Their Application for Silage Preparation. Appl. Environ. Microbiol. 1999, 65, 2901–2906. [Google Scholar] [CrossRef] [Green Version]
  32. Wang, M.S.; Chen, M.Y.; Bai, J.; Zhang, J.Y.; Su, R.N.; Franco, M.; Ding, Z.T.; Zhang, X.; Zhang, Y.; Guo, X.S. Ensiling Characteristics, in Vitro Rumen Fermentation Profile, Methane Emission and Archaeal and Protozoal Community of Silage Prepared with Alfalfa, Sainfoin and Their Mixture. Anim. Feed Sci. Technol. 2021, 284, 115154. [Google Scholar] [CrossRef]
  33. Zhou, Y.; Drouin, P.; Lafreniere, C. Effect of Temperature (5–25 °C) on Epiphytic Lactic Acid Bacteria Populations and Fermentation of Whole-Plant Corn Silage. J. Appl. Microbiol. 2016, 121, 657–671. [Google Scholar] [CrossRef] [PubMed]
  34. Pahlow, G.; Muck, R.E.; Driehuis, F.; Elferink, S.J.W.H.; Spoelstra, S.F. Microbiology of Ensiling. In Silage Science and Technology Agronomy; Buxton, D.R., Muck, R., Harrison, J.H., Eds.; Asa, Cssa, Ssa: Madison, WI, USA, 2003; pp. 31–93. [Google Scholar]
  35. Muck, R.E. Silage Microbiology and Its Control through Additives. Rev. Bras. Zootec. 2010, 39, 183–191. [Google Scholar] [CrossRef] [Green Version]
  36. Scudamore, K.A.; Livesey, C.T. Occurrence and Significance of Mycotoxins in Forage Crops and Silage: A Review. J. Sci. Food Agric. 1998, 77, 1–17. [Google Scholar] [CrossRef]
  37. Wali, A.; Nishino, N. Bacterial and Fungal Microbiota Associated with the Ensiling of Wet Soybean Curd Residue under Prompt and Delayed Sealing Conditions. Microorganisms 2020, 8, 1334. [Google Scholar] [CrossRef]
  38. Cogan, T.; Hawkey, R.; Higgie, E.; Lee, M.R.F.; Mee, E.; Parfitt, D.; Raj, J.; Roderick, S.; Walker, N.; Ward, P.; et al. Silage and Total Mixed Ration Hygienic Quality on Commercial Farms: Implications for Animal Production. Grass Forage Sci. 2017, 72, 601–613. [Google Scholar] [CrossRef] [Green Version]
  39. Tangni, E.K.; Wambacq, E.; Bastiaanse, H.; Haesaert, G.; Pussemier, L.; De Poorter, J.; Foucart, G.; Van Hove, F. Survey of Fungal Diversity in Silages Supplied to Dairy Cattle in Belgium over a Two-Year Period. J. Anim. Sci. Adv. 2017, 7, 1861–1873. [Google Scholar]
  40. Vandicke, J.; De Visschere, K.; Ameye, M.; Croubels, S.; De Saeger, S.; Audenaert, K.; Haesaert, G. Multi-Mycotoxin Contamination of Maize Silages in Flanders, Belgium: Monitoring Mycotoxin Levels from Seed to Feed. Toxins 2021, 13, 202. [Google Scholar] [CrossRef]
  41. Cobo-Diaz, J.F.; Legrand, F.; Le Floc, G.; Picot, A. Influence of Maize Residues in Shaping Soil Microbiota and Fusarium Spp. Communities. Microb. Ecol. 2021, 83, 702–713. [Google Scholar] [CrossRef]
  42. Mansfield, M.A.; Kuldau, G.A. Microbiological and Molecular Determination of Mycobiota in Fresh and Ensiled Maize Silage. Mycologia 2007, 99, 269–278. [Google Scholar] [CrossRef]
  43. Alonso, V.A.; Pereyra, C.M.; Keller, L.A.M.; Dalcero, A.M.; Rosa, C.A.R.; Chiacchiera, S.M.; Cavaglieri, L.R. Fungi and Mycotoxins in Silage: An Overview. J. Appl. Microbiol. 2013, 115, 637–643. [Google Scholar] [CrossRef] [PubMed]
  44. Cheli, F.; Campagnoli, A.; Dell’Orto, V. Fungal Populations and Mycotoxins in Silages: From Occurrence to Analysis. Anim. Feed Sci. Technol. 2013, 183, 1–16. [Google Scholar] [CrossRef]
Figure 1. Principal−coordinate analysis (PCoA) plots based on weighted UniFrac distance for bacterial community of treatments × days (CK_3: on day 3 of ensiling without addition of polyethylene glycol (PEG); PEG_3: on day 3 of ensiling addition of PEG, same as others).
Microorganisms 10 00844 g001
Figure 2. Relative abundance of bacterial community on the phylum level of PEG-treated and control group of sainfoin silage (CK_3: on day 3 of control ensiling; PEG_3: on day 3 of PEG-treated ensiling, same as others).
Microorganisms 10 00844 g002
Figure 3. Relative abundance of bacterial community on the genus level of PEG-treated and control group of sainfoin silage (CK_3: on day 3 of control ensiling; PEG_3: on day 3 of PEG-treated ensiling, same as others).
Microorganisms 10 00844 g003
Figure 4. Principal−coordinate analysis (PCoA) plots based on weighted UniFrac distance for fungi community of treatments × days (CK_3: on day 3 of ensiling without addition of polyethylene glycol (PEG); PEG_3: on day 3 of ensiling addition of PEG, same as others) observed a clear distinction (R = 0.3305, p < 0.05) between fungi communities in control and PEG-treated silages during the entire ensiling day. These indicate that condensed tannins inhibit fungi activity; however, this effect might quickly disappear with prolonged ensiling.
Microorganisms 10 00844 g004
Figure 5. Relative abundance of fungi community on phylum level of PEG-treated and control group of sainfoin silage (CK_3: on day 3 of control ensiling; PEG_3: on day 3 of PEG-treated ensiling, same as others).
Microorganisms 10 00844 g005
Figure 6. Relative abundance of fungi community on genus level of PEG-treated and control group of ensiled sainfoin (CK_3: on day 3 of control ensiling; PEG_3: on day 3 of PEG-treated ensiling, same as others).
Microorganisms 10 00844 g006
Table 1. Chemical compositions of wilted whole-plant sainfoin harvested at early flower stage for silage 1.
Chemical CompositionMean ± SE
Dry matter (g/kg fresh forage)236.5 ± 2.5
Crude protein223.12 ± 0.61
Water-soluble carbohydrates101.43 ± 0.89
Neutral detergent fiber505.83 ± 5.03
Acid detergent fiber300.66 ± 10.58
Neutral detergent—insoluble protein129.16 ± 1.11
Acid detergent—insoluble protein30.23 ± 0.50
pH5.41 ± 0.01
Soluble protein10.75 ± 0.24
Extractable condensed tannins (g/kg DM)47.31 ± 2.46
Protein-bound condensed tannins (g/kg DM)45.67 ± 1.91
Fiber-bound condensed tannins (g/kg DM)16.80 ± 0.34
Total condensed tannins109.78 ± 3.52
Lactic-acid bacteria (Log10 cfu/g FM)6.75 ± 0.06
Yeasts (Log10 cfu/g FM)ND
Molds (Log10 cfu/g FM)5.70 ± 0.04
Aerobic bacteria (Log10 cfu/g FM)7.11 ± 0.03
1 n = 3. Composition measures are in grams per kilogram of DM, unless otherwise stated. CT content in wilted sainfoin was 109.78 g/kg DM consisting of extractable CT, protein-bound CT and fiber-bound CT, which were 47.31 g/kg DM, 45.67 g/kg DM and 16.80 g/kg DM, respectively. LAB count (6.75 Log10 cfu/g FM) was higher than those of undesirable microbes such as molds (5.70 Log10 cfu/g FM) and yeasts (not detected).
Table 2. Ensiling characteristics of sainfoin with or without the addition of PEG 1.
ItemTreatmentDays of EnsilingSEMp-Value
37143060DayPEGD*P
DMCK22.13Aa21.60Aa21.83Aa21.48Aa21.68Aa0.139<0.01<0.010.173
PEG24.16Ba23.28Ba23.73Ba23.46Ba22.68Bb
DML
(%DM)
CK6.43Aa8.67Aa7.72Aa9.19Aa8.32Ba0.403<0.01<0.010.299
PEG8.57Ab11.92Aa10.21Aa11.19Aa14.15Aa
CP
(g/kg DM)
CK240.13Aa239.64Aa240.85Aa244.70Aa246.79Aa2.72<0.01<0.01<0.01
PEG219.60Ba202.90Bb204.52Bb216.02Bac208.02Bbc
NDF
(g/kg DM)
CK493.37Aa473.01Aa426.64Aa448.55Aa455.10Aa8.54<0.01<0.010.540
PEG420.10Aa351.96Bb348.77Ab350.79Bb348.58Bb
ADF
(g/kg DM)
CK299.39Ab271.07Ab322.29Aa300.73Ab274.06Ab4.900.105<0.010.011
PEG280.77Aa265.25Aa239.75Ba248.98Aa245.87Aa
E-CT
(g/kg DM)
CK19.6320.9319.3818.6716.830.7210.484--
P-CT
(g/kg DM)
CK69.6964.8269.7372.5769.921.030.280--
F-CT
(g/kg DM)
CK27.4025.6127.1426.1225.480.4070.441--
pHCK4.61Ab4.75Aa4.67Aab4.57Ab4.32Ac0.025<0.010.530.064
PEG4.56Ab4.68Aa4.69Aab4.60Aa4.36Ac
AN
(g/kg DM)
CK0.64Bc0.94Bb1.13Bb1.42Ba1.60Ba0.064<0.01<0.01<0.01
PEG1.16Ad1.24Ad1.51Ac1.93Ab2.44Aa
WSC
(g/kg DM)
CK46.02Aab41.77Aab37.95Ab35.76Abc31.09Ac0.89<0.01<0.01<0.01
PEG30.89Bab32.86Ba30.64Bab26.47Bbc23.34Bc
LA
(g/kg DM)
CK107.74Aa96.25Aa86.33Aa108.99Ba115.36Aa4.370.003<0.010.063
PEG102.72Ab123.03Ab127.94Ab158.89Aa162.98Aa
AA
(g/kg DM)
CK67.57Ab76.66Aab66.20Ab73.15Bb101.62Aa3.56<0.01<0.01<0.01
PEG63.33Ab80.20Ab68.61Ab138.47Aa117.85Aa
PA
(g/kg DM)
CK4.72Aa1.47Ab0.71Ab1.41Ab1.82Bb0.293<0.01<0.010.135
PEG6.10Aa1.89Ab2.28Ab2.75Ab5.50Aa
LA to AA RatioCK1.60Aa1.26 Aa1.35 Aa1.50 Aa1.13 Aa0.0440.0140.035<0.01
PEG1.61 Aa1.56 Aa1.86 Aa1.15 Aa1.45 Aa
LAB
Log10 cfu/g FM
CK9.04Aa8.82Bab8.70Aab8.06Bc7.13Bd0.089<0.01<0.010.068
PEG9.19Aa9.28Aa8.99Aa8.60Ab7.72Ac
Molds
Log10 cfu/g FM
CK5.06Ba4.92Aa4.82Bab4.78Aab4.44Bb0.042<0.01<0.010.300
PEG5.50Aa5.21Aab5.20Aab5.14Aab5.08Ab
Yeasts
Log10 cfu/g FM
CK3.94Aa3.82Ba3.87Aa2.85Ab2.79Ab0.072<0.010.195<0.01
PEG3.53Abc4.33Aa3.78Ab3.11Acd2.91Ad
AB
Log10 cfu/g FM
CK9.15Aa8.80Bab8.64Ab8.15Bc7.24Bd0.086<0.01<0.010.106
PEG9.36Aa9.28Aab8.95Ab8.62Ac7.83Ad
1 n = 3.CK: control group; PEG: polyethylene glycol; DM: dry matter; DML: dry-matter loss; CP: crude protein; NDF: neutral detergent fiber; ADF: acid detergent fiber; E-CT: extractable condensed tannins; P-CT: protein-bound condensed tannin; F-CT: fiber-bound condensed tannin; T-CT: total condensed tannin; WSC: water-soluble carbohydrates; AN: ammonia nitrogen; LA: lactic acid; AA: acetic acid; PA: propionic acid; LAB: lactic-acid bacteria; AB: aerobic bacteria. Different capital letters in the same column indicate significant difference (p < 0.05). Different lowercase letters in the same row indicate significant difference (p < 0.05).
Table 3. Alpha diversity of bacterial community of sainfoin silage 1.
DaysTreatmentSobsShannonSimpsonAceChaoGood’s Coverage
Before ensiled——1430.890.68201.07168.30.999
3CK852A2.780.17852A852A0.999
PEG290.33B2.200.23439.9B433.4B0.997
7CK3292.410.21456.05470.250.997
PEG552.672.420.24596.04604.670.999
14CK3572.610.18B544.22488.430.997
PEG307.672.200.26A423.48427.060.997
30CK410.67A2.230.18B538.13554.10.999
PEG352.67B2.100.31A501.24496.380.999
60CK229.331.880.31317.79295.080.999
PEG199.671.850.28289.93269.350.999
1n = 3. CK: control group; PEG: polyethylene glycol; Different capital letters in the same column indicate significant difference (p < 0.05).
Table 4. Alpha diversity of fungi community of sainfoin ensiled with or without the addition of PEG.
DaysPEGSobsShannonSimpsonAceChaoGoods Coverage
Before ensiledN1482.250.18192.26197.050.999
3Y122.67B2.97A0.10127.30B125.66B0.999
N169.67A2.44B0.13193.21A192.22A0.999
7Y79.67B2.840.1081.87B80.92B0.999
N165.67A2.630.11175.83A177.83A0.999
14Y55.00B2.480.1158.31B57.72B0.999
N126.00A2.570.18130.69A132.56A0.999
30Y36.33B2.690.0947.63B39.00B0.999
N125.33A2.610.11129.43A130.26A0.999
60Y59.003.080.1166.8160.500.999
N51.002.950.0851.9851.610.999
Different capital letters in the same column indicate significant difference (p < 0.05). N: without addition with PEG; Y: addition with PEG.
Publisher’s Note: MDPI stays neutral with regard to jurisdictional claims in published maps and institutional affiliations.

