
Identification of Novel Antimicrobial Resistance Genes Using Machine Learning, Homology Modeling, and Molecular Docking
Abstract
1. Introduction
2. Materials and Methods
2.1. Bacterial Isolates
2.2. Hypothetical Protein Re-Nomenclature
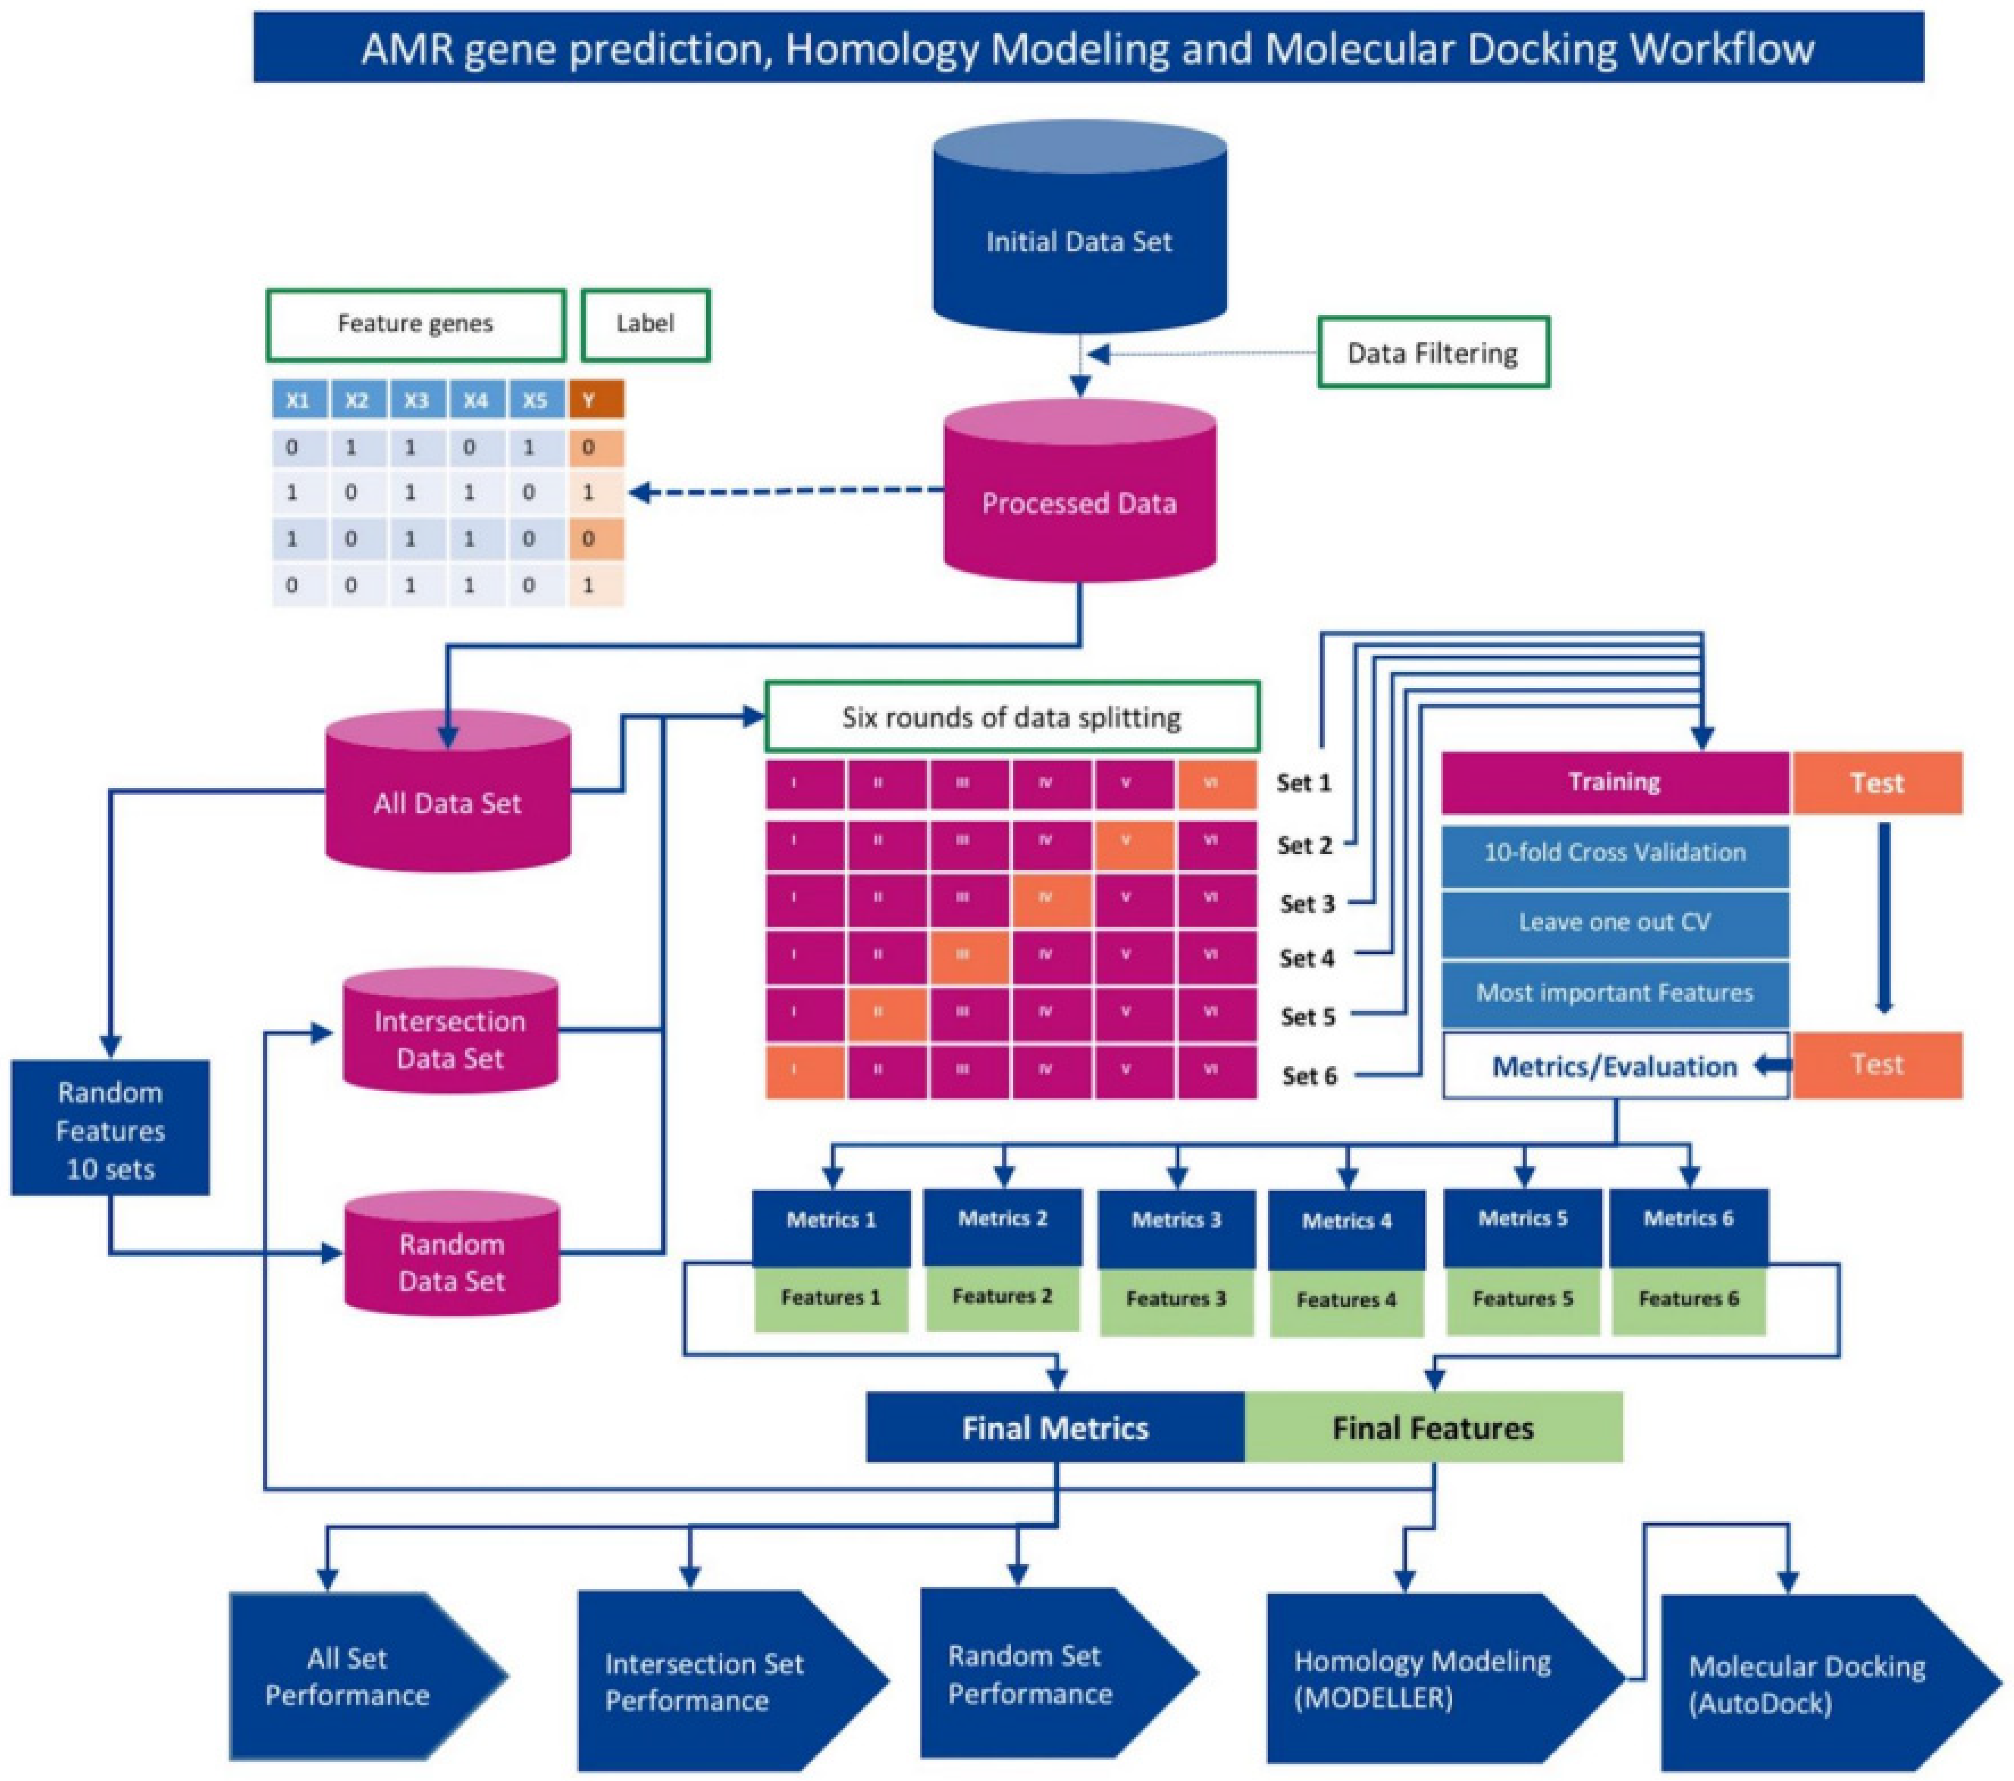
2.3. Training, Validation, and Testing
2.4. Machine Learning Algorithms
2.5. Determination of Optimal Machine Learning Framework

2.6. Identification of Novel AMR Genes/Loci
2.7. Homology Modeling with MODELLER
2.8. Receptor/Ligand Preparation and Docking with AutoDock Vina Smina
2.9. Method Validation
3. Results
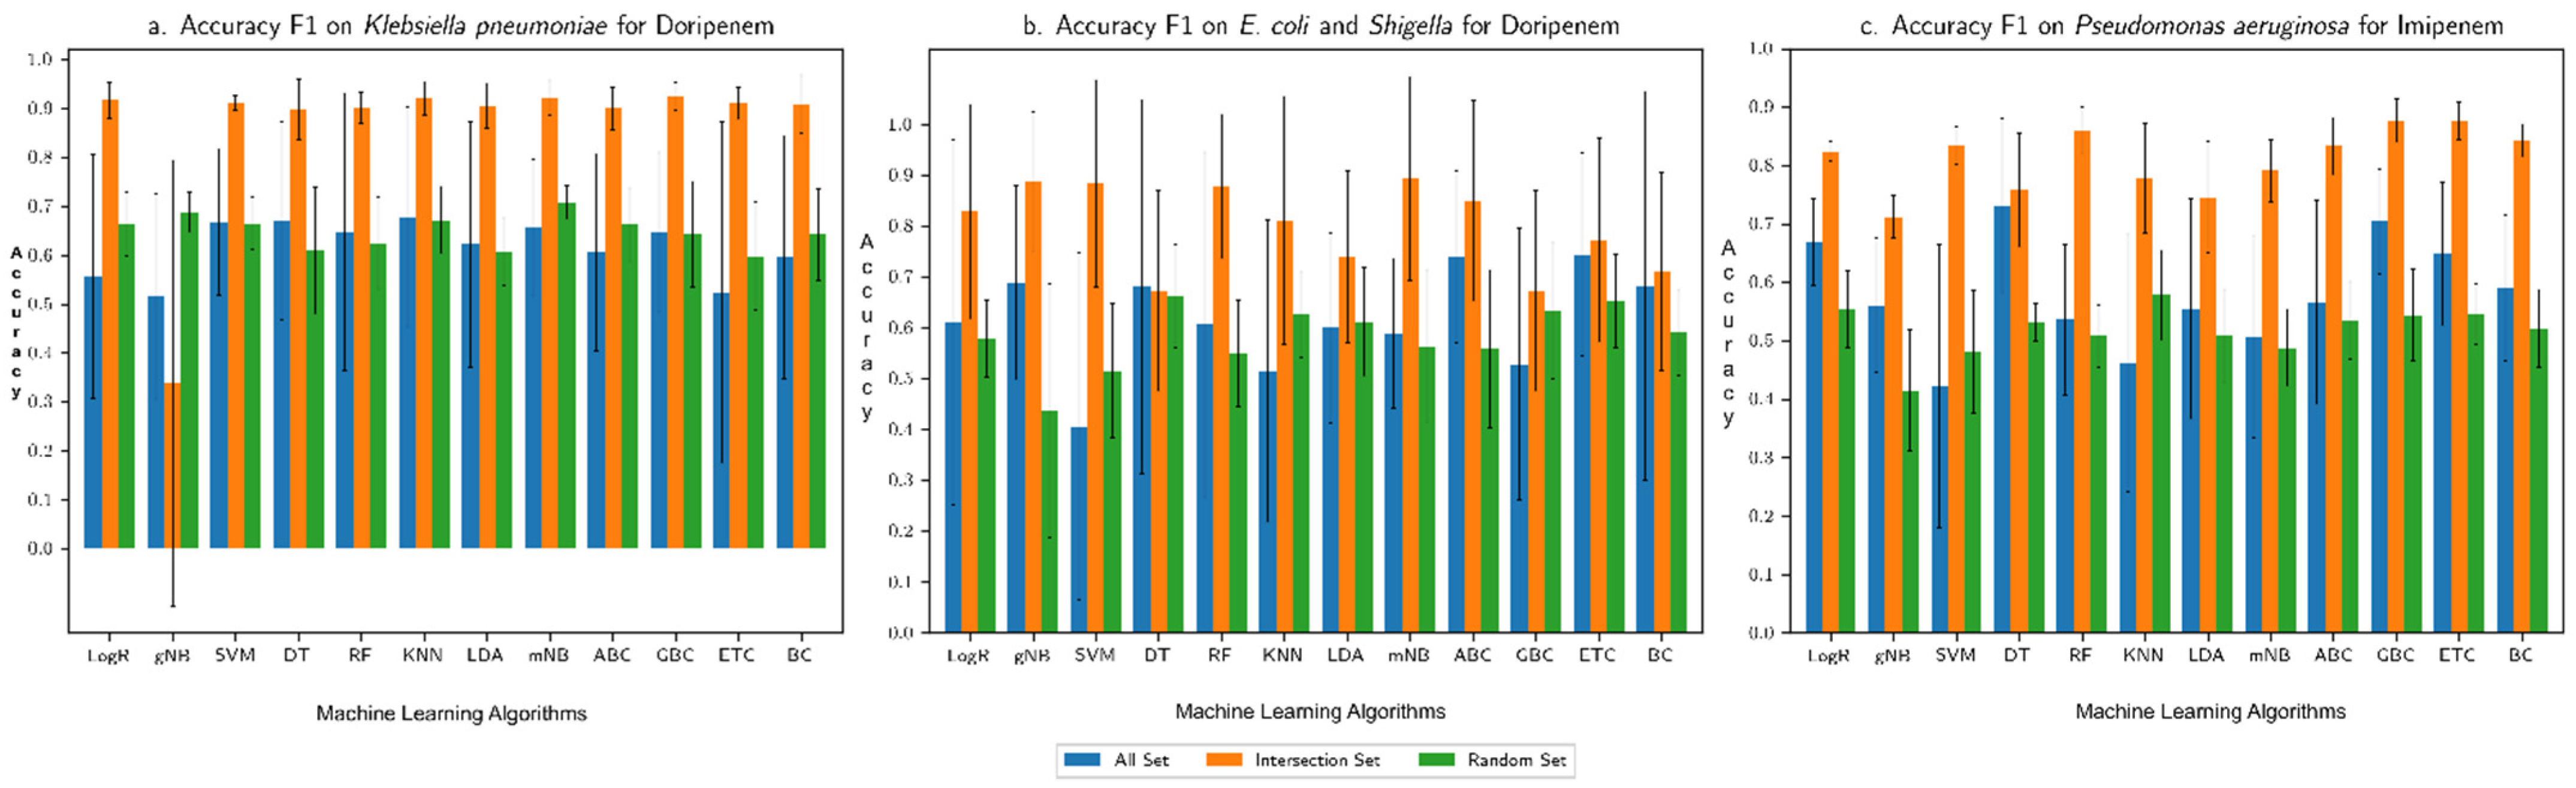
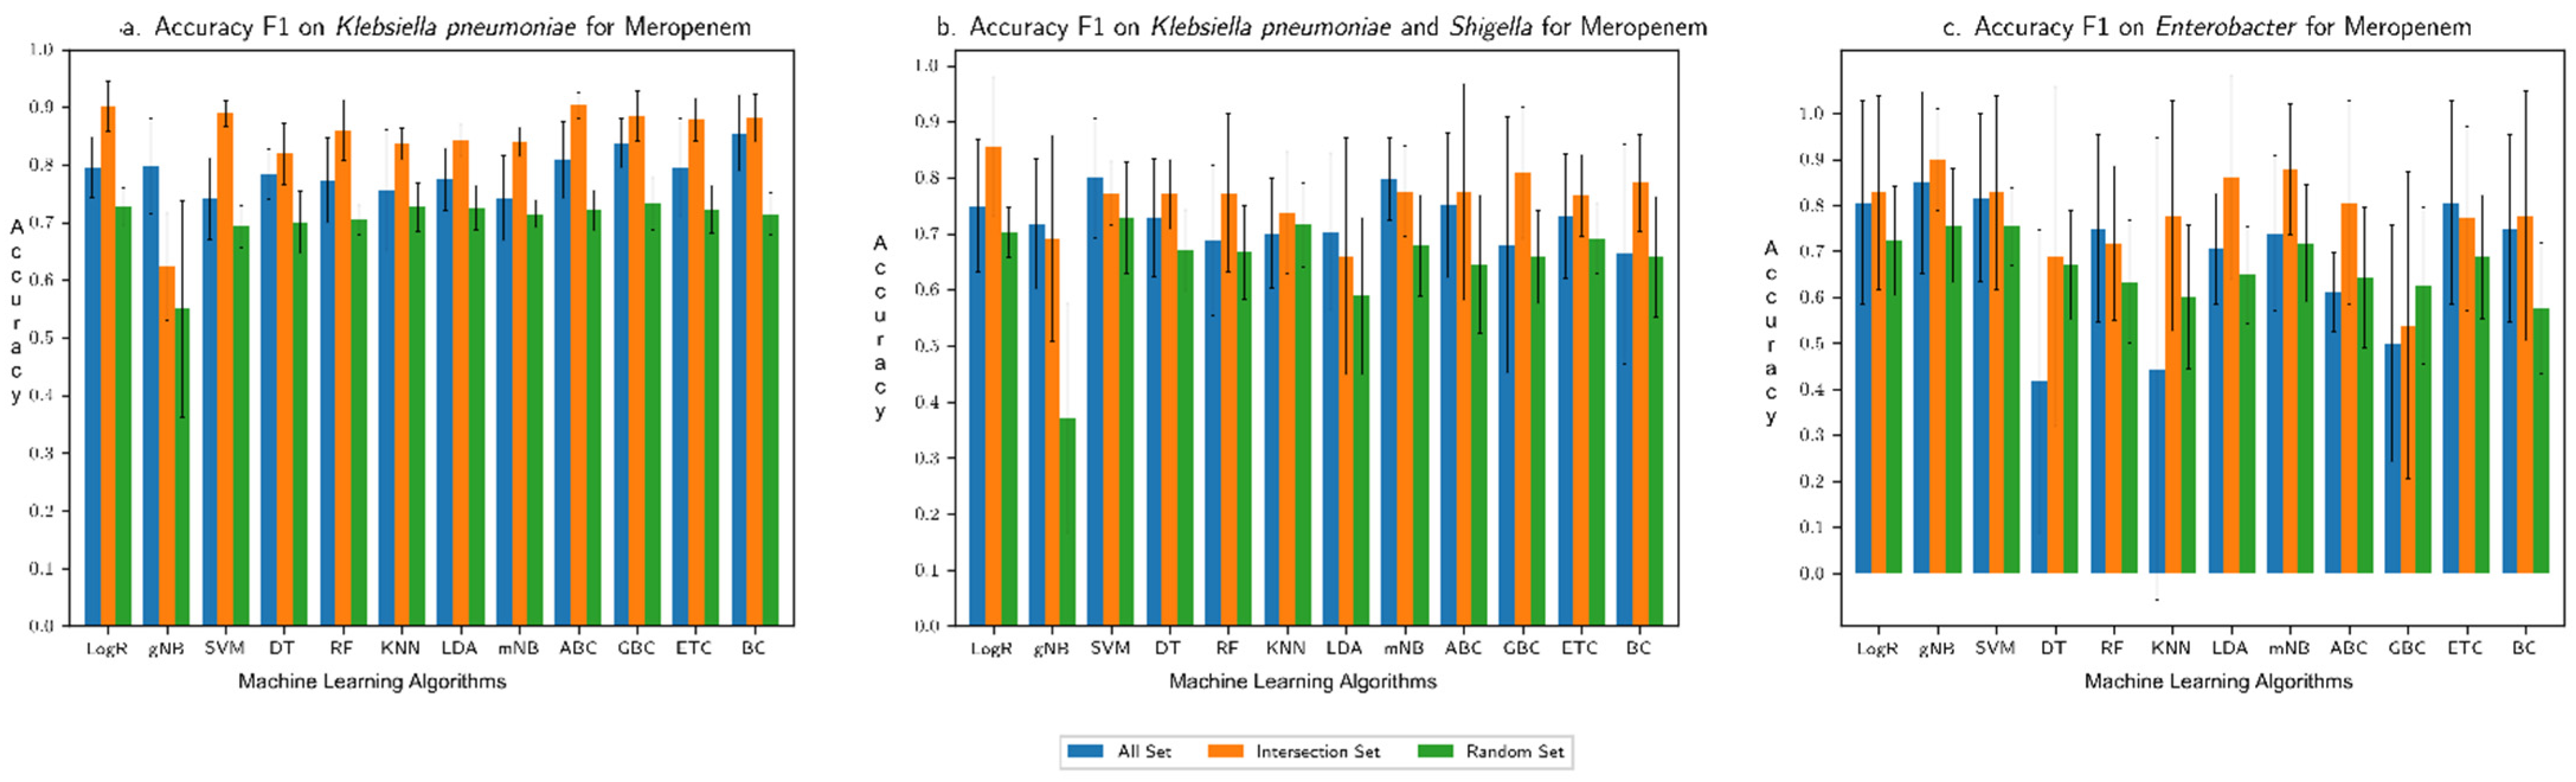
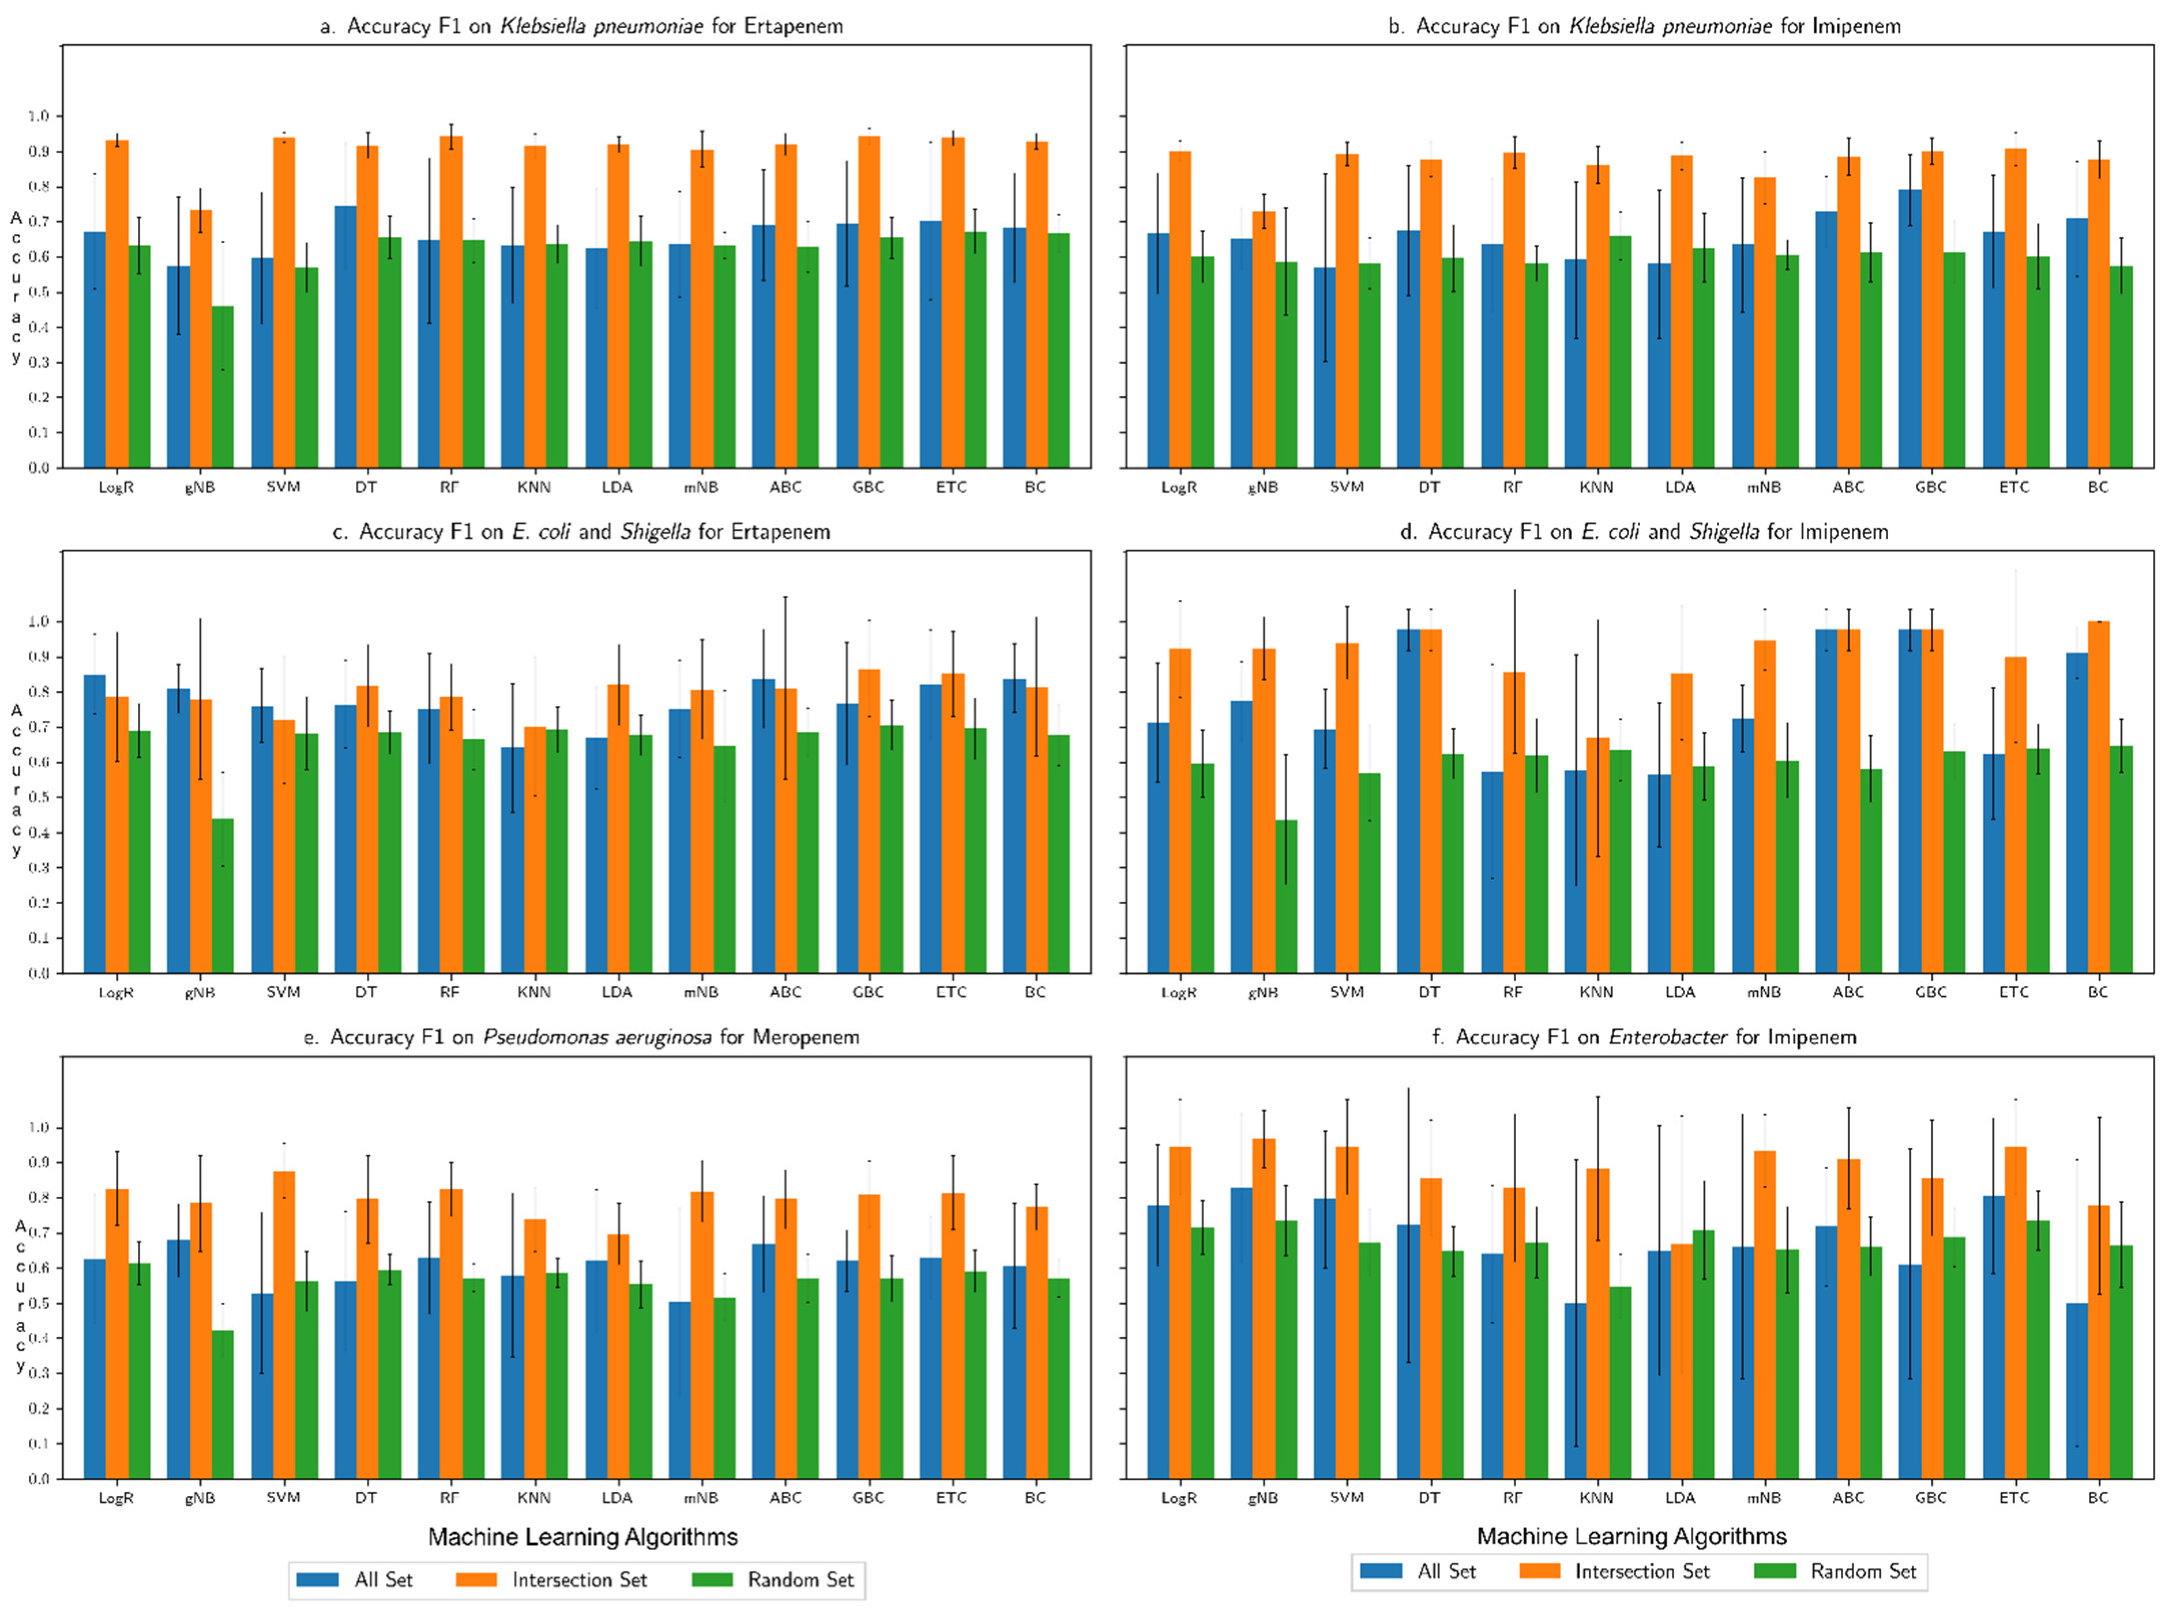
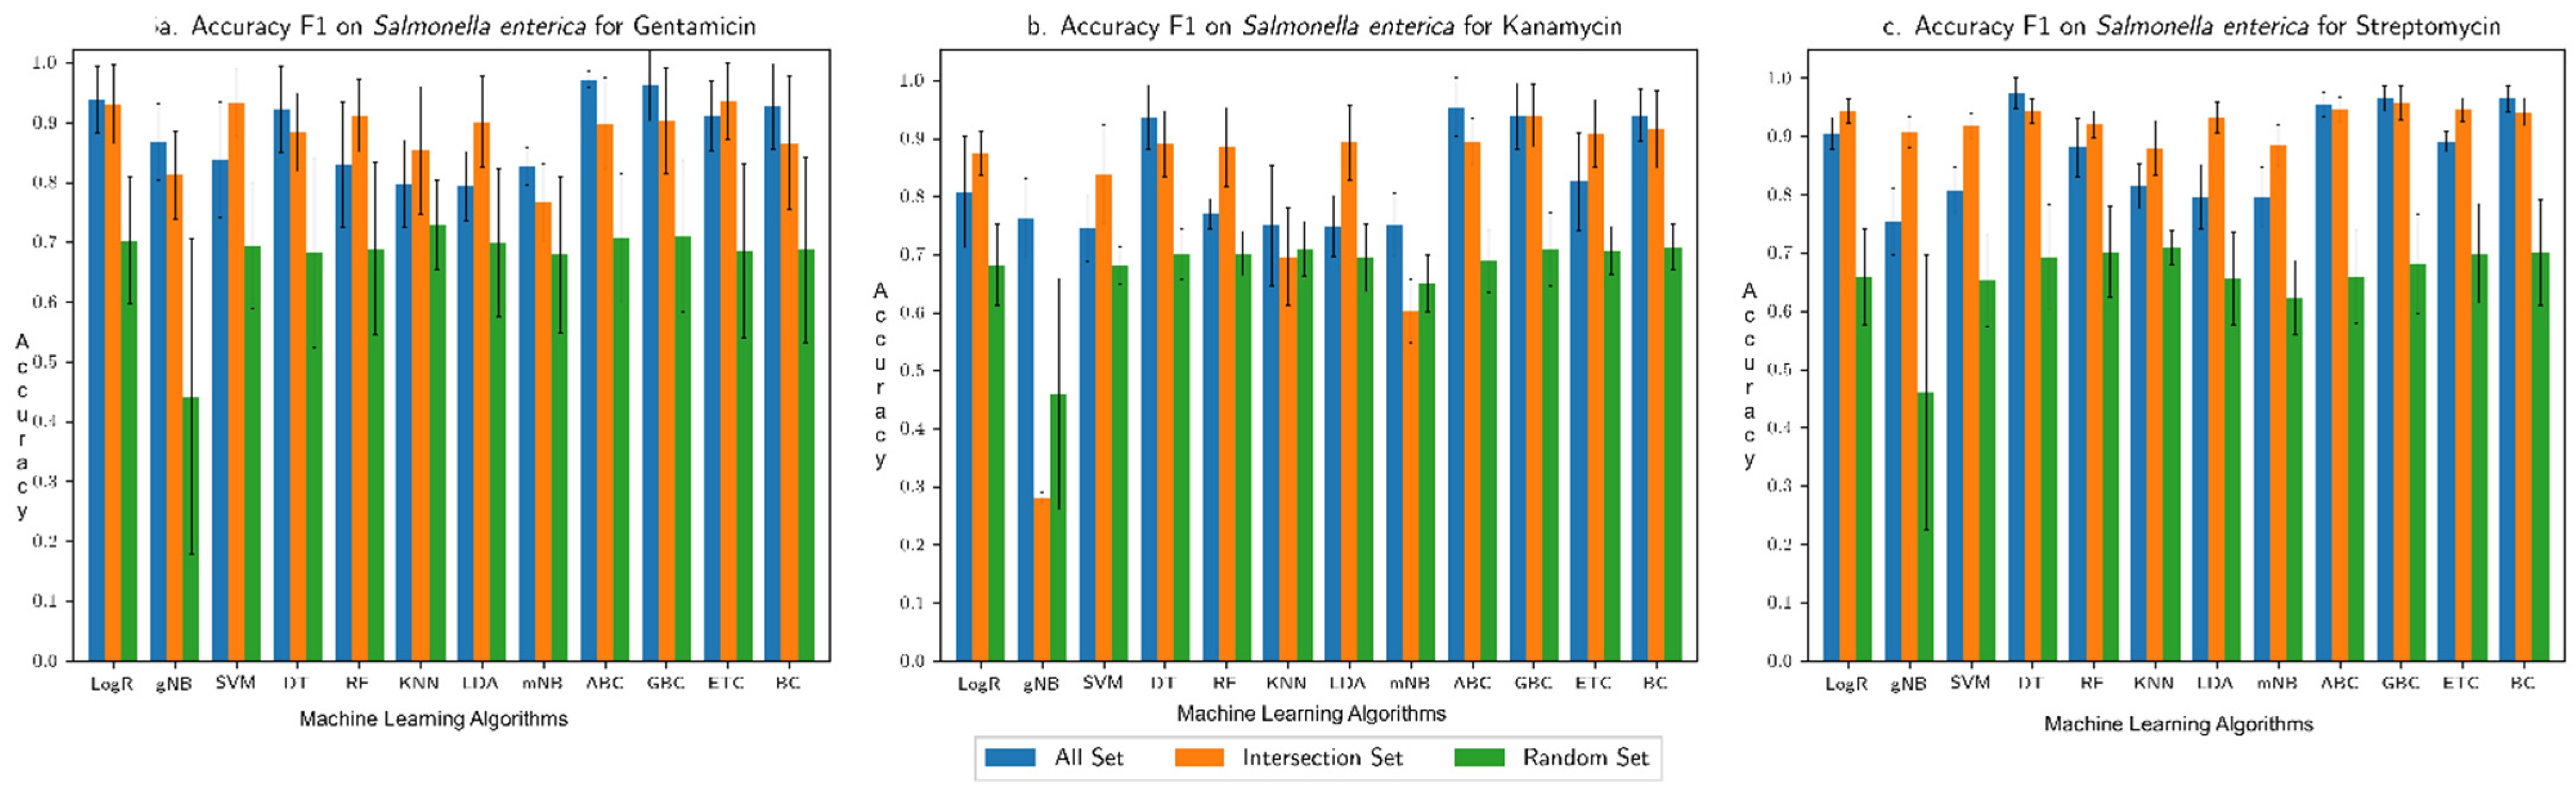
3.1. Performance Assessment of the Machine Learning Framework
3.2. Comparison with Our Previous Study Based on Only AMR Genes
3.3. Novel AMR Genes
3.4. Binding Affinity of Proteins Encoded by Novel AMR Genes with Respective Antibiotics
4. Discussion
Supplementary Materials
Author Contributions
Funding
Informed Consent Statement
Data Availability Statement
Conflicts of Interest
References
- Srinivasan, A. COVID-19 & Antibiotic Resistance|CDC. Available online: https://www.cdc.gov/drugresistance/covid19.html (accessed on 4 August 2021).
- Dadgostar, P. Antimicrobial Resistance: Implications and Costs. Infect. Drug Resist. 2019, 12, 3903–3910. [Google Scholar] [CrossRef] [PubMed]
- Majumder, M.A.A.; Rahman, S.; Cohall, D.; Bharatha, A.; Singh, K.; Haque, M.; Gittens-St Hilaire, M. Antimicrobial Stewardship: Fighting Antimicrobial Resistance and Protecting Global Public Health. Infect. Drug Resist. 2020, 13, 4713–4738. [Google Scholar] [CrossRef] [PubMed]
- Gao, D.; Zhu, X.; Lu, B. Development and application of sensitive, specific, and rapid CRISPR-Cas13-based diagnosis. J. Med. Virol. 2021, 93, 4198–4204. [Google Scholar] [CrossRef] [PubMed]
- Plackett, B. Why big pharma has abandoned antibiotics. Nature 2020, 586, S50. [Google Scholar] [CrossRef]
- De la Fuente-Nunez, C.; Torres, M.D.; Mojica, F.J.; Lu, T.K. Next-generation precision antimicrobials: Towards personalized treatment of infectious diseases. Curr. Opin. Microbiol. 2017, 37, 95–102. [Google Scholar] [CrossRef] [PubMed]
- Dobrindt, U.; Hochhut, B.; Hentschel, U.; Hacker, J. Genomic islands in pathogenic and environmental microorganisms. Nat. Rev. Microbiol. 2004, 2, 414–424. [Google Scholar] [CrossRef]
- Davies, J.; Davies, D. Origins and Evolution of Antibiotic Resistance. Microbiol. Mol. Biol. Rev. 2010, 74, 417–433. [Google Scholar] [CrossRef]
- Liu, Z.; Deng, D.; Lu, H.; Sun, J.; Lv, L.; Li, S.; Peng, G.; Ma, X.; Li, J.; Li, Z.; et al. Evaluation of Machine Learning Models for Predicting Antimicrobial Resistance of Actinobacillus pleuropneumoniae From Whole Genome Sequences. Front. Microbiol. 2020, 11, 48. [Google Scholar] [CrossRef]
- Larrañaga, P.; Calvo, B.; Santana, R.; Bielza, C.; Galdiano, J.; Inza, I.; Lozano, J.A.; Armañanzas, R.; Santafé, G.; Pérez, A.; et al. Machine learning in bioinformatics. Brief. Bioinform. 2006, 7, 86–112. [Google Scholar] [CrossRef]
- Maguire, F.; Rehman, M.A.; Carrillo, C.; Diarra, M.S.; Beiko, R.G. Identification of Primary Antimicrobial Resistance Drivers in Agricultural Nontyphoidal Salmonella enterica Serovars by Using Machine Learning. Msystems 2019, 4, e00211-19. [Google Scholar] [CrossRef]
- Sunuwar, J.; Azad, R.K. A machine learning framework to predict antibiotic resistance traits and yet unknown genes underlying resistance to specific antibiotics in bacterial strains. Brief. Bioinform. 2021, 22, bbab179. [Google Scholar] [CrossRef]
- Salmaso, V.; Moro, S. Bridging Molecular Docking to Molecular Dynamics in Exploring Ligand-Protein Recognition Process: An Overview. Front. Pharmacol. 2018, 9, 923. [Google Scholar] [CrossRef]
- Afriza, D.; Suriyah, W.H.; Ichwan, S.J.A. In silicoanalysis of molecular interactions between the anti-apoptotic protein survivin and dentatin, nordentatin, and quercetin. J. Phys. Conf. Ser. 2018, 1073, 032001. [Google Scholar] [CrossRef]
- Forli, S.; Huey, R.; Pique, M.E.; Sanner, M.F.; Goodsell, D.S.; Olson, A.J. Computational protein-ligand docking and virtual drug screening with the AutoDock suite. Nat. Protoc. 2016, 11, 905–919. [Google Scholar] [CrossRef]
- Westerhuis, J.A.; Hoefsloot, H.C.J.; Smit, S.; Vis, D.J.; Smilde, A.K.; Van Velzen, E.J.J.; Van Duijnhoven, J.P.M.; Van Dorsten, F.A. Assessment of PLSDA cross validation. Metabolomics 2008, 4, 81–89. [Google Scholar] [CrossRef]
- Šali, A.; Blundell, T.L. Comparative Protein Modelling by Satisfaction of Spatial Restraints. J. Mol. Biol. 1993, 234, 779–815. [Google Scholar] [CrossRef]
- O’Boyle, N.M.; Banck, M.; James, C.A.; Morley, C.; Vandermeersch, T.; Hutchison, G.R. Open Babel: An open chemical toolbox. J. Cheminform. 2011, 3, 33. [Google Scholar] [CrossRef]
- Trott, O.; Olson, A.J. AutoDock Vina: Improving the speed and accuracy of docking with a new scoring function, efficient optimization, and multithreading. J. Comput. Chem. 2010, 31, 455–461. [Google Scholar] [CrossRef]
- Koes, D.R.; Baumgartner, M.; Camacho, C.J. Lessons Learned in Empirical Scoring with smina from the CSAR 2011 Benchmarking Exercise. J. Chem. Inf. Model. 2013, 53, 1893–1904. [Google Scholar] [CrossRef]
- Cock, P.J.A.; Antao, T.; Chang, J.T.; Chapman, B.A.; Cox, C.J.; Dalke, A.; Friedberg, I.; Hamelryck, T.; Kauff, F.; Wilczynski, B.; et al. Biopython: Freely available Python tools for computational molecular biology and bioinformatics. Bioinformatics 2009, 25, 1422–1423. [Google Scholar] [CrossRef]
- Pettersen, E.F.; Goddard, T.D.; Huang, C.C.; Couch, G.S.; Greenblatt, D.M.; Meng, E.C.; Ferrin, T.E. UCSF Chimera-A visualization system for exploratory research and analysis. J. Comput. Chem. 2004, 25, 1605–1612. [Google Scholar] [CrossRef]
- Morris, G.M.; Huey, R.; Lindstrom, W.; Sanner, M.F.; Belew, R.K.; Goodsell, D.S.; Olson, A.J. AutoDock4 and AutoDockTools4: Automated docking with selective receptor flexibility. J. Comput. Chem. 2009, 30, 2785–2791. [Google Scholar] [CrossRef]
- BIOVIA. Dassault Systemes; Discovery Studio Visualizer v21.1.0.20298; BIOVIA: San Diego, CA, USA, 2020. [Google Scholar]
- Munita, J.M.; Arias, C.A. Mechanisms of antibiotic resistance. Microbiol. Spectr. 2016, 4, 15. [Google Scholar] [CrossRef]
- Van Hoek, A.H.; Mevius, D.; Guerra, B.; Mullany, P.; Roberts, A.; Aarts, J.M.H. Acquired antibiotic resistance genes:an overview. Front. Microbiol. 2011, 2, 203. [Google Scholar] [CrossRef]
- Bhagirath, A.Y.; Li, Y.; Patidar, R.; Yerex, K.; Ma, X.; Kumar, A.; Duan, K. Two Component Regulatory Systems and Antibiotic Resistance in Gram-Negative Pathogens. Int. J. Mol. Sci. 2019, 20, 1781. [Google Scholar] [CrossRef]
- Band, V.I.; Weiss, D.S. Heteroresistance: A cause of unexplained antibiotic treatment failure? PLoS Pathog. 2019, 15, e1007726. [Google Scholar] [CrossRef]
- Du, X.; Li, Y.; Xia, Y.; Ai, S.-M.; Liang, J.; Sang, P.; Ji, X.-L.; Liu, S.-Q. Insights into protein-ligand interactions: Mechanisms, models, and methods. Int. J. Mol. Sci. 2016, 17, 144. [Google Scholar] [CrossRef]
- Sousa, S.; Ribeiro, A.; Coimbra, J.; Neves, R.; Martins, S.; Moorthy, N.H.N.; Fernandes, P.; Ramos, M.J. Protein-Ligand Docking in the New Millennium—A Retrospective of 10 Years in the Field. Curr. Med. Chem. 2013, 20, 2296–2314. [Google Scholar] [CrossRef]
- Huang, S.; Zou, X. Advances and challenges in protein-ligand docking. Int. J. Mol. Sci. 2010, 11, 3016–3034. [Google Scholar] [CrossRef]
- Ball, P. Water is an active matrix of life for cell and molecular biology. Proc. Natl. Acad. Sci. USA 2017, 114, 13327–13335. [Google Scholar] [CrossRef]
- Pantsar, T.; Poso, A. Binding Affinity via Docking: Fact and Fiction. Molecules 2018, 23, 1899. [Google Scholar] [CrossRef] [PubMed]
- Anahtar, M.N.; Yang, J.H.; Kanjilal, S. Applications of machine learning to the problem of antimicrobial resistance: An emerging model for translational research. J. Clin. Microbiol. 2021, 59, e01260-20. [Google Scholar] [CrossRef] [PubMed]
- Burks, D.J.; Sengupta, S.; De, R.; Mittler, R.; Azad, R.K. The Arabidopsis gene co-expression network. Plant Direct. 2022, 6, e396. [Google Scholar] [CrossRef] [PubMed]


| SN | Bacteria | Antibiotics | Resistant | Susceptible | Total Strains | No. of Features (Genes) |
|---|---|---|---|---|---|---|
| 1. | Klebsiella pneumoniae | Doripenem | 19 | 19 | 38 | 23,611 |
| Ertapenem | 45 | 45 | 90 | 23,611 | ||
| Imipenem | 38 | 38 | 67 | 23,611 | ||
| Meropenem | 69 | 69 | 138 | 23,611 | ||
| 2. | E. coli and Shigella | Doripenem | 14 | 14 | 28 | 18,547 |
| Ertapenem | 32 | 32 | 64 | 18,547 | ||
| Imipenem | 22 | 22 | 44 | 18,547 | ||
| Meropenem | 30 | 30 | 60 | 18,547 | ||
| 3. | Pseudomonas aeruginosa | Imipenem | 41 | 41 | 82 | 12,945 |
| Meropenem | 48 | 48 | 96 | 12,945 | ||
| 4. | Enterobacter | Imipenem | 11 | 11 | 22 | 8987 |
| Meropenem | 12 | 12 | 24 | 8987 | ||
| 5. | Salmonella enterica | Gentamicin | 91 | 91 | 182 | 22,764 |
| Kanamycin | 68 | 68 | 136 | 22,764 | ||
| Streptomycin | 210 | 210 | 420 | 22,764 |
| SN. | Doripenem | Ertapenem | Imipenem | Meropenem | ||||
|---|---|---|---|---|---|---|---|---|
| Accession | Protein Name/Description | Accession | Protein Name/Description | Accession | Protein Name/Description | Accession | Protein Name/Description | |
| 1 | WP_004144294.1 | AlpA family phage regulatory protein | WP_040215863.1 | (2,3-dihydroxybenzoyl)adenylate synthase EntE | WP_004152650.1 | DUF1833 family protein | WP_004152389.1 | DUF2913 family protein |
| 2 | WP_048999684.1 | Cu(+)/Ag(+) sensor histidine kinase | WP_016338366.1 | DUF2913 family protein | WP_004218558.1 | DUF2560 family protein | WP_071182194.1 | DUF551 domain-containing protein |
| 3 | WP_000085883.1 | DNA methylase | WP_000454193.1 | DUF3330 domain-containing protein | WP_004152389.1 | DUF2913 family protein | WP_004184301.1 | DinB family protein |
| 4 | WP_004218558.1 | DUF2560 family protein | WP_004171440.1 | hypothetical protein | WP_062955115.1 | GABA permease | WP_004199358.1 | hypothetical protein |
| 5 | WP_032427884.1 | hypothetical protein | WP_004151678.1 | phosphodiester glycosidase family protein | WP_015065545.1 | hypothetical protein | WP_004217321.1 | IS6-like element IS26 family transposase |
| 6 | WP_023282973.1 | arsenic transporter | WP_000219391.1 | Mph(A) family macrolide 2’-phosphotransferase | WP_023300766.1 | L-2-hydroxyglutarate oxidase | WP_071557814.1 | IS6-like element IS6100 family transposase |
| 7 | WP_004144136.1 | bifunctional phosphoribosyl-AMP cyclohydrolase/phosphoribosyl-ATP diphosphatase HisIE | WP_004141234.1 | NAD(P)-binding domain-containing protein | WP_004199843.1 | MetQ/NlpA family ABC transporter substrate-binding protein | WP_015367306.1 | MAPEG family protein |
| 8 | WP_004152357.1 | DNA polymerase III subunit theta | WP_139153029.1 | Tn3 family transposase | WP_023290921.1 | PD40 domain-containing protein | WP_032706418.1 | PTS-dependent dihydroxyacetone kinase operon transcriptional regulator DhaR |
| 9 | WP_000997453.1 | type VI secretion protein | WP_016240610.1 | TraM recognition domain-containing protein | WP_068815603.1 | PTS-dependent dihydroxyacetone kinase operon transcriptional regulator DhaR | WP_000166328.1 | Rop family plasmid primer RNA-binding protein |
| 10 | WP_039817891.1 | IS21 family transposase | WP_064162557.1 | UDP-N-acetylmuramate dehydrogenase | WP_015703570.1 | YqjK-like family protein | WP_019725280.1 | SAM-dependent DNA methyltransferase |
| 11 | WP_000018330.1 | aminoglycoside O-phosphotransferase APH(3’)-Ia | WP_004175424.1 | YebG family protein | WP_004150845.1 | dimethylsulfoxide reductase subunit B | WP_015365583.1 | alanine transaminase AlaA |
| 12 | WP_004152392.1 | IS3-like element Tn4401 family transposase | WP_002901627.1 | YniB family protein | WP_009485658.1 | glycerol dehydratase reactivase beta/small subunit family protein | WP_015365705.1 | arsenic transporter |
| 13 | WP_004218009.1 | glycosyl hydrolase family 2 | WP_002888321.1 | bis(5’-nucleosyl)-tetraphosphatase (symmetrical) | WP_020802362.1 | multidrug/biocide efflux PACE transporter | WP_015704003.1 | bifunctional biotin--[acetyl-CoA-carboxylase] ligase/biotin operon repressor BirA |
| 14 | WP_004198233.1 | zinc-binding domain of primase-helicase family protein | WP_004152235.1 | dimethylsulfoxide reductase subunit B | WP_000843500.1 | DUF2933 domain-containing protein | WP_015703802.1 | deacetylase |
| 15 | WP_001010162.1 | arsenical pump-driving ATPase | WP_004191677.1 | helix-hairpin-helix domain-containing protein | WP_009483845.1 | SLC13/DASS family transporter | WP_000361389.1 | plasmid partitioning/stability family protein |
| SN. | Bacteria | Ligand | Receptor | NCBI Nomenclature | Affinity, ΔG (Kcal/mol) | RMSD lb | RMSD ub | Interacting Amino Acids with the Ligand |
|---|---|---|---|---|---|---|---|---|
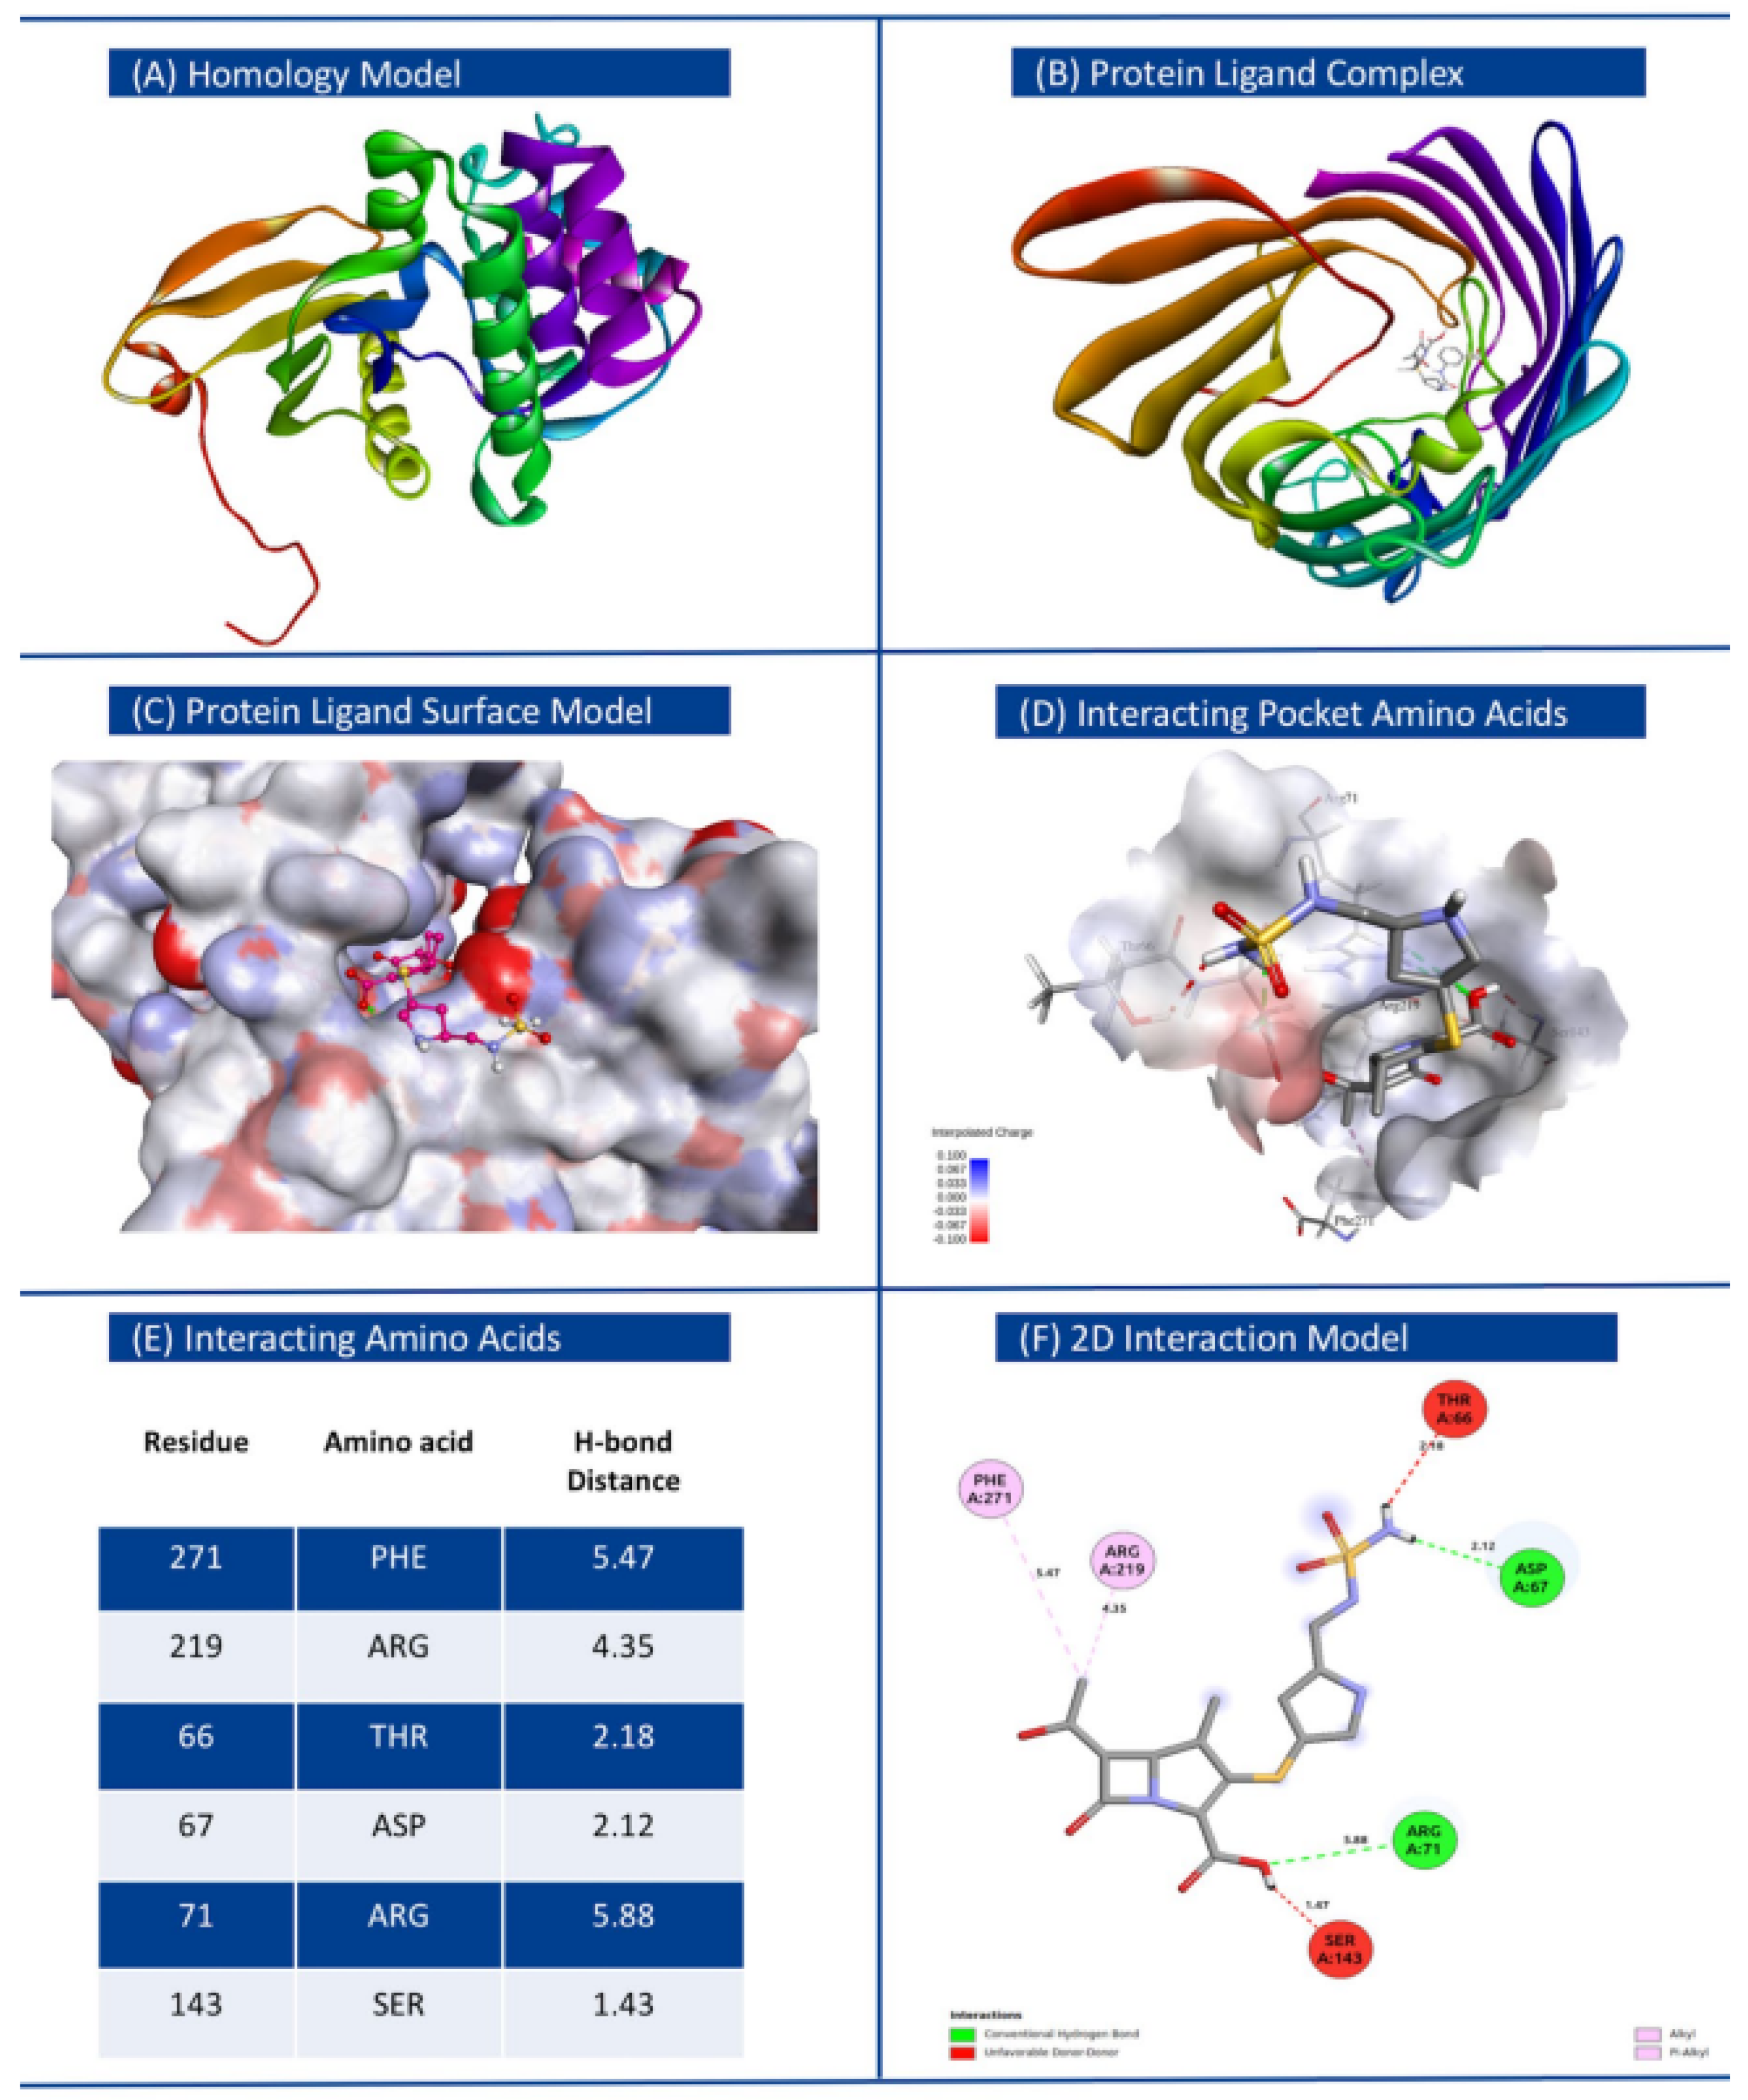
| 1 | Klebsiella pneumoniae | Doripenem | WP_000018330.1 | MULTISPECIES: O-phosphotransferase | −7.9 | 0 | 0 | ThrA66, Asp67, Arg71, Ser143, Arg219, Phe271 |
| Ertapenem | WP_049116479.1 | MULTISPECIES: porin OmpK35 | −10.6 | 0 | 0 | Val16, Ala17, Trp133, Gly135, Ala347 | ||
| Imipenem | WP_064146913.1 | PD40 domain-containing protein | −7.4 | 0 | 0 | Tyr39, Leu88, Ala132, Pro197, | ||
| Meropenem | WP_125961907.1 | haloacid dehalogenase-like hydrolase | −8.9 | 0 | 0 | Asp63, la111, Gly114, Ser254, gly256, ASer295, Gly296, Lys297, | ||
| 2 | E. coli and Shigella | Doripenem | WP_004201167.1 | MULTISPECIES: bleomycin binding protein Ble-MBL | −7 | 0 | 0 | Arg40, gly42, Gln44, Cys62, Arg65 |
| Ertapenem | WP001394742.1 | MULTISPECIES: 6-phospho-beta-glucosidase BglA | −11.2 | 0 | 0 | Gln20, His132, Asn177, Tyr315, Asn318, Phe333, Glu375, Trp423 | ||
| Imipenem | WP_004152394.1 | MULTISPECIES: IS21-like element ISKpn7 family helper ATPase IstB | −7.2 | 0 | 0 | Lys71, Asp77, Tyr76, Gly113, His116, Gly111, Lys114, Arg242, | ||
| Meropenem | WP_032488579.1 | MULTISPECIES: N-acetyltransferase | −8.7 | 0 | 0 | Trp33, Ile99, Gln101, Pro138, Tyr149, Asp164 | ||
| 3 | Pseudomonas aeruginosa | Imipenem | WP_031628187.1 | autoinducer binding domain-containing protein | −7.7 | 0 | 0 | Cys81, Asp103, Val112, gly115, Gln120, |
| Meropenem | WP_023097121.1 | MULTISPECIES: outer membrane protein OmpK | −8.9 | 0 | 0 | His37, Glu57, Tyr72, Phe93, Lys248,, Asn277, Trp235 | ||
| 4 | Enterobacter | Imipenem | WP_061096807.1 | alpha, alpha-trehalase | −7.9 | 0 | 0 | Glu171, Tyr173, trp175, Asn212, Gln223, Gly324, Ala321, Phe532, Trp534 |
| Meropenem | WP_023337592.1 | MULTISPECIES: leucyl aminopeptidase family protein | −8.7 | 0 | 0 | Trp488, Arg495, glu70, Arg161, Arg77, Gln110 | ||
| 5 | Salmonella enterica | Gentamicin | WP_025766410.1 | MULTISPECIES: class 1 integron integrase IntI1 | −9.4 | 0 | 0 | Arg114, Gln120, Glu185, Arg186, Tyr188, |
| Kanamycin | WP_001643958.1 | N-acetylneuraminate epimerase | −11.8 | 0 | 0 | Ser89, Ser226, Ala282, Gly346, Ser350, Ser348, | ||
| Streptomycin | WP_000465133.1 | MULTISPECIES: thermonuclease family protein | −10.2 | 0 | 0 | Asp36, Thr39, Ile40, Asp44, Asp91, Tyr93, Arg95, Tyr120 |
Publisher’s Note: MDPI stays neutral with regard to jurisdictional claims in published maps and institutional affiliations. |
© 2022 by the authors. Licensee MDPI, Basel, Switzerland. This article is an open access article distributed under the terms and conditions of the Creative Commons Attribution (CC BY) license (https://creativecommons.org/licenses/by/4.0/).
Share and Cite
Sunuwar, J.; Azad, R.K. Identification of Novel Antimicrobial Resistance Genes Using Machine Learning, Homology Modeling, and Molecular Docking. Microorganisms 2022, 10, 2102. https://doi.org/10.3390/microorganisms10112102
Sunuwar J, Azad RK. Identification of Novel Antimicrobial Resistance Genes Using Machine Learning, Homology Modeling, and Molecular Docking. Microorganisms. 2022; 10(11):2102. https://doi.org/10.3390/microorganisms10112102
Chicago/Turabian StyleSunuwar, Janak, and Rajeev K. Azad. 2022. "Identification of Novel Antimicrobial Resistance Genes Using Machine Learning, Homology Modeling, and Molecular Docking" Microorganisms 10, no. 11: 2102. https://doi.org/10.3390/microorganisms10112102
APA StyleSunuwar, J., & Azad, R. K. (2022). Identification of Novel Antimicrobial Resistance Genes Using Machine Learning, Homology Modeling, and Molecular Docking. Microorganisms, 10(11), 2102. https://doi.org/10.3390/microorganisms10112102