1. Introduction
Electromagnetic actuators are nowadays widely applied in industrial, automotive, and consumer applications. In particular, single-phase reluctance actuators with proportional or switching positioning characteristic, such as valves, relays, and solenoids, are used in high quantities due to their low price. Such kinds of actuators are based on a simple and robust construction while high strokes and high forces are obtained. In the last few years, there is an increasing interest in condition monitoring and predictive maintenance mainly under the term of Industry 4.0. Such trends also involve the reluctance actuators mentioned above with the aim of obtaining reliable position information for various control and monitoring applications [
1,
2,
3]. Most of the above-mentioned actuators do not include a position sensor since sensors increase significantly the system cost, size, and complexity. Only high-quality products include sensors such as encoders, linear variable differential transformers (LVDTs) or mechanical switches used for end-position detection. Nevertheless, such solutions seem inadequate in the field of low-cost actuators. Moreover, even high-quality applications with sensors require redundant position information in case high functional safety is desired [
4].
The problem of an inherent position sensing is addressed by the so-called sensorless techniques, a field that is widely known for decades in the case of electrical machines [
5,
6,
7,
8,
9]. Common approaches for machines make use of two physical effects: the evaluation of the back-induced electromotive force (back-EMF) [
5] and the exploitation of the position-dependent inductance [
6,
7,
8,
9]. Techniques using back-EMF information mainly make use of observers and are applicable only for middle and high-speed applications, thus making this approach unsuitable for solenoids used in positioning applications. On the other hand, techniques using the inductance information allow position estimation even in standstill conditions, making such kinds of techniques appropriate for solenoids. Remarkable works in this field are based on the injection of voltage test signals in order to estimate the inductance and then, in a further step, the position. In the field of rotating machines, a renowned work was made by Schroedl on the so-called INdirect Flux detection by On-line Reactance Measurement (INFORM) approach [
6]. In this work, voltage test pulses are applied and the resulting current rise is measured. From the evaluation of the current rise, a precise inductance and position estimation is possible. Other techniques [
7,
8,
9] go under the term of high frequency current injection (HFCI), since they are injecting a high-frequency voltage carrier into the actuator. By measuring and demodulating the resulting current, an inductance and, therefore, position estimation is possible.
Inspired by the success of sensorless control for rotating machines, similar approaches arose also for solenoid actuators. In particular, the works [
10,
11] show the observer approach applied to solenoids while the works [
3,
12] show the successful application of the injection-based approach. Nevertheless, the injection-based techniques suffer from several disadvantages: due to the injection of an harmonic signal into the actuator, a considerable acoustic noise as well as a force ripple is generated while power losses inside the system are increased. Furthermore, the applicable driving voltage is reduced by the superposition of an injection signal and the dynamic working range is reduced, since the mechanical movement must be considerably slower than the frequency of the injection signal. Hence, more sophisticated works exploit the current variation caused by the use of a switching power electronics operated under Pulse Width Modulation (PWM). Such ripple is inherently present inside the actuator, and no further signal injection is required.
Works exploiting and analyzing the current ripple in reluctance actuators are mainly divided into three categories: derivative-based methods, oversampling methods, and analog signal processing methods. Derivative-based works such as [
13,
14,
15,
16,
17] measure the current ripple in order to calculate numerically the current derivative, which is strictly linked to the inductance. By considering a 2nd order derivative, a compensation of the resistive effect and the back-EMF is possible. Nevertheless, a significant demerit of those techniques is the robustness and the signal-to-noise ratio (SNR) of the obtained estimate, since the derivative of a current measurement, usually affected by noise, is calculated. This becomes more significant in applications exhibiting small currents and small inductance variations. Moreover, those techniques calculate the derivative by assuming a linear slope of the current ripple, which is usually exponentially shaped. Due to its demerits, these kinds of techniques are not considered here. In order to increase the SNR significantly, other works [
18,
19,
20,
21,
22] make use of an oversampled current measurement with a sampling rate significantly higher than the PWM frequency. Based on the obtained data set, a regression or a curve fitting of the current ripple allows the identification of the inductance. This leads to a precise and robust measurement of the inductance with high SNR. Nevertheless, the oversampled measurement and the required data processing, usually based on least-mean squares methods, require high computational and sampling effort. For instance, the work [
21] requires 10 k Samples per each PWM period. This makes the implementation of such techniques expensive and, therefore, unacceptable in low-cost applications like solenoids. The last category based on hardware signal processing tries to decrease computational effort by pre-processing the signals through an analog electronics: the hysteresis amplifier in [
23] offers a simple method for estimating the inductance. Nevertheless, it requires a linear power electronics instead of a switching power electronics, making this solution unsuitable in terms of energy efficiency. The work [
24] makes use of an analog demodulation unit consisting of a high-pass filter, a rectifier, and a low-pass filter. This allows an estimate of inductance within analog electronics, with the demerit of a limitation in dynamics.
The above-mentioned techniques show that the use of a pre-processing hardware increases the SNR while minimizing the computational effort. This inspired the works [
25,
26,
27] introducing the so-called Integrator-Based Direct Inductance Measurement (IDIM) technique, which makes use of an analog integrator for inductance estimation: due to the concept of analog integration, the current ripple can be amplified while the noise is rejected during integration. While [
25,
26] presented the basic concept of the IDIM approach with several restrictions on the current dynamics, Ref. [
27] proposed an approach without any restriction on the dynamics. The IDIM technique is successfully applied to electromagnetic reluctance actuators and its accuracy and applicability is successfully shown in the above-mentioned works. In particular, the improved approach is verified on an electromagnetic levitation system with closed-loop position control.
Nevertheless, solenoid actuators usually exhibit significant parasitic effects such as eddy currents, especially due to non-laminated ferromagnetic materials, and parasitic capacitances due to a high number of windings. Such effects represent a major limitation in actuators since they significantly influence the induced current ripple. Therefore, the following work offers a thorough analysis of the current ripple inside an electromagnetic reluctance actuator including parasitic effects such as iron losses, eddy currents, and capacitances as well as back-EMF voltages and improves the mathematical description of the IDIM technique taking into account the presence of those effects. Another important research aspect concerns noise rejection and computational effort of the discussed techniques. In general, oversampling approaches guarantee a robust identification with high SNR as long as a sufficiently large numbers of samples is given, thus leading to a significant increase in measurement and computational effort. It is of interest to compare these kinds of techniques to the IDIM technique in terms of noise robustness and needed measurement effort in order to find the trade-off-point between oversampling approaches with different numbers of samples and the IDIM technique. Therefore, an experimental set-up with an industrial solenoid actuator is used to identify and compare the noise power of the estimated inductance in case the IDIM technique or an oversampling algorithm is used. Finally, in order to prove the performance of the IDIM technique in the case of a low-cost actuation system, the technique is applied to a practical use case scenario: the position estimated by the sensorless technique is used for end-position detection in a solenoid actuator with switching behavior in order to detect whether the actuator has opened or closed successfully. The obtained sensorless position estimator is compared to the position measured by an high-precision positioning table and conclusions concerning precision, noise robustness, and implementation effort are drawn.
2. Mathematical Analysis of the Current Ripples inside Electromagnetic Actuators
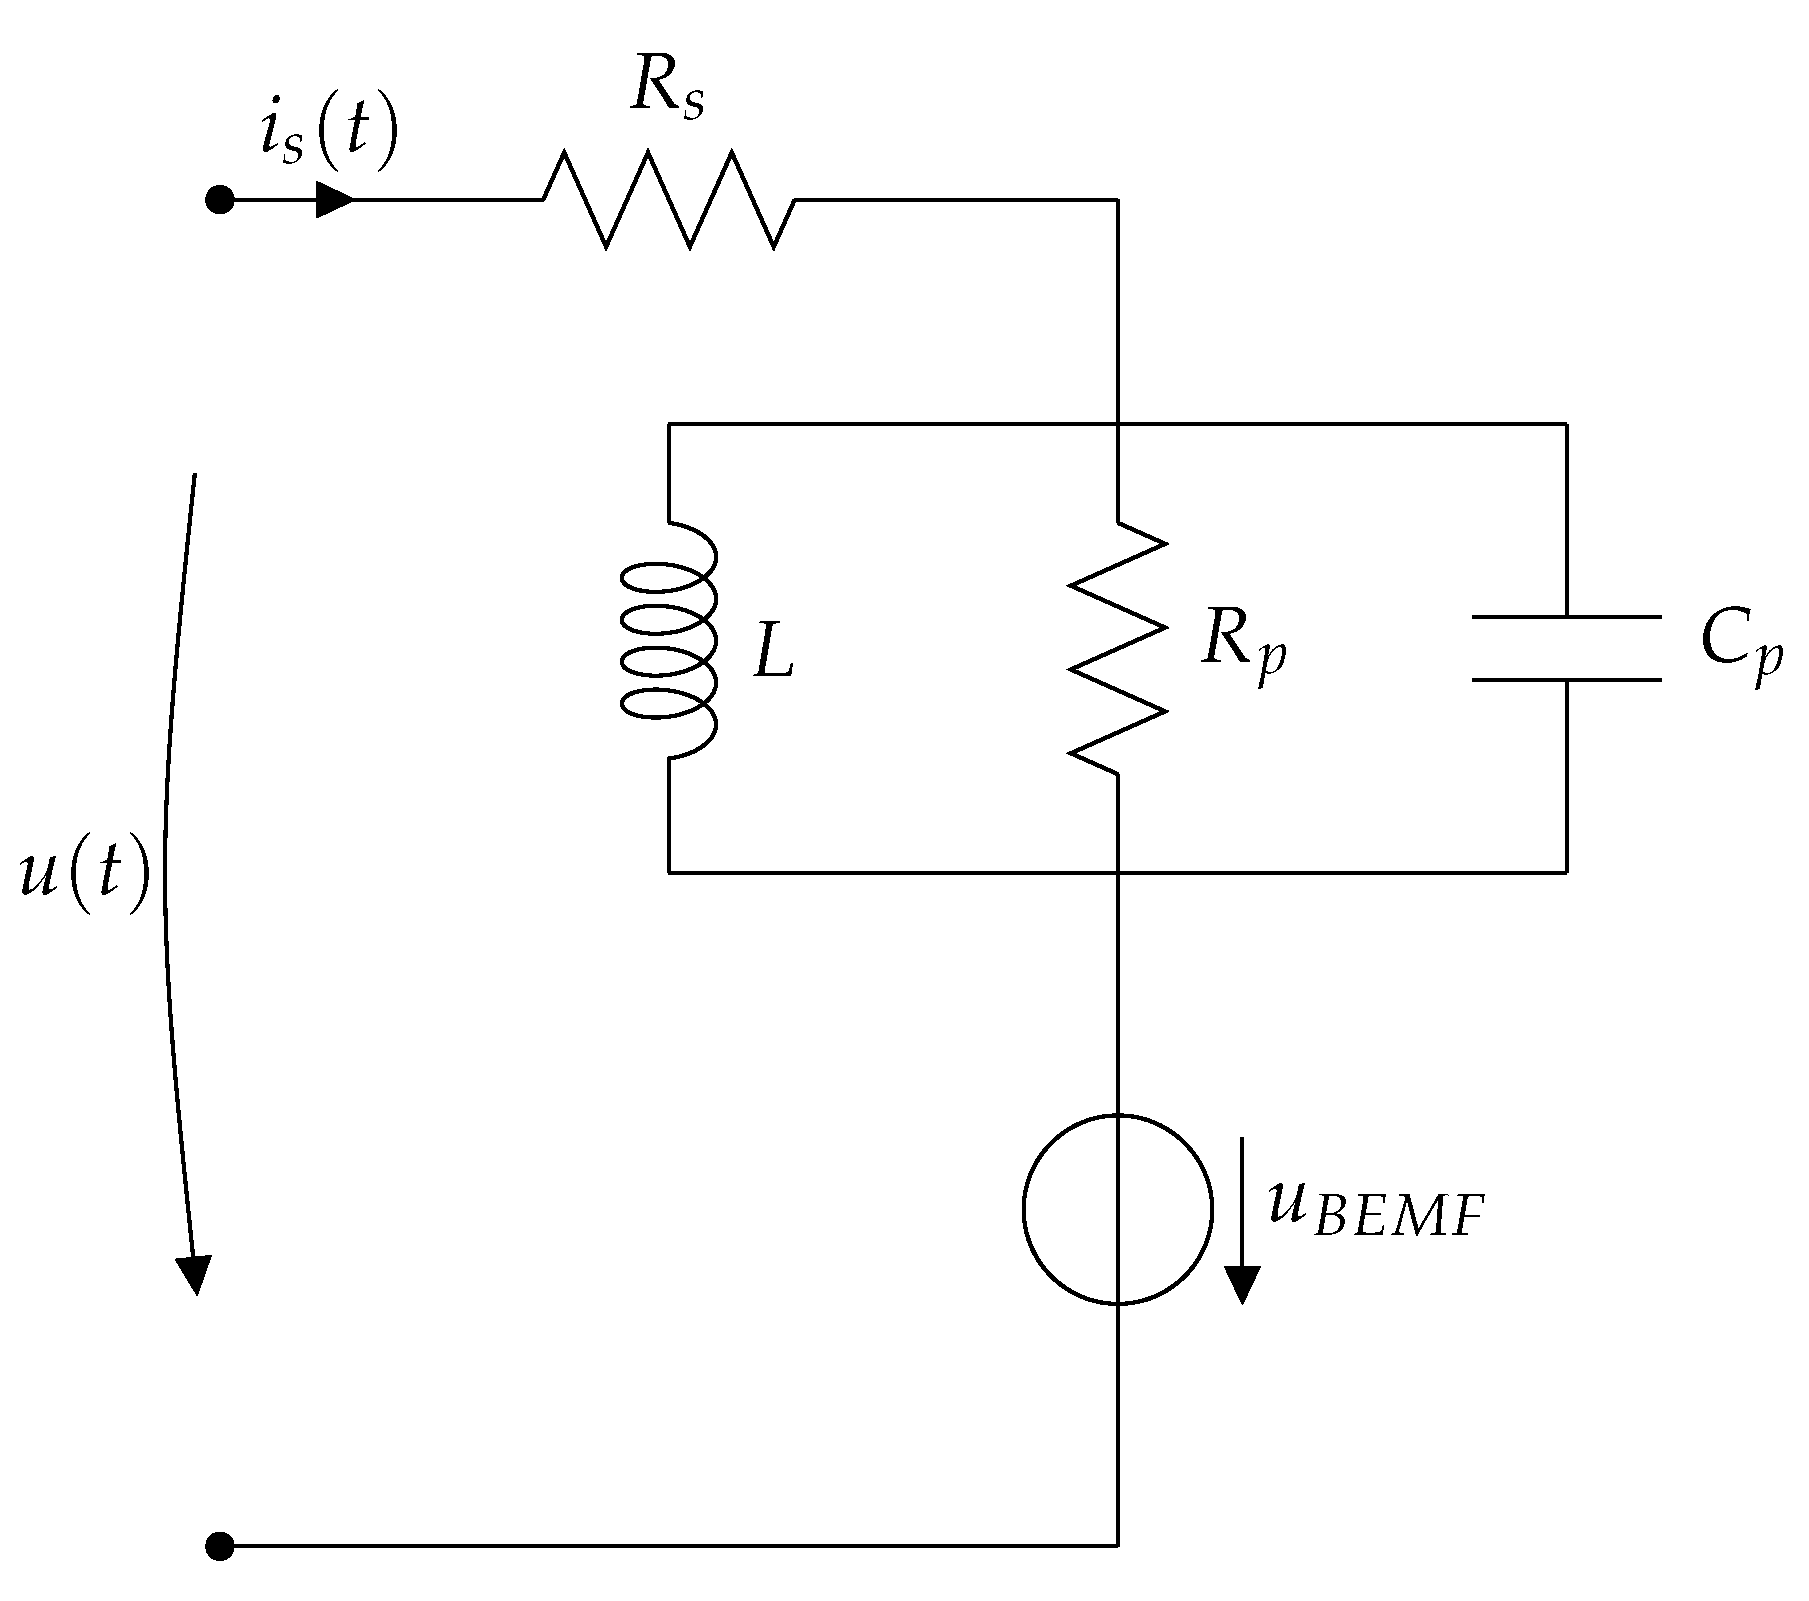
A generic electromagnetic actuator and its parasitic effects can be modeled by the electrical equivalent circuit shown in
Figure 1, as proposed in the work [
23]. In particular, the model contains a series resistance
, due to the copper wire and connectors, as well as an inductance
L. The parallel resistance
represents dissipative elements in the actuator such as iron losses like eddy currents. Additionally, a capacitive coupling between the actuator windings, housing, and plunger are modeled by the parallel capacitance
. The voltage source
denotes the back-EMF induced inside the actuator during motion. The voltage
u is the driving voltage present at the actuator terminals while the current
stands for the total current flowing through the actuator.
In the particular case of reluctance-based electromagnetic actuators such as solenoids, where no permanent magnets are present, the discussed electrical equivalent circuitry can be simplified by making a consideration on the back-EMF voltage
. Thus, by considering the flux
inside the actuator:
it can be seen that the back-EMF inside the actuator has a linear dependency on the current. Therefore, the back-EMF can be represented as a resistive component, depending on the position
x and the speed
v of the actuator. Therefore, the total resistance
of the actuator can be defined as:
Electromagnetic actuators are usually driven by switching power electronics such as H-bridges and, therefore, are driven with a bipolar PWM voltage, which can be described mathematically as:
where
is the DC-link voltage of the used power electronics,
is the PWM time period and
denotes the applied duty cycle, which is limited to a value between 0% and 100%:
. The driving of the actuator with such a bipolar PWM voltage inherently introduces a current ripple, which overlaps the fundamental current of the actuator. This ripple can be seen as the periodic partial charging and discharging of the inductor. Therefore, the current ripple excites the inductance in the small signal range around its actual working point, leading to the presence of the so called differential inductance
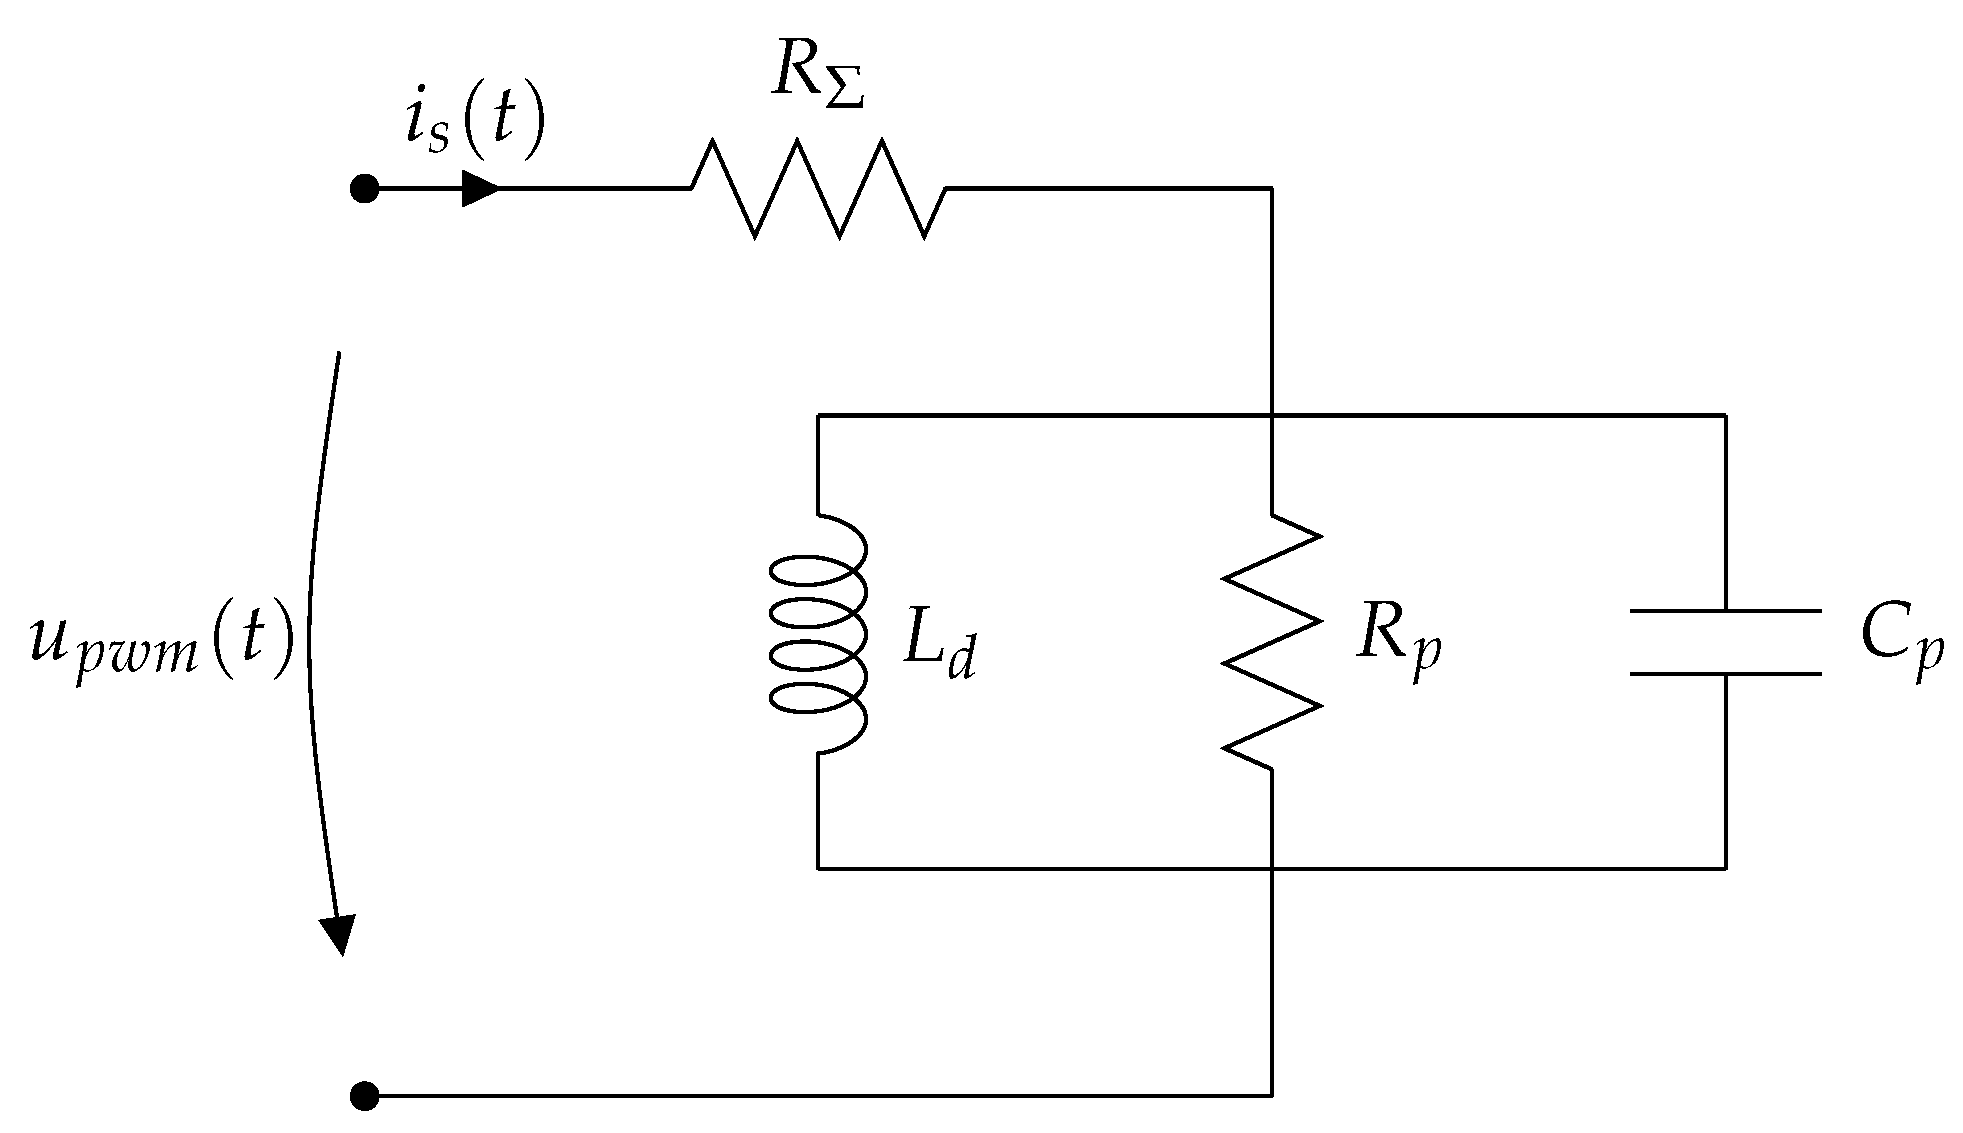
. Thus, together with the consideration on the back-EMF, the electrical equivalent circuit of a reluctance-based actuator can be simplified, as shown in
Figure 2.
By applying Kirchhoff’s rules, the differential equation of the circuitry can be obtained:
In particular, the differential equation contains the parameters , , and , which usually vary over time due to mechanical movement or temperature change. Indeed, this work exploits the position dependence of the differential inductance . Nevertheless, those parameters can be assumed constant over one PWM period in order to simplify the analytical solution of that differential equation. This assumption holds for most actuators due to the fact that the mechanical time constant and the thermal time constant are several orders of magnitude higher than the electrical time constant and the applied PWM period.
2.1. Analysis of the Response of a RL Circuit Driven with a PWM Voltage
In the first step, only the resistive part
as well as the inductance
will be considered in the analysis of the ideal current response of an electromagnetic actuator under PWM operation. The parasitics are neglected by setting
and
, thereby leading to the differential equation:
The solution of the differential equation given an input
equal to zero is:
where the initial current in the coil is denoted as
. Solving the differential Equation (
5) for the piecewise-defined PWM input shown in Equation (
3), in particular where
and therefore
for
and
for
, yields to:
where
For better understanding, this equation can be transformed into:
where the fundamental current
as well as
can be clearly separated from the current ripple.
2.2. Analysis of the Response of the Complete Circuit Driven with a PWM Voltage
In order to analyze the behavior of an electromagnetic actuator together with its parasitics, the full differential Equation (
4) including the parallel resistance
as well as the parasitic capacitance
will be considered. For sake of brevity, we skip the analytical expression and show directly the numerical solution of the differential equation. Because the numerical solver does not converge at the PWM switching points due to the lack of differentiability, a PWM switching voltage with a ramp instead of sharp edges is used for numerical simulation. The slope of this ramp is considered with a rise time of 100
, allowing convergence of the solver and representing typical switching times in power electronics made of field-effect transistors.
Equation (
4) represents a second order system, which can be critically damped, underdamped, or overdamped based on the conditions:
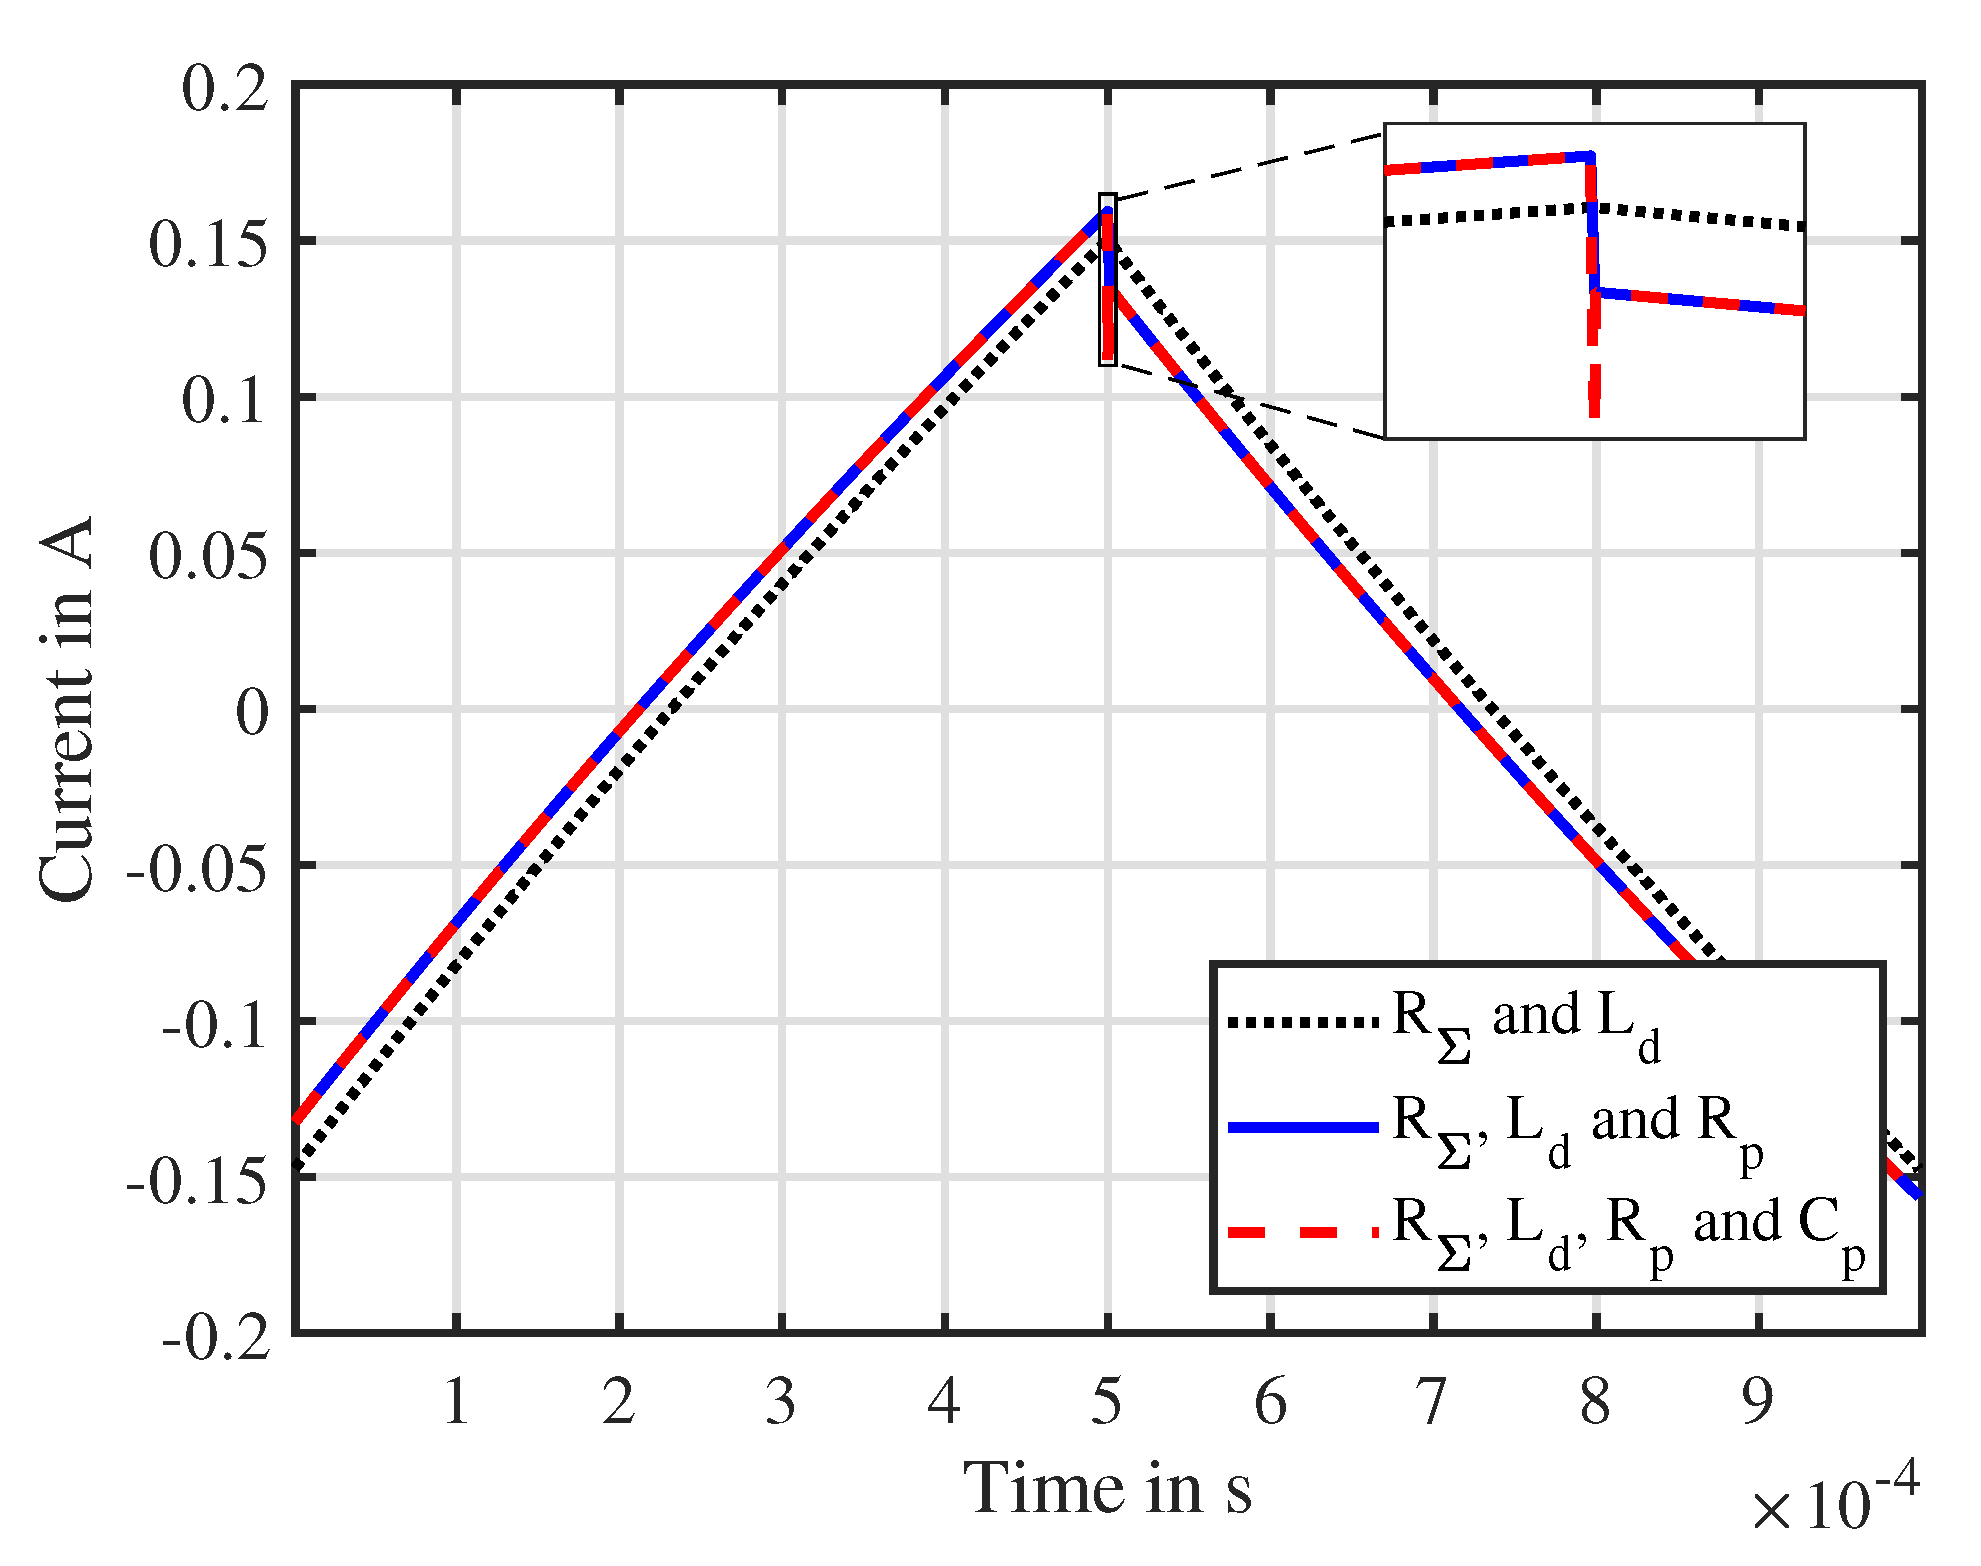
The simulated current
inside the actuator is shown in
Figure 3 for a parameter set representing the overdamped case.
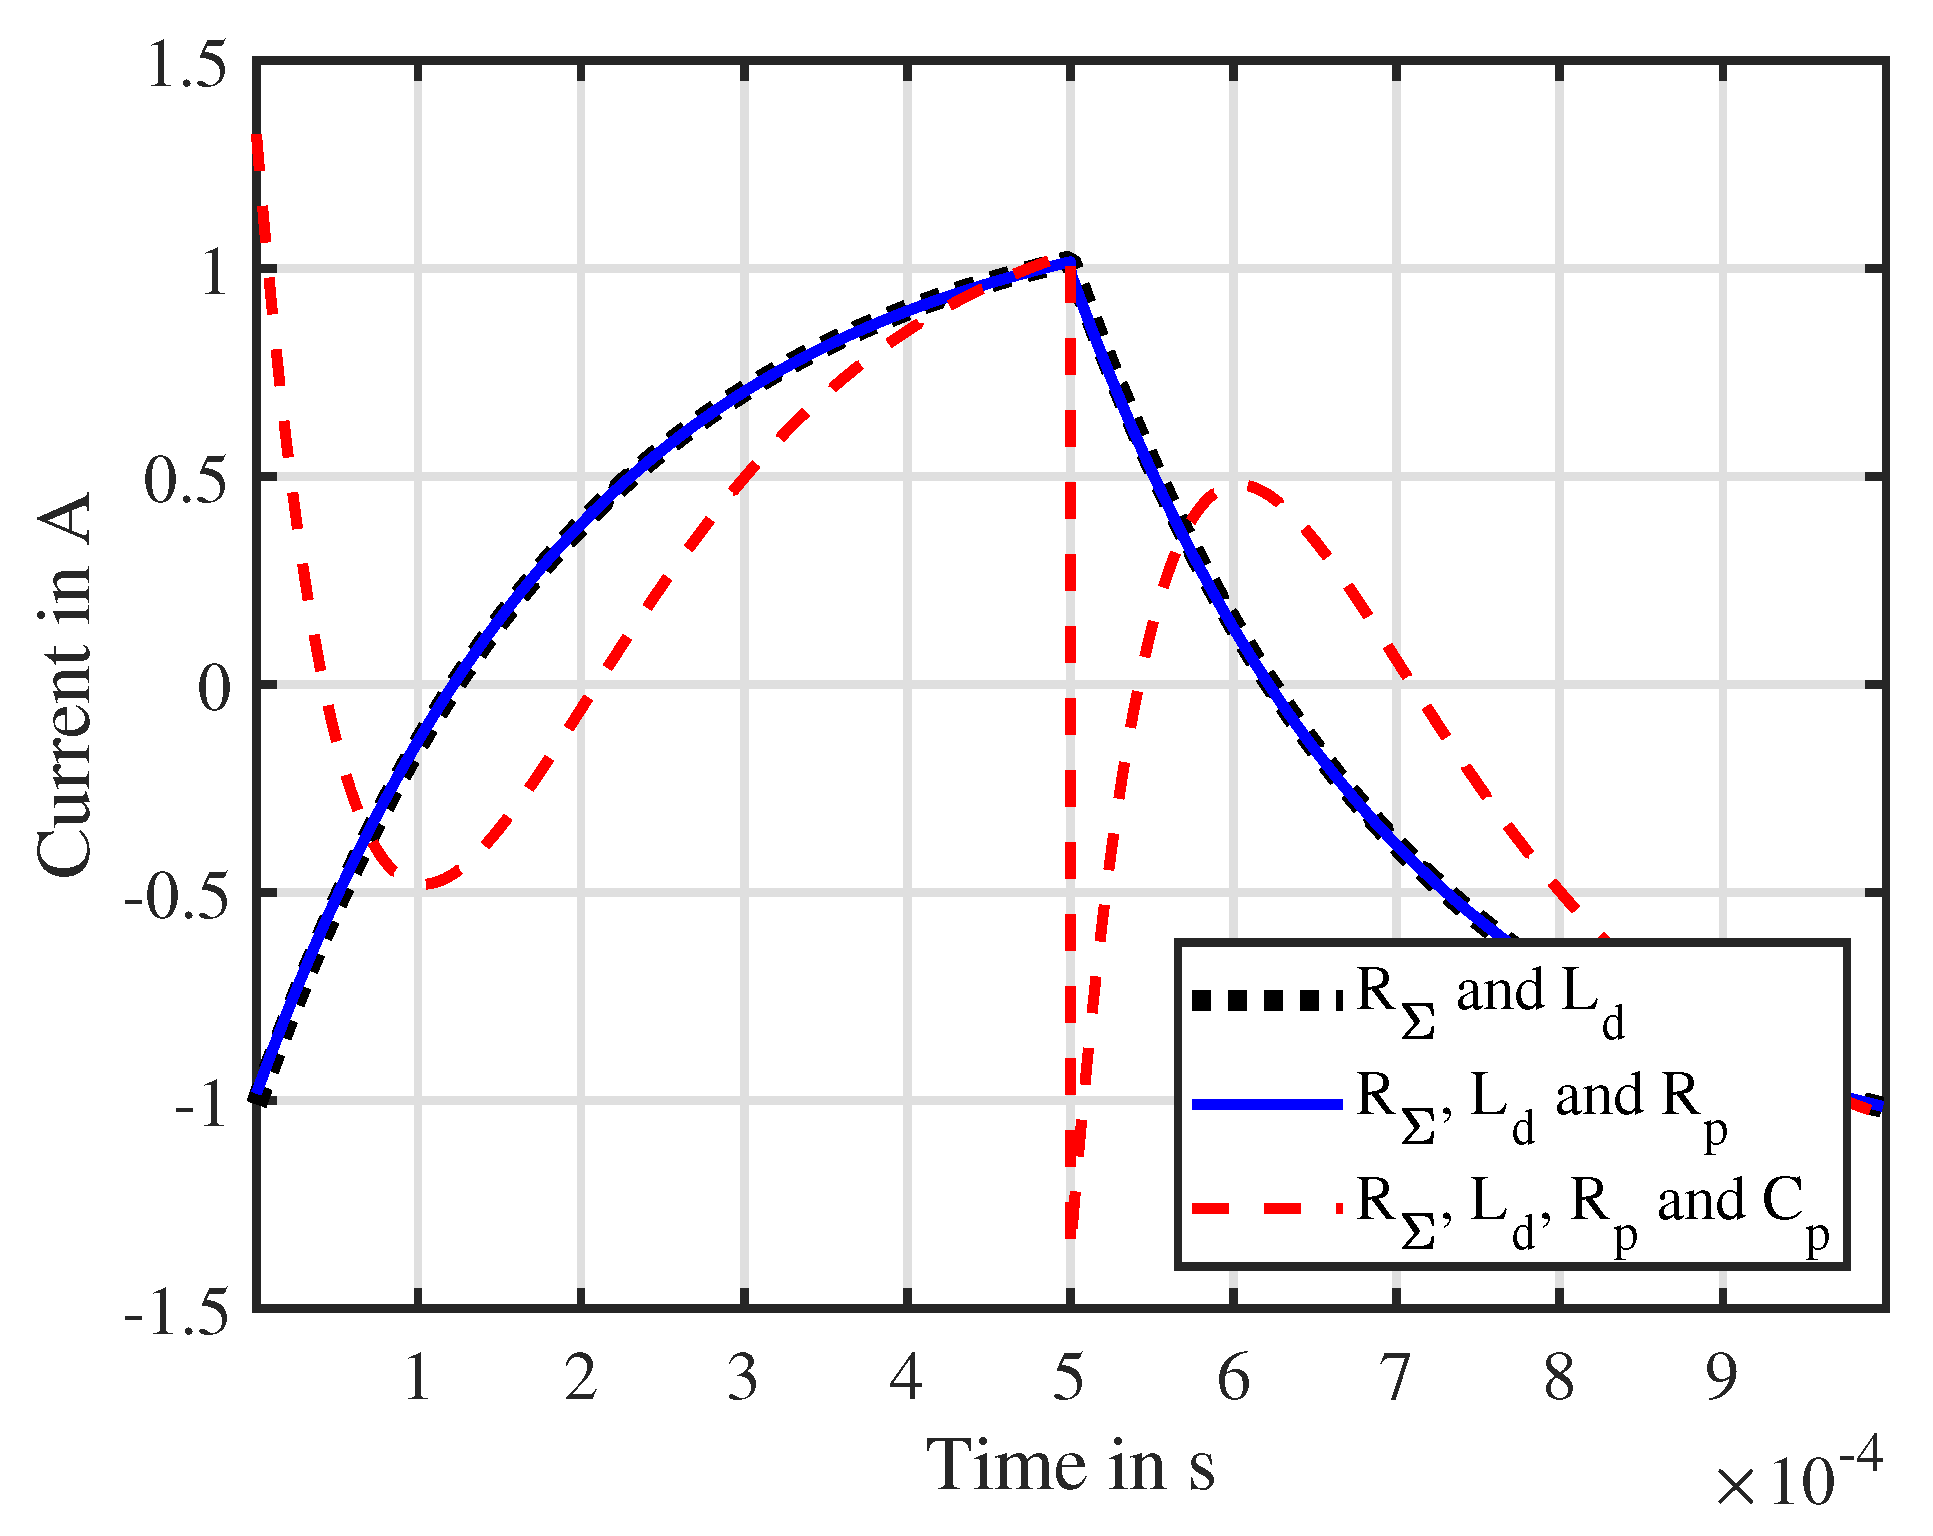
Figure 4 illustrates
for the case of a parameter set of an underdamped circuit. In order to highlight the influence of the parasitics, the current response without each of the parasitics is added in the figures. It must be denoted that the presented example exaggerates the parasitic capacitance for better visibility. In common electromagnetic actuators, the parasitic capacitance is usually so small [
28] that, according to condition (
12), the circuit can be considered as overdamped. In the over- and underdamped case, it is clearly visible that the charging current of the capacitor superimposes the classical response of the current ripple in a RL-circuit, especially at the switching instants, where overshoots occur. This effect becomes more significant in case
is increased. Additionally, the parallel resistance leads to a slight change in the slope of the current ripple and to a voltage jump happening at the switching instant. The height of that jump strictly depends on the value of
. This is due to the reason that the resistor bypasses the inductance at the switching instant, allowing eddy currents to flow directly. In reality, currents cannot rise with such an infinite slew rate due to the presence of inductances delaying those currents. Nevertheless, those inductances are usually so small that this model still provides a sufficient approximation.
2.3. Approximation of the Model for Common Electromagnetic Reluctance Actuators
As seen above, parasitic components such as eddy currents and parasitic capacitances can play a significant role in the obtained current ripple, especially at the switching instants of the PWM voltage. Nevertheless, assumptions can be considered, which simplify the mathematical treatment significantly and which still hold on most of the common electromagnetic reluctance actuators. In the first step, the series resistance
is considered being much smaller than the parallel resistance
:
. This is due to the reason that, in the particular case of reluctance actuators, the series resistance consists of one side on the copper resistance and on the other side on the part
representing the back-EMF induced during movement. The first one is normally designed to be small in order to decrease power dissipation. The latter one, indeed, does not predominate since such actuators are made for positioning applications and not for high speed operation. In the next step, considerations are made on the parasitic capacitance
. In particular, the capacitive coupling between the windings as well as the housing and the plunger is so small that the system is overdamped and so small that the eigenfrequency
is much higher than the PWM frequency. Therefore, the following assumption can be made:
. Indeed, many works such as [
23,
28] neglect the parasitic capacitances in solenoids completely. Nevertheless, the overshoot at the switching instant still occurs in the overdamped case.
3. Inductance Estimation Approaches
In the following, inductance estimation techniques will be shown, which exploit the current ripple that is derived mathematically in the previous section. Firstly, the IDIM technique is recalled and adapted in such a way that it is not influenced by the presence of parasitics. Then, a simplified IDIM technique is derived for applications that do not require high dynamics. Finally, a classical oversampling approach discussed in the state-of-the-art is briefly shown for comparison.
3.1. Integrator-Based Direct Inductance Measurement (IDIM) Approach
Figure 5 shows the analog measurement circuitry that is necessary for the implementation of the IDIM technique. The circuitry removes the fundamental current component from the sensed current signal by means of a sample and hold (S/H) stage and integrates the offset-elimated current
over defined integration windows. By removing the offset, the current ripple containing the inductance information can be separated from the fundamental current, and, therefore, can be strongly amplified while noise is rejected.
The integration windows and their corresponding trigger signal
can be chosen in such a way that the switching instants of the PWM voltage can be avoided during integration. At these time instants, not only the direct feed-through of the first and second voltage derivative caused by
and
occur, but also nonlinear effects caused by the switching electronics such as dead-time insertion and ringing as well as glitches occur. Moreover, most current sensors suffer from limited bandwidth and slew rate in these time instants. Resetting the integrator in those time periods ensures that these effects do not influence the inductance measurement with IDIM. The avoidance of acquiring measurements in these areas is also considered in the oversampling approaches such as [
21].
In order to avoid the switching instants, the trigger signal
can be defined as:
with
When
is equal to 0, the S/H stage holds its actual value and the integration starts and when
is equal to 1, the integrator is reset and the S/H stage is sampling the input. The times
and
are the times of the start and the end of the integration window when the positive voltage pulse is applied, hence the times
and
refer to the ones when a negative pulse is applied. The design parameter
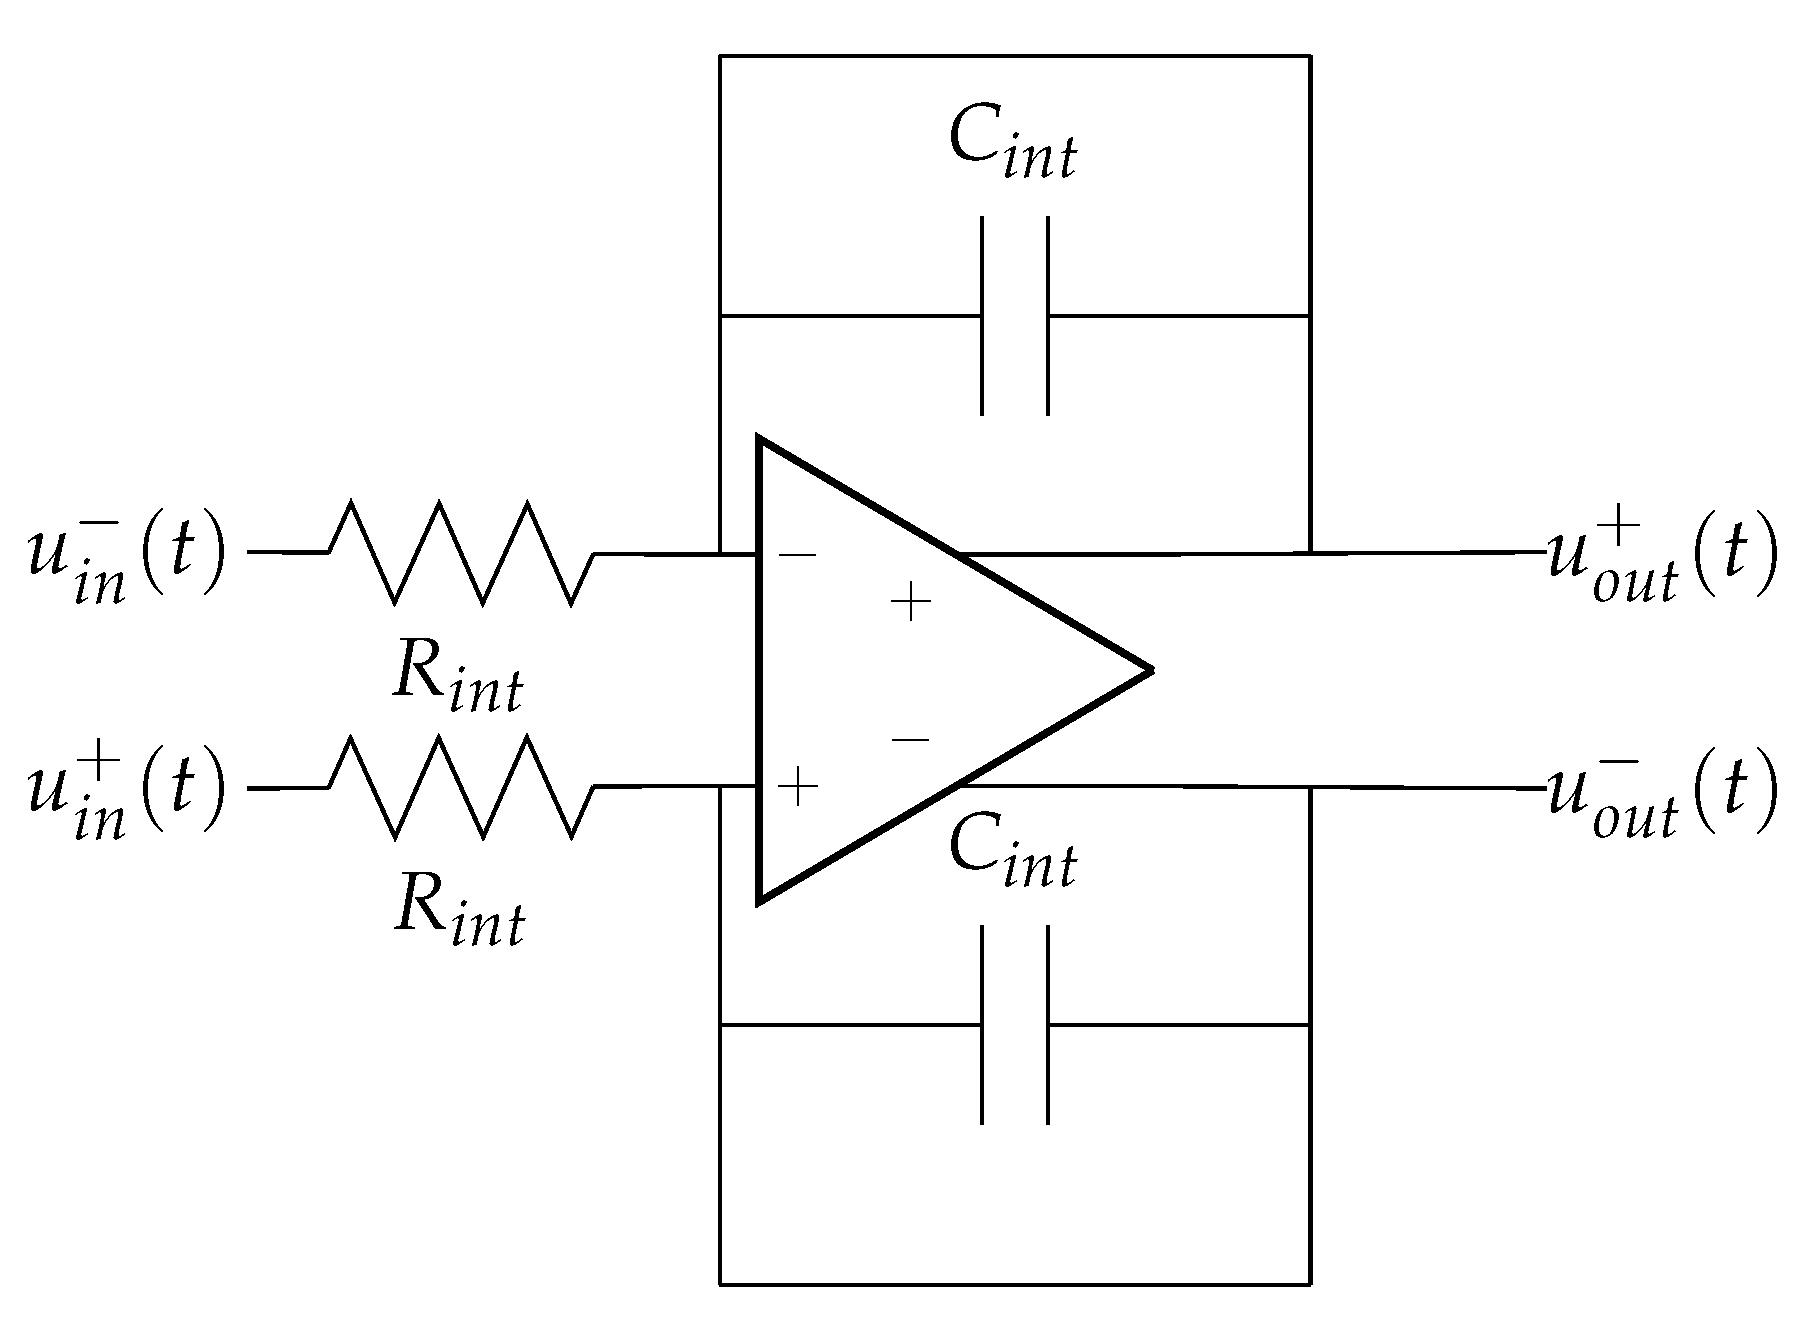
should be chosen sufficiently long to ensure that the disturbances caused by the voltage switching are decayed and the integrator is fully reset. The integrator stage with embedded reset capability can be realized by a fully differential operational amplifier with electronic switches parallel to the integrator capacitor
, as shown in
Figure 6.
Its transfer characteristics can be described analytically as follows:
where
is the output voltage of a current sensor. For better comprehension, the current sensor and its transfer function will be not considered here and the mathematical description will directly focus on the sensed current. The term
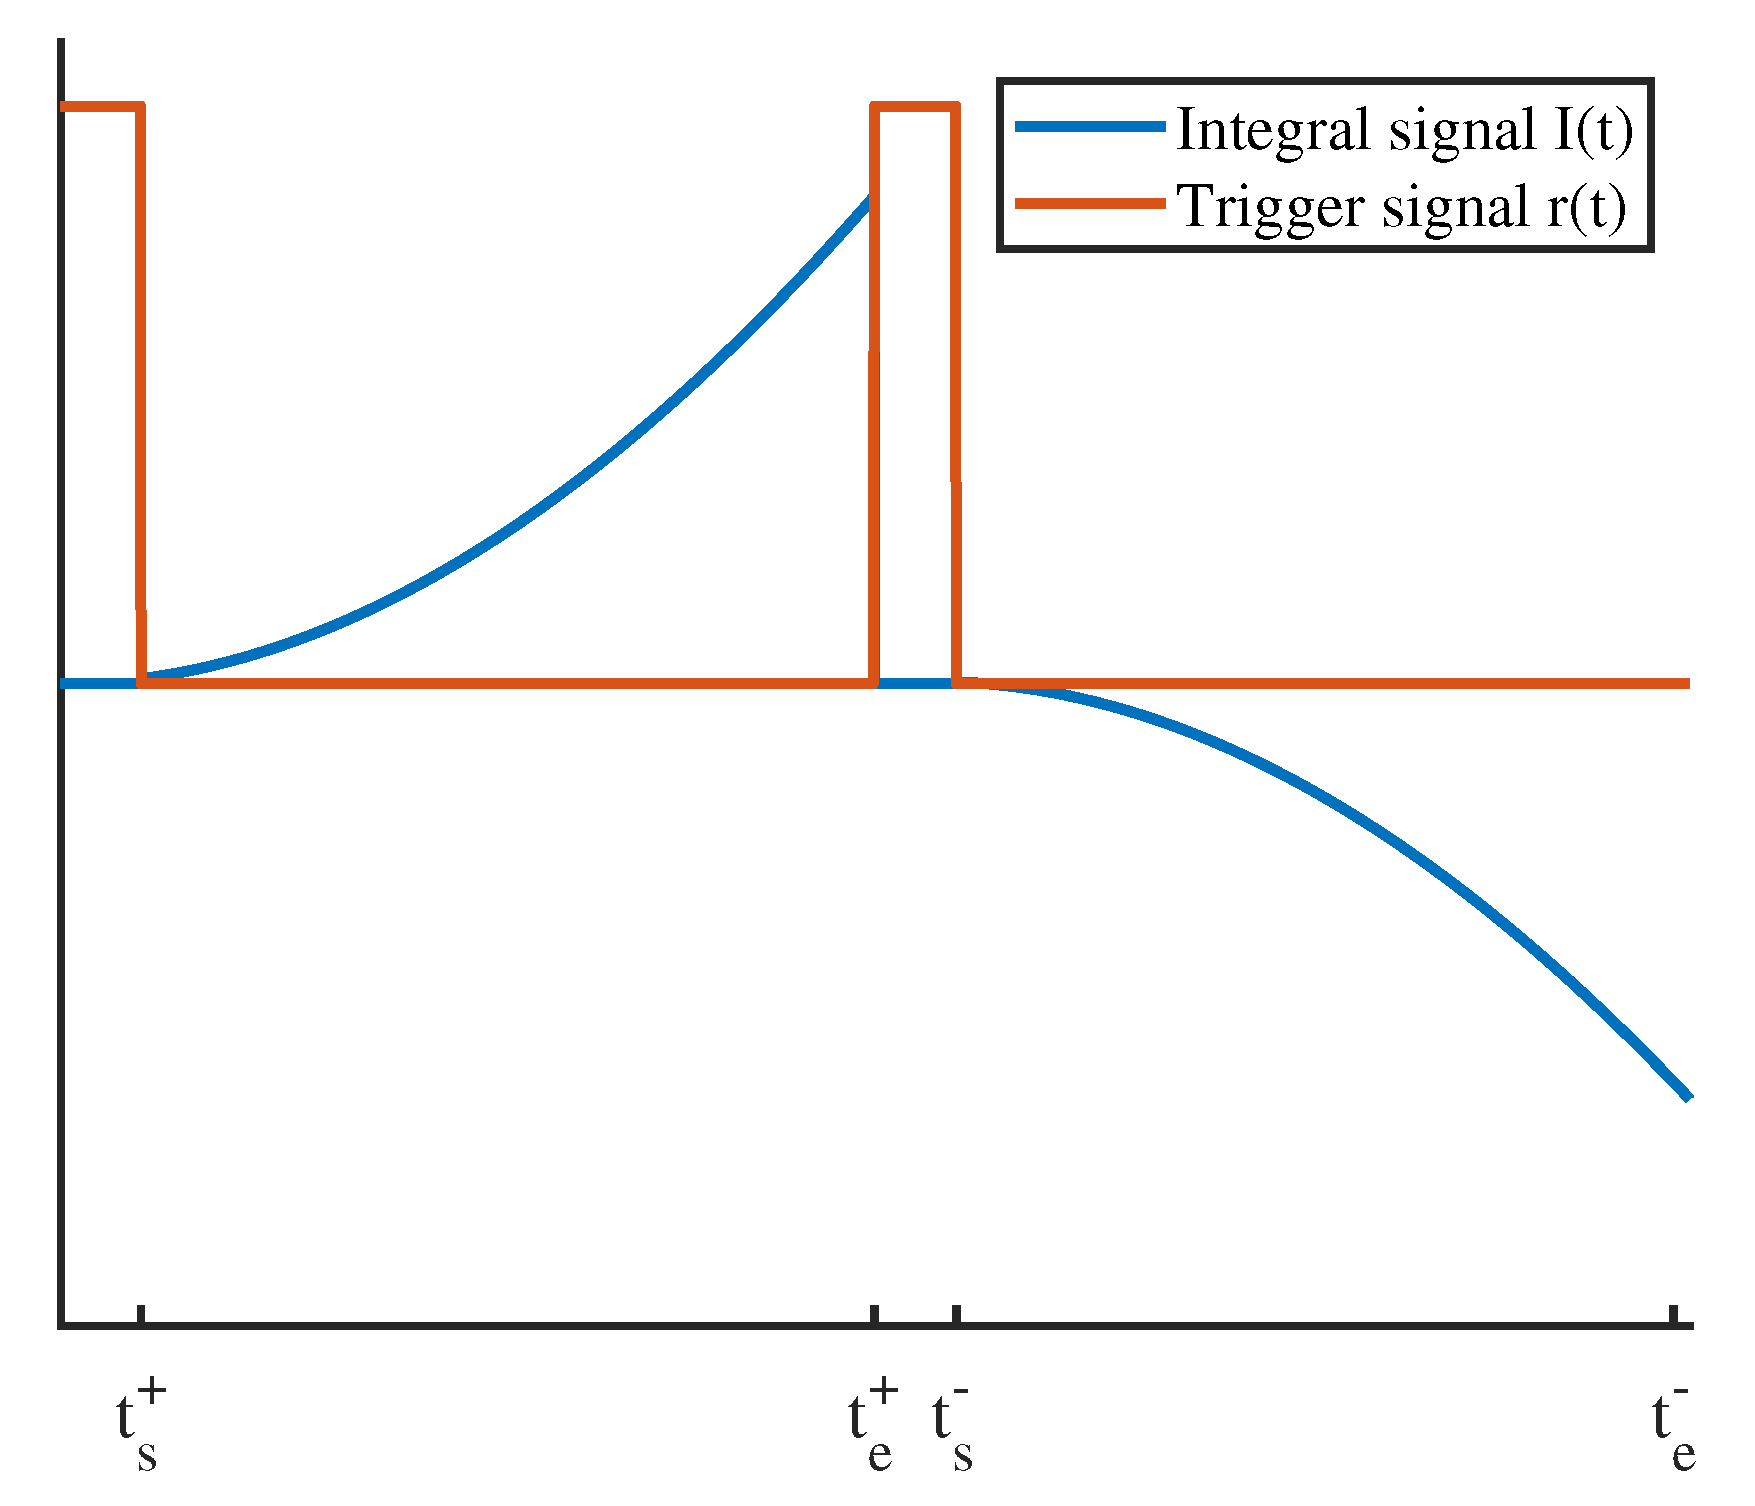
represents the integration gain, which has to be chosen carefully by the user in order to avoid saturation of this stage. For sake of brevity, this gain is set to 1 in the following derivations. Due to the periodic reset, the integrator does not suffer from offsets or drifts. The output of the integrator stage with respect to the given trigger signal
is shown exemplarily in
Figure 7 for a current ripple caused by a PWM voltage with a duty cycle
of 0.5.
Based on the illustrated integrator circuitry, the integral of the current ripple can be defined as:
which can be rewritten by considering Equation (
4) as
where
represents the time where the S/H stage holds, in particular
for the positive voltage pulse and
for the negative voltage pulse. This expression can be evaluated for the given voltage shown in Equation (
3), exemplary shown for the positive voltage pulse:
This expression allows for calculating the output of the IDIM circuitry shown in
Figure 5 taking into account the presence of the parasitics. Since the integrator is reset at the start of the integration, the initial value of the integral can be set to zero:
. By using the approximations
and
mentioned in
Section 2.3 and by evaluating the function values of the given input voltage
and
, the equations can be simplified to:
Analogically, the expression for the negative pulse can be obtained:
Equations (
19) and (
20) can be merged into a matrix form:
allowing the calculation and analysis of the determinant of matrix
:
The determinant must be always unequal to zero for determining the parameters of
and
. It can be shown that the determinant is equal to zero, e.g., when there is zero mean current. Without a current in the coil, an identification of the resistance
becomes impossible, thus
cannot be identified correctly. In such cases, a pre-identified value of
has to be used for the estimation of
. In that situation, the mean current equals zero; therefore, according to Equation (
2), no back-EMF is present and
equals the series resistance
, which can be pre-identified using standard resistance measurement techniques, such as a recursive least squares (RLS) based identifier [
29].
In case the matrix
A is invertible, the parameters
and
can be estimated by the expressions:
Since the resistance is actively identified and compensated in the estimation of the differential inductance, a back-EMF or a change of the resistance due to heating can be compensated. Additionally, it can be seen that this technique requires in total seven measurements per PWM period: one DC link voltage measurement, measurements of the integrator at two time instants per each PWM period, and current measurements at four time instants per each PWM period. The estimate of inductance and resistance can be obtained by solving two closed equations. Nevertheless, those equations contain current differences, whose calculation might increase the noise power of the estimate.
3.2. Simplified IDIM Approach
The simplified IDIM technique neglects the effect of the parallel resistance
as well as the parallel capacitance
and assumes that the actuator is driven with a low current dynamic. This is especially suitable for end-position detection for switching actuators, where the position is determined after the switching in a quasi-static manner. The following derivation resembles the work [
25].
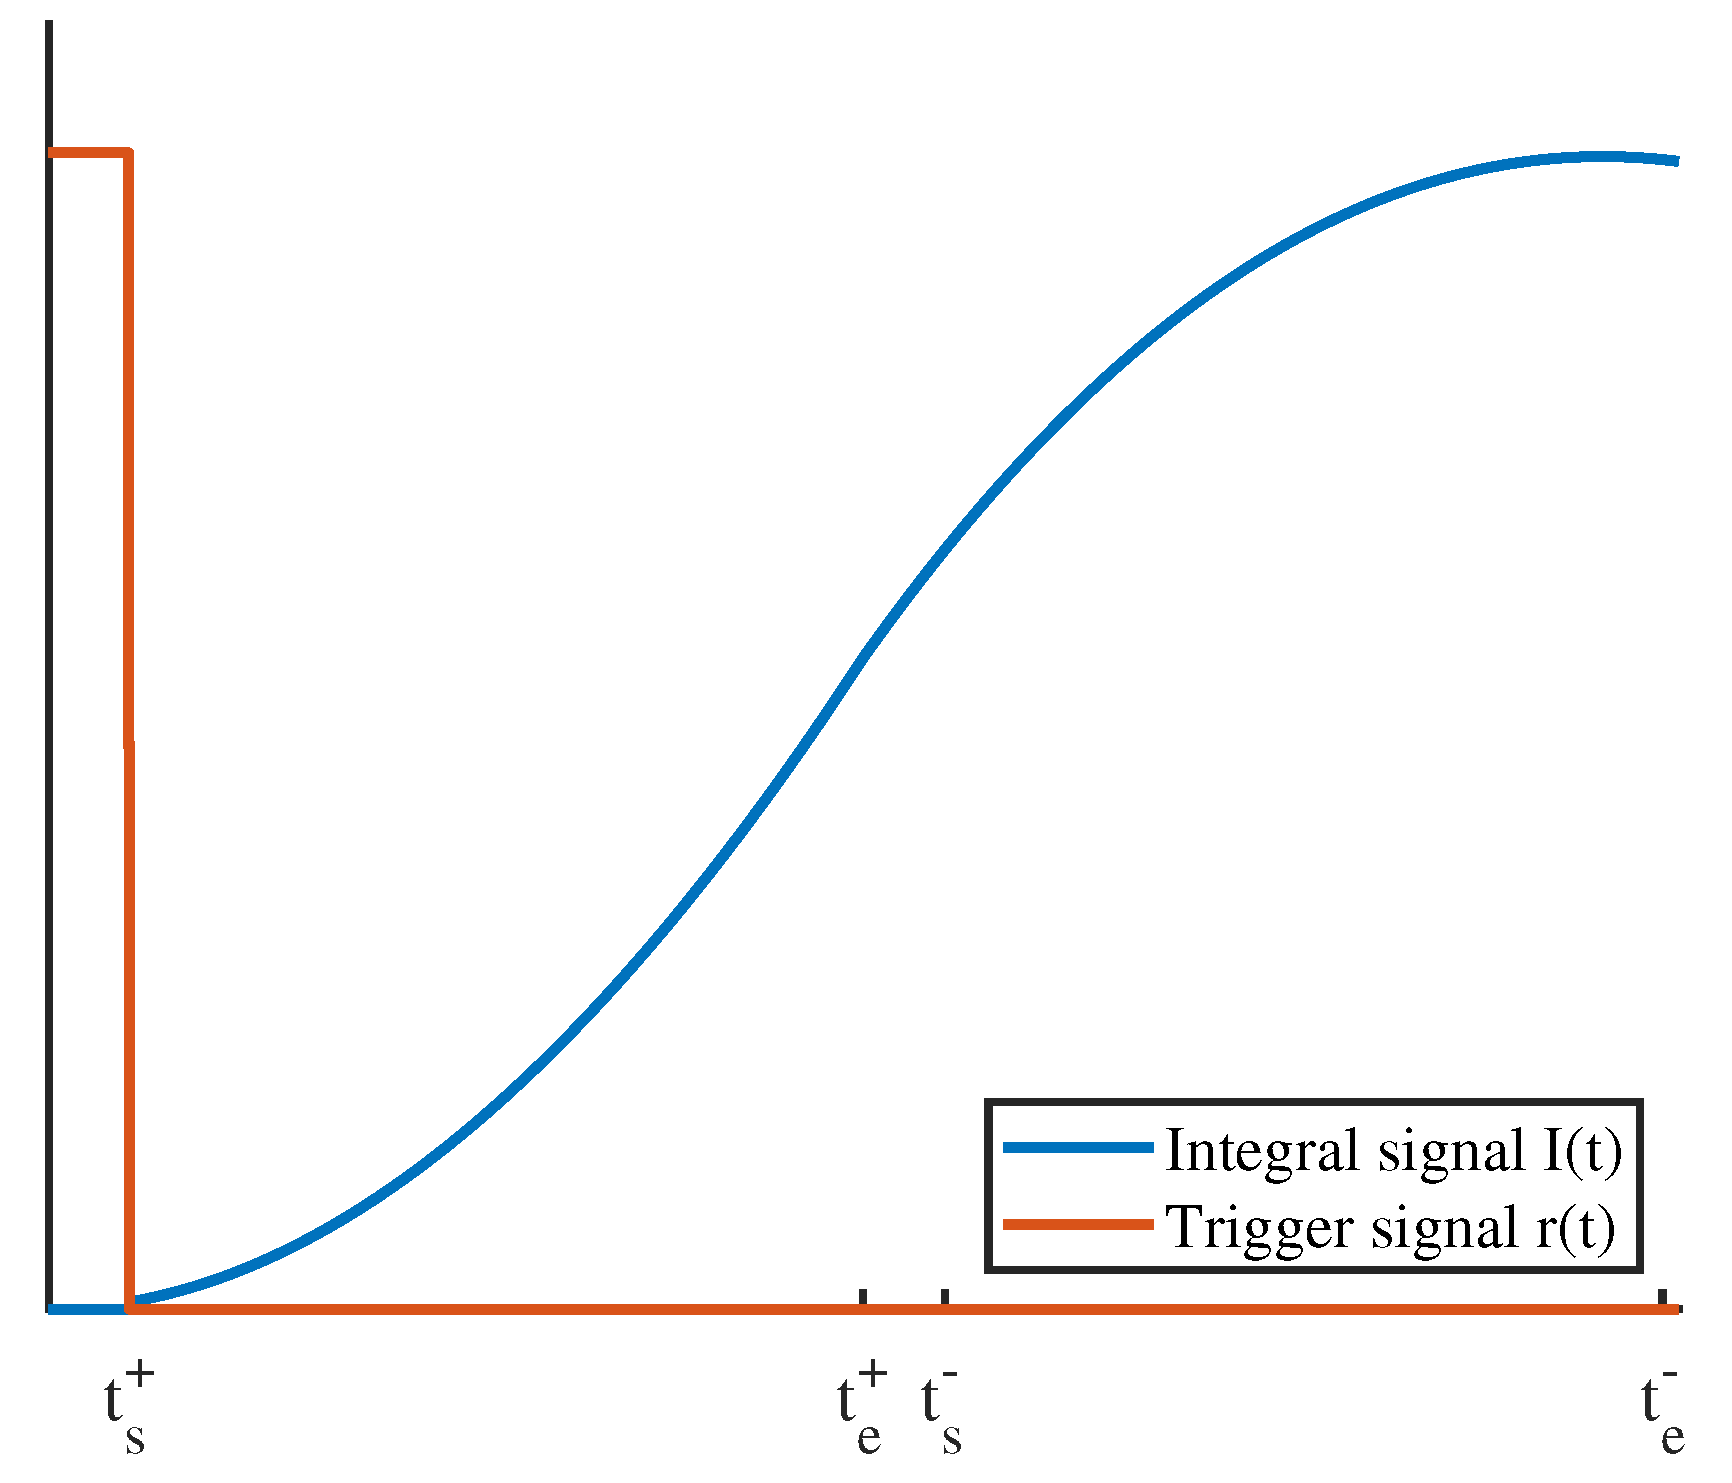
Under the given approximations, the reset can be simplified to a single reset pulse at the beginning of the PWM period:
and with a narrow timing
. In particular,
Figure 8 shows the trigger signal and the output of the integrator stage.
In the simplified approach, the effect of the resistance
is considered small compared to the inductive component [
25]. Under this consideration, the ratio between
and
can be considered small and therefore Equation (
9) can be linearized by applying the Taylor expression and truncating it at the first term:
By applying assumption (
27) on the current ripple Equation (
9) (For sake of brevity, only the rising part of the current ripple is shown, the falling part can be derived in a similar way.)
the current ripple is considered linear instead of being exponentially shaped. The offset removing stage removes the fundamental component from the sensed current:
In order to simplify the mathematical treatment and implementation effort, it is assumed that the current ripple has low contribution to the total current. This is usually desired in practical implementations in order to avoid significant perturbations of the produced force caused by current ripples. Therefore, it can be written that the current ripple has negligible influence on the mean value of the current:
. Furthermore, by limiting the current dynamic under the assumption of a linear relationship between mean current
and mean voltage
[
25]:
the expression of the current ripple shown in Equation (
28) can be simplified:
It is visible that the influence of the resistance
disappears. The maximum amplitude of the current ripple occurs at the time
and therefore the function value of Equation (
31) at this time instant can be expressed as:
The current ripple with its first order approximation shown in Equation (
27) resembles a triangle, whose integral value at the time
can be calculated as [
25]:
Finally, the inductance can be estimated by:
It is visible that this technique requires one DC link voltage measurement and one measurement of the integrator circuit per each PWM period. Moreover, the inductance can be estimated by solving one closed equation. Thus, it can be considered that this method requires less sampling and computational effort with respect to the oversampling approaches. Nevertheless, the assumptions made during the mathematical derivation do not allow high dynamic operation.
3.3. Oversampling Approach
As mentioned earlier, many works [
18,
19,
20,
21,
22] make use of an oversampled current and voltage measurement in order to estimate the inductance with a high noise robustness. Those methods take a number of N samples per each PWM period and obtain a data set of time, voltages, and currents:
Taking the measurements after a short time
after a switching instant ensures that transients coming from parasitic components and from the current sensor are not considered during the estimation process [
21,
22]. Based on the obtained data set, the techniques either calculate numerically the flux, from which the inductance can be obtained [
18,
19], or identify the actuator inductance by means of least-mean squares (LMS) approaches [
21,
22]. For sake of brevity, those techniques will not be explained here in detail. In the following sections, the approach from [
22] is used for inductance estimation. This work uses a LMS approach for the robust identification of the current ripple slopes, from which the inductance is estimated, with a number of 1600 samples per PWM period at a PWM frequency of 500 Hz. It therefore serves as a good representative method in this work. For further details, reference is made to [
22].
4. Experimental Results
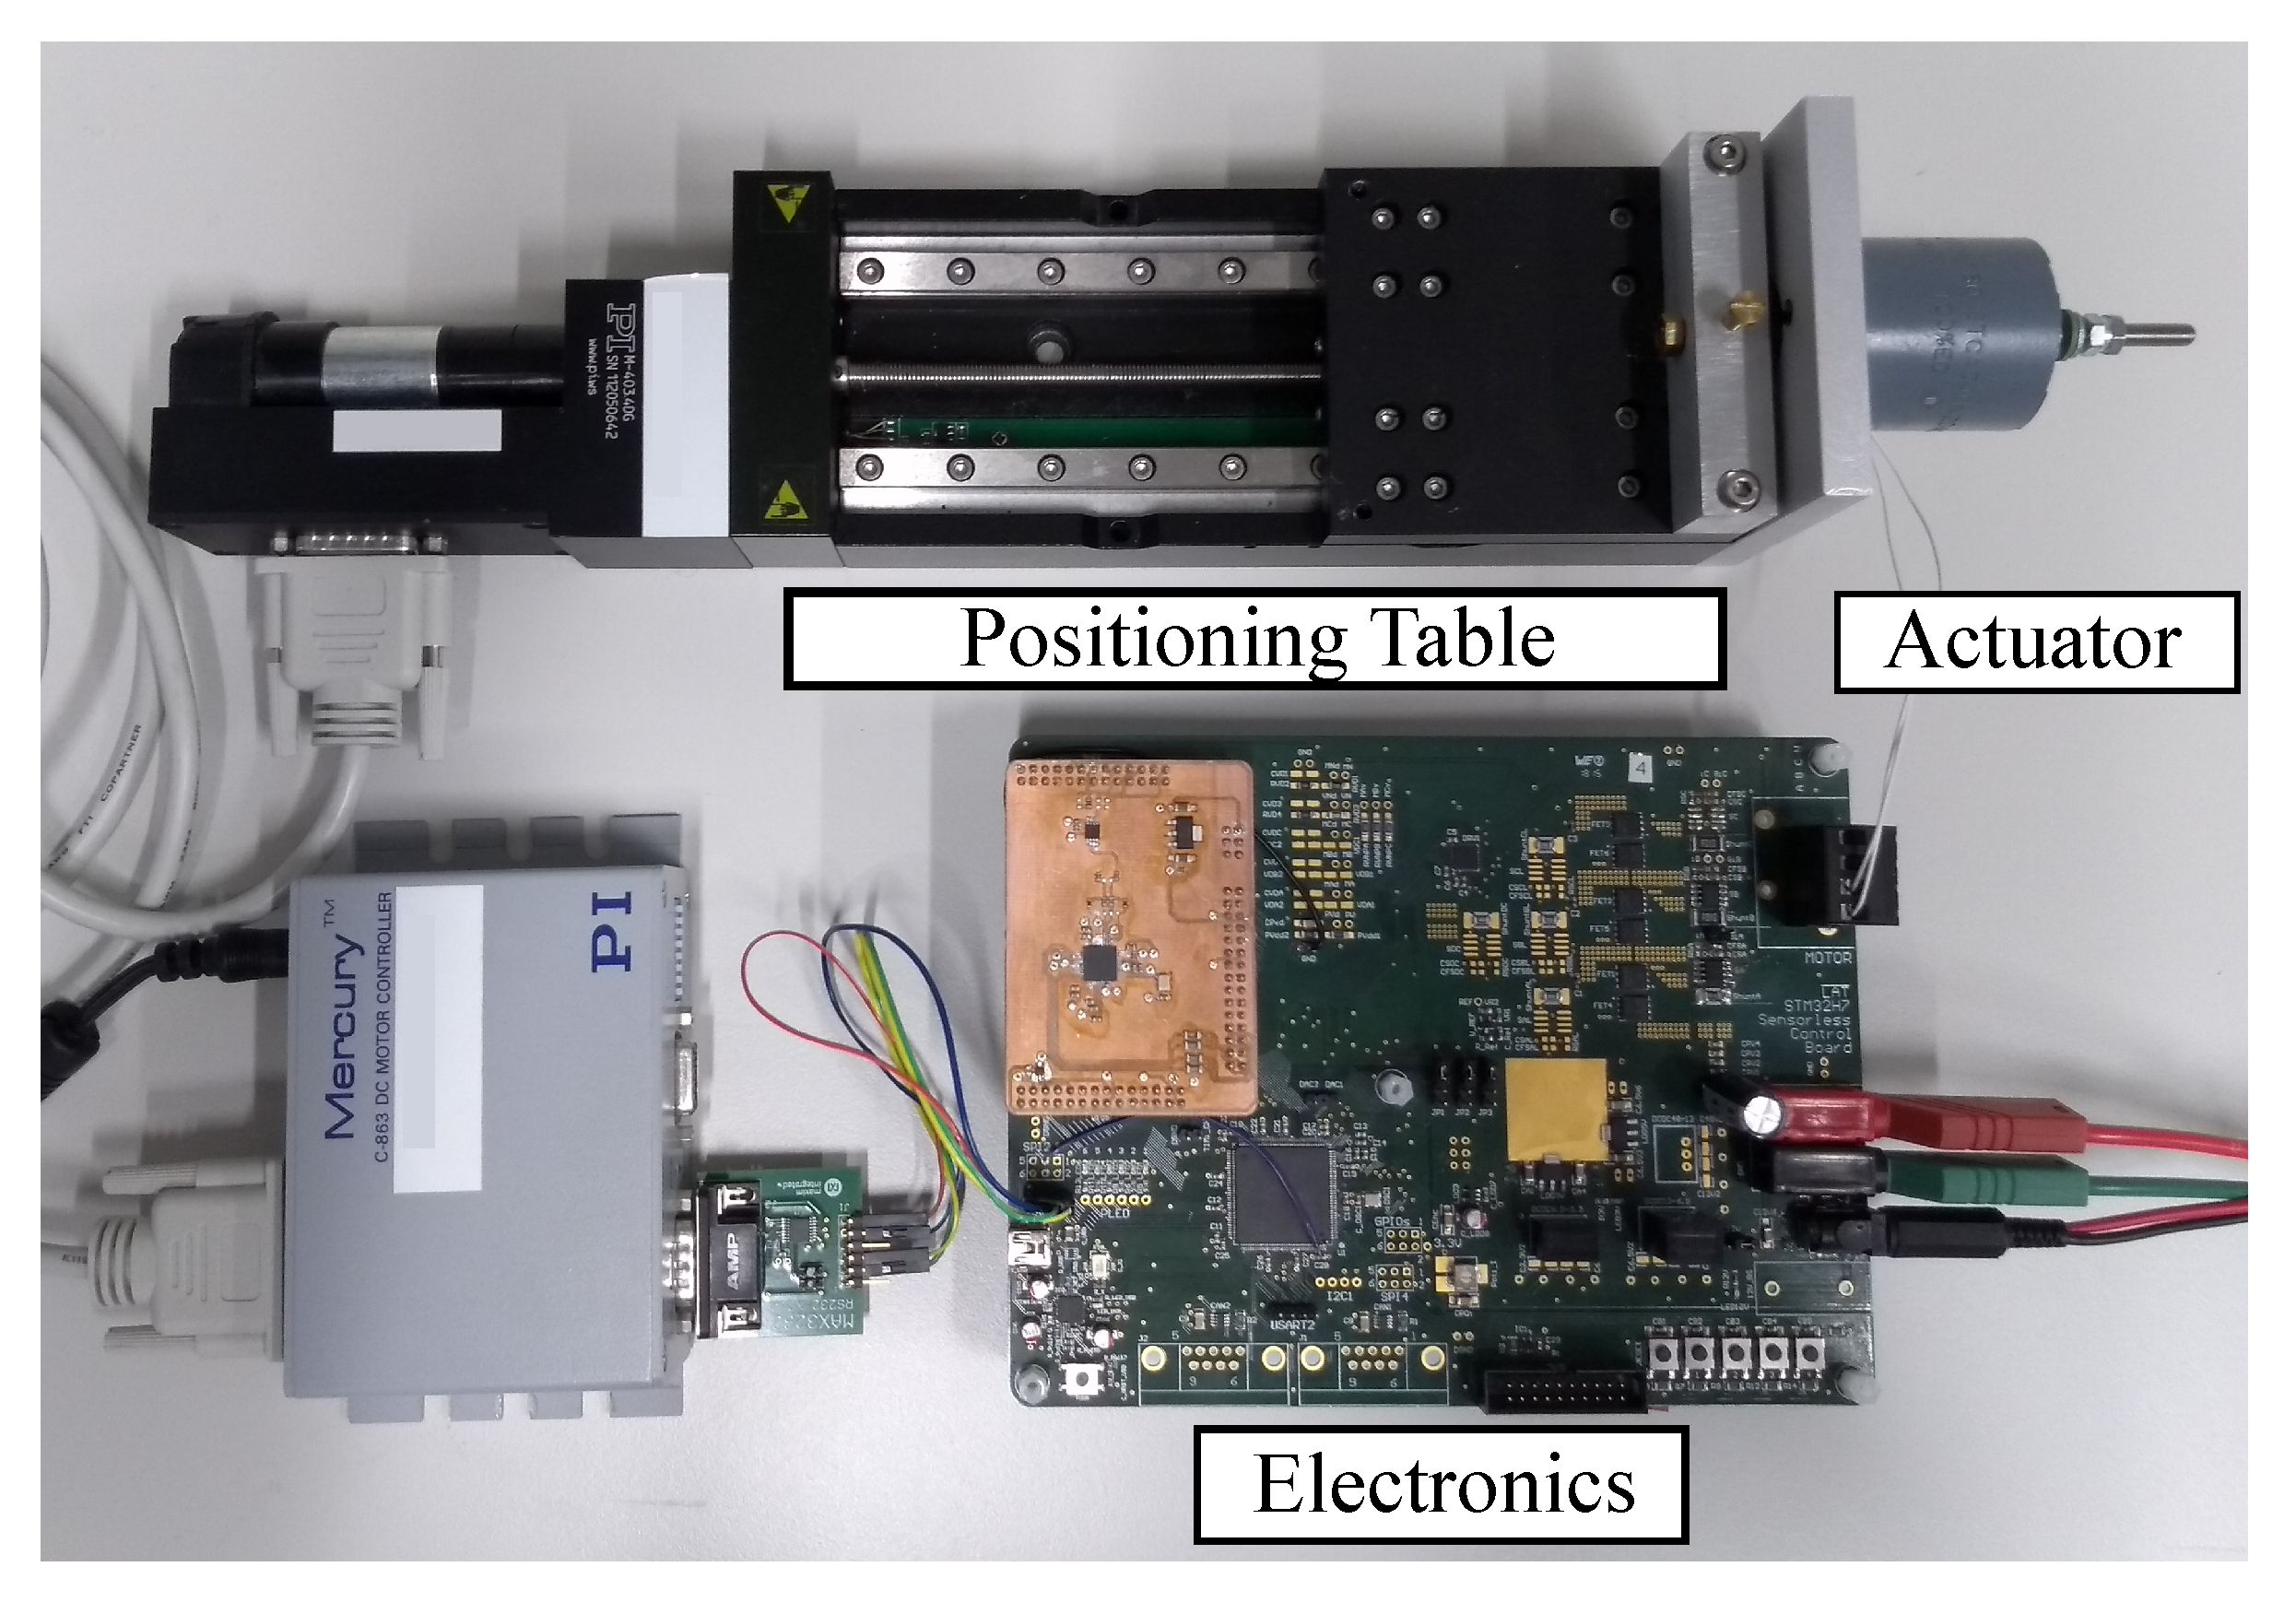
In order to evaluate the performance of the discussed approaches in terms of noise robustness and accuracy, an experimental test-bench consisting of a high precision linear positioning table, a dedicated electronics from the Laboratory of Actuation Technology and a mechanical coupling to the actuator is used, as shown in
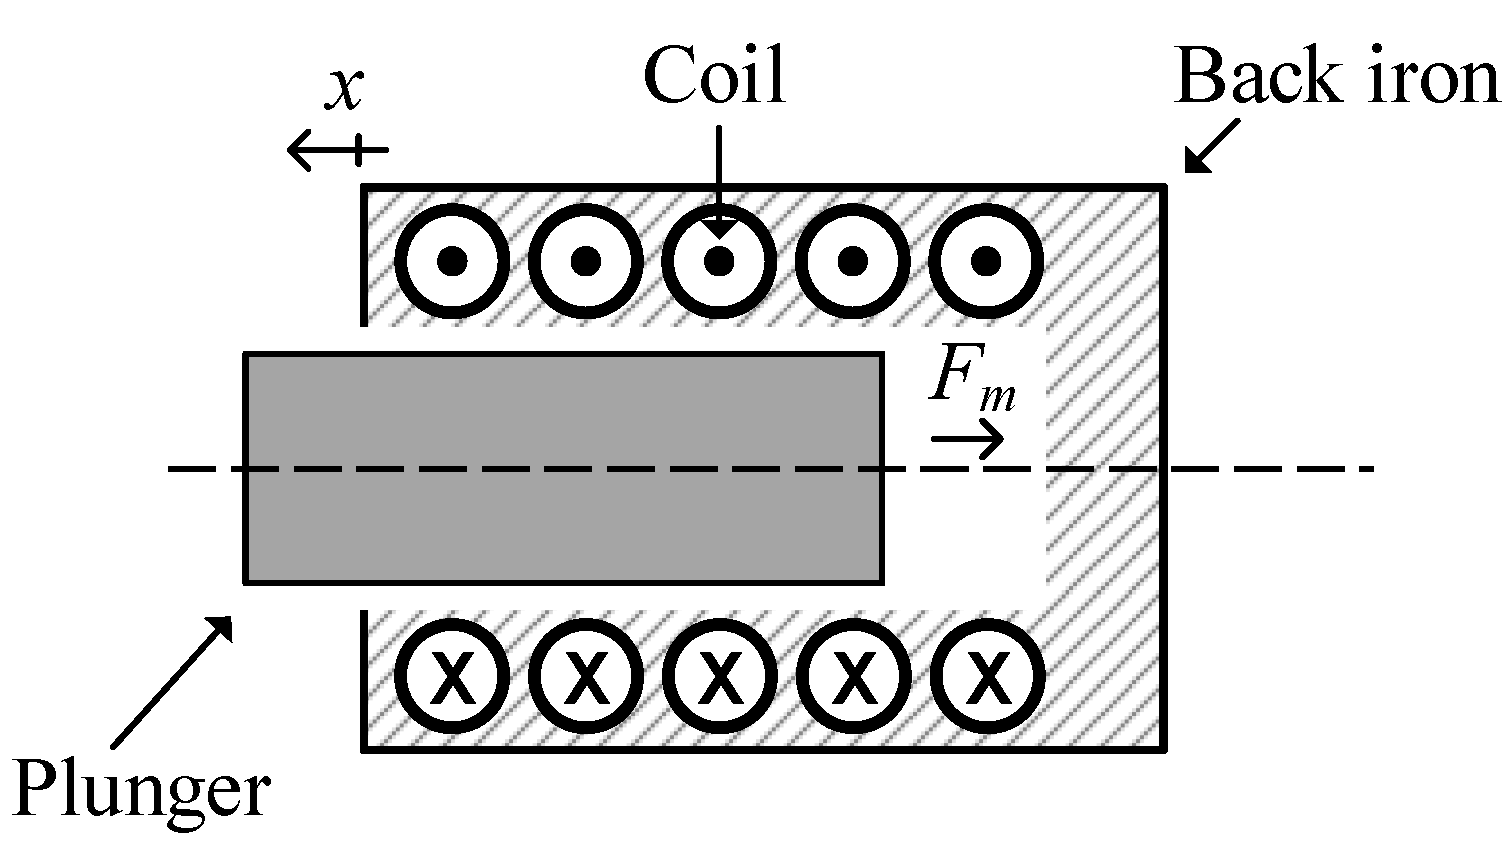
Figure 9. The working principle of the solenoid actuator is shown in
Figure 10.
In particular, the positioning table M403.4DG from Physics Instruments [
30] allows the positioning of the actuator and the measurement of the actuator position within a range of 10 cm with a minimum step size of 200 nm. The table is able to block the actuator at a certain position with forces up to 50 N. This table is connected to a dedicated electronics that consists of a switching power electronics, a STM32H7 microcontroller with 16 bit AD converters and a dedicated electronics for the IDIM technique. In particular, an AD8418 current sensor from Analog devices [
31] with 250 kHz bandwidth is used for current measurement. The discussed inductance estimation approaches are implemented in the microcontroller using floating-point arithmetic. Moreover, a current controller is tuned and implemented accordingly, guaranteeing a constant current even under variable DC link voltage and increasing resistance
due to self-heating or due to the presence of a back-EMF. The actuator under test is an industrial switching solenoid from the type GTC A 40 from Magnet-Schulz Memmingen [
32]. Its parameters and nominal values are listed along with the used settings of the IDIM technique in
Table 1.
Based on the mean electrical time constant of the actuator
ms, a PWM frequency of 500 Hz is chosen in order to produce a measurable current ripple and avoid saturation of the inductance over frequency.
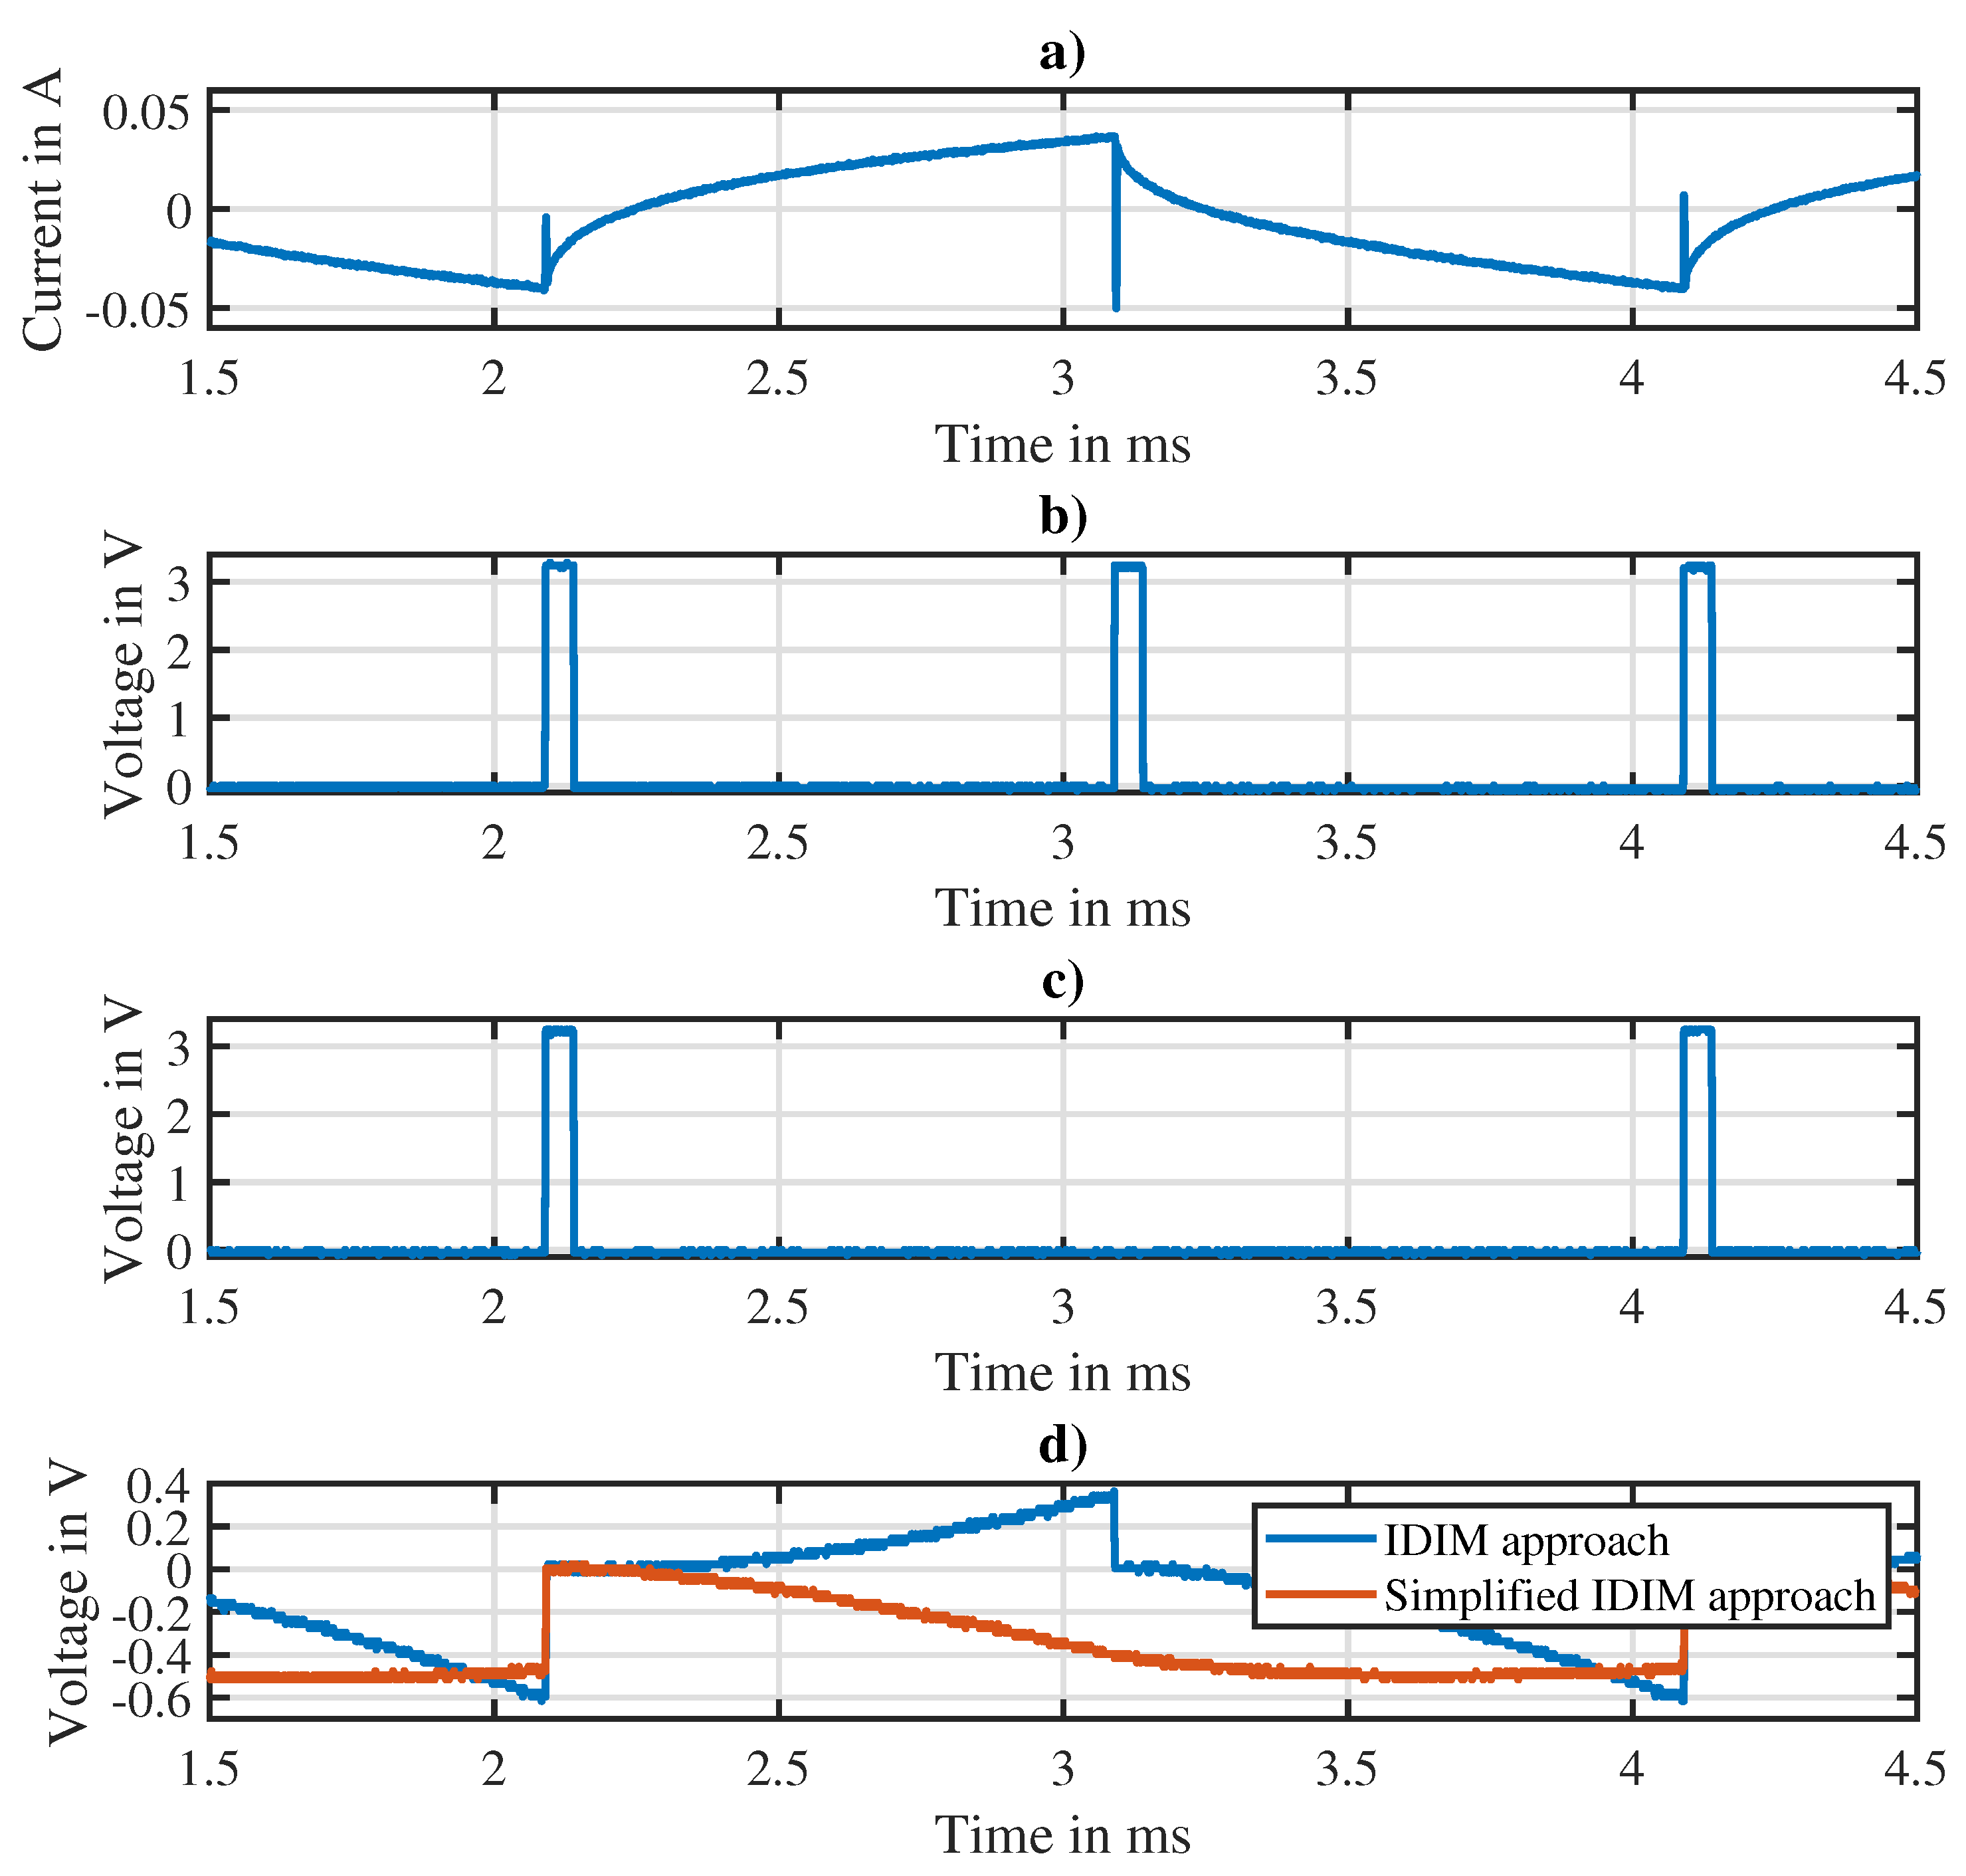
Figure 11 shows the experimental measurement of the analog signals in the IDIM circuitry. The applied PWM voltage causes a considerable current ripple, which has significant disturbances at the PWM switching instants due to the limited bandwidth of the current sensor and due to parasitic capacitances. Two different settings of the trigger signal
as well as the corresponding integrator outputs are shown: the trigger signal of the IDIM technique expressed by Equation (
13) and the trigger signal of the simplified IDIM technique shown in Equation (
26).
4.1. Noise Power of the Discussed Approaches
As mentioned before, most state-of-the art works increase the signal-to-noise ratio significantly by making an oversampled current measurement and by using least-mean squares algorithms with the demerit of increased computational effort and increased sampling effort. The IDIM technique aims to avoid an oversampled current measurement by reducing the noise level before sampling, thereby decreasing the sampling and computational effort. In the following, the inductance estimation performance of the IDIM approaches will be compared to an oversampling approach (OS) in terms of convergence and noise power. Note that no reference inductance value is available for comparison due to the lack of a general approach of exciting and estimating differential inductances at different working points. The noise power
is defined as follows:
where
L is the length of the signal vector and
is the noise of the actual signal value. The noise is obtained by subtracting the actual signal value from the mean value of the entire signal vector [
33].
Figure 12 shows the estimated inductance in case the actuator is at zero mean current and is fully opened (
x = 8 mm). The noise power of the IDIM technique, the simplified IDIM technique as well as the oversampling approach with different numbers of samples per PWM period are shown and compared. Oversampling approaches exceeding 1000 samples per PWM period are not considered here, since the microcontroller reaches it computational limits. Moreover, an experiment with the oversampling method with 50 samples per PWM period failed due to the divergence of the algorithm. It can be seen that the simplified IDIM technique achieves with −48.5 dB a slightly lower noise power than the oversampling approach with 100 samples per PWM period. The IDIM technique shows a lower noise power with −51.7 dB. Oversampling approaches with more samples per PWM period achieve considerably smaller noise powers. Nevertheless, the techniques are affected by biases, which change significantly depending on the number of used samples. This might be due to the fact that the oversampling approaches are not converging properly when a sufficient number of samples is not given. In particular, the simplified IDIM technique shows a remarkable bias in the inductance estimate. This is due to the assumption of a linearized current ripple made by Equation (
27).
The experiment is repeated in the case the actuator is driven with full mean current and is closed (
x = 0 mm), as shown in
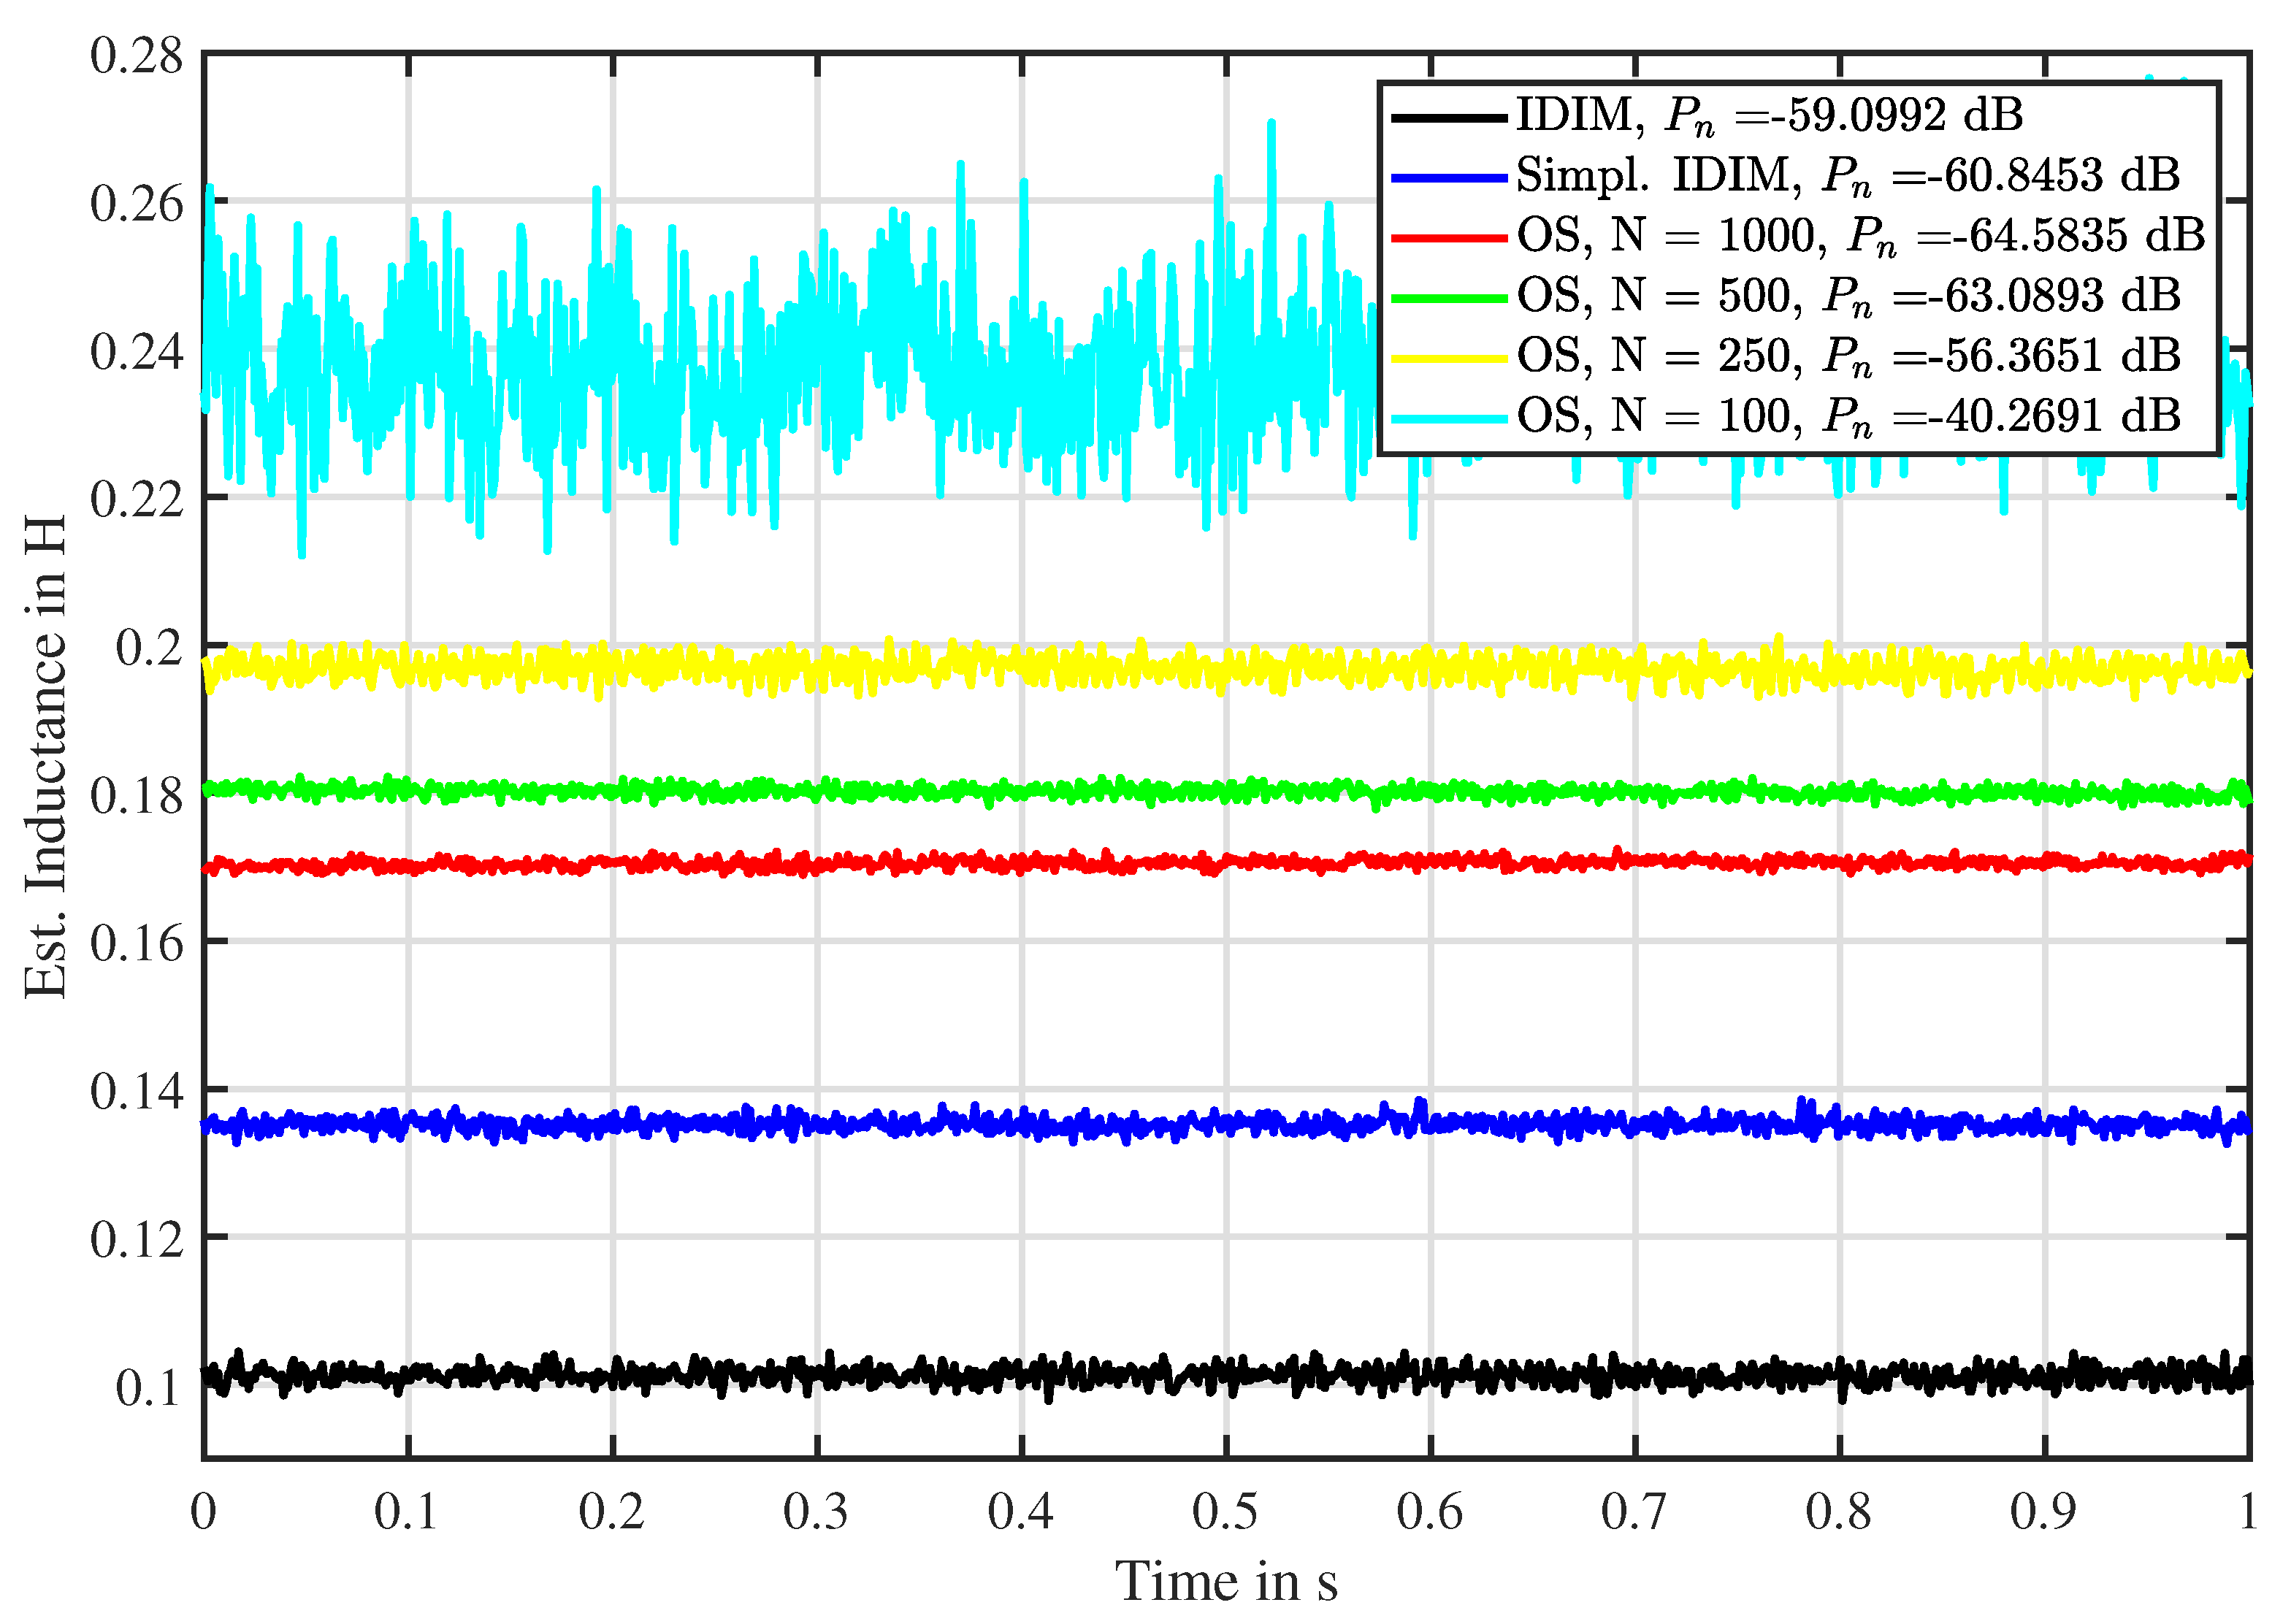
Figure 13. In this experiment, the IDIM technique shows a noise power in the range of −59.1 dB, outperforming the oversampling approach with 250 samples. The simplified IDIM technique performs slightly better with a noise power of −60.8 dB. Nevertheless, oversampling approaches with more than 250 samples exhibit a lower noise power. Similarly to the results of
Figure 12, all estimates differ in their bias. In the case of the oversampling techniques, the bias is strictly dependent on the number of samples, which indicates that those techniques need a sufficient number of samples in order to converge. In the case of the actuator under full mean current, this dependence gets more significant. This is due to the fact that the contribution of the current ripple to the total current inside the actuator decreases with increasing mean current. Thus, its processing is more likely to be influenced by biases during the estimation processes. The bias between the IDIM technique and its simplified implementation can be explained by the linear assumption made by Equation (
27).
It can be seen that the IDIM technique has less noise power compared to the oversampling approaches with a number of up to 100 samples in case of the actuator without current and up to 250 samples in case of the driven actuator. Given the sampling effort and computational effort, which is needed for obtaining a good noise power with the oversampling approaches, the IDIM technique shows a good trade-off between noise power and needed effort.
4.2. Inductance Characteristic of the Actuator under Testing
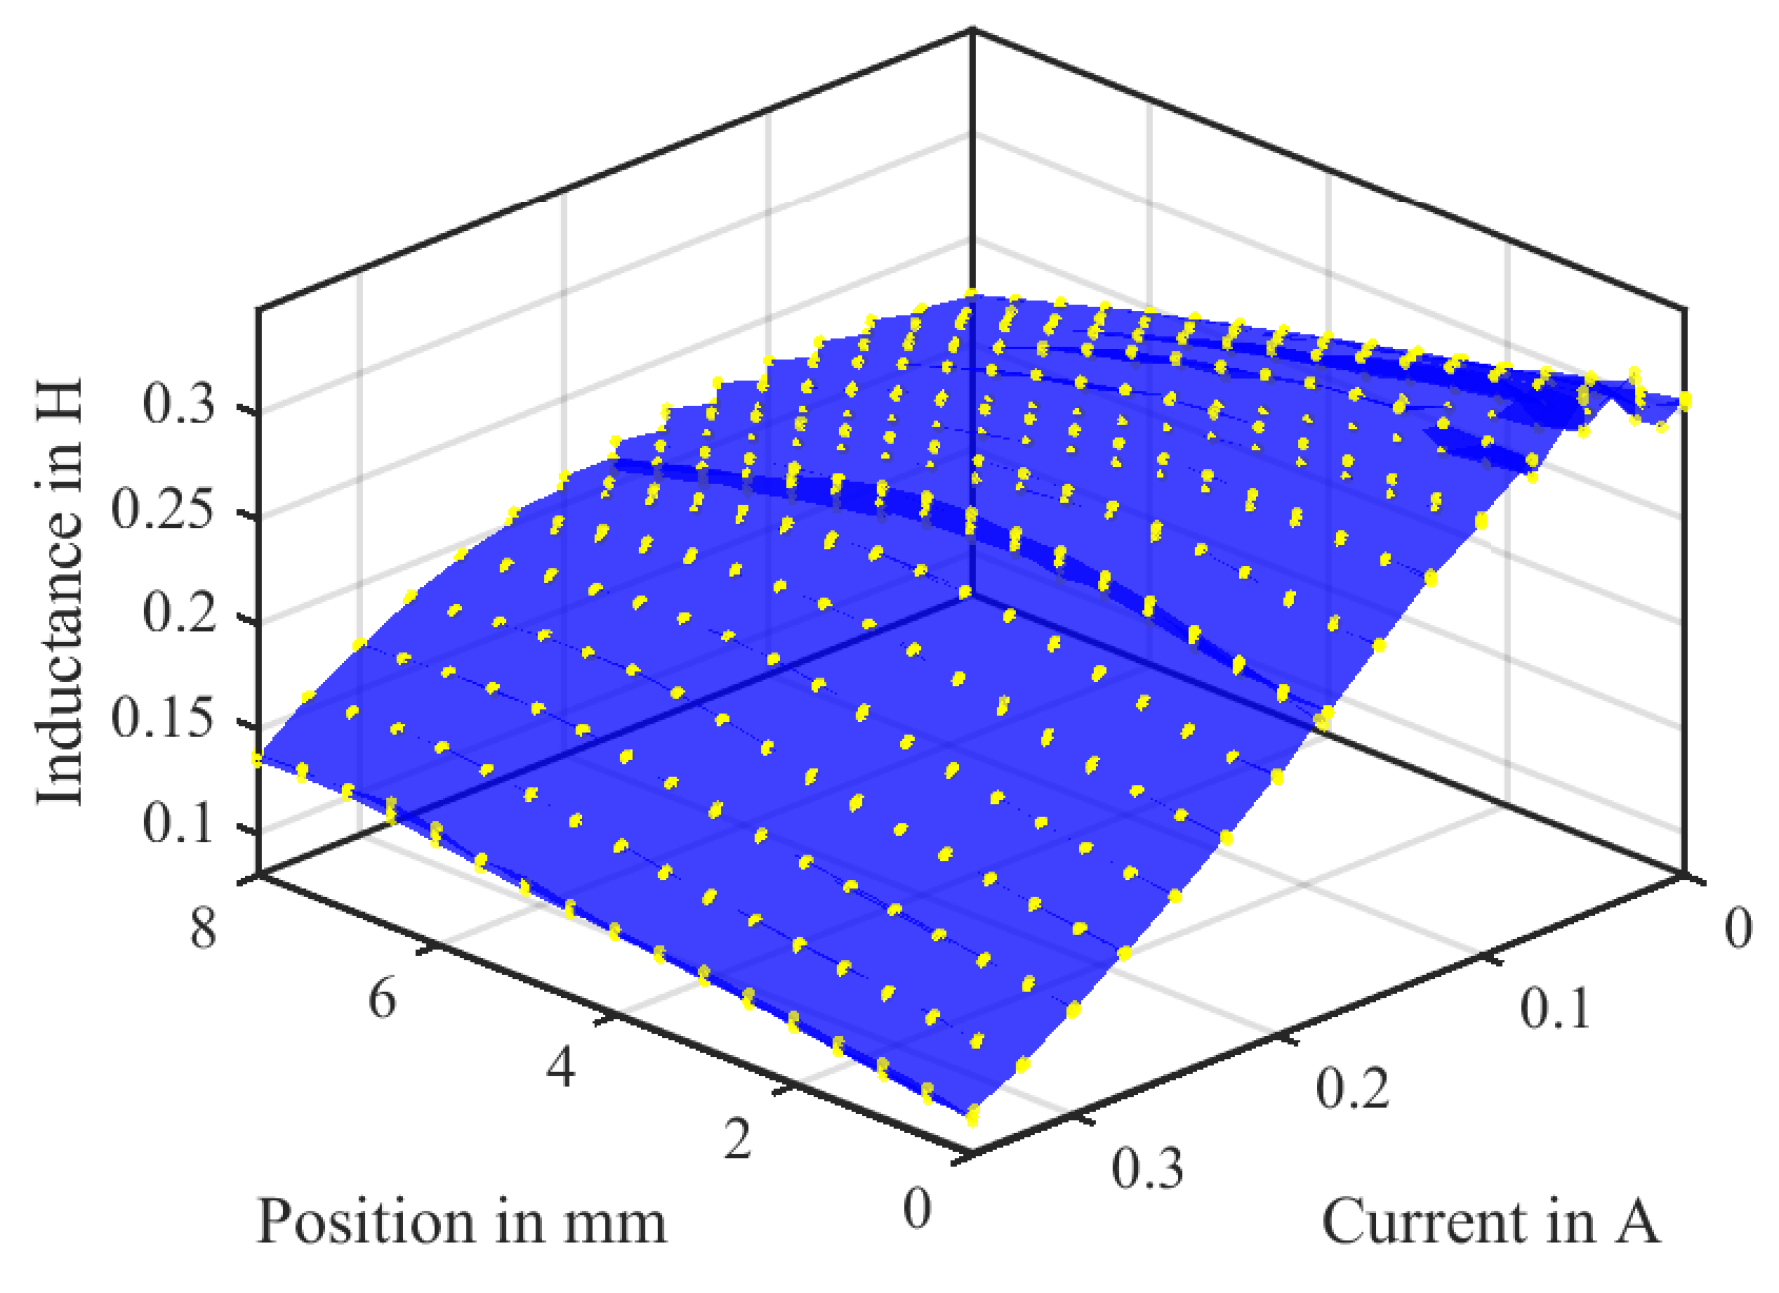
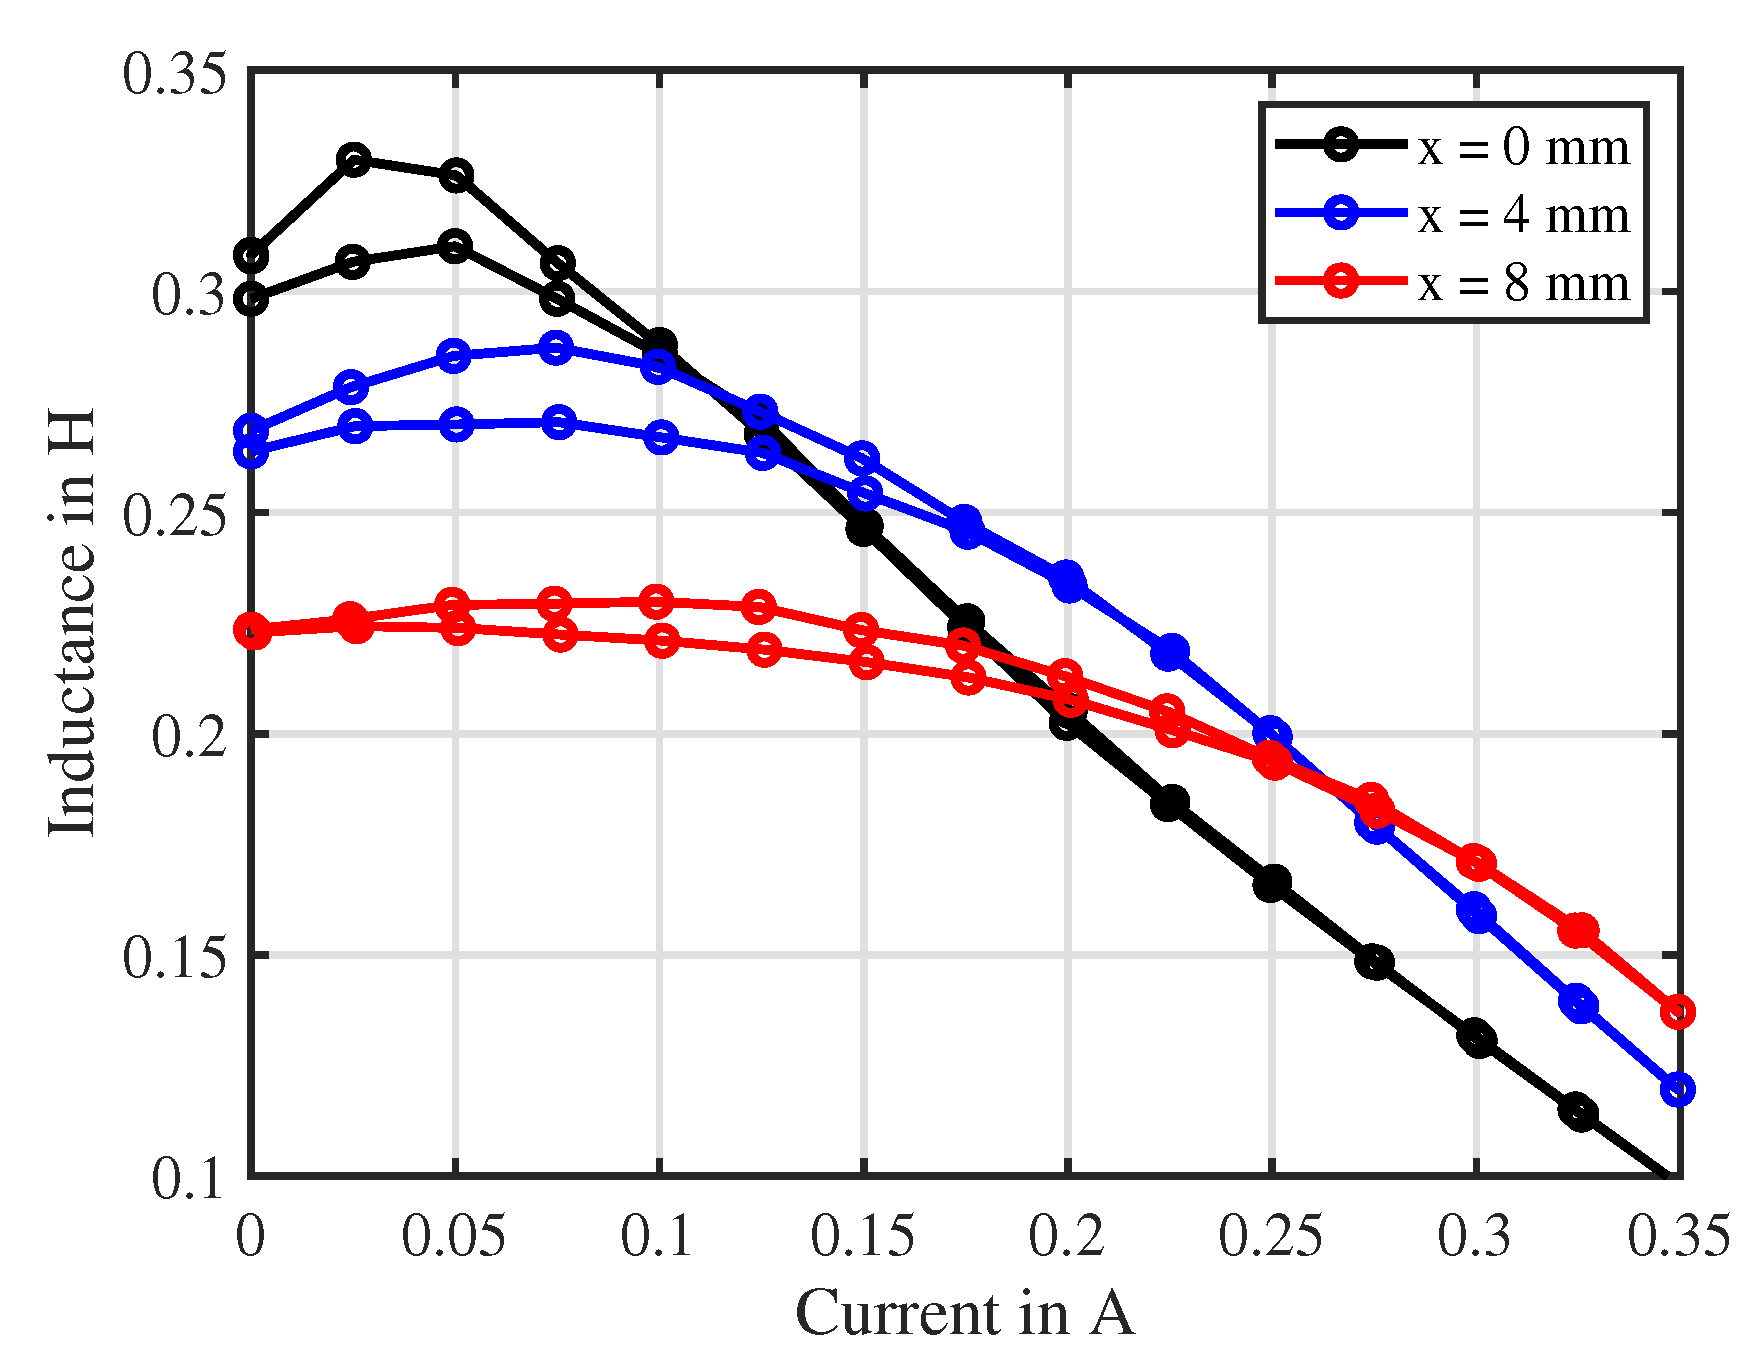
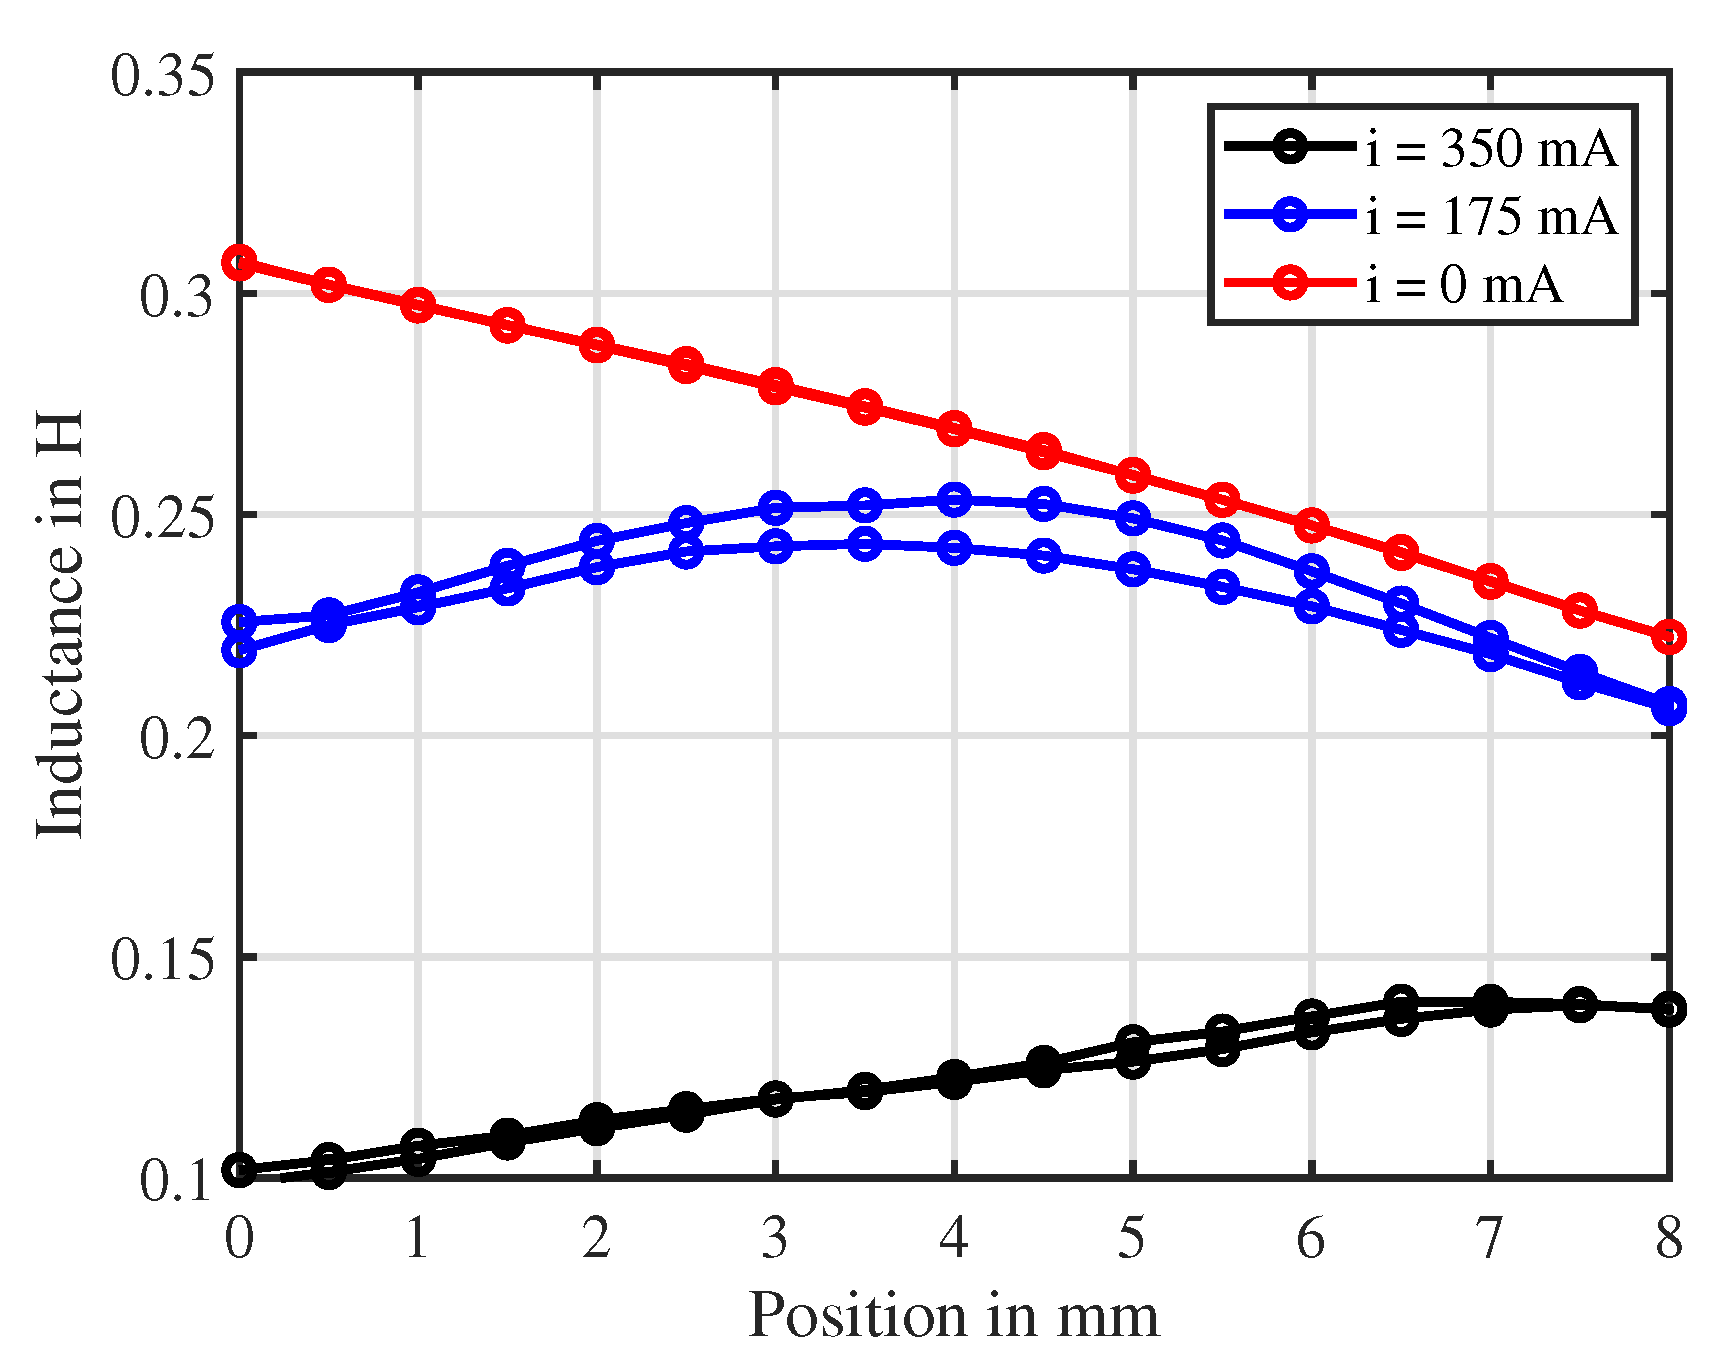
In the following, the inductance characteristic of the actuator under test will be identified using the IDIM technique. With the help of the above-mentioned test-bench, it is possible to obtain the differential inductance of the actuator in the entire position and current range. Those measurements are shown in
Figure 14 and for better visibility in
Figure 15 for fixed positions at varying currents and in
Figure 16 for fixed currents at varying positions. The measurements are obtained by averaging the inductance estimate over 200 values at each working point in order to increase visibility and comprehension of the measurements.
The identified inductance characteristic exhibits a remarkable hysteresis over position and current due to the presence of a hysteretic plunger and back-iron material [
34] (p. 32). At higher currents, the material shows no hysteresis anymore and goes into saturation [
34] (p. 21). This resembles the B–H-curve of the plunger material. Indeed, removing the plunger from the coil effectively increases the inductance at higher currents [
34] (p. 21).
For the purpose of sensorless end-position detection in a switching actuator, only the red curve, indicating the case of zero mean current, and the black curve, representing full mean current, are of particular interest in
Figure 16. The curve representing the zero mean current condition shows no hysteresis and can be considered anhysteretic. The curve describing the full mean current condition shows a slight hysteresis, which is going to be neglected for a simplified modeling. The obtained pre-filtered measurement curves are inverted for means of position estimation and the measurement points are fitted with polynomials of the 4th order.
4.3. Validation of the Use Case Scenario: Sensorless End-Position Detection for Switching Actuators
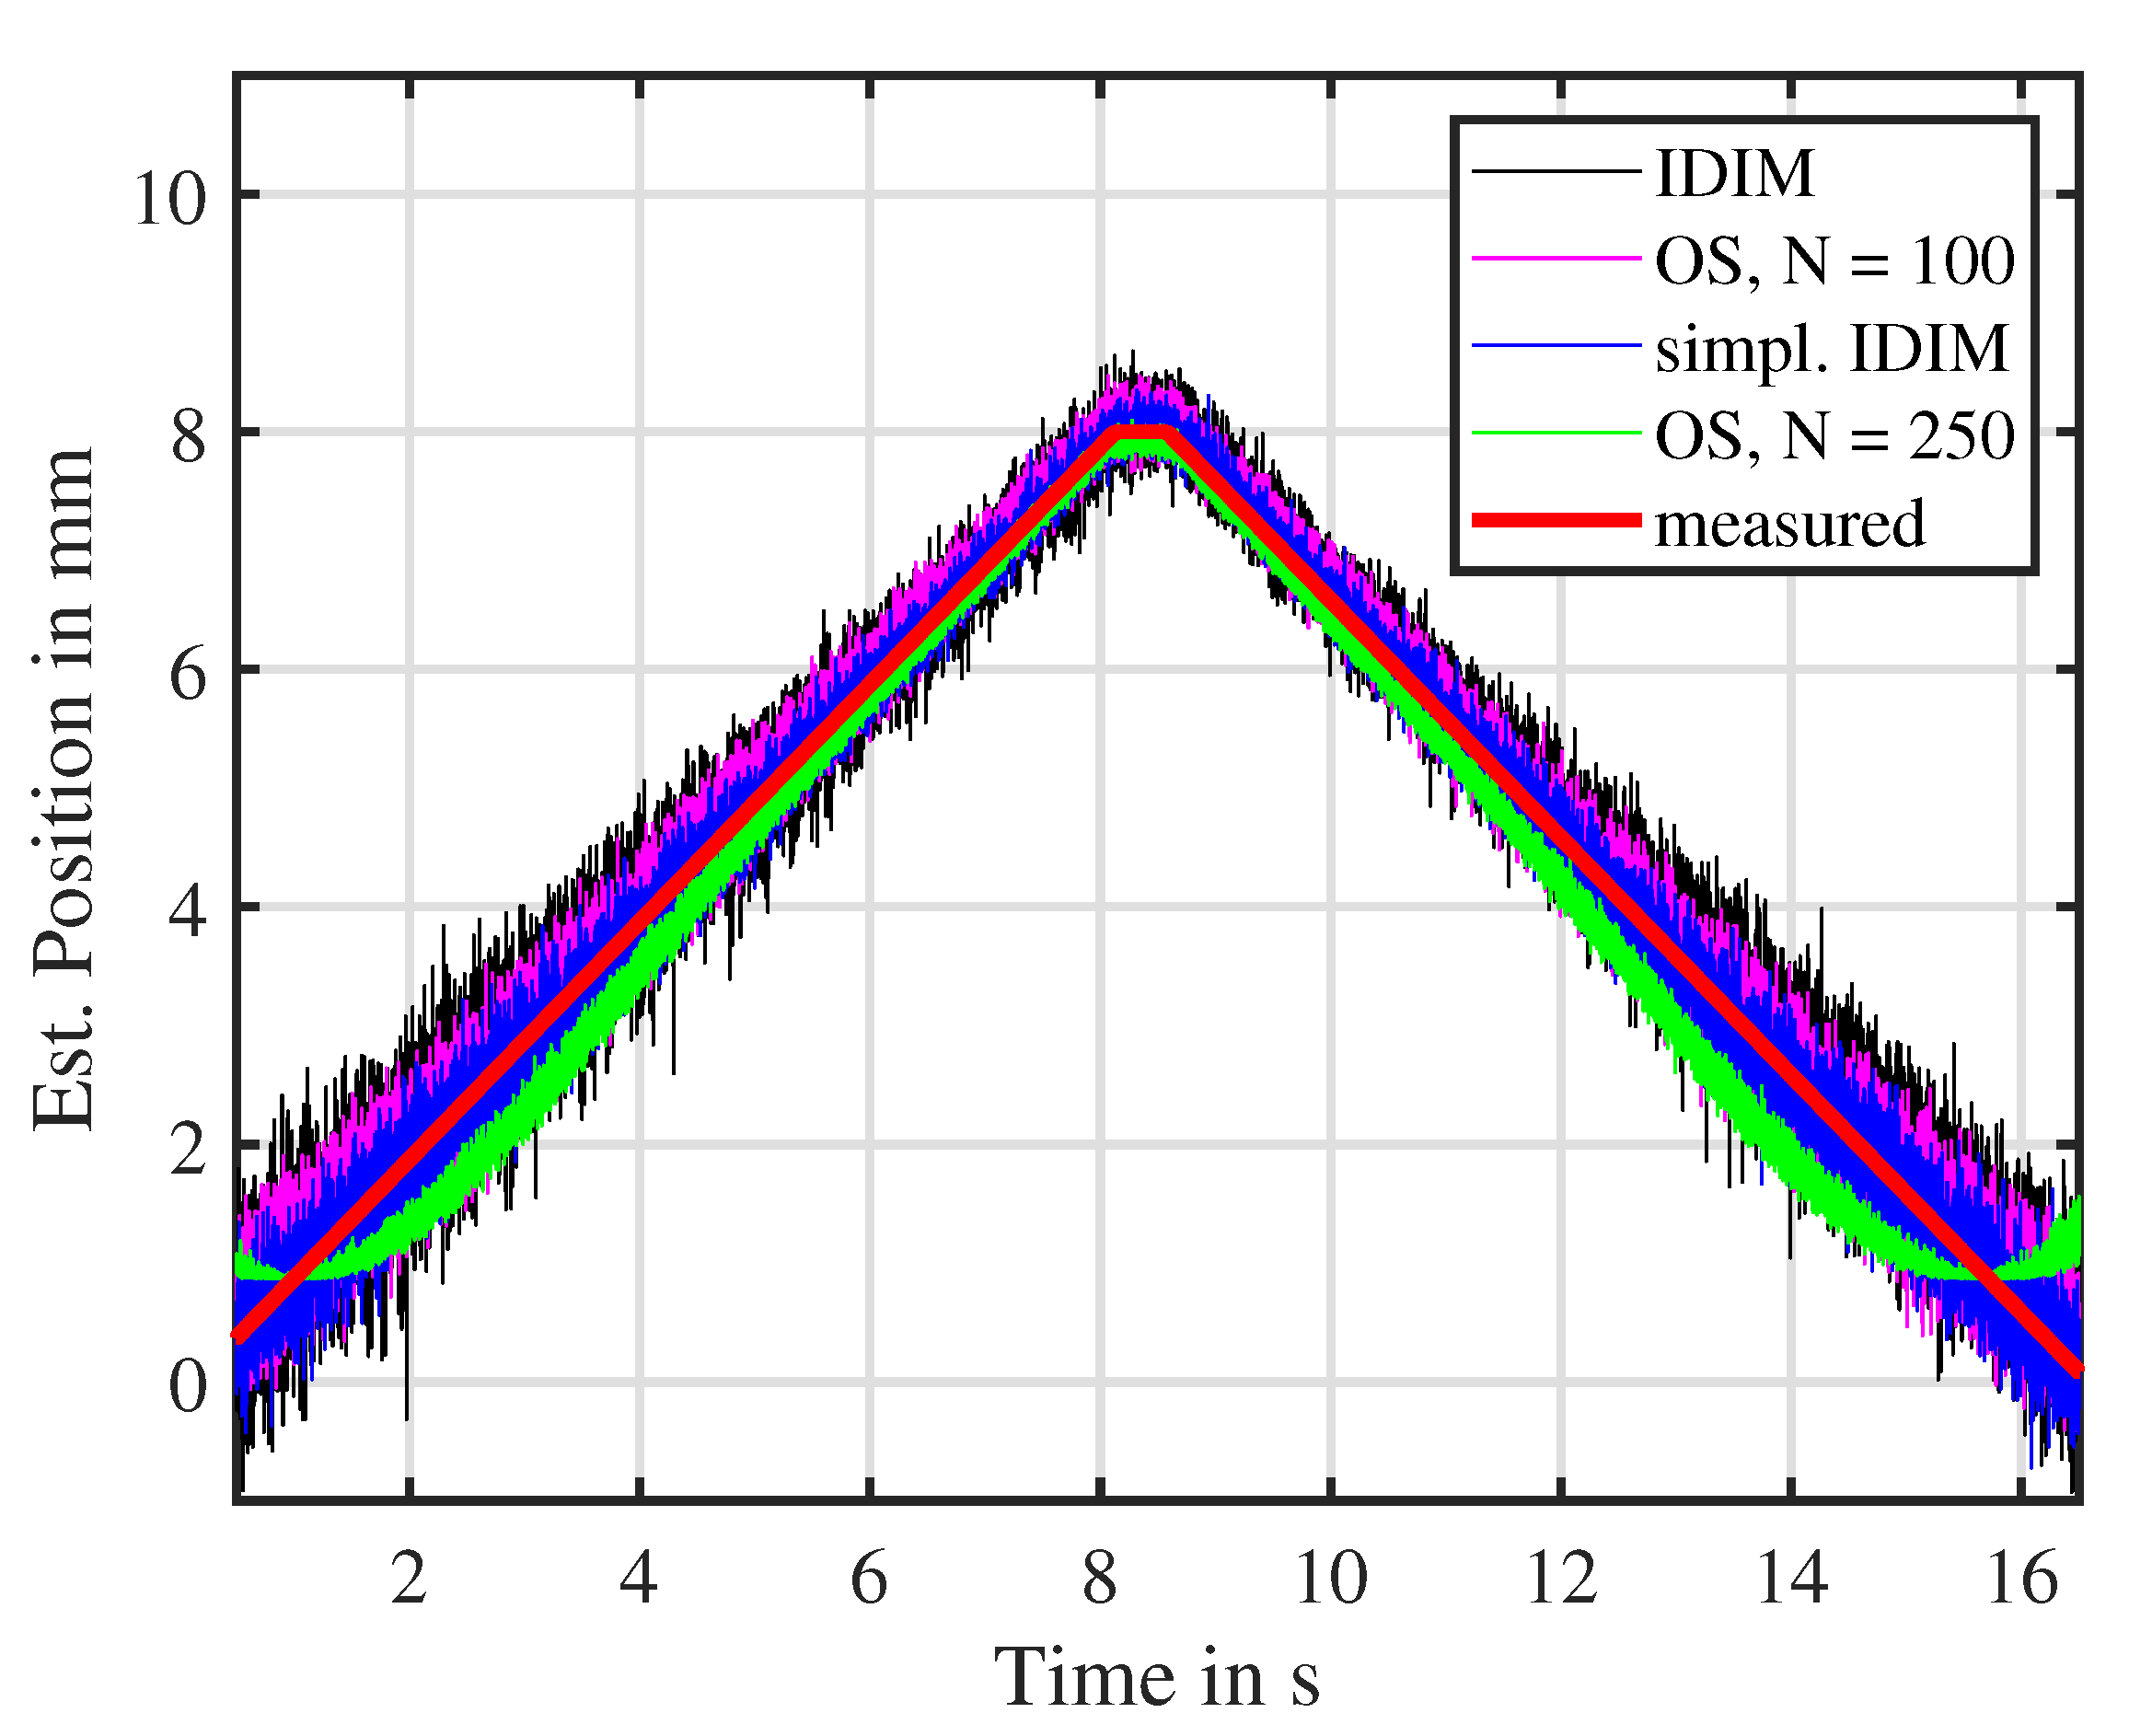
In the following, the discussed approaches are validated in the use case scenario of a sensorless end-position detection for switching actuators. The fitted polynomials mentioned in the section above are implemented for the purpose of position estimation. During the validation experiment, the positioning table is used to move the plunger in a quasi-static manner over the entire position range of the actuator. For the application of sensorless end-position detection in a switching application, two cases are shown: the actuator is without current (
i = 0 A), shown in
Figure 17, and the actuator is under full mean current (
i = 350 mA), illustrated in
Figure 18. In those figures, the position estimation obtained by the IDIM method, the simplified IDIM method, and the oversampling methods with 100 and 250 samples are compared to the position measurement of the high-precision position table. For the sake of brevity, only the oversampling approaches with 100 and 250 samples are shown since their noise power resembles the ones of the IDIM techniques. Note that, in this experiment, no low-pass filtering is applied to the measurements, allowing to compare the estimation performance directly.
From both experiments, it can be seen that the position estimated by the (simplified) IDIM method follows the measured position in a clear way. In the case of the actuator without mean current, shown in
Figure 17, the oversampling approaches show similar performance as the IDIM approaches. The oversampling approach with 250 sample tracks the measured position, but with estimation errors at positions smaller than 1.5 mm. In the case of the actuator under full mean current, shown in
Figure 18, the oversampling approach with 100 samples fails to converge to the measured position while the approach with 250 samples converges and tracks the position. All techniques present a considerable estimation error in the case that the actuator is driven with full mean current due to the negligence of the actuator hysteresis, as shown in
Figure 18.
Because of that hysteretic behavior, whose modeling is not within the scope of this work, only the results from
Figure 17 are discussed. The position estimates of the different techniques are affected by noise, whose amplitude changes according to the used estimation technique: the simplified implementation of the IDIM technique shows a lower noise amplitude than the IDIM technique and the oversampling approach with 100 samples. The oversampling approach with 250 samples shows the lowest noise amplitude due to a high number of used samples.
Table 2 quantifies and compares the mean and maximum errors of the techniques with the result that the simplified IDIM technique achieves the lowest mean and absolute error for the purpose of sensorless end-position detection. The good performance of the simplified IDIM technique in terms of measurement noise is due to the fact that its estimation Equation (
34) does not need to calculate current differences, unlike the estimation Equation (
25) of the IDIM technique. Calculating differences of noisy signals increases the noise level of the result.
5. Conclusions
In this work, a thorough mathematical analysis of current ripples inside electromagnetic actuators when driven with switching electronics is conducted taking into account the presence of eddy currents and parasitic capacitances. The results of this analytical as well as numerical analysis prove that the presence of these effects has a significant influence on the current ripple especially at the switching time instants of the PWM driving voltage.
The presented Integrator-Based Direct Inductance Measurement (IDIM) technique is improved with respect to its previous formulations by exploiting the preceding analysis on the current ripples and compared to oversampling approaches. The comparative study conducted on an industrial solenoid actuator has shown that the IDIM technique provides, under certain conditions, similar performance in terms of noise as oversampling techniques, while requiring a much lower number of measured samples. Thus, both measurement and computational efforts are reduced, making the IDIM technique more suitable for application to low-cost electromagnetic actuators, where high-speed AD converters and high performance computation units, such as FPGAs, would considerably increase costs.
Finally, a use case scenario involving sensorless end-position detection is considered. This is, indeed, a typical application for switching valves, relays, and solenoid actuators. The experimental validation of a position estimator based on the IDIM technique shows good noise robustness and position tracking performance. Nevertheless, the position estimator shows a remaining deviation of the estimated position when the actuator operates at high currents. This is due to the negligence of hysteresis in the mathematical model of the inductance characteristic. This limitation is common to all the techniques considered in this work and, therefore, the identification and compensation of the hysteretic behavior of such actuators represent an important aspect for future research activities.
