Abstract
A piezoelectric energy harvester was developed in this paper. It is actuated by the vibration leakage from the nodal position of a high-power ultrasonic cutting transducer. The harvester was excited at a low displacement amplitude (0.73 µmpp). However, its operation frequency is quite high and reaches the ultrasonic range (24.4 kHz). Compared with another low frequency harvester (66 Hz), both theoretical and experimental results proved that the advantages of this high frequency harvester include (i) high current generation capability (up to 20 mApp compared to 1.3 mApp of the 66 Hz transducer) and (ii) low impedance matching resistance (500 Ω in contrast to 50 kΩ of the 66 Hz transducer). This energy harvester can be applied either in sensing, or vibration controlling, or simply energy harvesting in a high-power ultrasonic system.
1. Introduction
Piezoelectric energy harvesting has drawn great attention in recent years due to its huge potentials in applications for wireless and self-powered devices [,,,,,,,,]. However, because the energy generated by those devices is usually small in quantity, only a limited number of devices are commercially available []. Various attempts have been made to promote the performances of the energy harvesters in various aspects, such as function materials development, structural design, resonant condition optimization, and rectifier circuits adoption [,,,,,,,,].
The vibration energy source is also among the most important factors that influence and even determine the overall performance of an energy harvester. The common energy sources include human/biological systems, civil structures, wind/oceans, automobile/machinery, and acoustic wave, etc. [,,,,,,]. In general, according to the operation frequency, they can be classified into impact energy (such as falling objects []), quasistatic energy (in the order of Hz, such as foot step []), low frequency energy (in the order of 10 Hz to kHz, such as automobile and machinery []), high frequency energy (in the ultrasonic range, such as ultrasound wave [,]), and continuous energy (such as wind []). However, in reality, high frequency mechanical vibration energy sources have been rarely found in the ambient environment. As a result, most of the studies are focused on the quasistatic and low frequency energy sources. However, harvesting energy from the low frequency sources has several problems, such as low current output, high impedance matching resistance, and low reliability (high amplitude and stress conditions are necessary to produce more power) [].
In this paper, we propose a new piezoelectric energy harvester with a high frequency ultrasonic vibration source, which is a specially designed coupler used to connect a high-power ultrasonic transducer (sonicator) to its external fixture. The energy leakage at the nodal position of the ultrasonic transducer was used as the energy source. Therefore, a harvester working at an ultrasonic frequency can be obtained. As will be seen later, such a high frequency energy source has advantages of (i) high current generation capability and (ii) low impedance matching resistance. The developed energy harvester can be used as a sensing or vibration controlling component in high-power ultrasonic transducer systems for applications such as liquid processing, ultrasonic welding, ultrasonic surgery, and ultrasonic cutting.
2. Structure of the Energy Harvester
The structure of the piezoelectric energy harvester is shown in Figure 1a. Basically, it has an inner ring, while around the outer rim of the inner ring, three unimorph cantilevers are asymmetrically surrounded. The unimorph was fabricated by bonding the PZT materials on the substrate part of the harvester. The PZT material is PZT-5A from Wuxi Huifeng Piezoelectric Co., Ltd. (Wuxi, China) (d31 = −160 pC/N, k31 = 0.35, εT33 = 1750). The inner ring is machined with the screws, used to couple the high-power ultrasonic transducer to the energy harvester as shown in Figure 1b. At the free end of the cantilever, there are three holes, which are used to fix the energy harvester to the external fixture.
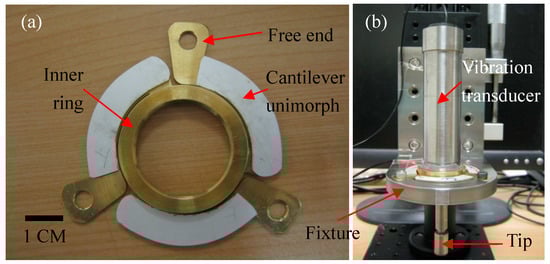
Figure 1.
Energy harvester and the harvester-transducer-fixture assembly, (a) Energy harvester; (b) Vibration transducer assembly.
In this configuration, the high-power transducer is the vibration energy source. It works at 24.4 kHz and can be used for ceramic cutting. The energy harvester is connected to the transducer at the location that is the so-called nodal position. Theoretically, the vibration amplitude at this position is zero. However, in practice, there is always vibration leakage at the nodal position due to various reasons, such as imperfect design, frequency change, non-ideal dimensions, and mounting problems. It is this vibration leakage at the nodal position that can be used as vibration energy sources. It is also found that although the nodal position has been used for an energy harvester, the performance of the cutting transducer is almost not affected. This is proved as shown in Figure 2, which is the conductance G and susceptance B frequency spectrum of the cutting transducer. The spectrum is clean, sharp, and with no random noises. Therefore, it implies that the harvester only scavenges the energy leakage, not affecting or deteriorating the performance of the cutting transducer.
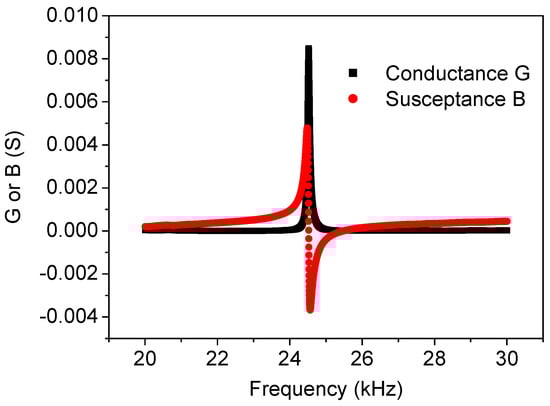
Figure 2.
G-B spectrum of the cutting transducer.
3. Theory
Before experimental studies, the advantages of using high frequency energy sources were analyzed theoretically, using the model as shown in Figure 3 [,,]. In this model, the piezoelectric energy harvester is represented by using a constant charge Q source (non-constant current I). The relation between the charge Q and current I is shown in the figure. Practically, this model represents a piezoelectric energy harvester vibrating at a frequency-independent constant displacement amplitude. From this model, the following relations can be found:
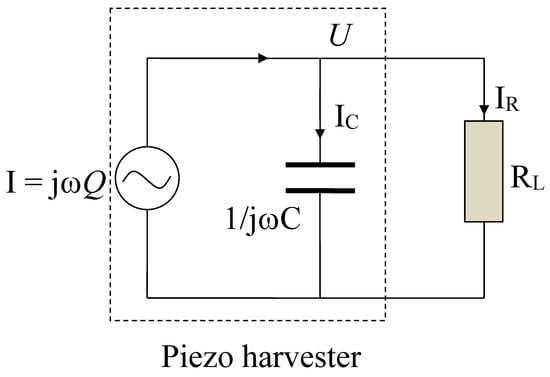
Figure 3.
Equivalent circuit of an energy harvester.
The solutions of the above equations are
In the above expression, PR is the electrical power delivered to the load resistor. It can be seen that PR is a function of the load resistance. Its maxima can hence be found by using the following calculation:
The result is, when
the power reaches its peak value, which is
Equation (4) describes the impedance matching condition; i.e., when the load resistance is equal to the internal impedance of the harvester, a maximum power will be transferred to the external load []. It can be seen that both capacitance C and frequency ω have effects on the impedance matching condition. It is obvious that if the frequency is increased, the impedance matching resistance will be reduced. Generally, as shown in many studies, a piezoelectric energy harvester has a better performance with a high impedance load [,]. From this equation, it can be found that, as long as the operation frequency is sufficiently high, the piezoelectric energy harvester can be used with a low impedance load. Increasing the capacitance C, the impedance matching resistance can also be reduced (Equation (4)). However, the power generation will be affected as seen in Equation (5). Therefore, in our present study, we focus on a high ultrasonic frequency energy source. At the impedance matching condition, according to Equation (2), it can also be found that
In this relation, the subscript “match” means the impedance matching condition and “max” means the maximum value of the respective parameters (Figure 4). It can be seen that the impedance matching condition is not equal to the maximum output voltage or current condition.
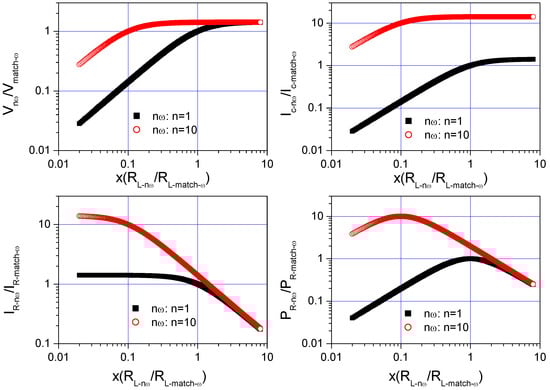
Figure 4.
Numerical solutions of the model.
To illustrate the variation of the above examined parameters, Figure 4 is plotted, where the relations between the harvester output parameters (V, IC, IR, PR), operation frequencies (ω), and load resistances (RL) are depicted. To be more general and remove the unknown parameters Q and C, the parameters are normalized with reference to the impedance matching values at frequency ω, respectively. Therefore, based on the earlier derived Equations (2) and (4), the following results can be obtained.
where the subscript ω means the frequency of the harvester, n is a positive number, and “match” means the impedance matching condition. Using Equation (7), Figure 4 can be obtained, where the x-coordinate is the normalized load resistance (x) and y-coordinate is the normalized V, IC, IR, PR. Two frequencies ω and nω (n = 10) are compared. At frequency ω, when x = 1, the impedance matching condition is achieved. In contrast, when frequency is 10ω, the impedance matching condition is fulfilled at x = 0.1. In other words, the 10ω curve reaches the impedance matching condition much earlier or at lower resistance. Hence, it can be concluded that the high frequency energy harvester is more suitable for the lower impedance load condition than its lower frequency counterpart.
It can also be seen that the low frequency curve (ω) and high frequency curve (10ω) are following the same trend. However, the high frequency curves shift leftwards and upwards. Therefore, generally, especially before the impedance matching condition, the high frequency curve also provides larger values of voltage V, current IC, IR and power PR. This implies that the high frequency harvester is more likely to provide an overall better performance than the lower frequency one.
It also should be noted that, in the above analysis, the constant charge model was used. However, at the very high frequency range, this may not be applicable, since the displacement cannot be maintained at a constant value over all the frequency ranges []. Therefore, real situations will deviate from the above model to a certain degree. Another point is that the resonance of the harvester was not considered in the model, which might also induce errors.
4. Experimental Section
To measure the properties of the piezoelectric energy harvester, a setup was built as shown in Figure 5. In this setup, the piezoelectric cutting transducer was powered by using a function generator (FG300, Yokogawa Electric Corporation, Tokyo, Japan) and a power amplifier (PZD2000, Trek Inc., NY, USA). An oscilloscope (DL1620, Yokogawa Electric Corporation, Tokyo, Japan) was used to monitor the voltage applied to the cutting transducer. Displacement of the energy harvester was measured by using a fotonic displacement sensor (MTI-2100, MTI Instruments Inc., Albany, NY, USA). The obtained signal was displayed on the oscilloscope. The power output capability of the energy harvester was measured by using a series of resistors from 10 Ω to 100 kΩ. The three phases of the energy harvester were connected together, giving a total capacitance of about 10 nF. Its output was connected to the resistor. The voltage across the resistor was measured by using the oscilloscope.
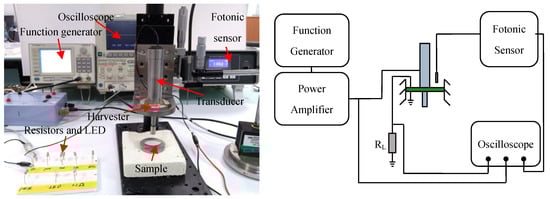
Figure 5.
Piezoelectric energy harvester characterization setup.
5. Results and Discussion
5.1. Displacement and Open Circuit Voltage
To check whether there is energy that has been harvested by using the developed harvester, the displacement and open circuit voltage of the harvester were first measured. The location for the displacement measurement was at the middle of one cantilever unimorph. The cutting transducer was under free vibration conditions. The signals of the displacement and voltage output were connected to and displayed on the oscilloscope. Figure 6a shows the displacement signal. The input voltage to the transducer is approximately 37.5 Vpp. The driving signal is 24.4 kHz. It can be seen that the obtained amplitude of the displacement is approximately 31.25 mVpp, corresponding to 0.73 μmpp displacement and 0.056 m/s vibration velocity. The detected frequency is 24.36 kHz, which is very close to the driving frequency. This result suggests that the nodal vibration leakage is able to be used as an ultrasonic energy harvesting source. In terms of vibration velocity, the ultrasonic transducer usually works at the velocity range from several m/s to 20 m/s []. This vibration leakage is therefore comparatively very small in amplitude. However, alternatively, this also implies that the harvester can be used as a good vibration isolator [,].
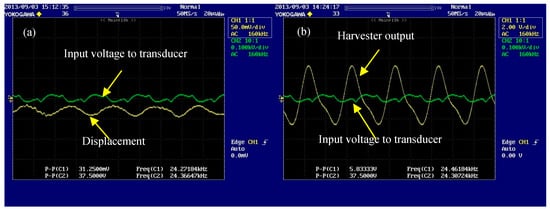
Figure 6.
Displacement and open circuit voltage of the energy harvester, (a) Displacement in response to the input voltage; (b) Harvester output in response to the input voltage.
Figure 6b shows open circuit voltage of the energy harvester. The amplitude is about 5.8 Vpp while the frequency is 24.4 kHz. Therefore, it implies that the harvester is able to generate energy. In other words, our concept of nodal vibration leakage energy harvesting is workable.
5.2. Current, Power, and Impedance Matching
To further estimate the energy generation capability of the nodal vibration leakage energy harvester, the voltage, current, and power as a function of the resistor load were measured. The cutting transducer is still in its free resonant vibration condition. The excitation voltage to the cutting transducer is about 37.5 Vpp. Figure 7 shows the experimental results. It can be seen that the trend of the experimental data are in a good agreement with the above theoretical analysis (Figure 4). The voltage increases gradually and saturates at the open circuit voltage of about 5.8 Vpp. The current decreases gradually. The maximum current is at the initial stage. Its magnitude is about 10 mApp. The power increases first, reaches peak value, and then decreases. The measured peak power point is at 500 Ω, close to the theoretical impedance matching resistance of 650 Ω according to the earlier developed theory (Equation (4)). The peak power at 500 Ω is about 3.13 mW.
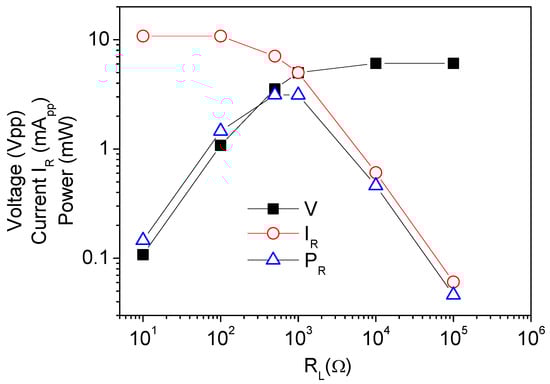
Figure 7.
Output performance of the energy harvester as a function of load resistance.
Figure 8 shows the measured output voltage, current, and power as a function of the applied voltage to the transducer. The resistor load is 500 Ω. In theory, an increase in input voltage will enhance the excitation level to the energy harvester. Hence, the voltage, current, and power were observed to increase gradually. However, the increment (voltage and current) is not linear as expected. One of the reasons could be the free vibration condition of the transducer. When the excitation level is increased, the losses and damping might shift the position of the resonant frequency of the transducer. As a result, the magnitude of the vibration is reduced. The maximum observed power, current, and voltage are about 6.4 mW, 10.2 mApp, and 5.08 Vpp, respectively.
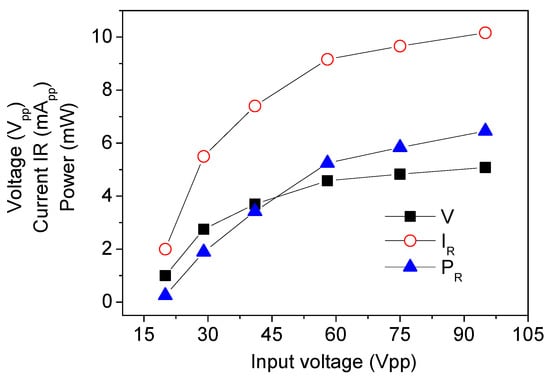
Figure 8.
Output performance of the energy harvester under a 500 Ω load as a function of the input voltage to the transducer.
After demonstrating the energy harvesting capability of the harvester, it is necessary to mention its advantages and competitiveness. Therefore, a comparison was carried out. Figure 9 shows the performance of another 66 Hz bending type, round shaped, piezoelectric unimorph energy harvester. Similar to the high frequency 24.4 kHz harvester, the 66 Hz harvester is fabricated by bonding the same PZT material disk to a brass substrate. The dimension of the device is about 30 mm in diameter. The capacitance of the harvester is about 30 nF. Another mechanical actuator is applied to generate the displacement of the harvester. Table 1 lists the performance parameters of the 24.4 kHz high frequency and the 66 Hz low frequency harvesters. Comparatively, the 24.4 kHz harvester has a much lower excitation level (0.73:115 = 24.4 kHz harvester:66 Hz harvester). Accordingly, it produces a much lower output voltage (5.8:70). However, its current level is much higher than that of the 66 Hz transducer (10:1.3). The 24.4 kHz transducer also has a lower impedance matching resistance (500:50,000) due to its high operation frequency as shown by the theoretical analysis. Regarding the power generation, the two transducers have close magnitude (6.45:6.68). The high frequency transducer does not generate a higher power output in the studied range as expected from the theory. This is mainly due to the lower vibration amplitude of the high frequency harvester.
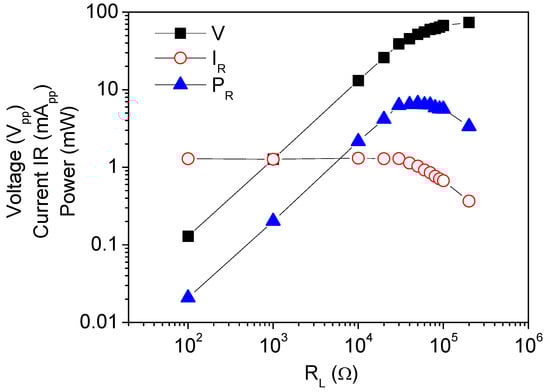
Figure 9.
A 66 Hz energy harvester for comparison.

Table 1.
Performance parameters of the high and low frequency energy harvesters.
Obviously shown in Table 1, the nodal vibration leakage energy harvester has two main advantages. Firstly, it has a high current generation capability. From the third expression of Equation (2), the maximum IR is jωQ (when IC = 0). This means that the large current generation capability of the harvester is largely contributed by its high operation frequency. This advantage is useful for many applications, for example, battery charging which requires continuous and suitable large current amplitude. Assuming that the capacity of a recharging battery is 40 mAh, if the battery must be charged in less than 1 h, the current should be at least 40 mA []. Therefore, improving the current level will reduce the charging time. Secondly, it has a low impedance matching resistance. As analyzed above, this is also due to the high operation frequency as indicated in Equation (4). Although most studies claimed that piezoelectric energy harvesters are more suitable for high impedance applications [,], our results have clearly shown that an increase in the operation frequency leads to a lower impedance matching resistance. Therefore, the high frequency energy harvester can also be suitable for low impedance applications, such as LED. For LEDs, typically, the voltage drop is about 2 V and the current is from 2 mA to 20 mA for normal operation. So, the resistance of the LED is in the range of 100 to 1000 Ω. The impedance matching resistance of the 24.4 kHz energy harvester exactly falls in this range. That is to say, the high frequency harvester is more efficient.
Due to the lower amplitude of the excitation, the absolute maximum power and voltage of the 24.4 kHz harvester are not higher than those of the 66 Hz harvester as shown above. However, practically, the exact output voltage and output power highly depend on the impedance matching condition and load resistance. In this respect, the output of the 24.4 kHz harvester may not be lower in some specific cases. For example, at 100 Ω load resistance, the 24.4 kHz harvester generates a voltage of 1.08 Vpp and a power of 1.4 mW, whereas the 66 Hz harvester only provides 0.13 Vpp and 0.02 mW, respectively. This result has also been predicted by the above theoretical analysis.
5.3. Testing under Cutting Conditions
In the above studies, no load was applied to the cutting transducer. In this section, the test was carried out under the real cutting conditions, as shown in Figure 10. A piece of PZT ceramic disk was cut, as shown in Figure 10a. The input voltage of 500 Vpp was applied to the cutting transducer. During cutting, the tip of the cutting transducer was pressed against the ceramic surface. The static force is 2.6 kgf. This static force also generated energy, but it was negelated in the present study. Two LEDs with opposite polarity were used to indicate the energy generation capability of the harvester as shown in Figure 10b. The two LEDs were connected in parallel. As a result, they will light up alternatively. A 1.1 Ω resistor was used to measure the current flowing through the LEDs. Therefore, in Figure 10, V1 is the current to be measured and V2 is the voltage across the LEDs (voltage drop across LEDs is much larger than that of the 1.1 Ω resistor).
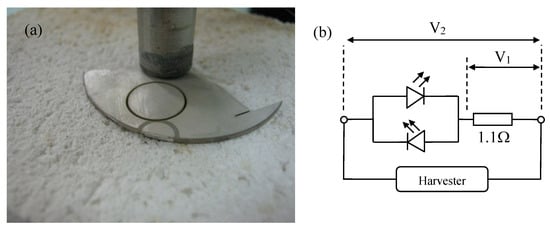
Figure 10.
Setup to measure harvester properties under cutting conditions, (a) Cut ceramic disk; (b) LED circuit.
Figure 11 shows the waveform of the voltage (V2) and current (V1). Two plateaus were observed at the wave crest and trough. This is because the two LEDs are forward biased alternately. When the LEDs light up, the voltage drops across them are automatically clamped at their forward voltages, which are approximately 2 V. The current magnitude is about 10 mA0-p (22 mApp/2/1.1). To power a LED, normally the forward current should be in the order of 2 mA to 20 mA as mentioned earlier. Therefore, the current magnitude strongly indicates that the developed nodal vibration leakage energy harvester is capable and effective to power a LED.
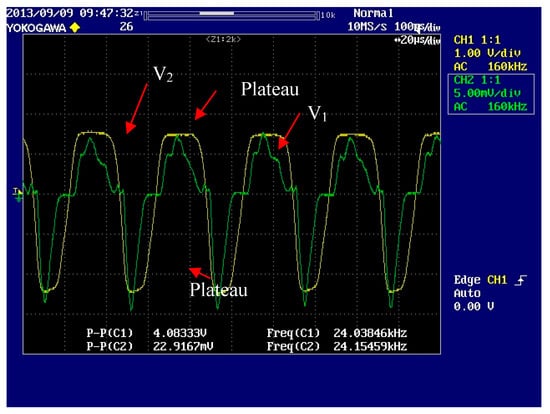
Figure 11.
Output signal of the harvester.
Figure 12 shows the variation of the voltage drop across the LEDs during the cutting process. The cutting depth is 1 mm, which takes a time duration of approximately 14 s. The fluctuation of the signal indicates the variation of the vibration amplitude of the cutting transducer. Therefore, from this signal variation or the brightness of the emitting light, the vibration of the cutting transducer can be qualitatively controlled or monitored.
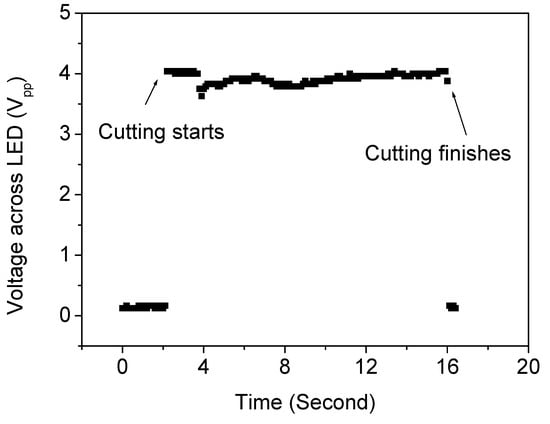
Figure 12.
The variation of the voltage signal across the LEDs during the cutting process.
The cutting transducer is essentially one type of high-power transducer, which has a number of applications, such as surgery devices, ultrasonic welding, liquid processing, spray, atomization, and ultrasonic machining []. For those devices, the typical system structure is that the transducer is fixed to a support fixture or casing through a coupler. Many of the couplers are flange, which are rigid. Therefore, the transducer vibration is apt to be transferred to the casing, which may reduce the reliably or accuracy or may affect the operation of the system. The energy harvester proposed in this paper is softer than the rigid flange. Therefore, it provides quite a few advantages, for example, the vibration can be damped by the harvester; the energy harvested can be used to charge or power a small device; and the output signal from the PZT can be used as feedback signal, which indicates the vibration amplitude of the transducer. In all, the nodal vibration leakage energy harvester can be used as simply a harvester or as a sensing, controlling, and monitoring component in those devices.
6. Conclusions
A nodal vibration leakage piezoelectric energy harvester has been developed. The harvester consists of three piezoelectric unimorph cantilevers. They are axisymmetrically arranged around an inner ring. The harvester couples the high-power ultrasonic cutting transducer at its nodal position to the fixture. As a result, the nodal vibration leakage of the cutting transducer can be used as an energy source. The excitation level of the energy harvester is 0.73 μmpp at 24.4 kHz under a transducer input voltage of 37.5 Vpp. Both theoretical analyses and experimental measurements were conducted. It was also compared with another low frequency 66 Hz energy harvester. The high frequency harvester has the advantages of (i) a higher current generation capability and (ii) a lower impedance matching resistance. In a practical case, a maximum current of up to 20 mApp (cutting test, power LED) was generated, much higher than that (1.3 mApp) of the 66 Hz harvester. This high frequency harvester also has a lower impedance matching resistance of about 500 Ω, as compared to that (50 kΩ) of the 66 Hz harvester. These advantages make the high frequency harvester more suitable for the low impedance load applications. In summary, the nodal vibration leakage energy harvester can be applied in the field of high-power transducers as a component for functions like battery charging, sensing, controlling, and vibration monitoring.
Author Contributions
P.S.L. provided the concepts. T.L. conducted the experiments. P.S.L. and T.L. performed the analysis. P.S.L. and T.L. both contributed the manuscript preparation and editing.
Funding
The project is funded by the Campus for Research Excellence and Technological Enterprise (CREATE), under the National Research Foundation, Prime Minister’s Office, Singapore.
Conflicts of Interest
The authors declare no conflict of interest.
References
- Bogue, R. Energy harvesting and wireless sensors: A review of recent developments. Sens. Rev. 2009, 29, 194–199. [Google Scholar] [CrossRef]
- Khaligh, A.; Zeng, P.; Zheng, C. Kinetic energy harvesting using piezoelectric and electromagnetic technologies—State of the art. IEEE Trans. Ind. Electron. 2010, 57, 850–860. [Google Scholar] [CrossRef]
- Chalasani, S.; Conrad, J.M. A survey of energy harvesting sources for embedded systems. In Proceedings of the SoutheastCon, Huntsville, AL, USA, 3–6 April 2008. [Google Scholar]
- Saadon, S.; Sidek, O. A review of vibration-based MEMS piezoelectric energy harvesters. Energy Convers. Manag. 2011, 52, 500–504. [Google Scholar] [CrossRef]
- Harb, A. Energy harvesting: State-of-the-art. Renew. Energy 2011, 36, 2641–2654. [Google Scholar] [CrossRef]
- Ibrahim, S.W.; Ali, W.G. Power enhancement for piezoelectric energy harvester. In Proceedings of the World Congress on Engineering, London, UK, 4–6 July 2012. [Google Scholar]
- Priya, S. Modeling of electric energy harvesting using piezoelectric windmill. Appl. Phys. Lett. 2005, 87, 184101. [Google Scholar] [CrossRef]
- Sodano, H.A.; Park, G.; Inman, D.J. Estimation of electric charge output for piezoelectric energy harvesting. Strain 2004, 40, 49–58. [Google Scholar] [CrossRef]
- Rocha, J.G.; Goncalves, L.M.; Rocha, P.F.; Silva, M.P.; Lanceros-Mendez, S. Energy Harvesting from Piezoelectric Materials Fully Integrated in Footwear. IEEE Trans. Ind. Electron. 2010, 57, 813–819. [Google Scholar] [CrossRef]
- Kim, H.W.; Priya, S.; Uchino, K.; Newnham, R.E. Piezoelectric energy harvesting under high pre-stressed cyclic vibrations. J. Electroceram. 2005, 15, 27–34. [Google Scholar] [CrossRef]
- Donohoe, M.; Jornet, J.M.; Balasubramaniam, S. Nanodeive arrays for peripheral nerve fascicle activation using ultrasound energy-harvesting. IEEE Trans. Nanotechnol. 2017, 16, 919–930. [Google Scholar] [CrossRef]
- Mazzilli, F.; Thoppay, P.E.; Praplan, V.; Dehollain, C. Ultrasound energy harvesting system for deep implanted-mideical-devices (IMDs). In Proceedings of the IEEE International Symposium on Circuits and Systems, Seoul, Korea, 20–23 May 2012. [Google Scholar]
- Kim, H.W.; Batra, A.; Priya, S.; Uchino, K.; Markley, D.; Hofmann, R.E. Energy harvesting using a piezoelectric ‘Cymbal’ transducer in dynamic environment. Jpn. J. Appl. Phys. 2004, 43, 6178–6183. [Google Scholar] [CrossRef]
- Zhu, D.B.; Beeby, S.; Tudor, J.; White, N.; Harris, N. Improving output power of piezoelectric energy harvesters using multilayer structures. Procedia Eng. 2011, 25, 199–202. [Google Scholar] [CrossRef]
- Kamel, T.M.; Elfrink, R.; Renaud, M.; Hohlfeld, D.; Goedbloed, M.; de Nooijer, C.; Jambunathan, M.; van Schaijk, R. Modeling and characterization of MEMS-based piezoelectric harvesting devices. J. Micromech. Microeng. 2010, 20, 105023. [Google Scholar] [CrossRef]
- Guan, M.J.; Liao, W.H. On the efficiencies of piezoelectric energy harvesting circuits towards storage device voltages. Smart Mater. Struct. 2007, 16, 498–505. [Google Scholar] [CrossRef]
- Ottman, G.K.; Hofmann, H.F.; Bhatt, A.C.; Lesieutre, G.A. Adaptive piezoelectric energy harvesting circuit for wireless remote power supply. IEEE Trans. Power Electron. 2002, 17, 669–676. [Google Scholar] [CrossRef]
- Umeda, M.; Nakamura, K.; Ueha, S. Analysis of the transformation of mechanical impact energy to electric energy using piezoelectric vibrator. Jpn. J. Appl. Phys. 1996, 35, 3267–3273. [Google Scholar] [CrossRef]
- Abramovich, H.; Harash, E.; Milgrom, C.; Amit, U. Power Harvesting from Apparatus, System and Method. U.S. Patent US20090195226A1, 6 August 2009. [Google Scholar]
- Li, T.; Chen, Y.H.; Ma, J. Frequency dependence of piezoelectric vibration velocity. Sens. Actuators 2007, 138, 404–410. [Google Scholar] [CrossRef]
- Li, T.; Ma, J.; Low, A.F. Horn-type piezoelectric ultrasonic transducer: Modelling and applications. In Advances in Piezoelectric Transducers; Ebrahimi, F., Ed.; InTech: Rijeka, Croatia, 2011; ISBN 978-953-307-931-8. [Google Scholar]
- Law, H.H.; Rossiter, P.L.; Simon, G.P.; Koss, L.L. Characterization of mechanical vibration damping by piezoelectric materials. J. Sound Vib. 1996, 197, 489–513. [Google Scholar] [CrossRef]
- Sodano, H.A.; Inman, D.J. Comparison of piezoelectric energy harvesting devices for researching batteries. J. Intell. Mater. Syst. Struct. 2005, 16, 799–807. [Google Scholar] [CrossRef]
- Li, T.; Wang, Y.; Lee, P.S. Power Transducer and Piezoelectric Pump; Lambert Academic Publishing: Saarbrücken, Germany, 2012. [Google Scholar]
© 2019 by the authors. Licensee MDPI, Basel, Switzerland. This article is an open access article distributed under the terms and conditions of the Creative Commons Attribution (CC BY) license (http://creativecommons.org/licenses/by/4.0/).