1. Introduction
More and more production processes are equipped with sensors to generate a better process understanding using the generated data to correlate cause and effect. The next level in process automatization is to control the product properties by reacting to the measured values with a suitable actuating variable [
1]. To reach this degree of automatization, there is the need for suitable actuators to control the designated actuating variables. The actuator principles for the main drives of forming machines are set, whereas alternative actuator concepts are required for auxiliary drives. Thermal expansion is a promising actuator principle, especially when paraffin wax is employed.
Paraffin wax is used in numerous applications as microactuators [
2,
3,
4,
5,
6], valves [
7,
8,
9], and pumps [
10,
11]. Paraffin wax is a phase change material which generates a significant volume increase while changing from solid to liquid phase (C
24H
50 up to 22.9% at 80 °C compared to 30 °C [
12]). The volume increase is utilized by a housing to achieve a directed force or a displacement, or both. In order to design sufficient actuator housings, paraffin wax is modeled in FEM simulations with the aim to predict the targeted properties of the actuator. There are various challenges to address when the behavior of paraffin wax is modeled in a FEM simulation. Below the melting temperature, paraffin wax acts as a solid body with a pseudoplastic material behavior [
13]. Above the melting temperature, paraffin wax behaves like a compressible liquid. In the melting area, paraffin wax shows a shear thinning behavior.
Ogden et al. give an overview over the modeling strategies for paraffin wax and summarize that a modeling as a fluid has the advantages of conforming to shape changes and modeling a more veridical thermal conductivity relating to natural convection [
14]. Hence et al. [
15] and Costa et al. [
16] perform basic numerical investigations on latent heat thermal energy storage systems by improving the response times by fins. Further investigations on latent heat thermal energy storage systems by Brousseau and Lacroix focus on the thermal behavior of phase change materials [
17]. Kratz et al. include paraffin wax as a heat sink in their thermal investigation on silicon-based heat dissipation stages [
18]. Lee et al. performed a thermal analysis locating the melting front of the paraffin wax [
19] and a pressure analysis of an electro thermohydraulic microactuator [
20]. The focus of this investigation lies on the thermal behavior of paraffin wax. It reaches a good accordance of the predicted and actual melting fronts of the used paraffin wax. Gowreesunker et al. enhanced a phase change simulation by implementing user defined temperature-dependent specific heats, which are varied for heating and for cooling [
21]. The modeling utilized a flow simulation to evaluate phase change materials as an energy storage material in buildings. Kong et al. performed a numerical investigation on the volumetric change rate for a cylindrical container during the solid to liquid phase change process for energy conversion systems [
22]. Malik et al. present a numerical simulation in which the paraffin wax of the micro actuator is modeled as a liquid in the solid and liquid phase with varying density and viscosity [
23].
Bodén et al. conduct a thermo-mechanical modeling of a paraffin wax powered miniaturized pump [
24]. The volume increase is implemented by a temperature-dependent density. For modeling the heat conduction, the specific heat is temperature-dependent, too. The thermal conductivity is set to 0.24 W/(m K) below 48 °C and to 5 W/(m K) equal and above 48 °C to fulfill the liquid paraffin behavior. The modeled micropump generates pressures up to 5.6 N/mm
2, whereby the compressibility of the paraffin wax is neglected. To achieve plausible data, the convection was adjusted in a static analysis to reach a stroke volume close to the lowest experimentally measured frequency. Furthermore, the thermal transport into and out of the system is adjusted to reach a steady-state stroke volume of the paraffin wax. For a driving frequency below 0.19 Hz, the model shows a good agreement with the experimentally measured flow rate. Above this frequency, the model overestimates the given flow rate [
24].
Mostly, the approaches differ in modeling paraffin wax as a solid or as a liquid, depending on the modeling objectives. Odgen et al. summarize that modeling paraffin wax as a thermally expanding solid is a simpler approach, because only solid mechanics and thermal properties need to be addressed [
14]. The major focus in present investigations is the thermal behavior of paraffin wax. There seems to be a lack of a thorough thermo-mechanical modeling with all thermal and mechanical properties addressed. The modeling strategy depends on the simulation objective, whereas predicting the actuator forces using paraffin wax modeled as a solid is not yet an objective. In the following, a thermo-mechanical modeling of the paraffin wax as a deformable body is performed, with the aim of predicting the actuator properties with the actuator forces in focus. Furthermore, a possibility is provided to obtain the fundamental volume expansion data for the issued paraffin wax.
After presenting the new actuator design for high acting forces and the modeling strategy, the used piston-cylinder test set-up is presented, which is used to obtain the material data and to verify the paraffin wax model in the simulation. Then, the actuator is implemented in the simulation using the established paraffin wax model. Finally, experimental tests verify the simulations.
2. Paraffin Wax Actuator Design and Modeling Strategy
Figure 1 introduces the closed paraffin wax actuator design. The shown housing completely encloses the paraffin wax. The design includes no moving parts or relative movements. The actuator acts as a membrane design, so that a deflection of the top and bottom of the actuator and a reversible extension of the actuator wall generates displacements and forces. Sheet metal housings allow for high internal pressures and actuating forces. Furthermore, a cylinder can be integrated in the actuator center (
Figure 1b). The cylinder provides a known compressive strength in axial direction and additionally provides the possibility to vary the paraffin volume by changing the cylinder diameter
dc compared to an actuator design without cylinder (
Figure 1a).
The actuator consists of two deep drawn cups which fit into each other. Both cups have specific heights, whereby a weld area is created. The welding process necessary generates heat, which distributes within the actuator during the joining process. The induced heat leads to a volume increase of the paraffin wax. To prevent paraffin wax from leaking out of the cavity or damaging the weld seam, a cutting sealing is integrated into the housing design. The inner cup has an additional chamfer at the cup’s wall tip. As seen, the chamfer is positioned at the outer cups internal bottom, on which a brass sheet (thickness 50 µm) is placed. Due to an axial force which can be applied during the welding process, the chamfer at the inner cup’s edge cuts into the brass sheet and establishes a sealing.
On the one hand, the rigid actuator housing enables high forces. On the other hand, it limits the possible displacements. For a target-oriented design, the use of a finite element modeling of the actuator behavior seems promising. As the presented actuator design leaves the expectation for small displacements, a thermo-mechanical modeling as a deformable body seems applicable, whereas the implementation takes place in the software environment Simulia Abaqus (version 6.14-1, Dassault Systèmes®, Vélizy-Villacoublay, France).
The following material properties are required for a sufficient modeling of the paraffin wax: density, Young’s modulus, Poisson’s ratio, elastic limit, thermal expansion coefficient, specific heat, latent heat, and thermal conductivity. The temperature-dependent thermal expansion coefficient models the volume expansion, which is generated by the transition from the solid to the liquid phase. In combination with the correct Young’s modulus the compressibility of the paraffin wax is implemented. The elastic limit allows to distribute stress peaks for an even stress distribution. The thermal properties model the heat distribution within the paraffin wax. The paraffin wax with a melting range of 58–62 °C is issued (SIGMA-ALDRICH paraffin wax mp 58–62 °C). Literature data can be used for most paraffin wax properties (
Table 1). The coefficient of thermal expansion and the Young’s modulus are of special importance for an accurate force prediction. Therefore, they are recorded in an experimental set-up which is described as follows.
3. Paraffin Wax Characterization and Verification of Modeling Using a Piston-Cylinder Test Set-Up
Figure 2 shows the piston-cylinder test set-up for the paraffin wax characterization and the verification of modeling. There are eight heating cartridges positioned around the circumference of the cylinder wall for an even temperature distribution. One heating cartridge is placed in the piston. Furthermore, there are three pressure sensors located in the cylinder (1–3 in
Figure 2 top view). Four thermocouples are positioned at the bottom of the cylinder. One thermocouple is placed in the middle (a) and three thermocouples are placed at the radius
r1 (b, c, and d). At the positions of the pressure sensors, thermocouples can substitute the sensors to obtain the paraffin temperature at the cylinder wall (e, f). Together, the cylinder and the piston generate the paraffin wax chamber with the height
hc and radius
rc. The piston-cylinder set-up is placed in a compression test machine (Zwick Roell 100). The compression test machine records the displacement of the cylinder height ∆
hp using a video extensometer and the axial force
Fa. The heating cartridges are controlled and their temperature data (
a,
b,
c,
d,
e, and
f) is recorded as well as the pressure data (
p1,
p2 and
p3).
Using the piston-cylinder test set-up, two different tests are performed to record the free expansion of the paraffin wax and to record the compressibility. The free expansion is used to calculate the coefficient of thermal expansion α. The compressibility is used to calculate the Young’s modulus E. Prior to both tests, the paraffin wax is bled to remove air form the chamber, the paraffin height hc is measured and weighed.
Table 2 shows the temperature distribution which occurs in the paraffin chamber when the paraffin wax data is obtained in one test. Average, minimal, maximum temperature and the standard deviation are shown to demonstrate the data consistency.
To achieve the coefficient of thermal expansion
, the following equation is used with linear thermal strain
εl and the temperature change
.
The linear thermal strain
εl can be calculated using the free expansion. For recording the free expansion, the piston is loaded with an axial force
Fa = 150 N to secure an enduring paraffin wax contact and the resulting piston height
hp is recorded. Using the temperature control, the target temperature
t is set and held until a minimal temperature deviation is obtained (
Table 2). The given piston-cylinder test set-up records the change in piston height
occurring due to a given temperature change
. As reference temperature, the given room temperature is recorded (
). To receive the volume expansion
εv the following equation is used:
The resulting volume expansion
εv out of three measurements, depending on the temperature
is shown in
Figure 3. For temperatures higher than 75 °C, the volume expansion is extrapolated.
The following equations are used to reduce the volume expansion
εv to a linear thermal strain
εl.
Compression tests are performed for the determination of the temperature-dependent Young’s modulus at various target temperatures
θt. In this way, the bulk modulus
K is experimentally recorded and the Young’s modulus is calculated using the following equation:
For defining the bulk modulus
K, the piston-cylinder test set-up is heated up to the target temperature
θt. After reaching the target temperature
θt, an axial force
Fa,max = 75 kN is applied on the piston and the resulting displacement of the cylinder height ∆
hp is recorded.
Figure 4 shows exemplarily the experimental results for the compression at the target temperature
θt = 65 °C.
The compression of the paraffin wax is repeated ten times to calculate the bulk modulus. The first compression is used to release the remaining air from the paraffin wax chamber and is excluded from the evaluation. The following nine compression graphs show a good correlation. The nonlinear area until ∆
hp = 0.2 mm appears due to settlement effects in the piston seal. For the evaluation of the bulk modulus, only the linear area is used performing a linear regression. The bulk modulus
K is defined as followed with ∆V as volume difference,
V0 as initial volume, ∆
p pressure difference,
h0,θ as initial absolute piston height at target temperature
θt, and
A as piston face.
Table 3 shows the experimental results. The table summarizes the gradient of change of force and change of paraffin height, the deviation of the gradient, the change of the initial absolute piston height at the temperature
as well as the bulk modulus
K.
Using the previously described material modeling, a simulation of the piston-cylinder test set-up is assembled. The piston, the cylinder and the paraffin wax are modelled as deformable axial symmetric bodies using a 4-node axisymmetric thermally coupled quadrilateral, bilinear displacement and temperature element (type CAX4T). The element size of the paraffin wax body is reduced to an edge length of 0.5 mm to reach converging results. The cylinder has an element edge length of 1 mm and the cylinder of 3 mm. The complete model has an initial temperature of 27 °C. The heating cartridges are modelled as a temperature boundary condition in the cylinder wall and the piston center. The simulation is divided into two sections. First, the contact between all components is established by applying the axial force Fa onto the piston in an implicit step. In the second stage, the temperature of the heating cartridges is applied with the described boundary conditions, utilizing a coupled implicit temperature–displacement calculation. In both sections, the resulting piston height hp is recorded.
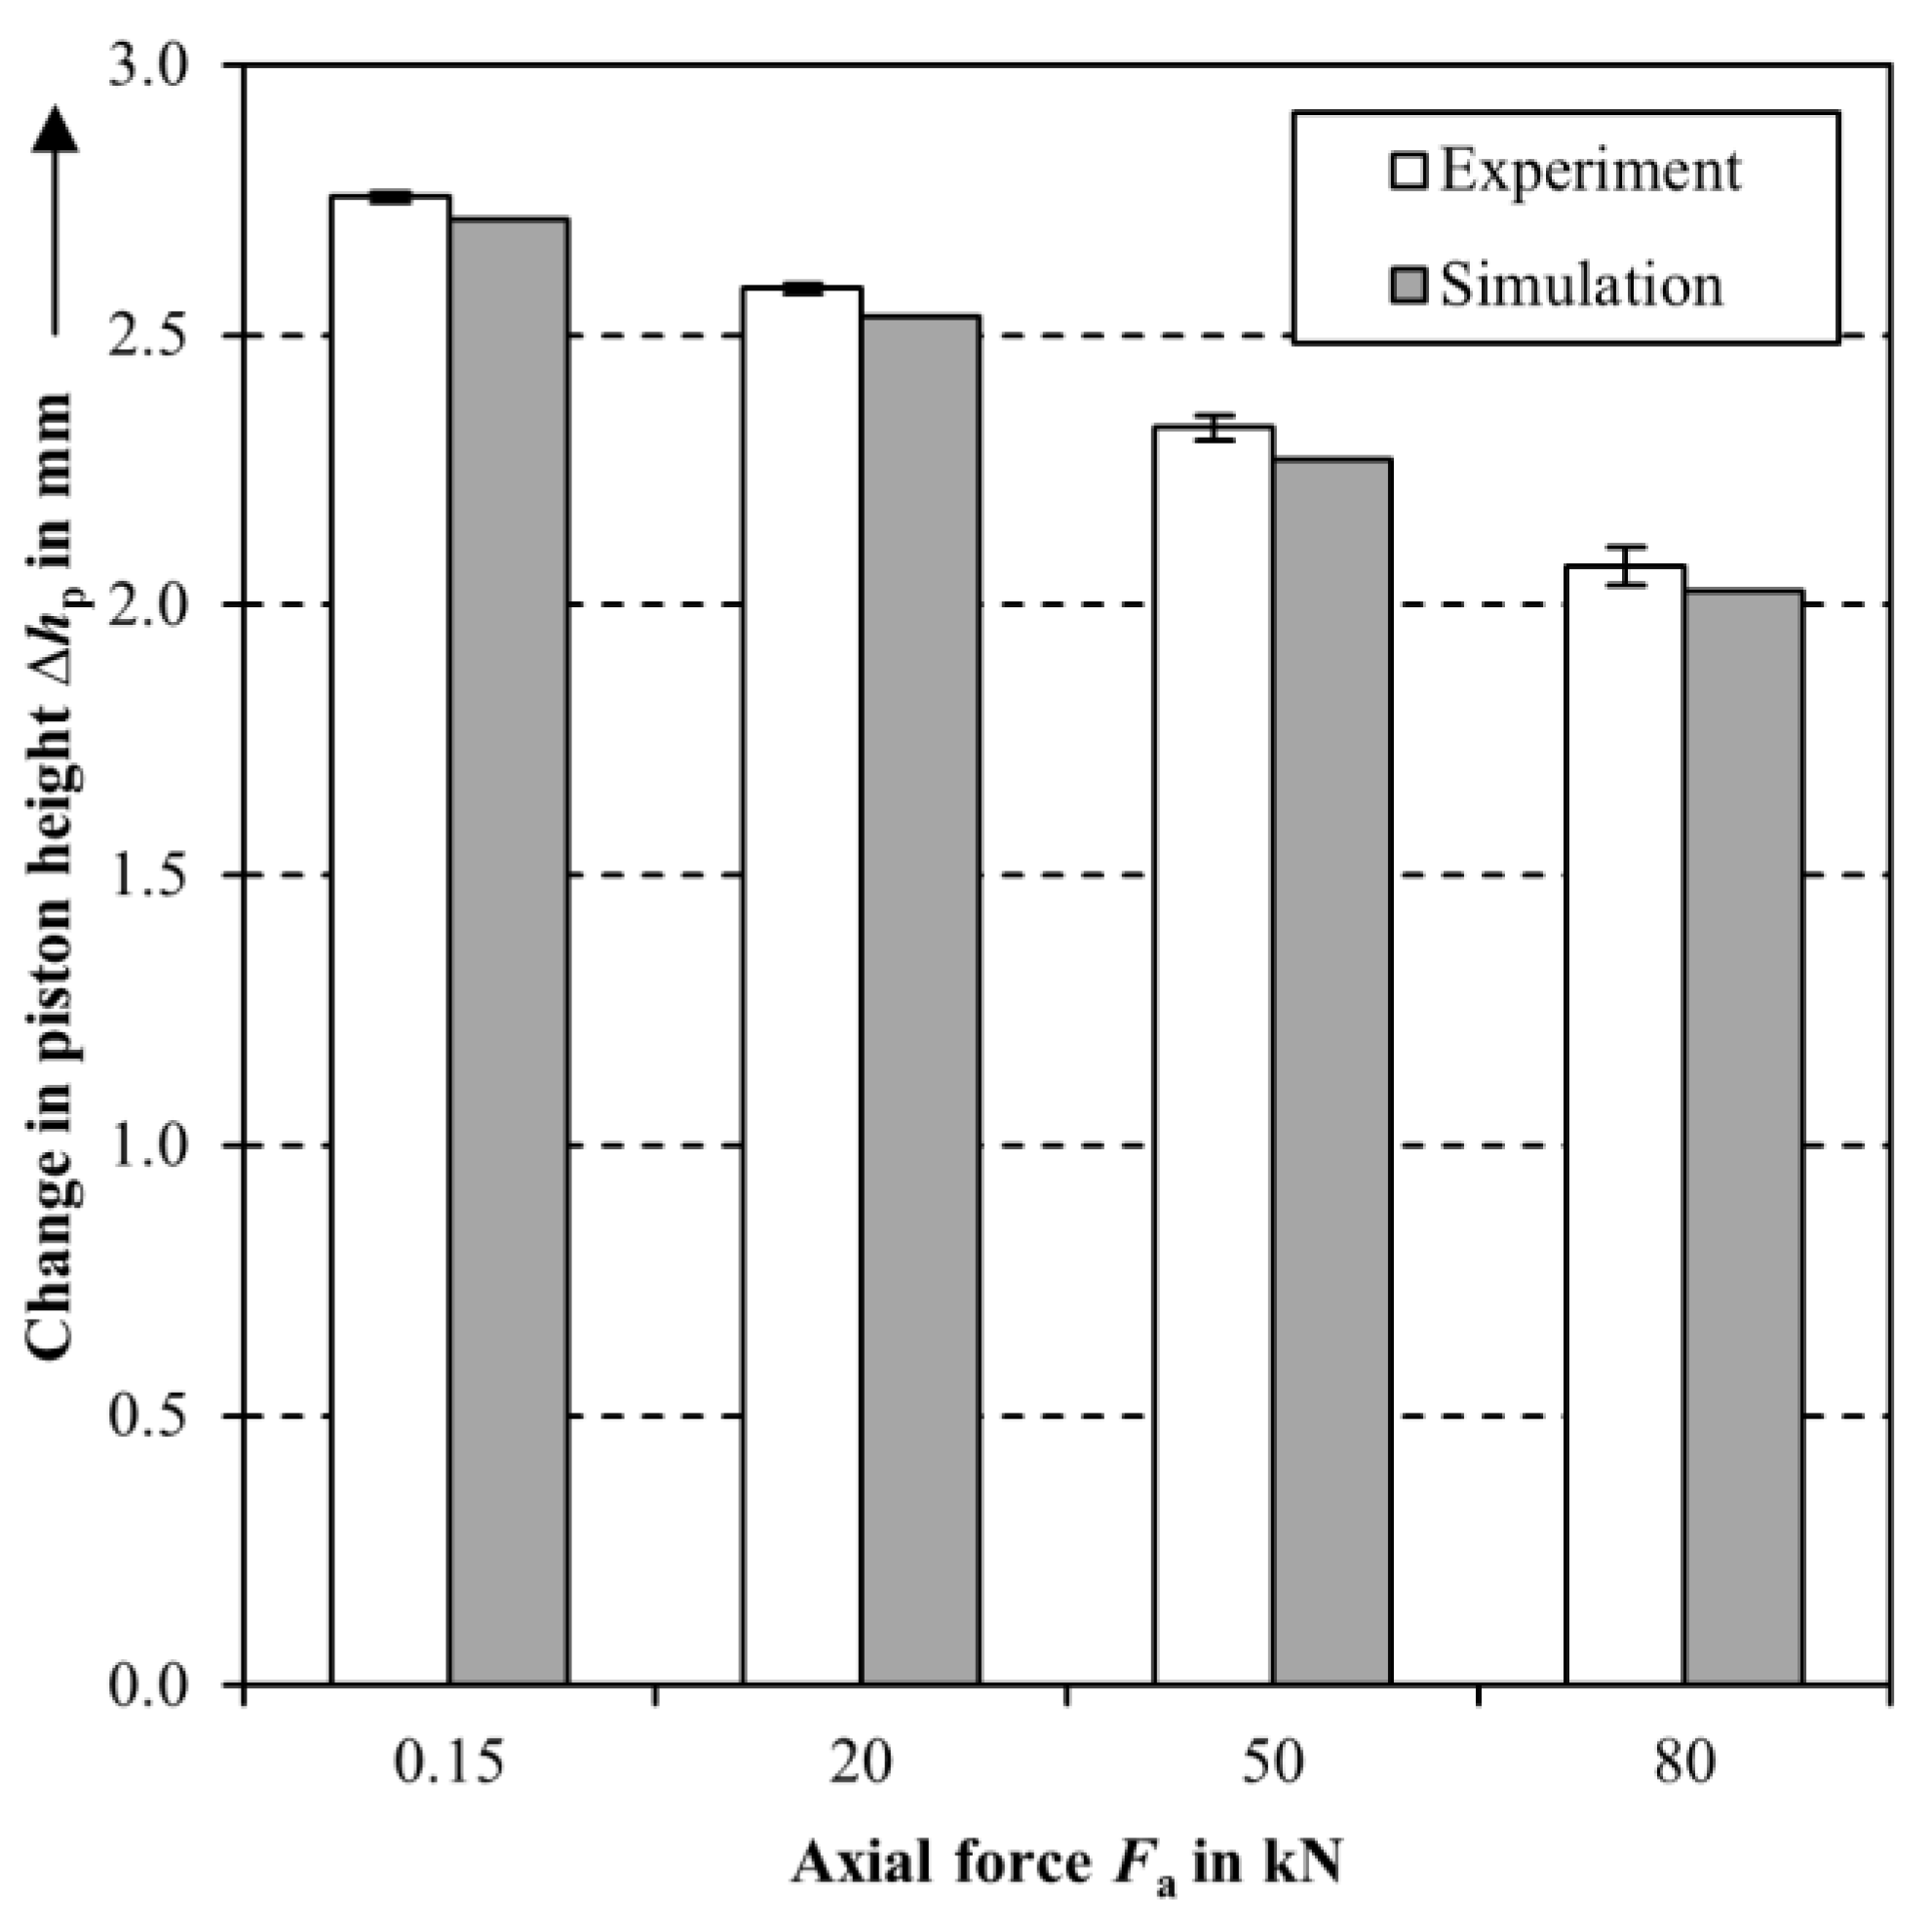
Figure 5 shows the numerical results in comparison to the experimental data. For all calculated axial forces
Fa, there is a good correlation between numerical and experimental results for the change in piston height
hp. All calculated results are below the experimental data. The deviation is 3% or less and therefore the model shows sufficient results for the axial force range from
Fa = 0.15 kN–80 kN.
4. Property Prediction and Experimental Validation of a Closed Paraffin Wax Actuator
In the following, a model of the paraffin wax actuator is set up using the prior described paraffin wax model. The planned experimental setup for characterizing the actuator was modeled in the finite element simulation. In both scenarios, the actuator’s vertical elongation is repressed and the resulting axial force Fa during the heating of the actuator is recorded.
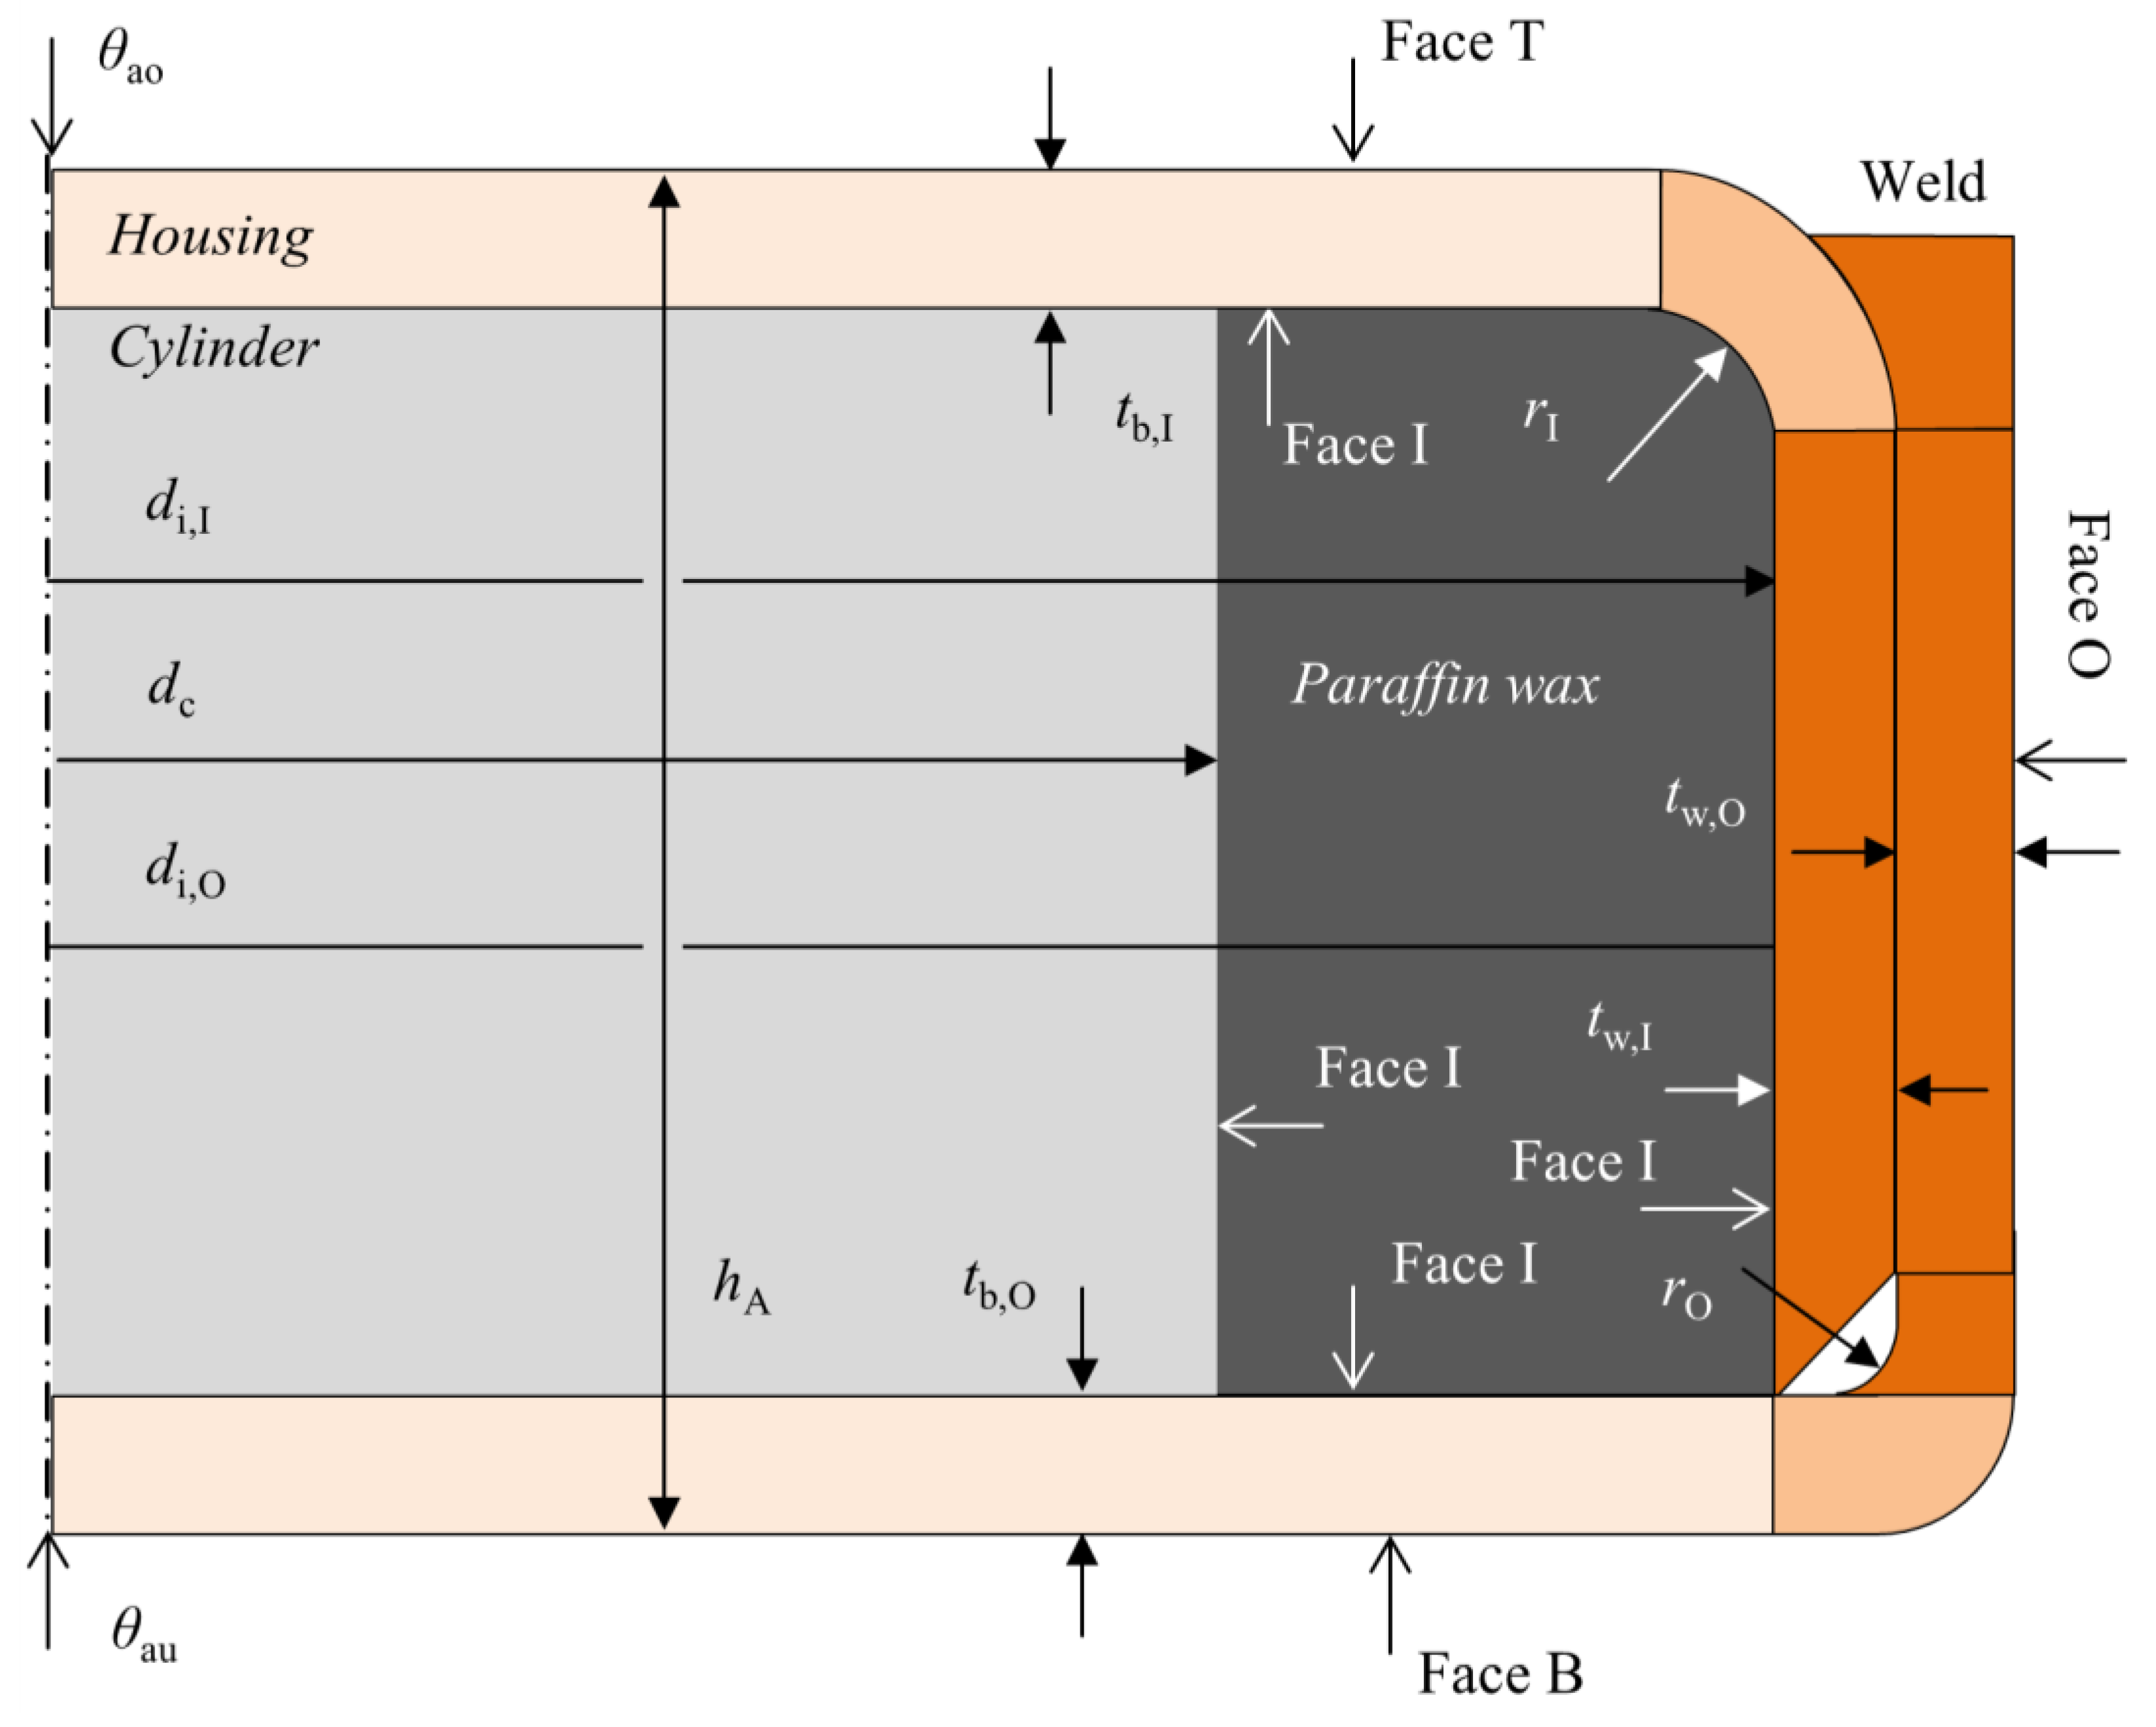
Figure 6 shows an axial symmetric view of the paraffin wax actuator from the experiment and the simulation. The housing consists of an outer cup and an inner cup (steel grade DP600) with the geometric parameters from
Table 4.
A cylinder (dc = 20.0 mm, 22.5 mm, 25.0 mm) is positioned in the middle of the actuator surrounded by paraffin wax. The actuator is surrounded by an aluminum ring which generates an even temperature distribution over the perimeter and contains three thermocouples to control the target temperature θt. There is a heater band around the aluminum ring. The paraffin wax volume can be adjusted by changing the cylinder diameter dc in the actuator. The paraffin wax exerts pressure on the inner Face I due to its volume increase. The pressure leads to an axial force Fa. At face T and face B compression pads (steel grade 1.2379) are positioned to apply the counter pressure and connecting the actuator to the compression test machine (Zwick Roell 100). Thermocouples are placed in the center of the compression pads to record the temperatures θao and θau. In the simulation, the vertical displacement of the compression pads is set to zero by a boundary condition. In the experiment, an optical system references the upper and lower compression pad to a constant distance. Between compression pad and test machine, two insulation plates are positioned to reduce the heat transfer into the test machine. The film coefficient for the outer surfaces is set between 0.01–0.03 W/(mm2 K) in the simulation to model natural convection.
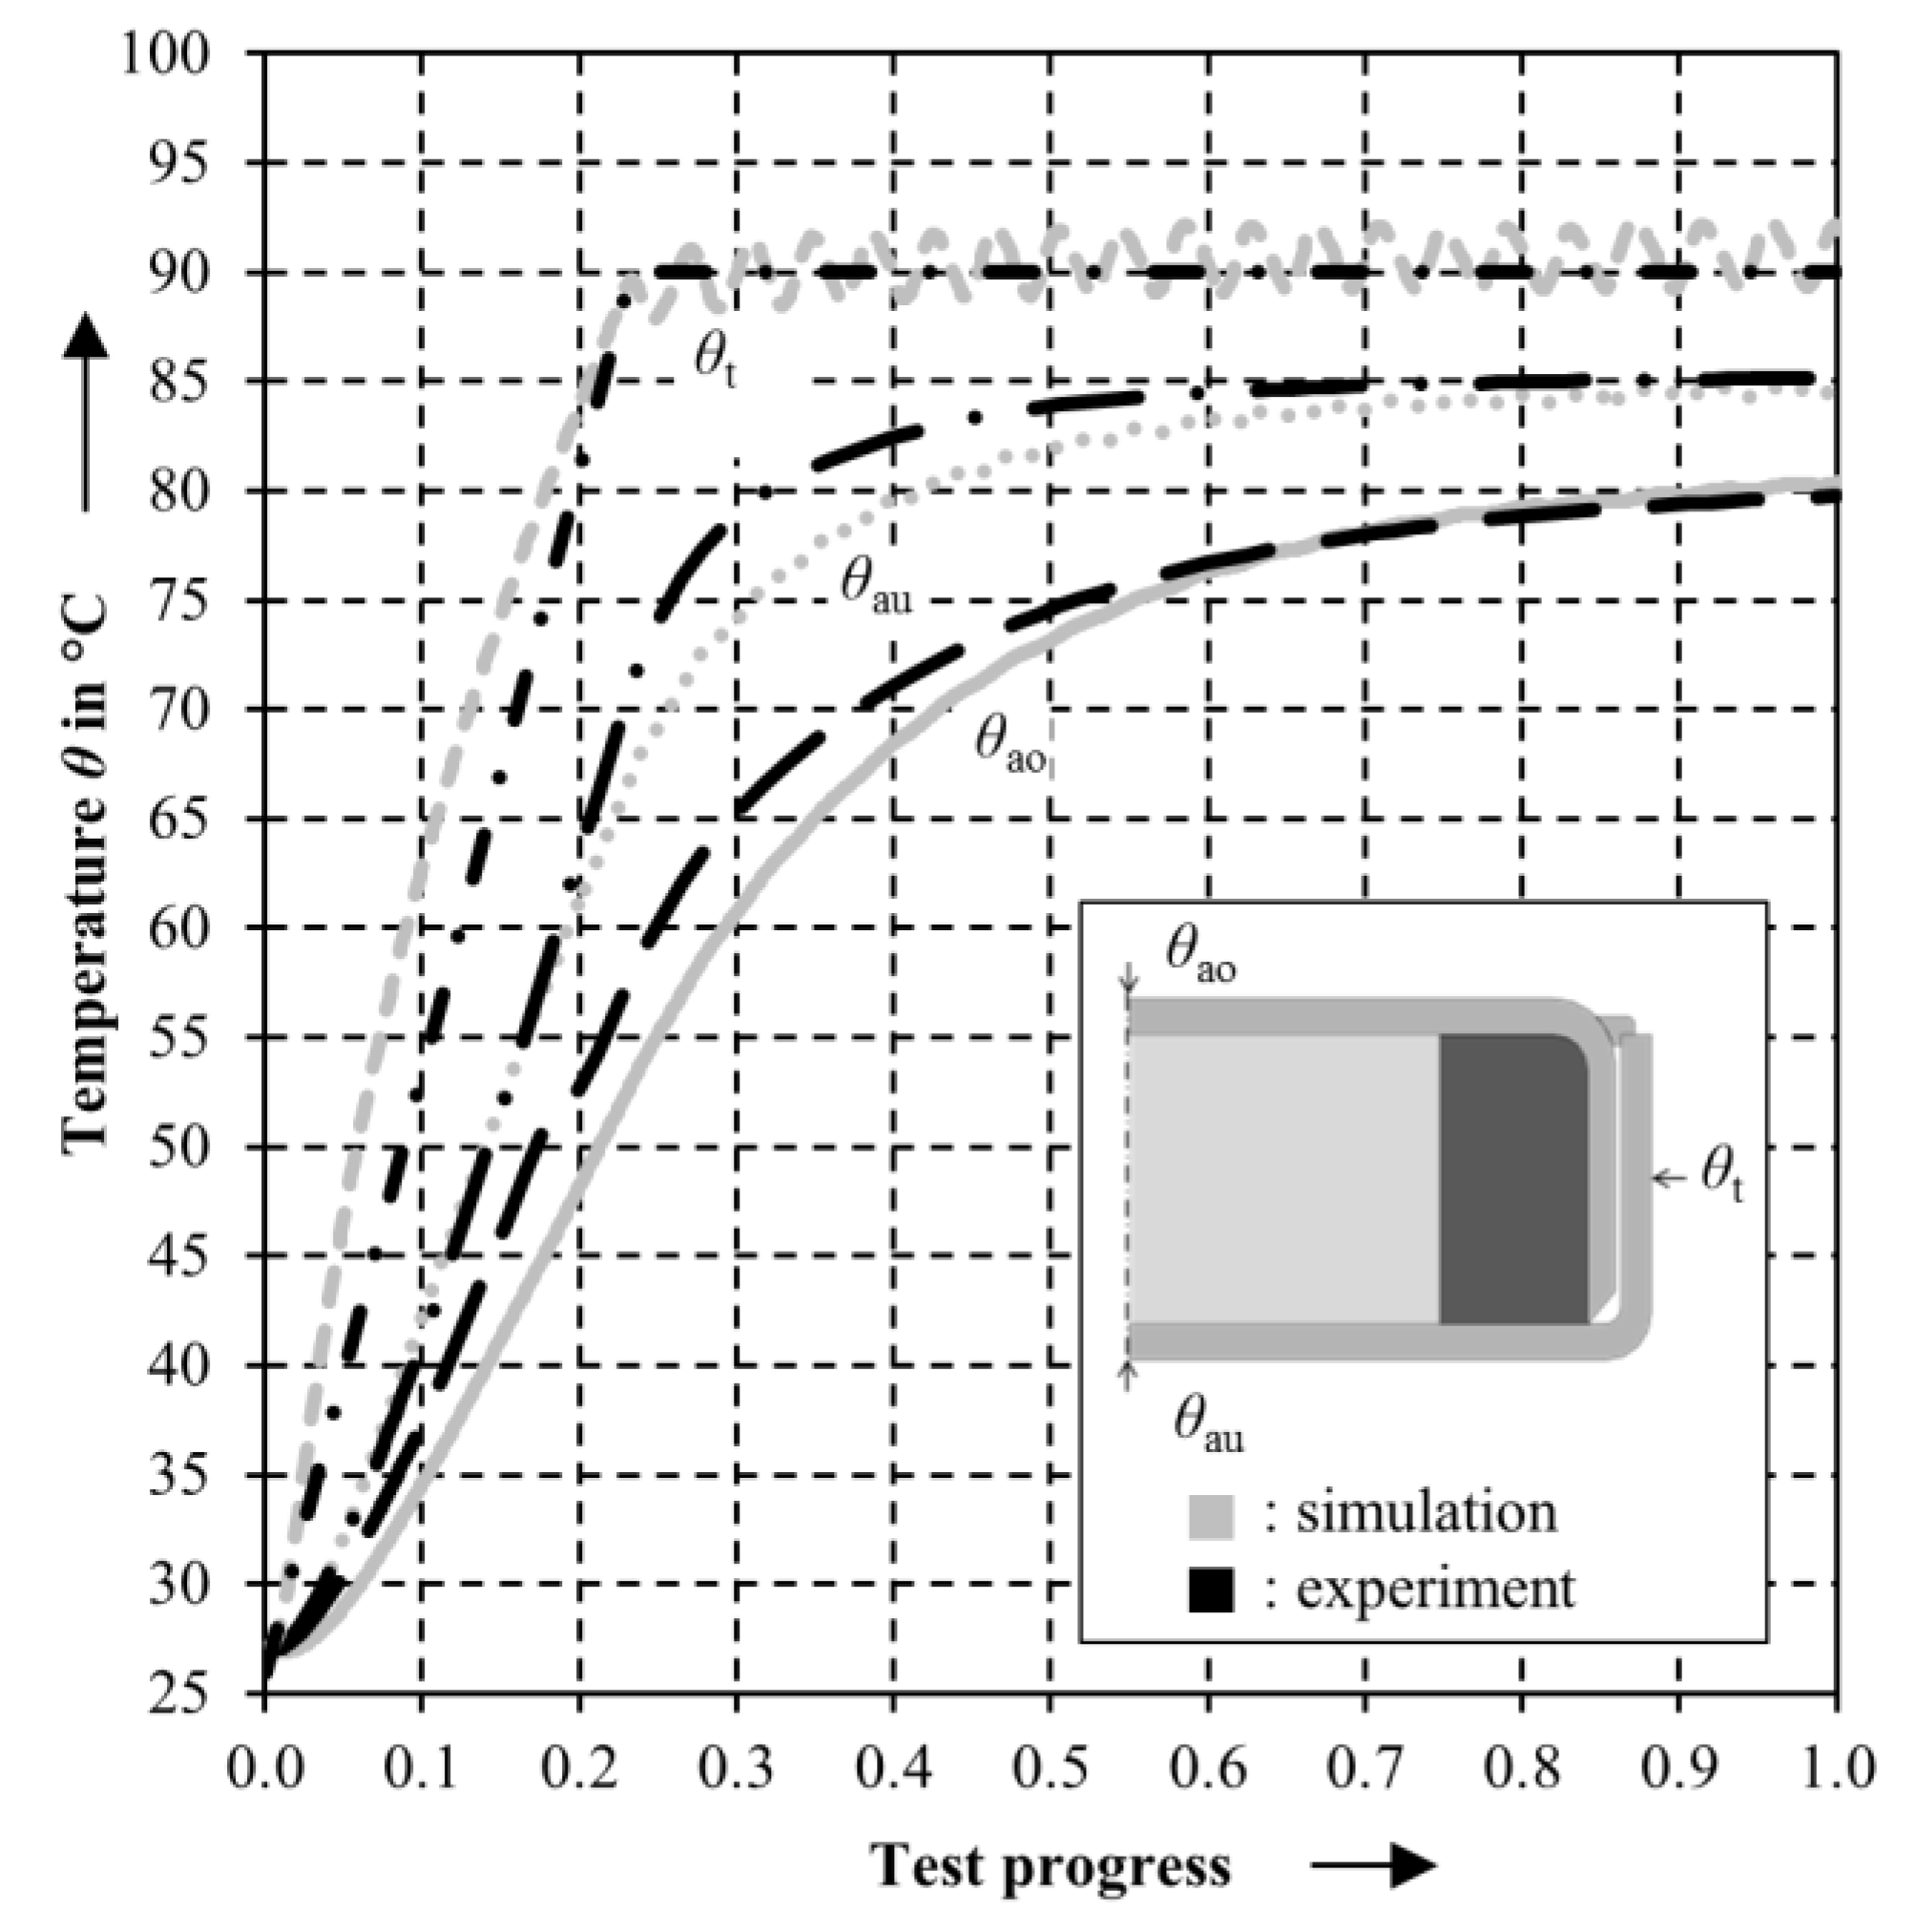
Figure 7 compares measured and calculated temperatures of the actuator with cylinder diameter
dc = 22.5 mm from the experiment and the simulation. The target temperature is set to
θt = 90 °C. The experimental target temperature
θt,exp shows a steep temperature incline with a decreasing gradient until reaching 90 °C. In the simulation, the target temperature
θt,fem is set as a boundary condition. The target temperature
θt,fem reaches its maximum of 90 °C at the same point as the experimental target temperature
θt,exp. In the following, the experimental target temperature
θt,exp oscillates around the value of 90 °C due to the used control, whereas the simulated target temperature
θt,fem is constant. A complete test cycle lasts 1500 s. Furthermore,
Figure 7 shows the top actuator temperature
θao and the bottom actuator temperature
θao for the simulation (fem) and the experiment (exp). The experimental actuator top
θao and bottom
θau temperatures are below the simulated actuator temperatures until the test progress of 0.7. From this point and further, the simulated and experimental actuator temperatures show a similar behavior. The actuator bottom temperature
θau shows a difference of about 5 °C to the actuator top temperature
θao. The heater band lies on the lower compression pad and thus transfers more heat into the lower compression pad and the actuator bottom. The simulated heat distribution correlates with the experimental results.
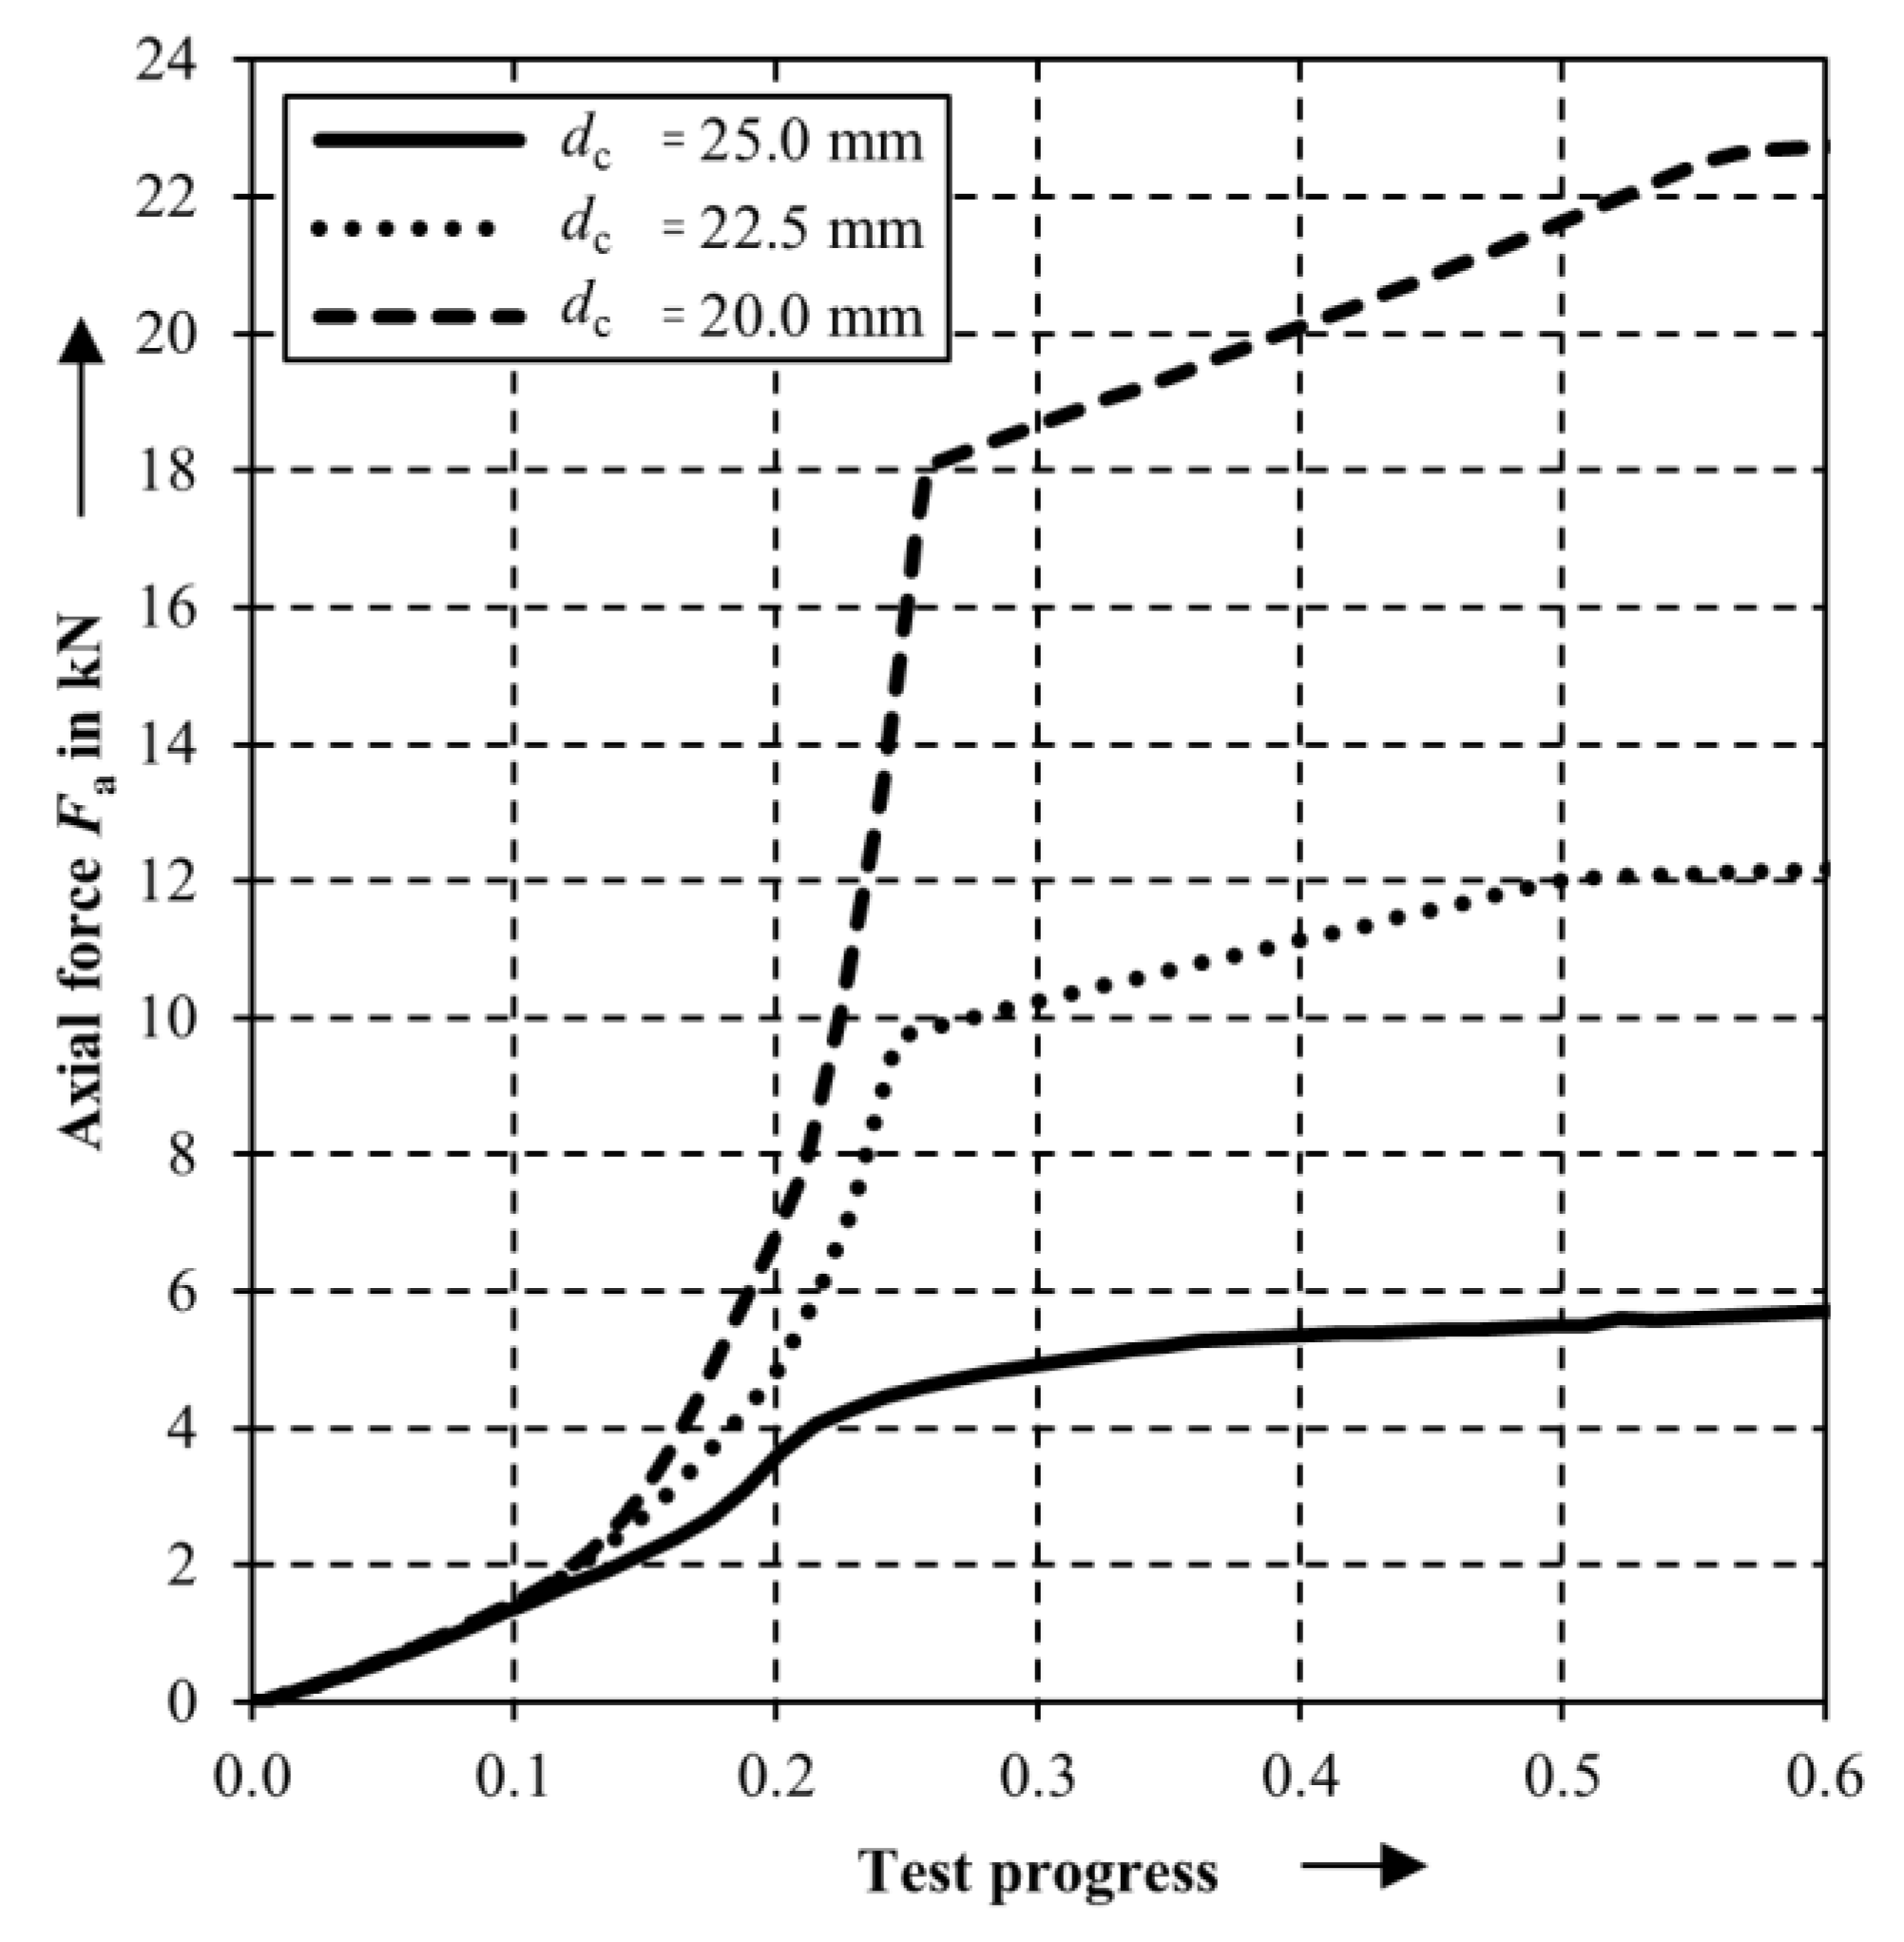
The heating of the actuators with different integrated cylinders show a qualitative similar progress of the axial forces
Fa over the test progress (
Figure 8). The axial force
Fa increases from the start of the test until reaching an inflection point, changing to a linear behavior which changes into a decreasing axial force gradient until the maximum plateau is reached. The inflection point is located between 0.2 and 0.3 of the test progress for all cylinder diameters. At this point, the paraffin wax reaches the temperature of
θ = 58 °C. The melting area of the used paraffin wax begins. In the simulation, the melting process is modeled using the latent heat which is required for the phase transition and using a change of the heat conduction (
Table 1). On the one side, the heat conduction is increasing from 0.21 W/mK to 4.2 W/mK and should accelerate the increase in axial force. On the other side, the necessary heat for changing from solid to liquid phase must be induced into the system. Combined, the latent heat effect is visible in the graph’s course and the actuator behavior shows an inflection point with a decreasing axial force gradient. The amount of paraffin wax has an effect on the response time of paraffin wax actuators, which can be seen at varying inflection points. The actuator with the cylinder diameter
dc = 25.0 mm reaches
θ = 58 °C at 0.22 (
dc = 22.5 mm at 0.25 and
dc = 20.0 mm at 0.26).
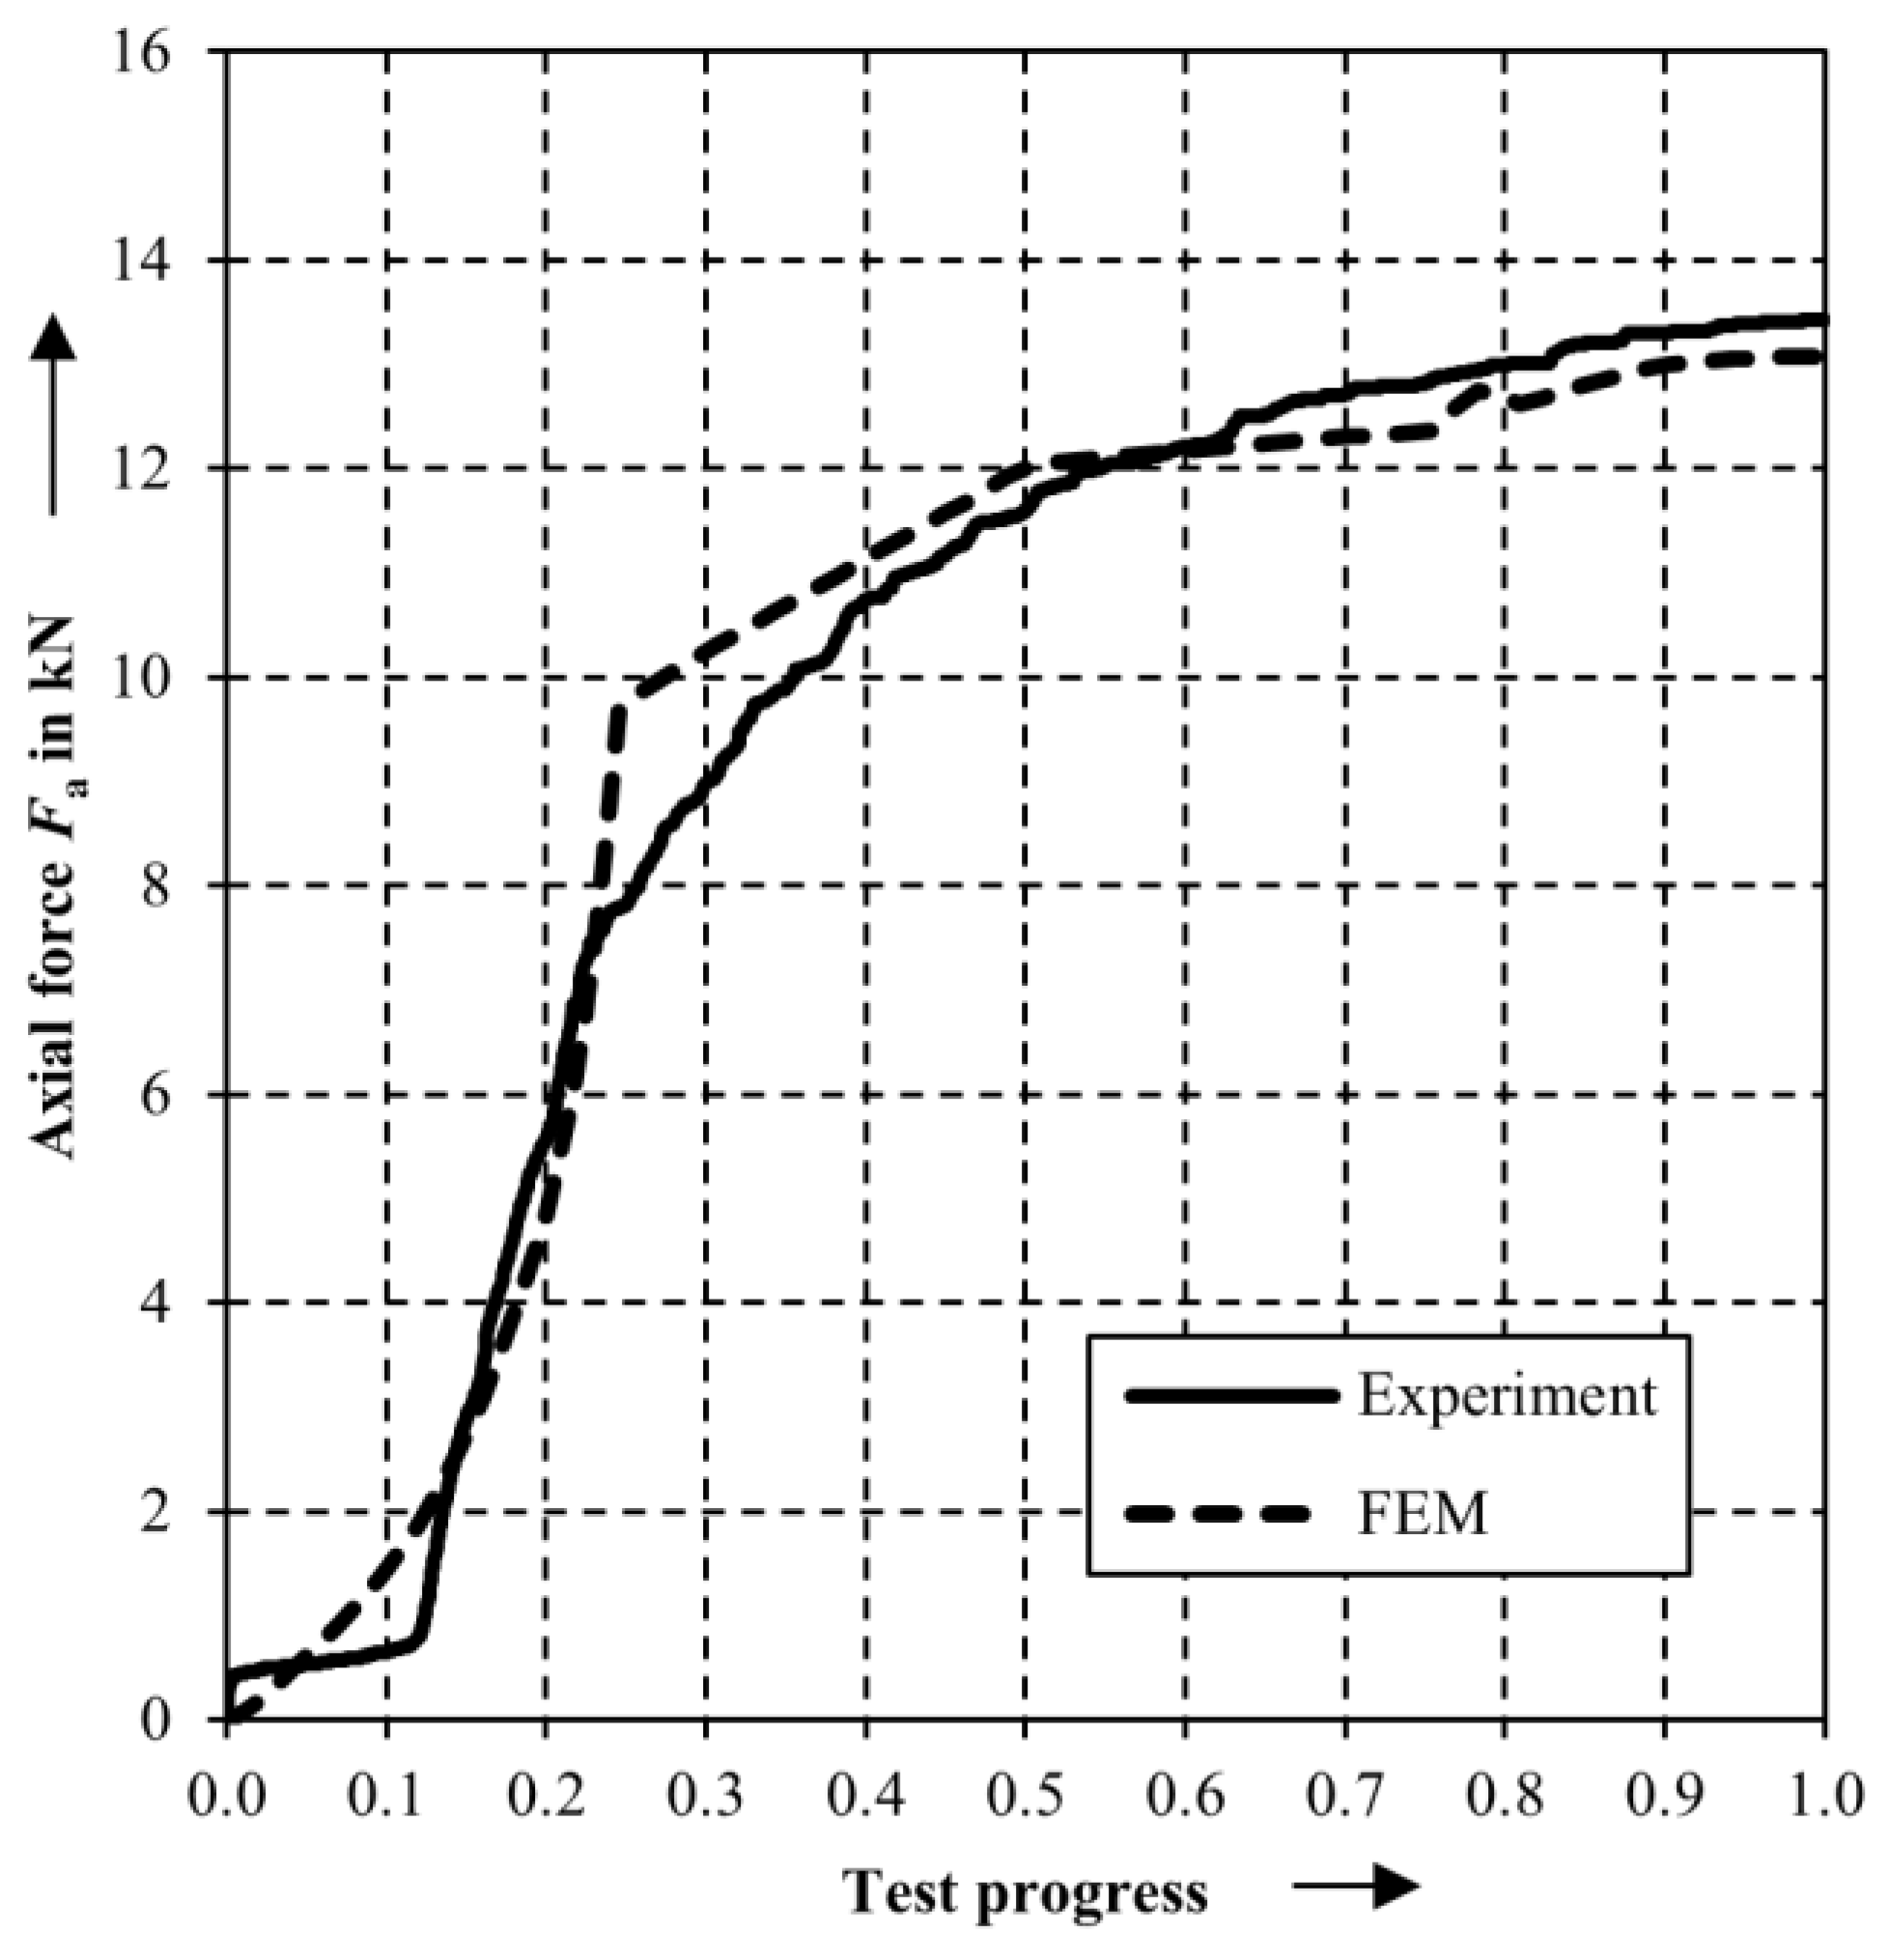
The experiment shows a corresponding behavior to the simulated actuators (
Figure 9). As in the simulation, a complete test cycle lasts 1500 s. Compared to the simulation, the actuator with the cylinder
dc = 22.5 mm shows a delayed increase in axial force in the experiment until reaching test progress 0.11. After the steep increase, the axial force shows an inflection point as predicted, whereas the inflection point is not as explicit as in the simulation. After the inflection point, the axial force trends to its maximum.
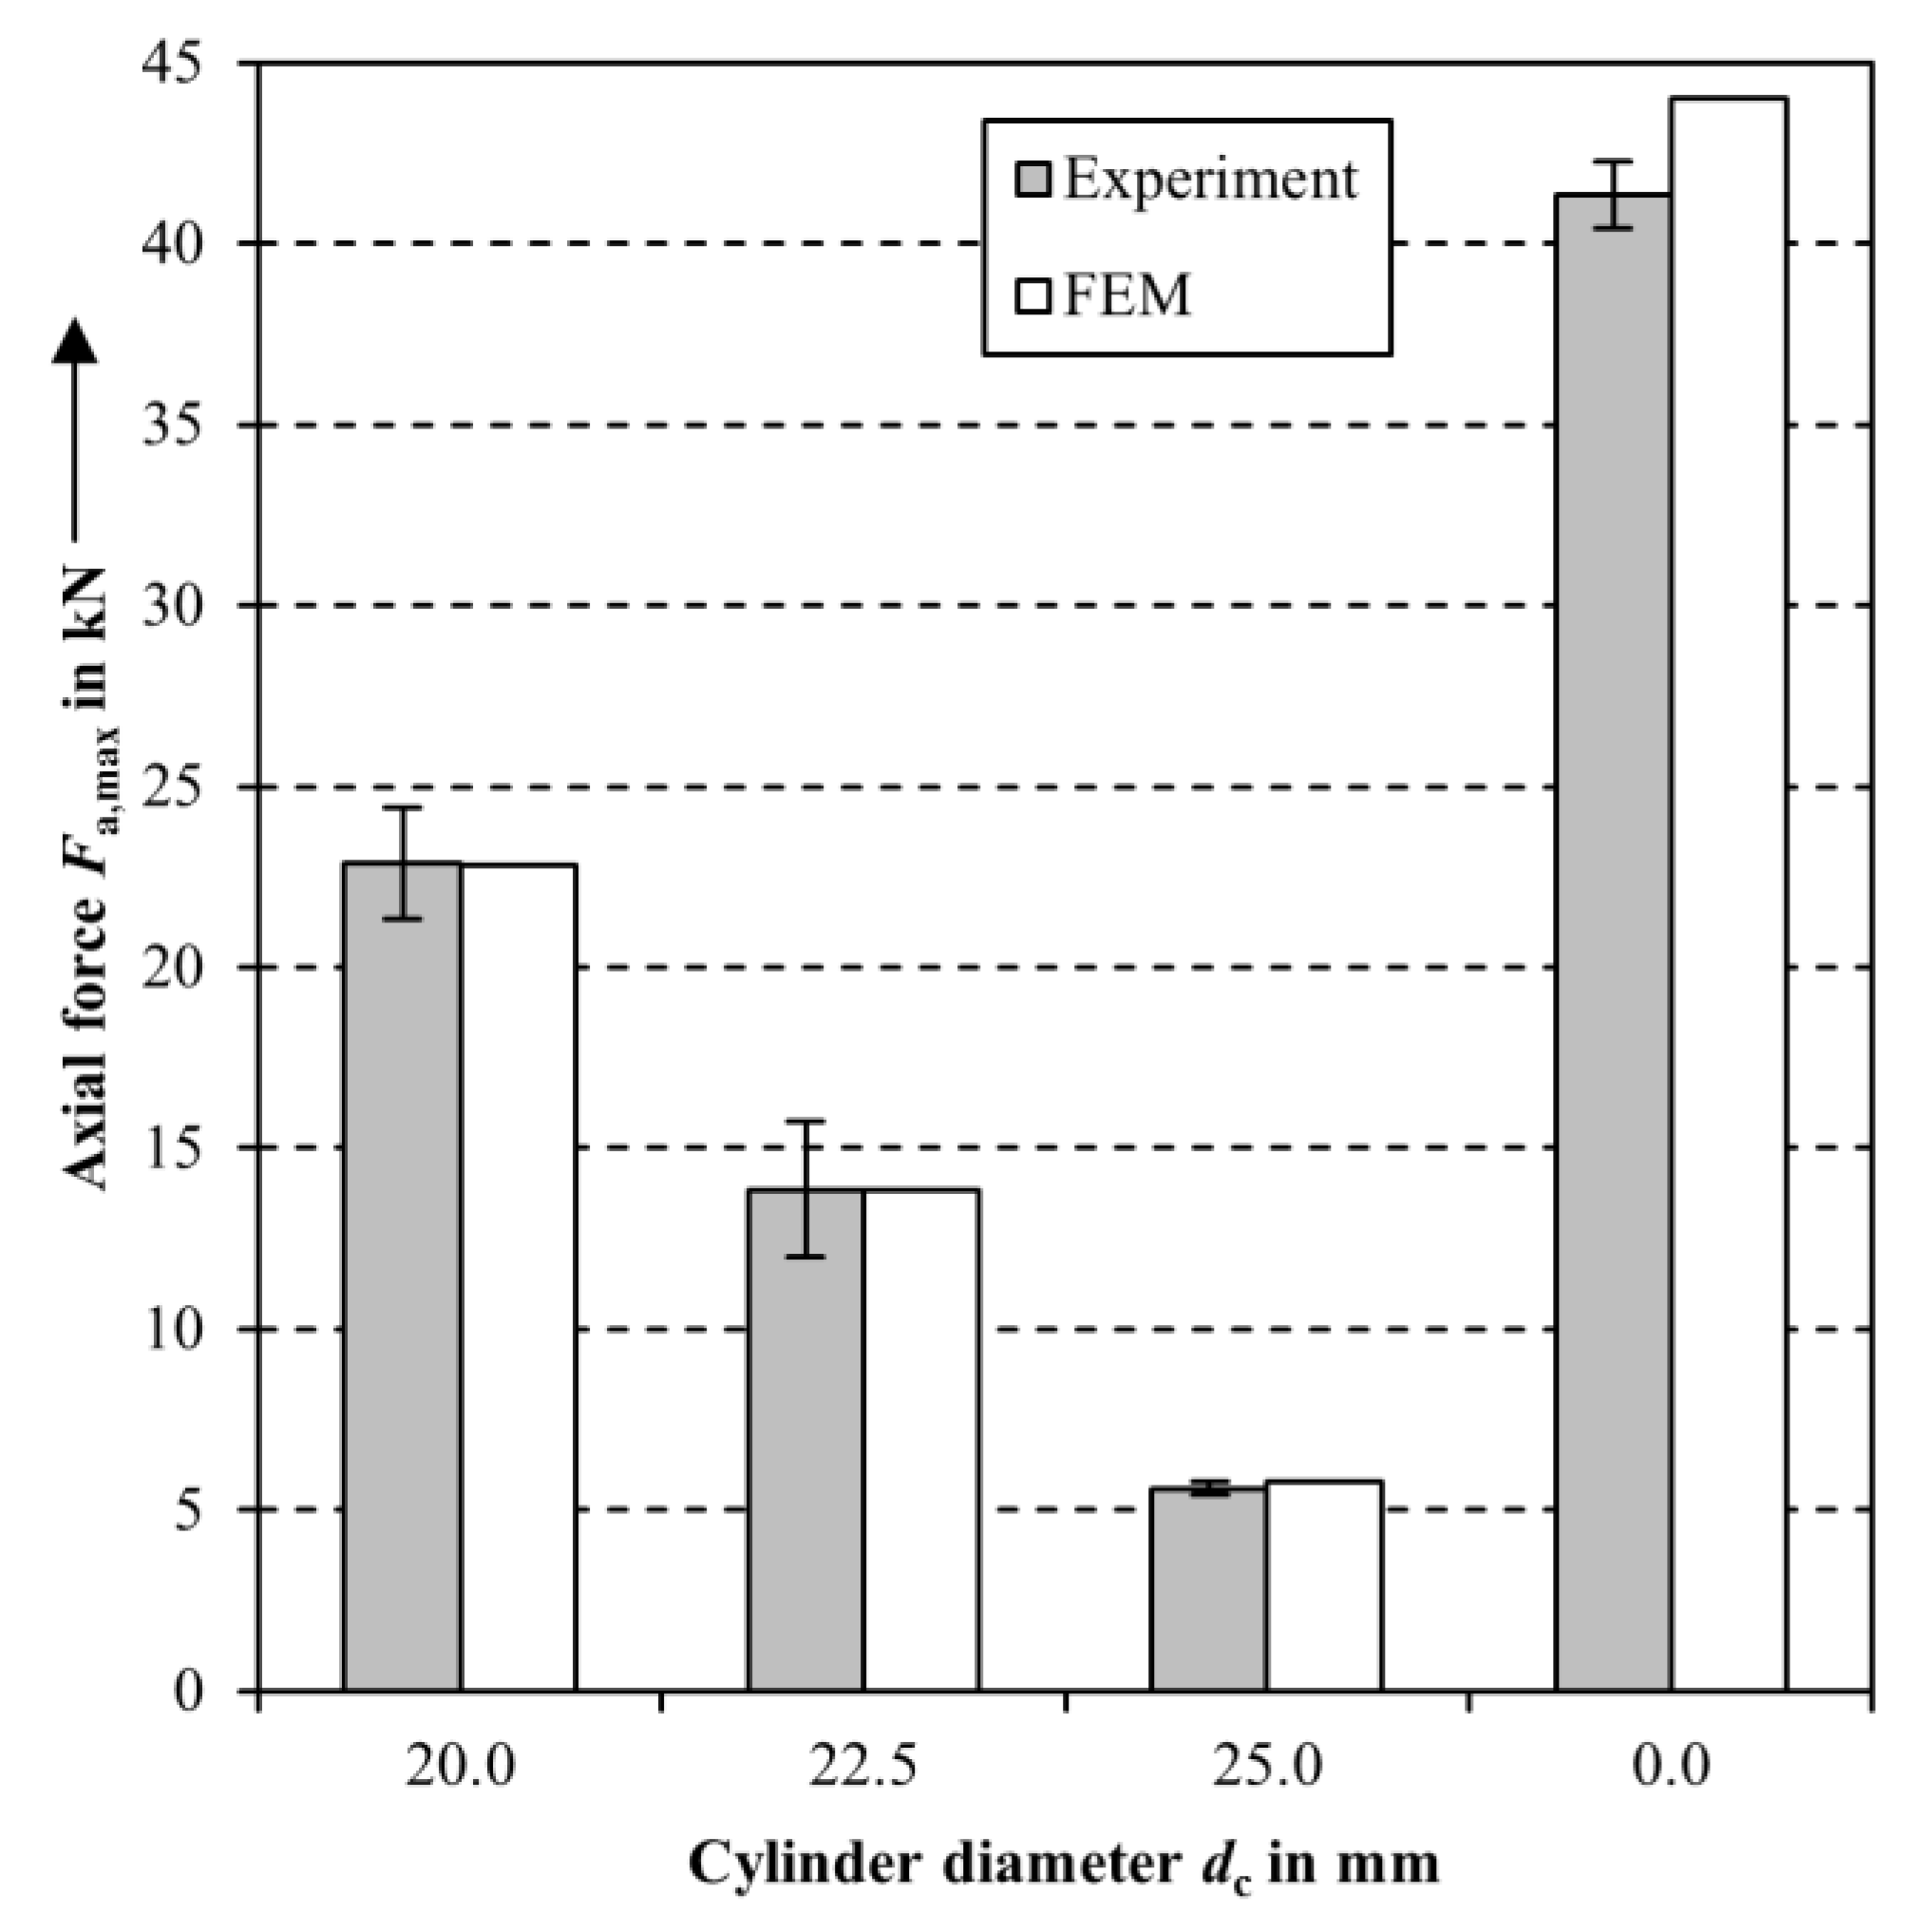
Figure 10 shows the maximum axial force
Fa,max taken from the experiment and the simulation for actuators with different integrated cylinders of the size
dc = 20.0 mm, 22.5 mm, 25.0 mm, and for actuators without cylinder. With increasing cylinder diameter
dc and a resulting declining paraffin volume, the maximal axial force
Fa,max decreases. The actuator with the cylinder diameter
dc = 20.0 mm acquires an average maximum force
Fa,max = 22.9 kN. The actuator with the cylinder diameter
dc = 22.5 mm reaches
Fa,max = 13.8 kN and
dc = 25.0 mm results in
Fa,max = 5.6 kN at the target temperature
θt = 90 °C. The actuator without cylinder reaches an average maximum force
Fa,max = 41.4 kN at the target temperature
θt = 70 °C. The simulated maximum forces correspond with the experimental data, in which the standard deviation for the cylinder diameters
dc = 22.5 mm and
dc = 20.0 mm seem to be high. The deviation in maximum force for the actuator without cylinder is 2.7 kN and is therefore about 6%.
The root cause for the deviations may be the variation in the manufacturing process. Especially the paraffin wax filling and the laser welding process must be investigated more detail. In summary, the calculated temperature distribution and actuator forces by simulation correspond well with the experimental data. The issued paraffin wax model can predict the behavior of a closed paraffin wax actuator.
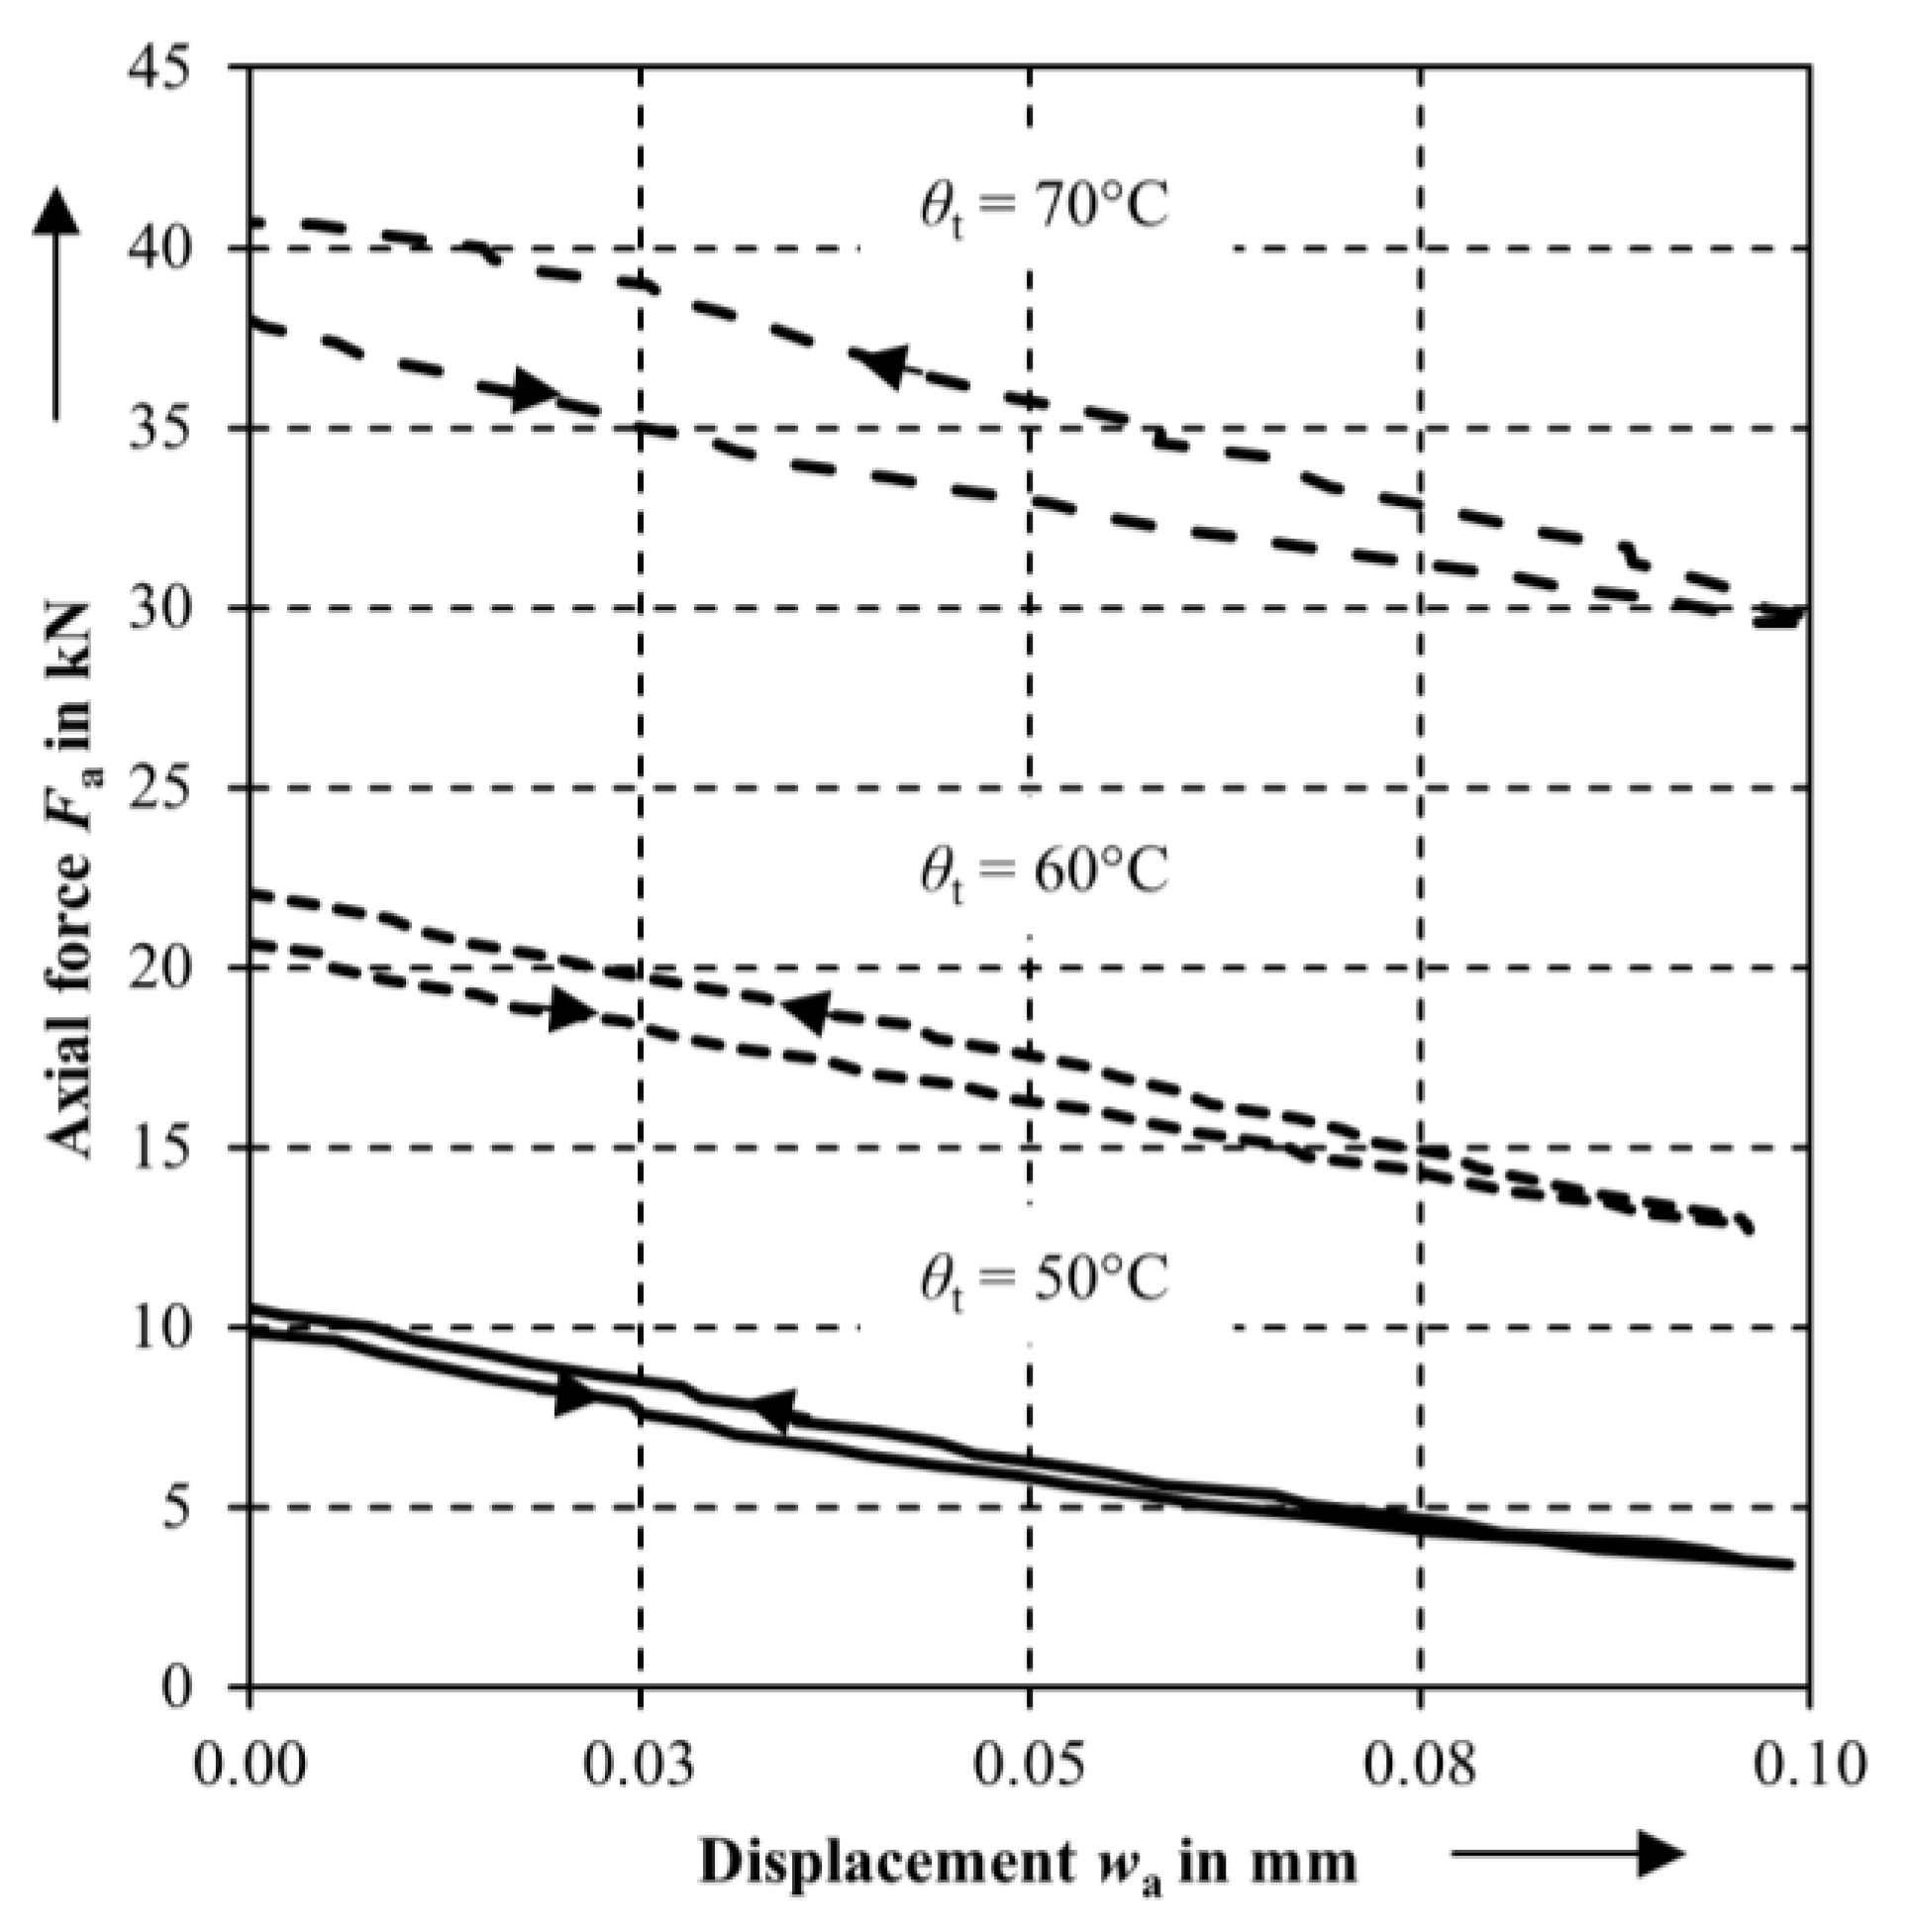
For the actuator without cylinder,
Figure 11 shows the axial forces over the displacements for the temperatures
θt = 50 °C, 60 °C, and 70 °C. The data is recorded after heating the actuator for 1200 s. After the heating, the compression test machine initiates a displacement of
wa = 0.1 mm of the compression pad with 0.01 mm/s followed by a change in direction and returning to the initial displacement
wa = 0.0 mm. For the tested temperatures, the axial force is decreasing with increasing displacement. The correlation between displacement and axial force seems to be linear. Furthermore, the axial force increases after returning to the displacement
wa = 0.0 mm. The actuator shows hysteresis behaviour. The descents in axial force for the displacements
wa = 0.0 mm compared to
wa = 0.1 mm are 7.1 kN for
θt = 50 °C, 9.5 kN for
θt = 60 °C, and 11.1 kN for
θt = 70 °C.
The maximum axial force declines to 32.4% for θt = 50 °C, 57.2% for θt = 60 °C, and 72.6% for θt = 70 °C in relation to the maximum axial force. The decrease in axial force with increasing displacement is increasing with higher temperatures, but in relation to the initial maximum force it is decreasing. The shown actuator design seems appropriate for acting in resilient production processes and other applications.


